Embed Size (px)
Citation preview

ASHENDEN WIND TURBINE TRIAL: PHASE II PROGRESS REPORT

PROJECT TEAM
London Borough of Southwark: Tony Moseley, Assistant Director: Sustainability and Infrastructure; Client; data dissemination.
Brian Dunlop Associates and Gas Dynamics Ltd: Planning application; technical co-ordination; instrumentation selection; commissioning; data acquisition software; quality assurance and data processing.
London South Bank University: Prof. Tony Day, Dr. Steve Dance and students. Acoustic and vibration monitoring; analysis and reporting; wind and energy monitoring research programme.
KCCC Ltd: Site survey; design and construction of footings and mounting frame; installation of anemometer mast.
Photon Ltd: Lead installer – construction programme; site manager; turbine assembly; erection and electrical installation

CONTENTS
Introduction
Background
Trial objectives
Target site description
Target site yield predictions
Installation
Results
Yield
Anemometry
Power Curve
Carbon abatement costs
Noise and vibration results

INTRODUCTION
The purpose of this pilot wind turbine installation is to assess the viability of deploying small scale roof top turbines across the Elephant and Castle core development area with a view to generating a significant proportion of the Mayor's 20% renewable energy requirement.
The project has been split into two phases.
In the first phase, we erected and monitored a Proven 6kW horizontal axis turbine on the roof of Ashenden House. We found wind speeds to be less than predicted, however there were no noise or vibration impacts and the project was well received by local residents.(A powerpoint presentation containing the analysis of Phase 1 data is
available at http://www.elephantandcastle.org.uk/windturbinetrial/)
In this second phase, we have relocated the Proven 6kW turbine further along the roof and erected a QR5 vertical axis turbine in its place.
The turbines are monitored from a vacant flat directly below the QR5.

TIMELINEPlanning
Planning permission was granted in December 2006. The following files can be downloaded from the website:
• Planning application supporting documentation
• Conditions attached to planning consent
Roofworks
Carried out during March/ April 2007. Construction of concrete footings/ making good roof membrane. Design and fabrication of steel mounting frames.
Turbine Trial
The trial is being conducted in two phases.
Phase 1 (June 2007 – June 2008): COMPLETED
Install the Proven WT6000 turbine above a vacant flat. Monitor wind speed, turbine power, noise and vibration. Analyse data, discharge planning conditions and release preliminary results. A series of photographs documenting the full construction/ turbine erection sequence can be downloaded from the website (see http://www.elephantandcastle.org.uk/windturbinetrial/).
Phase 2 (June 2008 – June 2009): COMPLETED
Relocate the Proven turbine above an occupied flat to make way for the installation of the Quiet Revolution QR5 turbine. Ongoing monitoring of wind speed, power output from both turbines, noise and vibration emanating from the QR5 turbine. Analyse data and release final results.

TEST SITE DESCRIPTION
Phase I
Proven 6kW horizontal axis turbine erected above vacant flat
Anemometer erected circa 10m east of turbine hub
Phase II
Proven 6kW turbine relocated to new position above an occupied flat
QR5 vertical axis turbine erected above vacant flat

TURBINE DESCRIPTION – QR5
QR5 rated at 6.2kW (DC) with a wind speed of 14 m/s 1
Cut-in wind speed of 4.5 m/s 1
Rotor diameter = 3.1m, height 5m
1 http://www.quietrevolution.co.uk/factsheets.php
AC Power curve not presented.
0 2 4 6 8 10 12 14 160
1000
2000
3000
4000
5000
6000
7000
8000
V (m/s)
P (W
)
DC power
Aerodynamic power

MOUNTING FRAME

CONSTRUCTION SEQUENCE – QR5
1 2 3 4
5 6 7 8 9
10
11
12 13 14
15 16 17 18 19

INSTALLATION COSTS
Roof works(exclusive of VAT) Common
Crane Hire (one visits) £2,150.00
Handrail £8,593.46
Plinths £6,766.48
Sarnafil roofing £6,771.11
Lightning protection £998.89
Walkway £1057.50
Total £26,337.44
Turbine Installation(exclusive of VAT) Common Proven QR5
Turbine, mast, inverter, controller & delivery £19,003.91 £31,925.00
Steel mounting frames (2 nr) £10.826.36
Crane Hire (two visits) £6,336.00
Installation & commissioning £8,500.00
Meeting, site organization, health and safety £995.00
Electrical items £4,433.25
Total £20,264.25 £19,003.91 £31,925.00

INSTRUMENTATION
Anemometer: 3-axis Gill ultrasonic sensor logging continuously at 1 Hz on a PC.
Multicube multifunction current transformer (CT) meter: Instantaneous power readings logging continuously at 1 Hz on a PC.
Data analysis performed using SCILAB
Generator drive and grid inverter
CT MulticubeMeter Data
Acquisition PC
Anemometer comms interface
On-board ISKRA two way meter
Clients Distribution Board
Control Computer
Main Isolator

5%
10%
15%
20%
25%0
30
60
90
120
150
180
210
240
270
300
330
0 < V (knots) < 4
4 < V (knots) < 8
8 < V (knots) < 12
12 < V (knots) < 16
16 < V (knots)
RESULTS - ANEMOMETRY
Wind rose and wind speed distribution evaluated from data collected between June 2008 and May 2009. Distribution based on hourly averages.
Average wind speed of 3.64 m/s, is slightly less than the previous year’s value of 3.82m/s. Shape parameter, k, of 2.4 also higher than the previous value of 2.24.
Note: monthly distributions for the test site are available to download from the Elephant and Castle website
Vmean = 7.1knots
A = 7.9knots, k = 2.41
0 2 4 6 8 10 12 14 16 18 200.00
0.02
0.04
0.06
0.08
0.10
0.12
0.14
0.16
0.18
Wind speed, knots
Pro
babi
lity
Note: Red curve is Weibull fit to current year’s data; green curve is distribution in the year June 2007 to May 2008.

RESULTS - ANEMOMETRY
Wind rose comparison between the test site at Ashenden (left) and Heathrow (right).
Note: monthly wind roses for the test site are available to download from the Elephant and Castle website
Jul 09
Jun 09
AnnualData
Heathrow Short TermAshenden House
5%
10%
15%
20%
25%0
30
60
90
120
150
180
210
240
270
300
330
0 < V (knots) < 4
4 < V (knots) < 8
8 < V (knots) < 12
12 < V (knots) < 16
16 < V (knots)
5%
10%
15%
20%030
60
90
120
150180
210
240
270
300
330
0 < V (knots) < 4
4 < V (knots) < 8
8 < V (knots) < 12
12 < V (knots) < 16
16 < V (knots)
5%
10%
15%
20%
25%0
30
60
90
120
150
180
210
240
270
300
330
0 < V (knots) < 4
4 < V (knots) < 8
8 < V (knots) < 12
12 < V (knots) < 16
16 < V (knots)
5%
10%
15%
20%
25%0
30
60
90
120
150180
210
240
270
300
330
0 < V (knots) < 4
4 < V (knots) < 8
8 < V (knots) < 12
12 < V (knots) < 16
16 < V (knots)
5%
10%
15%
20%
25%
30%0
30
60
90
120
150
180
210
240
270
300
330
0 < V (knots) < 4
4 < V (knots) < 8
8 < V (knots) < 12
12 < V (knots) < 16
16 < V (knots)
5%
10%
15%
20%030
60
90
120
150180
210
240
270
300
330
0 < V (knots) < 4
4 < V (knots) < 8
8 < V (knots) < 12
12 < V (knots) < 16
16 < V (knots)

RESULTS – QR5 AVAILABILITY & OPERATIONAL RESTRICTIONS
Prior to the product upgrade in February 2009, the turbine speed was capped and the turbine suffered from an overly sensitive vibration safety switch. This resulted in the turbine being unavailable approximately 36% of the time up till 24th February 2009 (red regions). This has impacted the net energy balance.
11/Jul 30/Aug 19/Oct 8/Dec 27/Jan 18/Mar0123456789
1011
time
v (m
/s)
11/Jul 30/Aug 19/Oct 8/Dec 27/Jan 18/Mar-400
-200
0
200
400
600
800
1000
time
Pow
er (W
)
16/Feb 8/Mar 28/Mar 17/Apr 7/May 27/May 16/Jun0
50100150200250
300350400450
time
Ener
gy u
sed
(kW
h)
16/Feb 8/Mar 28/Mar 17/Apr 7/May 27/May 16/Jun20
40
60
80
100
120
140
160
timeE
nerg
y pr
oduc
ed (k
Wh)
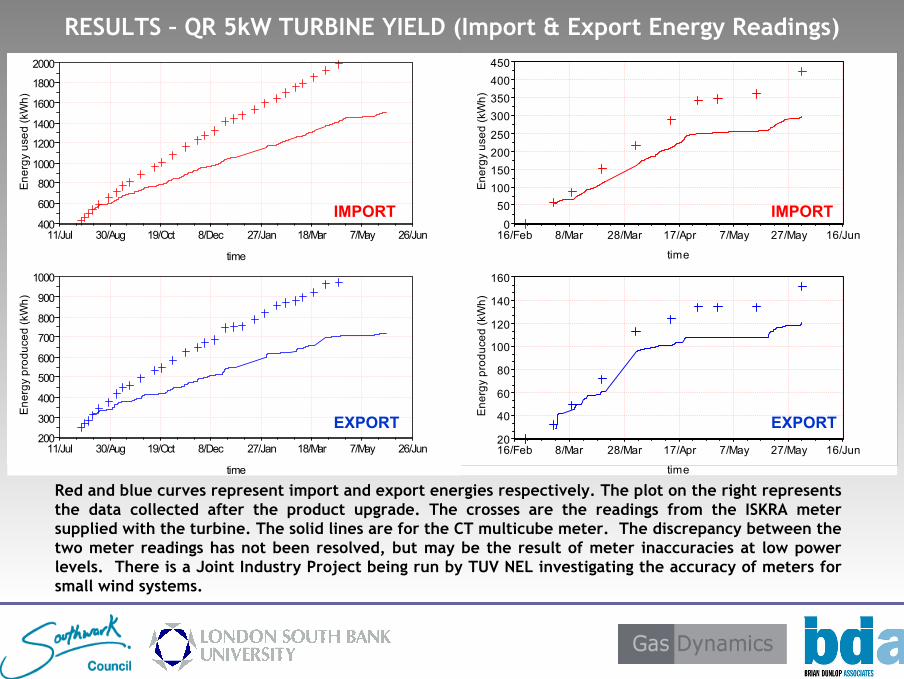
RESULTS – QR 5kW TURBINE YIELD (Import & Export Energy Readings)
Red and blue curves represent import and export energies respectively. The plot on the right represents the data collected after the product upgrade. The crosses are the readings from the ISKRA meter supplied with the turbine. The solid lines are for the CT multicube meter. The discrepancy between the two meter readings has not been resolved, but may be the result of meter inaccuracies at low power levels. There is a Joint Industry Project being run by TUV NEL investigating the accuracy of meters for small wind systems.
11/Jul 30/Aug 19/Oct 8/Dec 27/Jan 18/Mar 7/May 26/Jun400
600
800
1000
1200
1400
1600
1800
2000
time
Ene
rgy
used
(kW
h)
11/Jul 30/Aug 19/Oct 8/Dec 27/Jan 18/Mar 7/May 26/Jun200
300
400
500
600
700
800
900
1000
time
Ene
rgy
prod
uced
(kW
h)
IMPORT
EXPORT
IMPORT
EXPORT

RESULTS – QR5 POWER CURVE
One minute average data
Black dots denote 1 minute average raw power data measured at the CT multicube meter (during periods of turbine availability and after turbine upgrade in February 2009).
The green curve is fitted to the raw data; showing net power output for wind speeds above 6m/s.
For comparison, manufacturer’s data has been included:
The blue curve is aerodynamic power1
The red curve is DC power prior to inverter1
1 http://www.quietrevolution.co.uk/factsheets.php
0 2 4 6 8 10 12-1000
-500
0
500
1000
1500
2000
2500
3000
3500
Wind speed, m/s
Pow
er (W
)

Noise and Vibration assessment
Major source of noise at Ashenden House is the A2 road. The location is in central London and as such
even in the middle of the night there are significant levels of noise.
A Flat Bedroom (inside)B Flat balcony (outside)C Roof topD By the road sideE Garages behind target buildingF 85m behind target building

Turbine noise levels 11m from turbine
5minute equivalent noise levels presented as a function of wind speed over a three-day (72 hour)
period from 8th - 11th January 2009.
There appears to be some correlation with wind speed, although further data is required to
establish noise levels at higher wind speeds.

Turbine noise levels in flat below turbine
5minute equivalent noise levels presented as a function of wind speed over a seven-day period
from 11th - 17th September 2008. (Solid squares excluded from the analysis as it results from
cooling fans on the QR generator drive unit, which are very noisy)
There appears to be some correlation with wind speed, but it should be noted that the flat’s
window was ajar. Further data is required to establish noise levels at higher wind speeds.
0 1 2 3 4 5 6 7 840
45
50
55
60
65
70
75
80
V(m/s)
LAeq
(dB
)

Vibration levels in flat below turbine
Levels of vibration in the flat immediately below the turbine were well below that known to cause
nuisance or discomfort. The turbine’s control panel dominates the vibration measured in the flat
in the X, Y and Z directions. Furthermore they did not show any correlation to wind speed.
0 20 40 60 80 100 120 140 160 180012345678
t (hr)
v (m
/s)
0 20 40 60 80 100 120 140 160 1800.0000.0020.0040.0060.0080.0100.0120.0140.0160.0180.020
t (hr)
VD
V (m
/s^1
.75)
0 1 2 3 4 5 6 7 80.000
0.002
0.004
0.006
0.008
0.010
0.012
0.014
0.016
0.018
0.020
v (m/s)
VD
V (m
/s^1
.75)

PHASE II CONCLUSIONS
Prior to the product upgrade in February 2009, the turbine speed (rpm) was capped and the turbine suffered from an overly sensitive vibration safety switch. This resulted in the turbine being unavailable for approximately 36% of the time up till February 2009. This has impacted the cumulative net energy balance.
However, from 24th February onwards, the period during which the QR5 turbine was fully operational, it still consumed more power than it produced.
No measurable impact on noise levels both externally and within the flat due to operation of the QR5 turbine
Vibration levels within the flat are well below the comfort criteria for 24hr working.
Residents supportive of the project. No adverse reaction from occupants or members of the public to date.
NOTE: The average measured wind speed in the period from February 2009 to May 2009 was 3.65 m/s. Mean annual recorded wind speed for the test site for the period June 2008 to May 2009 was 3.64 m/s. Mean annual recorded wind speed at Heathrow at a height of 10m for the same period was 4.42 m/s(the long term average for Heathrow being 4.0 m/s).
The manufacturer’s power curve was released post-June 2008 i.e. after the QR5 had been procured and installed. Quiet Revolution now advise that the QR5 turbine is only installed at locations where the mean annual wind speed is in excess of 5 m/s.