Embed Size (px)
Citation preview
8/6/2019 Asgn2 MultVarStats Jul 10
http://slidepdf.com/reader/full/asgn2-multvarstats-jul-10 1/4
Multivariate Statistics- Special Lecture: Assignment 2
July2010
The assignment has to be completed using STATA version 10.0 or above.
The assignment has to be done in groups of 3-4 students and submitted latest by 9th
August (5 pm). Late submissions will not be accepted.
From the file hhld_new_9.dta each group has to pick up one state. The STATA
command (keep if hv024==1) selects the state with code=1 that is the state of J&K for your
assignment. The state codes are available in the file state codes.doc.
The submitted assignment should include (i) the word file presenting the main results
including figures along with discussions; (ii) the STATA do file and (iii) the STATA log/output
file or the smcl file. Please DO NOT submit a hard copy of the assignment and email this entire
set to my gmail address: [email protected]. Kindly indicate the group members in the word
file clearly.
All the members in a group will be given same marks but I will hold the discretion to call
a group and have a separate session with them.
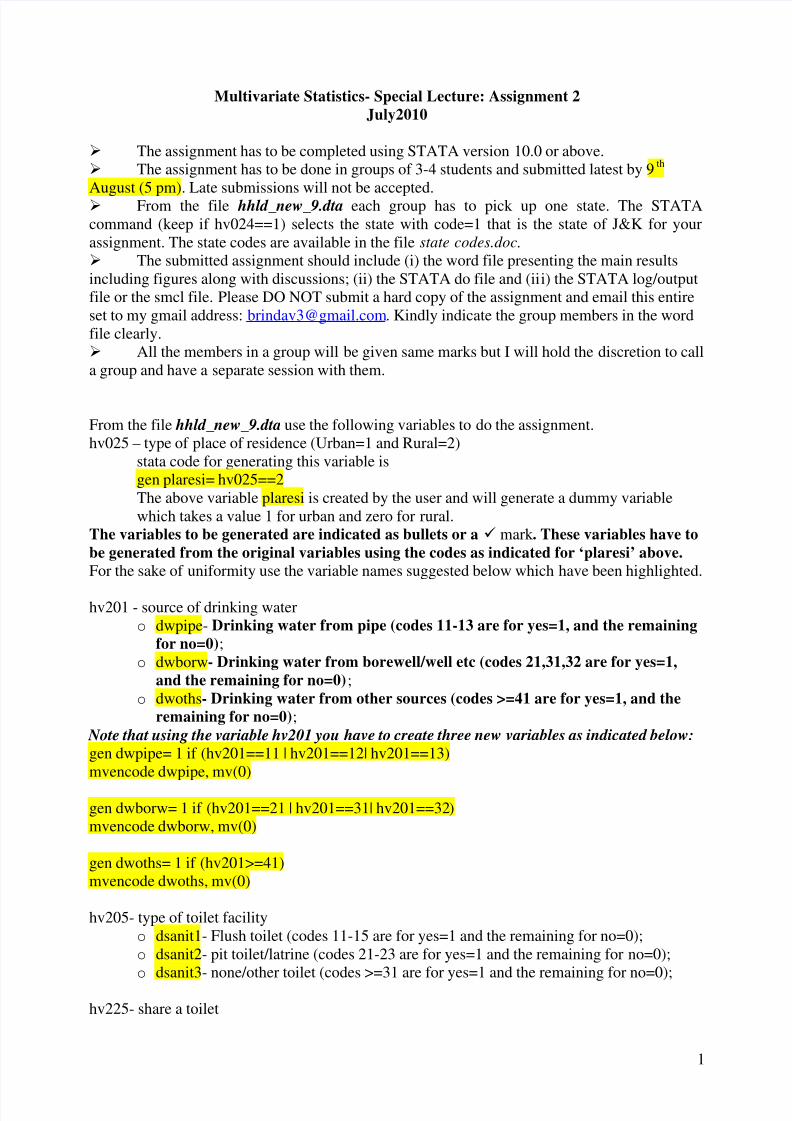
From the file hhld_new_9.dta use the following variables to do the assignment.
hv025 – type of place of residence (Urban=1 and Rural=2)
stata code for generating this variable is
gen plaresi= hv025==2
The above variable plaresi is created by the user and will generate a dummy variable
which takes a value 1 for urban and zero for rural.
The variables to be generated are indicated as bullets or a mark . These variables have to
be generated from the original variables using the codes as indicated for ‘plaresi’ above.
For the sake of uniformity use the variable names suggested below which have been highlighted.
hv201 - source of drinking water
o dwpipe- Drinking water from pipe (codes 11-13 are for yes=1, and the remaining
for no=0);
o dwborw- Drinking water from borewell/well etc (codes 21,31,32 are for yes=1,
and the remaining for no=0);
o dwoths- Drinking water from other sources (codes >=41 are for yes=1, and the
remaining for no=0);
Note that using the variable hv201 you have to create three new variables as indicated below:
gen dwpipe= 1 if (hv201==11 | hv201==12| hv201==13)
mvencode dwpipe, mv(0)
gen dwborw= 1 if (hv201==21 | hv201==31| hv201==32)
mvencode dwborw, mv(0)
gen dwoths= 1 if (hv201>=41)
mvencode dwoths, mv(0)
hv205- type of toilet facility
o dsanit1- Flush toilet (codes 11-15 are for yes=1 and the remaining for no=0);
o dsanit2- pit toilet/latrine (codes 21-23 are for yes=1 and the remaining for no=0);
o dsanit3- none/other toilet (codes >=31 are for yes=1 and the remaining for no=0);
hv225- share a toilet
1
8/6/2019 Asgn2 MultVarStats Jul 10
http://slidepdf.com/reader/full/asgn2-multvarstats-jul-10 2/4
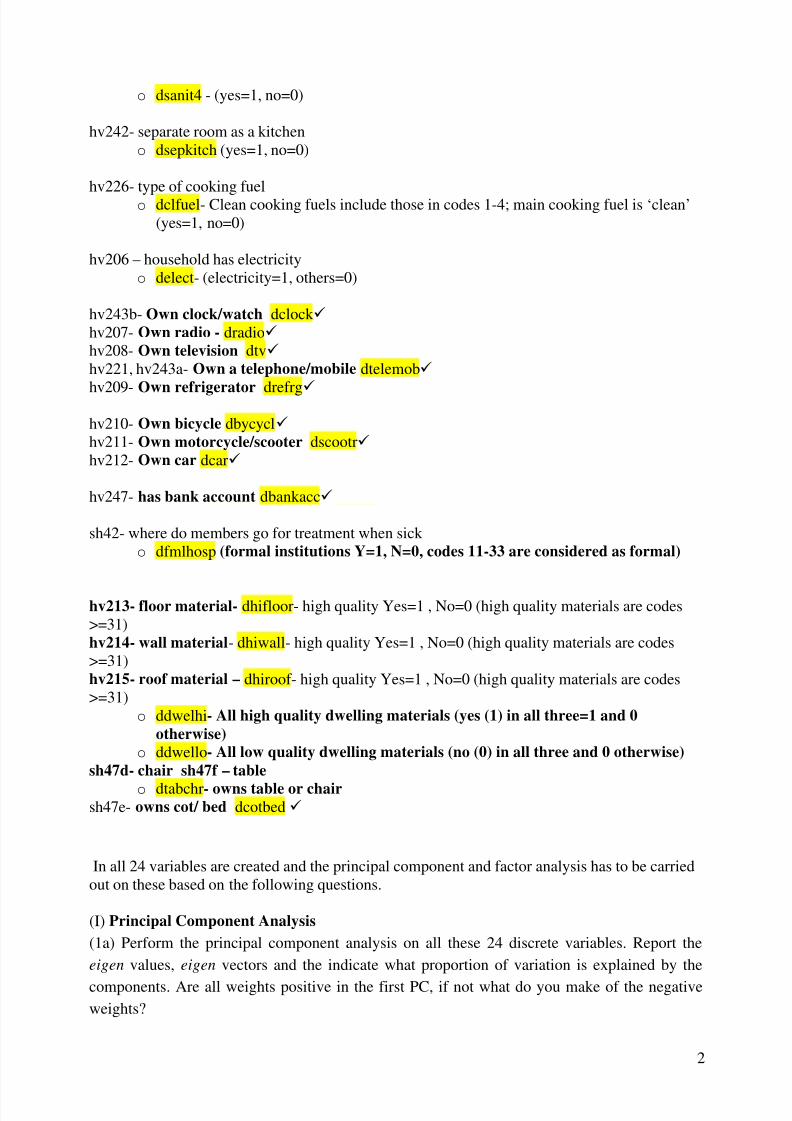
o dsanit4 - (yes=1, no=0)
hv242- separate room as a kitchen
o dsepkitch (yes=1, no=0)
hv226- type of cooking fuel
o dclfuel- Clean cooking fuels include those in codes 1-4; main cooking fuel is ‘clean’
(yes=1, no=0)
hv206 – household has electricity
o delect- (electricity=1, others=0)
hv243b- Own clock/watch dclock
hv207- Own radio - dradio
hv208- Own television dtv
hv221, hv243a- Own a telephone/mobile dtelemob
hv209- Own refrigerator drefrg
hv210- Own bicycle dbycycl
hv211- Own motorcycle/scooter dscootr
hv212- Own car dcar
hv247- has bank account dbankacc
sh42- where do members go for treatment when sick
o dfmlhosp (formal institutions Y=1, N=0, codes 11-33 are considered as formal)
hv213- floor material- dhifloor- high quality Yes=1 , No=0 (high quality materials are codes
>=31)
hv214- wall material- dhiwall- high quality Yes=1 , No=0 (high quality materials are codes
>=31)
hv215- roof material – dhiroof- high quality Yes=1 , No=0 (high quality materials are codes
>=31)
o ddwelhi- All high quality dwelling materials (yes (1) in all three=1 and 0
otherwise)
o ddwello- All low quality dwelling materials (no (0) in all three and 0 otherwise)
sh47d- chair sh47f – table
o dtabchr- owns table or chairsh47e- owns cot/ bed dcotbed
In all 24 variables are created and the principal component and factor analysis has to be carried
out on these based on the following questions.
(I) Principal Component Analysis
(1a) Perform the principal component analysis on all these 24 discrete variables. Report the
eigen values, eigen vectors and the indicate what proportion of variation is explained by the
components. Are all weights positive in the first PC, if not what do you make of the negative
weights?
2
8/6/2019 Asgn2 MultVarStats Jul 10
http://slidepdf.com/reader/full/asgn2-multvarstats-jul-10 3/4
(1b) Now choose about 12 variables from this 24 based on the magnitude of the weights in the
first principal component. That is, those with very small weights are to be taken off and with
comparatively larger weights are to be retained. Alternatively you can choose a set of 12
variables in certain logical sense and after substantiating the choice complete the following.
Redo the same exercise of PCA and indicate what proportion of variation is explained by these
new set of components.
(2) On what basis will you decide how many components to retain? After deciding on the
number of components to retain, try and interpret those components.
(3) Obtain the predicted value of the first principal component and call it pca1. Which are the
variables that have large weights in the first component? Which variables are more correlated
with pca1? Discuss your findings in brief.
(4) How would you like to interpret the first principal component? Obtain the mean and standard
deviation of pca1 for the state as a whole using the following STATA command.
table state, c(m pca1 sd pca1)
(5) Further obtain the mean and standard deviation of pca1 for those households which have a
value 1 in all the ( X ) variables. Note that for drinking water source and sanitation you choose
only the first variable dwpipe and dsanit1 respectively; the other two categories are not to be
considered (any reason why?).
How would you like to characterize such households? How do the mean values of pca1 compare
between this and the overall mean for the state.
(6) Now get the mean and standard deviation of pca1 for the following categories.
Place of residence- Rural and urban households separately,
Religion- Hindus, Muslims and other religions separately
Caste- SC/ST, OBC and Others separately.
What do you infer from the mean and standard deviation values of pca1 across the groups
mentioned in each of the case?
STATA command for the rural/urban case would be as follows:
table plaresi, c(m pca1 sd pca1)
Similarly it can be estimated for other two cases as well. Note that religion and caste variable are
available in the data.
(II) Factor Analysis (Retain three factors as and when possible or else retain two factors)
(1a) Perform the factor analysis using Principal Component method for the same data and
interpret the first two factors to the extent possible. Report the communalities and specific
variances for the first two factors along with the other necessary results.
(1b) Rotate the factors and indicate how the results change.
3
8/6/2019 Asgn2 MultVarStats Jul 10
http://slidepdf.com/reader/full/asgn2-multvarstats-jul-10 4/4
(2a) Perform the factor analysis using Maximum Likelihood Method for the same data and
interpret the first factors. Given the nature of random variables X is there a problem in using the
ML method?
(2b) Once again, rotate the factors and indicate how the results change. Compare the factors here
with that in (1b).
(3a) Notice that all the variables in X are discrete so the Pearson correlation matrix obtained
from these may not be appropriate. Alternatively these variables may be treated as latent
variables and in this case we use tetrachoric correlation when the variables ( X ) used take on only
two values that is, 1 or 0.
So we save the correlations obtained by the command ‘tetrachoric’ and then use it for factor
analysis. Note while using this option, the Rho matrix so generated should be positive definite
and the appropriate option must be used for that. Use the ‘factormat’ option to perform the factor
analysis.
(3b) How different are the factors in 1b different from that obtained here?
(3d) In the case of results in 2a and 3a one finds that the STATA output shows an LR-test result.Discuss as to what this test tries to assess by indicating the null and the alternative hypothesis.
Why is this test not reported in 1a.
Some websites to look at:
http://www.philender.com/courses/multivariate/lect.html
(Look into the section on Principal Components and Factor Analysis Models)
For a comprehensive introduction to Statahttp://www.duke.edu/~skolenik/http://www.ats.ucla.edu/stat/stata/
http://data.princeton.edu/stata/
http://dss.princeton.edu/online_help/stats_packages/stata/stata.htm
4