Embed Size (px)
DESCRIPTION
Citation preview

CASE STUDY 1:
Nutrition Labelling &
Packaging Standards
- Dr Roger Bektash
- Ms Cyndy Au
Nutrition Labelling & Packaging
Standards
Dr Roger Bektash
www.foodindustry.asia
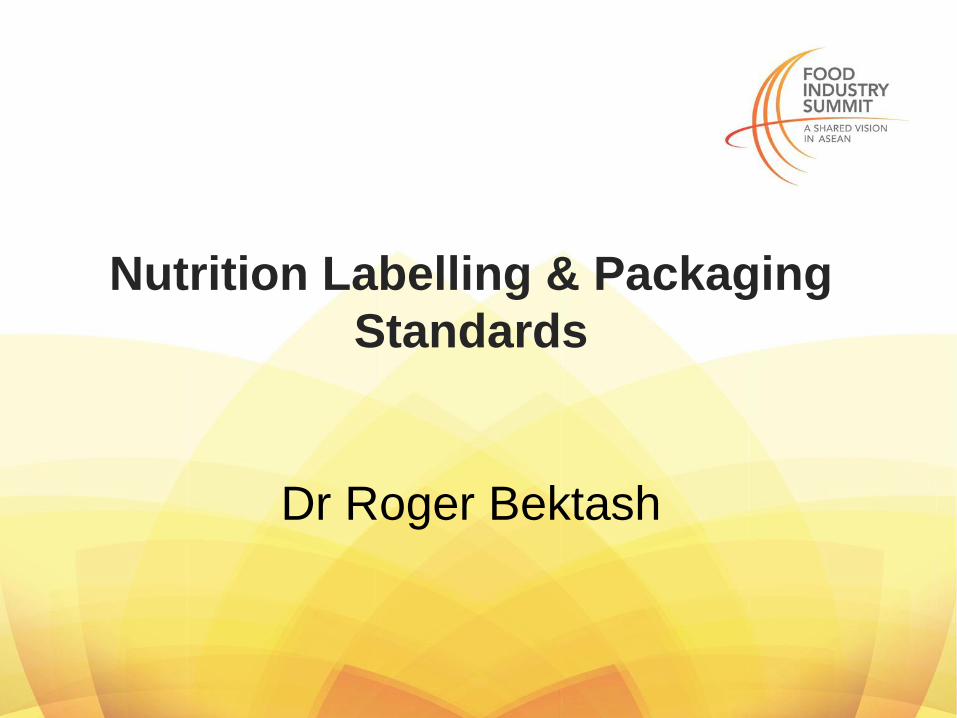
VISION FOR ASEAN
Products made for one ASEAN country can be sold in
other ASEAN countries
Efficient Supply Chain
Benefits to local & regional economy
- scale up & efficient manufacture
- increased trade
Benefits for consumers in all countries
4
What’s this got to do with Nutrition Labelling?
www.foodindustry.asia
LABELLING COMPLEXITY -
A MAJOR BARRIER
Common labelling standards are needed for
common information (as in EU)
• Unique Labelling requirements
– goes beyond local language requirements
• There are unique National formats, tolerances or
standards for the same information
• Currently dictating Individual country labels, or
complexity and limiting the information provided
5
www.foodindustry.asia
NUTRITION LABELLING
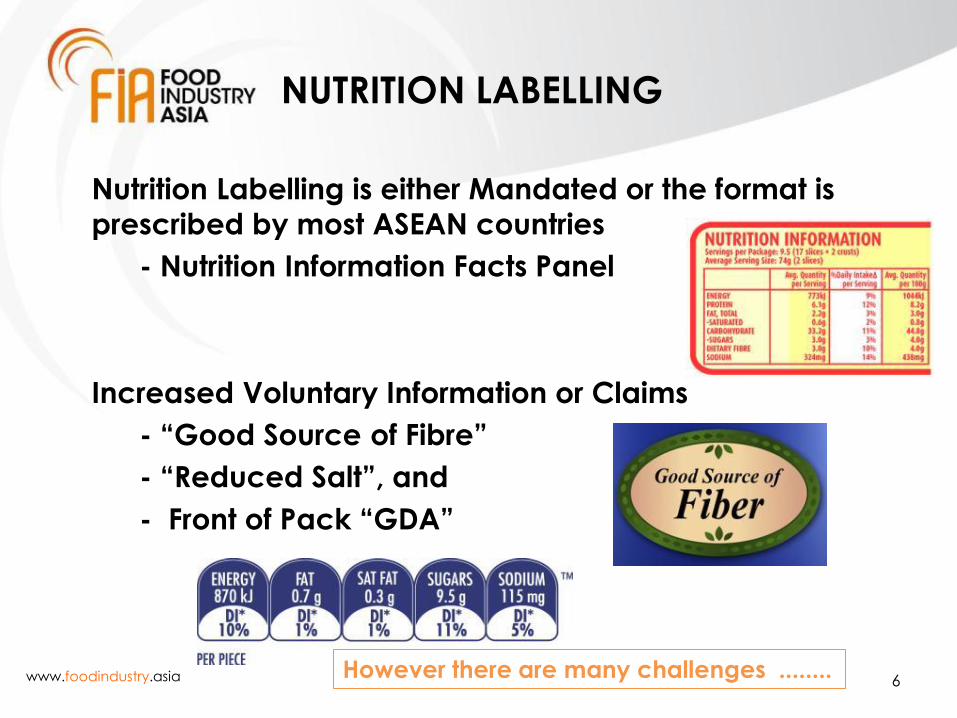
Nutrition Labelling is either Mandated or the format is
prescribed by most ASEAN countries
- Nutrition Information Facts Panel
Increased Voluntary Information or Claims
- “Good Source of Fibre”
- “Reduced Salt”, and
- Front of Pack “GDA”
6
However there are many challenges ........
www.foodindustry.asia
CHALLENGE 1
Variance in Mandatory & Voluntary requirements
• Malaysia – mandatory nutrition labelling on many
foods
• Indonesia – required on fortified foods
• Singapore – required on foods making nutrient
claims
• Philippines – the nutrition information format
requires specific measurement units
7 Confusing
www.foodindustry.asia
CHALLENGE 2
Differing min & max limits for vitamins & minerals
To meet local standards, one Singaporean
manufacturer needs to:
• Make four different formulations for the same
product to supply 8 ASEAN markets
• And have different analytical testing limits &
requirements for several markets
8
Adding Complexity & Costs
www.foodindustry.asia
CHALLENGE 3
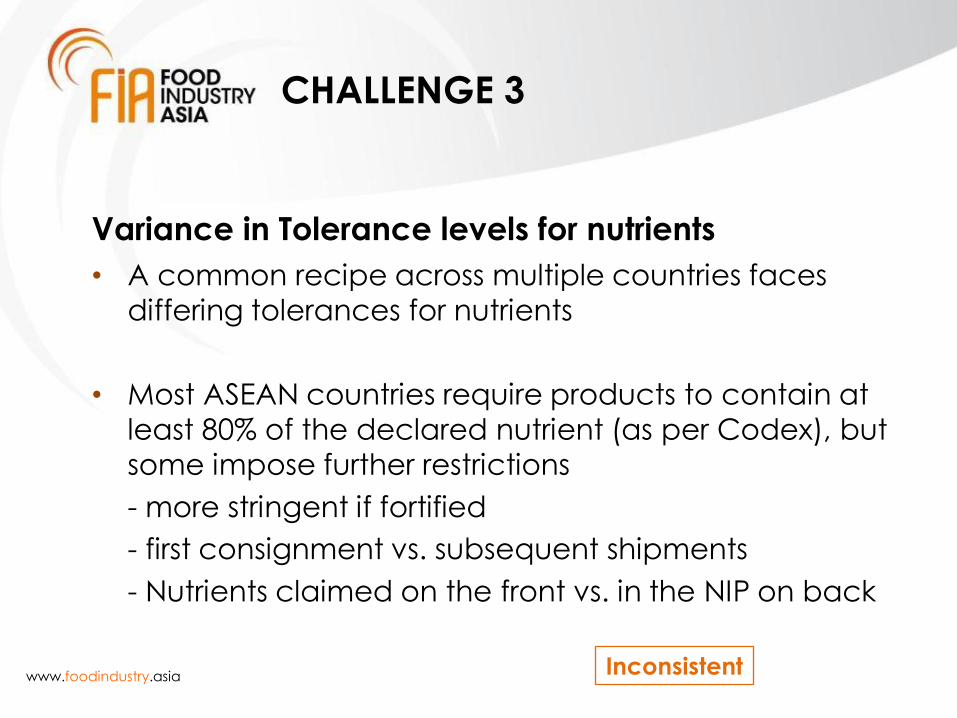
Variance in Tolerance levels for nutrients
• A common recipe across multiple countries faces
differing tolerances for nutrients
• Most ASEAN countries require products to contain at
least 80% of the declared nutrient (as per Codex), but
some impose further restrictions
- more stringent if fortified
- first consignment vs. subsequent shipments
- Nutrients claimed on the front vs. in the NIP on back
Inconsistent
www.foodindustry.asia
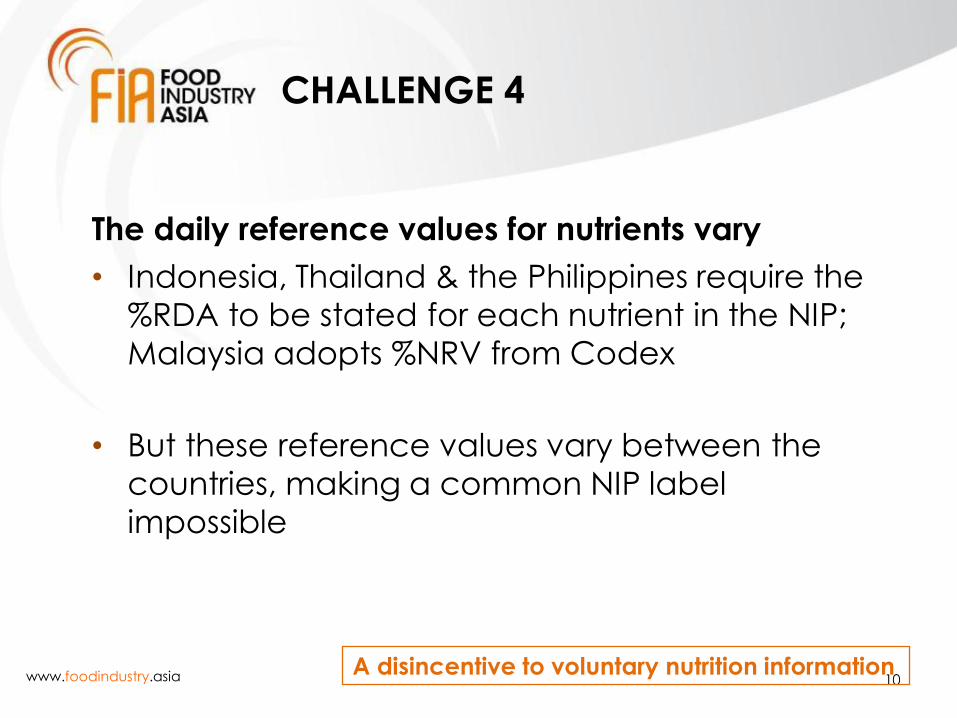
CHALLENGE 4
The daily reference values for nutrients vary
• Indonesia, Thailand & the Philippines require the
%RDA to be stated for each nutrient in the NIP;
Malaysia adopts %NRV from Codex
• But these reference values vary between the
countries, making a common NIP label
impossible
10 A disincentive to voluntary nutrition information
www.foodindustry.asia
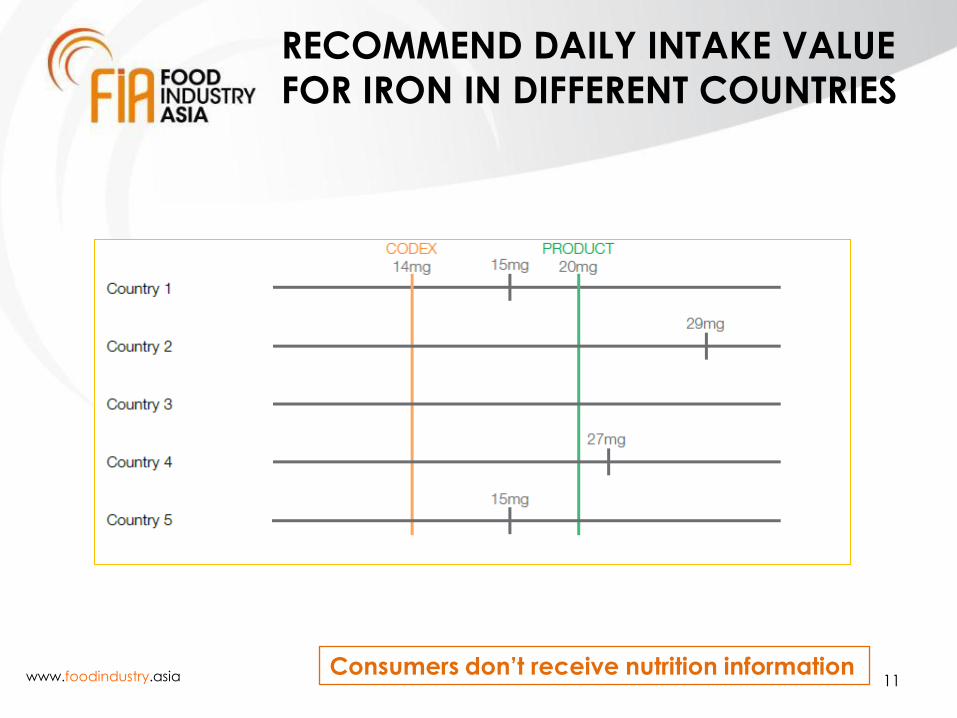
RECOMMEND DAILY INTAKE VALUE
FOR IRON IN DIFFERENT COUNTRIES
11 Consumers don’t receive nutrition information
www.foodindustry.asia
BENEFITS OF HARMONISATION
Nutrient values, tolerances and labelling
• Cost efficiencies for manufacturers, trade,
consumers and governments
• Clarity of information for Consumers
• Increased product availability
12
www.foodindustry.asia
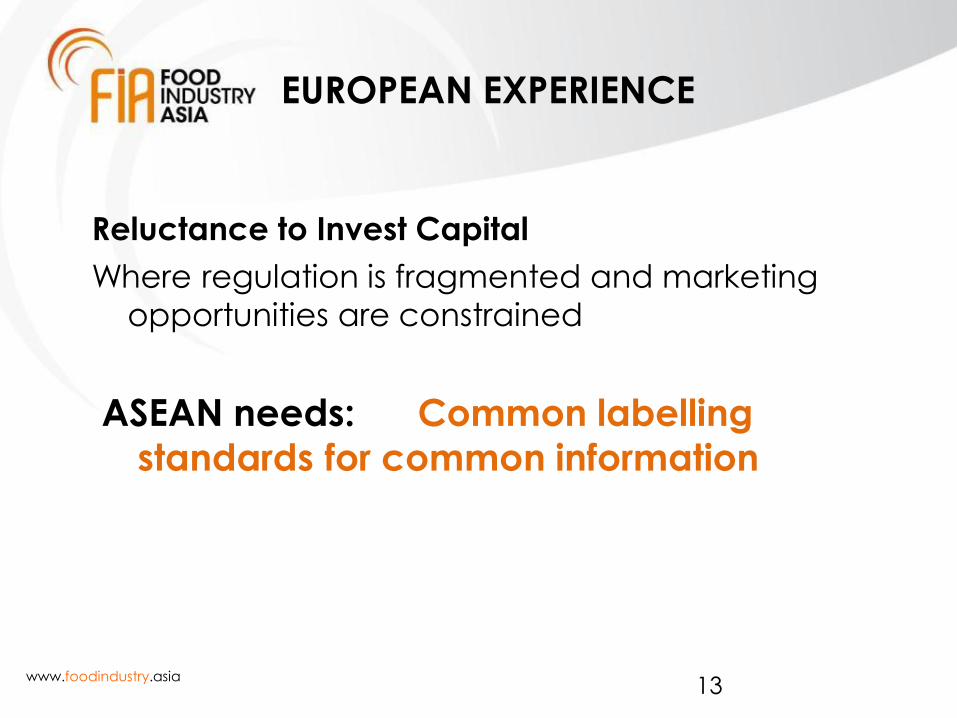
EUROPEAN EXPERIENCE
Reluctance to Invest Capital
Where regulation is fragmented and marketing
opportunities are constrained
13
ASEAN needs: Common labelling
standards for common information
Nutrition Labelling & Packaging
Standards
Ms Cyndy Au
www.foodindustry.asia
CHALLENGES AND OPPORTUNITIES
FOR HARMONIZATION
15
SPECIFIC RECENT EXAMPLES
www.foodindustry.asia
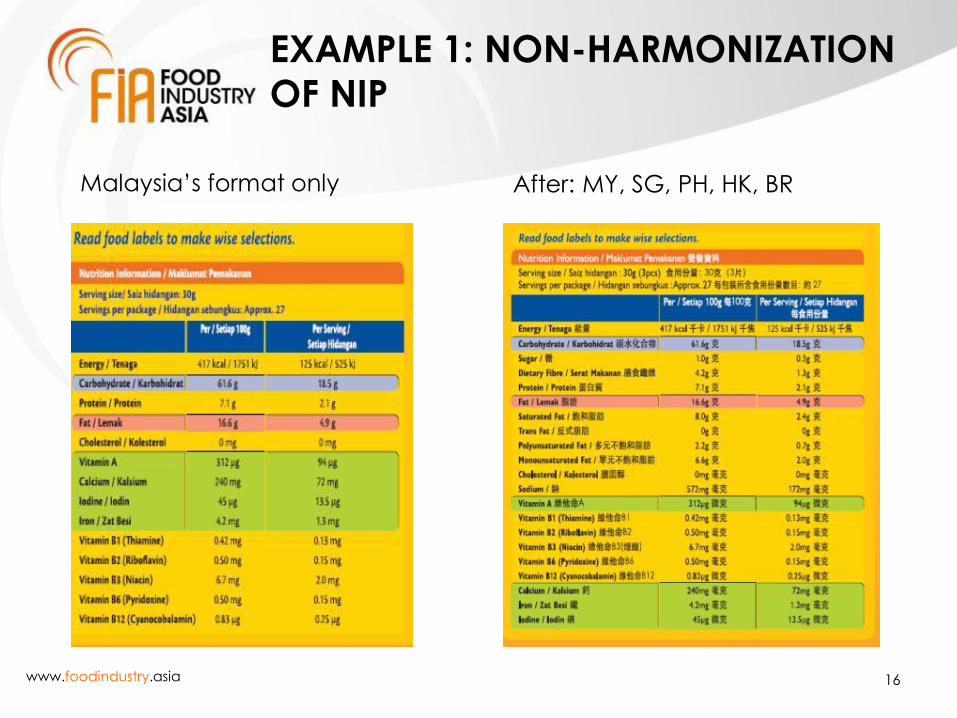
EXAMPLE 1: NON-HARMONIZATION
OF NIP
16
Malaysia’s format only After: MY, SG, PH, HK, BR
www.foodindustry.asia
EXAMPLE 2:
SPEED OF CODEX ADOPTION
17
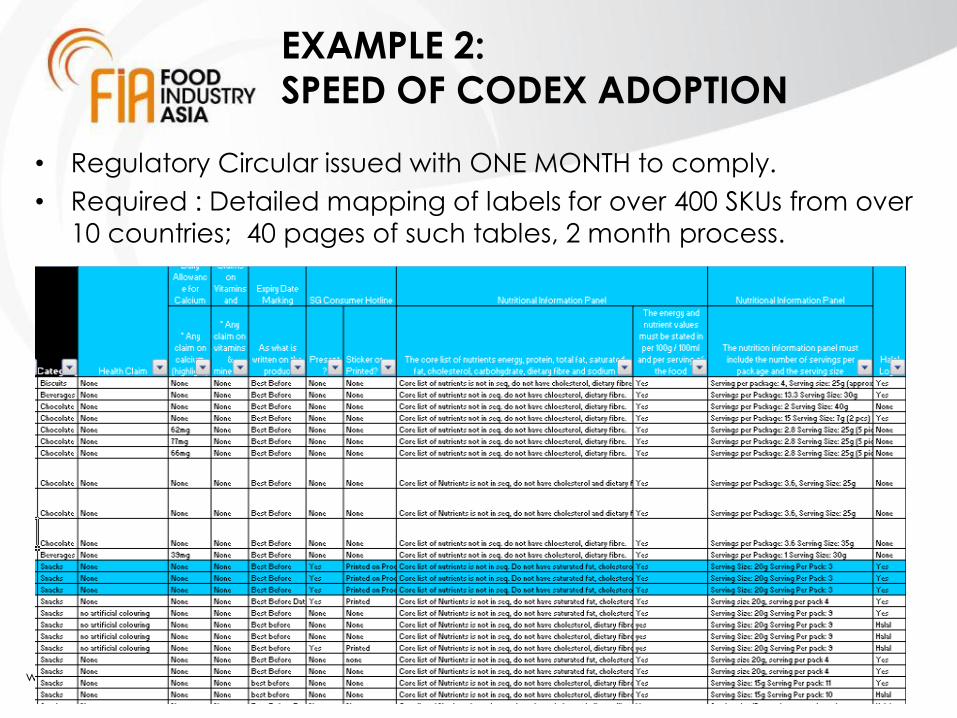
• Regulatory Circular issued with ONE MONTH to comply.
• Required : Detailed mapping of labels for over 400 SKUs from over
10 countries; 40 pages of such tables, 2 month process.
www.foodindustry.asia
EXAMPLE 2:
SPEED OF CODEX ADOPTION
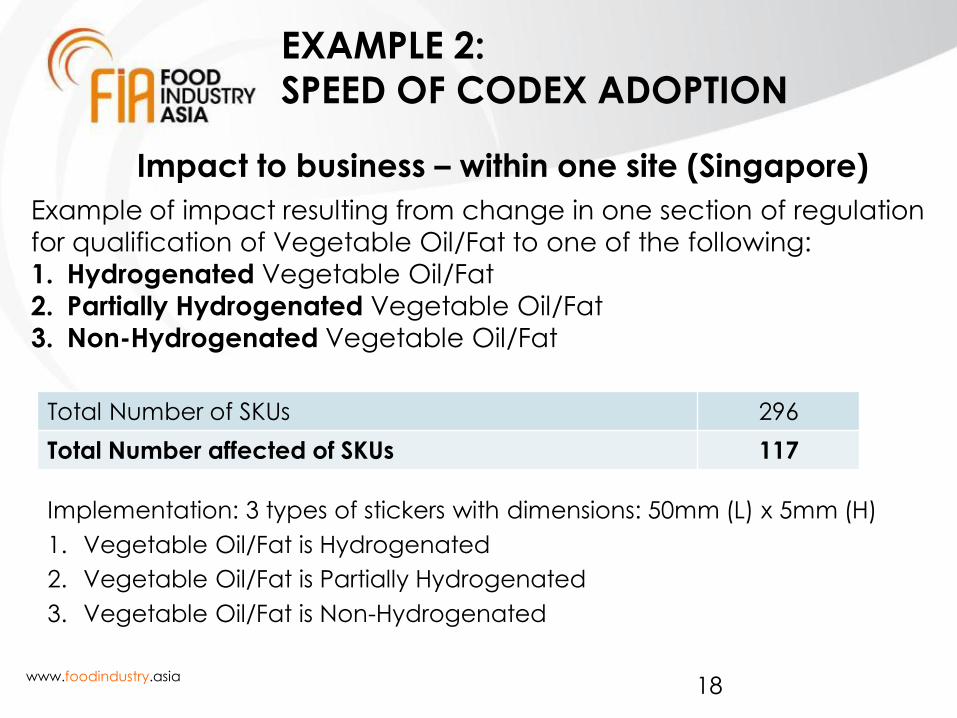
Impact to business – within one site (Singapore)
18
Example of impact resulting from change in one section of regulation
for qualification of Vegetable Oil/Fat to one of the following:
1. Hydrogenated Vegetable Oil/Fat
2. Partially Hydrogenated Vegetable Oil/Fat
3. Non-Hydrogenated Vegetable Oil/Fat
Total Number of SKUs 296
Total Number affected of SKUs 117
Implementation: 3 types of stickers with dimensions: 50mm (L) x 5mm (H)
1. Vegetable Oil/Fat is Hydrogenated
2. Vegetable Oil/Fat is Partially Hydrogenated
3. Vegetable Oil/Fat is Non-Hydrogenated
www.foodindustry.asia
EXAMPLE 2:
SPEED OF CODEX ADOPTION
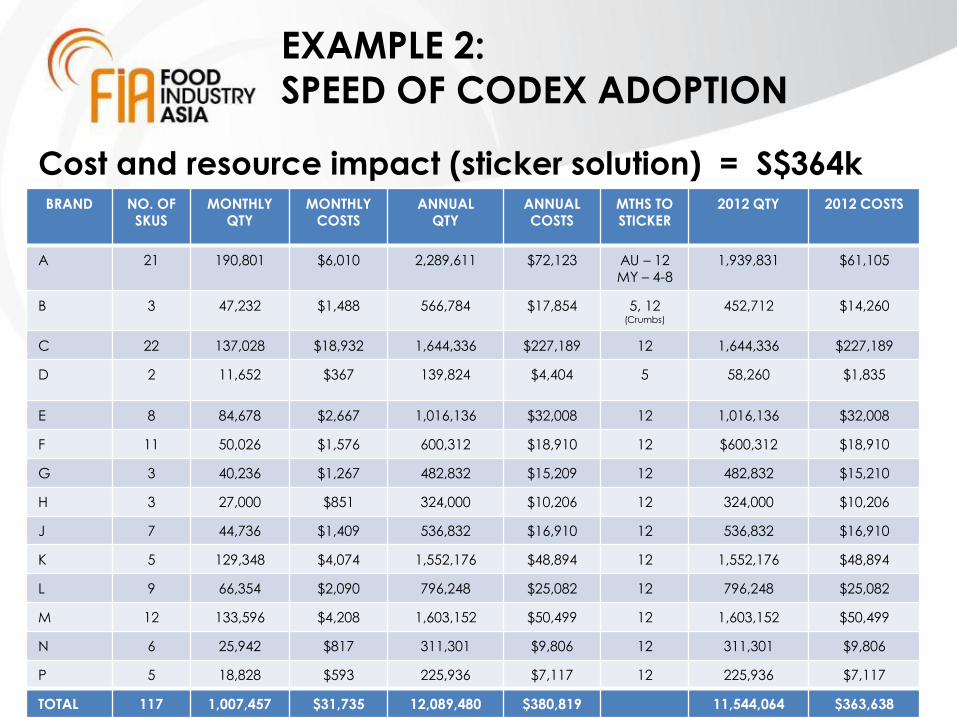
Cost and resource impact (sticker solution) = S$364k
19
BRAND NO. OF SKUS
MONTHLY QTY
MONTHLY COSTS
ANNUAL QTY
ANNUAL COSTS
MTHS TO STICKER
2012 QTY 2012 COSTS
A 21 190,801 $6,010 2,289,611 $72,123 AU – 12 MY – 4-8
1,939,831 $61,105
B 3 47,232 $1,488 566,784 $17,854 5, 12 (Crumbs)
452,712 $14,260
C 22 137,028 $18,932 1,644,336 $227,189 12 1,644,336 $227,189
D 2 11,652 $367 139,824 $4,404 5 58,260 $1,835
E 8 84,678 $2,667 1,016,136 $32,008 12 1,016,136 $32,008
F 11 50,026 $1,576 600,312 $18,910 12 $600,312 $18,910
G 3 40,236 $1,267 482,832 $15,209 12 482,832 $15,210
H 3 27,000 $851 324,000 $10,206 12 324,000 $10,206
J 7 44,736 $1,409 536,832 $16,910 12 536,832 $16,910
K 5 129,348 $4,074 1,552,176 $48,894 12 1,552,176 $48,894
L 9 66,354 $2,090 796,248 $25,082 12 796,248 $25,082
M 12 133,596 $4,208 1,603,152 $50,499 12 1,603,152 $50,499
N 6 25,942 $817 311,301 $9,806 12 311,301 $9,806
P 5 18,828 $593 225,936 $7,117 12 225,936 $7,117
TOTAL 117 1,007,457 $31,735 12,089,480 $380,819 11,544,064 $363,638
www.foodindustry.asia
EXAMPLE 3: NET WEIGHT LABELLING
NEW REQUIREMENT ONE COUNTRY
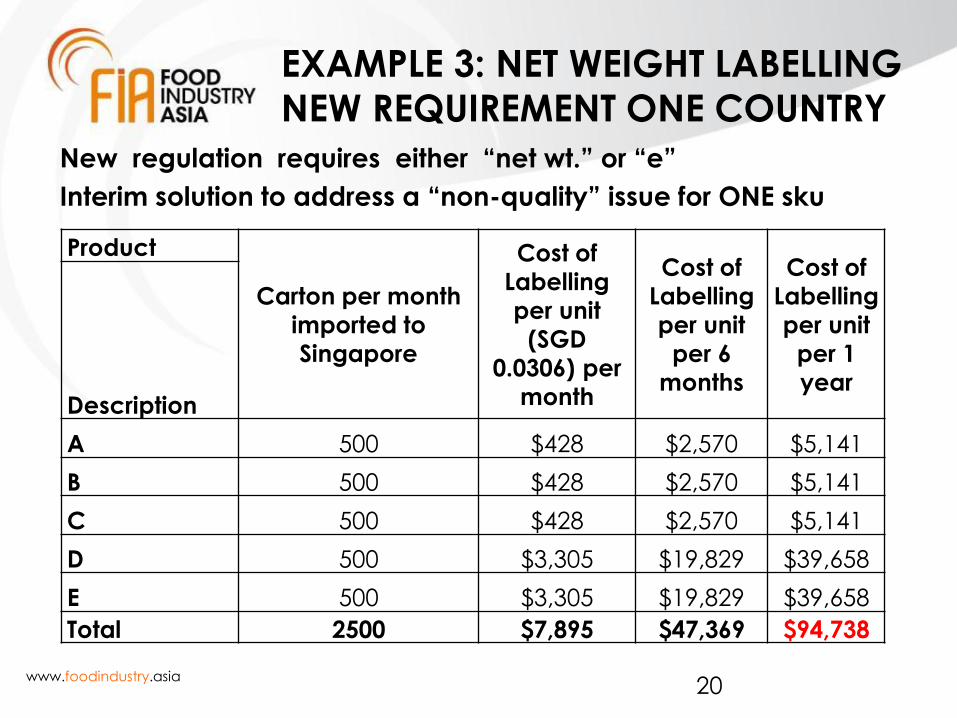
New regulation requires either “net wt.” or “e”
Interim solution to address a “non-quality” issue for ONE sku
20
Product
Carton per month
imported to
Singapore
Cost of
Labelling
per unit
(SGD
0.0306) per
month
Cost of
Labelling
per unit
per 6
months
Cost of
Labelling
per unit
per 1
year Description
A 500 $428 $2,570 $5,141
B 500 $428 $2,570 $5,141
C 500 $428 $2,570 $5,141
D 500 $3,305 $19,829 $39,658
E 500 $3,305 $19,829 $39,658
Total 2500 $7,895 $47,369 $94,738
www.foodindustry.asia
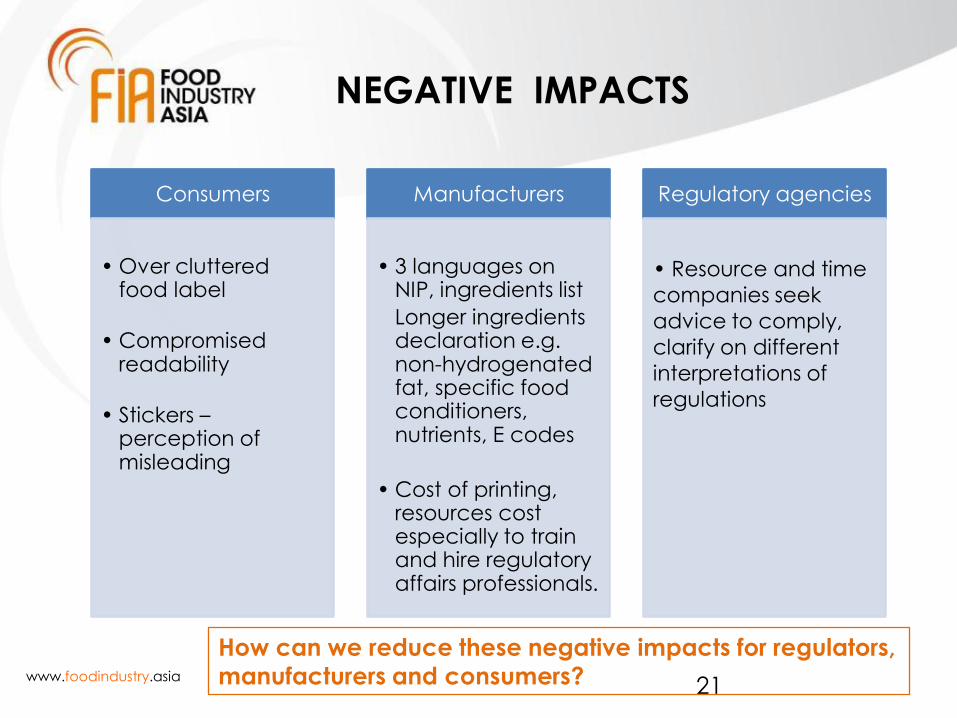
NEGATIVE IMPACTS
21
Consumers
• Over cluttered food label
• Compromised readability
• Stickers – perception of misleading
Manufacturers
• 3 languages on NIP, ingredients list
Longer ingredients declaration e.g. non-hydrogenated fat, specific food conditioners, nutrients, E codes
• Cost of printing, resources cost especially to train and hire regulatory affairs professionals.
Regulatory agencies
• Resource and time
companies seek
advice to comply,
clarify on different
interpretations of
regulations
How can we reduce these negative impacts for regulators,
manufacturers and consumers?
www.foodindustry.asia
EUROPEAN EXPERIENCE
Reluctance to Invest Capital
Where regulation is fragmented and marketing
opportunities are constrained
22
ASEAN needs: Common labelling
standards for common information
So what do we want to do about it ?
www.foodindustry.asia
WAY FORWARD
1. How can industry contribute to the development of national regulations in the region harmonized toward Codex standards?
2. How can food industry create a level playing field in implementation of harmonized regulations by MNCs and SMEs?
23
Regulatory agencies and industry both want clear
regulations & standards for labelling and claims.
ASEAN needs: Common labelling standards for
common information