Embed Size (px)
Citation preview

Registered charity number: 207890
Featuring work from Professor John A. Rogers, Northwestern University, United States.
Passive sweat collection and colorimetric analysis of biomarkers relevant to kidney disorders using a soft microfluidic system
This paper introduces two important advances in recently
reported classes of soft, skin-interfaced microfluidic systems for
sweat capture and analysis: (1) a simple, broadly applicable means
for collection of sweat that bypasses requirements for physical/
mental exertion or pharmacological stimulation and (2) a set of
enzymatic chemistries and colorimetric readout approaches
for determining the concentrations of biomarkers relevant to
kidney disorders.
As featured in:
See John A. Rogers et al., Lab Chip, 2019, 19, 1545.
rsc.li/loc

Lab on a Chip
PAPER
Cite this: Lab Chip, 2019, 19, 1545
Received 30th January 2019,Accepted 12th March 2019
DOI: 10.1039/c9lc00103d
rsc.li/loc
Passive sweat collection and colorimetric analysisof biomarkers relevant to kidney disorders using asoft microfluidic system†
Yi Zhang, ab Hexia Guo, b Sung Bong Kim,ci Yixin Wu,bi Diana Ostojich,c
Sook Hyeon Park,d Xueju Wang,e Zhengyan Weng,a Rui Li,f Amay J. Bandodkar,b
Yurina Sekine, g Jungil Choi, h Shuai Xu,ij Susan Quaggin,d
Roozbeh Ghaffariik and John A. Rogers*bi
The rich range of biomarkers in sweat and the ability to collect sweat in a non-invasive manner create
interest in the use of this biofluid for assessments of health and physiological status, with potential applica-
tions that range from sports and fitness to clinical medicine. This paper introduces two important advances
in recently reported classes of soft, skin-interfaced microfluidic systems for sweat capture and analysis: (1)
a simple, broadly applicable means for collection of sweat that bypasses requirements for physical/mental
exertion or pharmacological stimulation and (2) a set of enzymatic chemistries and colorimetric readout
approaches for determining the concentrations of creatinine and urea in sweat, throughout ranges that are
physiologically relevant. The results allow for routine, non-pharmacological capture of sweat for patient
populations, such as infants and the elderly, that cannot be expected to sweat through exercise, and they
create potential opportunities in the use of sweat for kidney disease screening/monitoring. Studies on hu-
man subjects demonstrate these essential capabilities, with quantitative comparisons to standard methods.
The results expand the range of options available in microfluidic sampling and sensing of sweat for disease
diagnostics and health monitoring.
Introduction
As a representative biofluid, sweat contains a wealth of bio-markers relevant to health status, from electrolytes and metalions, to metabolites, amino acids, proteins, and hormones.1,2
By comparison to blood and interstitial fluids, the ability tocollect sweat non-invasively creates opportunities for use inroutine diagnostics via wearable platforms, with potential ap-plications ranging from sports physiology to clinical medi-cine.3 As an example of the former, quantitative informationon the loss of sodium and chloride through sweat can beused by athletes to guide proper management of electrolytebalance.4 As an example of the latter, the concentration ofchloride in sweat is the primary clinical standard indicator ofcystic fibrosis in newborns and infants.5 Recent research sug-gests additional possibilities for sweat-based diagnostics, in-cluding the use of concentrations of cortisol and glucose insweat as indicators of stress/fatigue and diabetes,respectively.6–9 In addition to sweat chemistry, the volumeand rate of sweat loss provide quantitative information onconditions such as hyper- and hypo-hidrosis.10 Furthermore,the concentrations of biomarkers in sweat and the sweat rateare linked due to the intrinsic nature of the mechanisms ofsecretion and reabsorption.11–13 For example, the
Lab Chip, 2019, 19, 1545–1555 | 1545This journal is © The Royal Society of Chemistry 2019
aDepartment of Biomedical, Biological, and Chemical Engineering, University of
Missouri, Columbia, MO 65211, USAbDepartment of Materials Science and Engineering, Northwestern University,
Evanston, IL 60208, USA. E-mail: [email protected] Department of Materials Science and Engineering, and Frederick Seitz Materials
Research Laboratory, University of Illinois at Urbana-Champaign, Urbana, IL
61801, USAdDivision of Nephrology and Hypertension, Feinberg Cardiovascular and Renal
Research Institute, Feinberg School of Medicine, Northwestern University,
Chicago, IL 60611, USAeDepartment of Mechanical and Aerospace Engineering, University of Missouri,
Columbia, MO 65211, USAf State Key Laboratory of Structural Analysis for Industrial Equipment,
Department of Engineering Mechanics, and International Research Center for
Computational Mechanics, Dalian University of Technology, Dalian 116024,
ChinagMaterials Sciences Research Center, Japan Atomic Energy Agency, Tokai, Ibaraki,
319-1106, Japanh School of Mechanical Engineering, Kookmin University, 77 Jeongneung-ro,
Seongbuk-gu, Seoul 02707, Koreai Center for Bio-Integrated Electronics, Simpson Querry Institute for Bio-
Nanotechnology, Northwestern University, Evanston, IL 60208, USAj Department of Dermatology, Feinberg School of Medicine, Northwestern
University, Chicago, IL 60211, USAkDepartment of Biomedical Engineering, Northwestern University, Evanston, IL
60208, USA
† Electronic supplementary information (ESI) available. See DOI: 10.1039/c9lc00103d
Publ
ishe
d on
12
Mar
ch 2
019.
Dow
nloa
ded
by U
nive
rsity
of
Mis
sour
i-C
olum
bia
on 4
/23/
2019
4:5
5:55
PM
.
View Article OnlineView Journal | View Issue

1546 | Lab Chip, 2019, 19, 1545–1555 This journal is © The Royal Society of Chemistry 2019
concentrations of urea and creatinine increase with deceasingsweat rate, while the concentrations of sodium and chlorideshow opposite trends.14,15 Measurements of rate are, as a re-sult, essential for meaningful interpretation of sweatbiochemistry.
Here, we present simple colorimetric schemes to assessthe sweat rate and the concentrations of urea and creatinine,as two metabolic products in sweat that could provide indica-tions relevant to kidney function. Healthy kidneys removecreatinine and urea from the blood via glomerular filtra-tion,16 a key aspect of renal function. The concentration ofcreatinine in serum can, therefore, provide an estimate ofglomerular filtration rate (eGFR).17 Blood urea nitrogen(BUN) yields information about eGFR and renal tubular func-tion, because BUN is not only freely filtered through glomer-uli, but it is also absorbed via renal tubular cells.18 As a re-sult, serum creatinine and BUN serve as the basis for tests ofglomerular function.19 Specifically, as kidneys fail, the effi-ciency of this process diminishes, and the concentrations ofurea and creatinine in the blood both increase.20,21 The cur-rent standard of care in screening for kidney dysfunction in-volves measurements in samples of blood and/or urine usinglaboratory techniques, such as liquid chromatography andnuclear magnetic resonance spectroscopy (NMR). Such test-ing procedures are, however, costly and they must beperformed by trained personnel in laboratories or hospitals.
Due to diffusive equilibration processes, these changes inblood chemistry can lead to corresponding changes in theconcentration of these species in sweat.22 In particular, thelevels of sweat creatinine and urea are higher in kidney pa-tients than in healthy subjects.16,23 Average urea concentra-tions in sweat range from ∼5 to ∼40 mM for healthy sub-jects.16,24 The average creatinine concentration in healthymales is ∼0.03 mM.16 As an additional parameter, the pH ofsweat can be useful in characterizing various health condi-tions,25 and it is an indicator of metabolic alkalosis.26 Of par-ticular relevance here is that sweat pH, which is oftencoupled to the concentration of sodium in sweat, can be usedfor monitoring dehydration.25,27 Low urine pH is an indepen-dent predictor of stage 3 chronic kidney diseases.28
Although the connections between chronic kidney dis-ease and sweat parameters are not completely understood,there are reasons to believe that sweat pH, creatinine andurea concentrations will be important. A key challenge inestablishing relationships between biomarkers in sweat anddifferent stages of chronic kidney disease arises from diffi-culties in collecting sweat samples while simultaneouslyquantifying sweat rate and volume, and avoidingconfounding effects associated with sweat evaporation orcompensatory sweating.29 Traditional techniques rely on ex-traction of sweat from absorbent pads or rigid tubular col-lection platforms followed by transfer into benchtop instru-ments for analysis. The accuracy of the procedures can becompromised by evaporation and/or contamination duringsweat collection, storage and transfer, and they cannot beused outside of specialized facilities.1
Simple, non-invasive methods that enable sweat captureand analytics directly on sweat as it emerges from the skinare of interest in this context. Specifically, recent advances inwearable electronics, soft microfluidics, and electrochemical/colorimetric sensors provide attractive sets ofcapabilities.30–35 These approaches retain, however, require-ments for heavy exercise or for pharmacological stimulationto generate sufficient quantities of sweat for analysis.9,36–38
The former limits applicability to patients who are physicallyunfit and unable to exercise. The latter demands the use ofiontophoresis for transdermal delivery, and associated collec-tion of electronics and skin-electrode interfaces that cancause discomfort and inflammation.
This paper reports a set of results that addresses issues inboth analysis and collection of sweat, with a focus on kidneydisease. The approach to collection exploits water-proof, skin-interfaced microfluidic systems to capture sweat released nat-urally, immediately after and especially during warm-watershowering or bathing. Analysis relies on enzymatic chemis-tries and colorimetric readout schemes implemented withinthe device structures. We note that while these procedures of-fer attractive features relative to other options in sweat collec-tion/analysis, they do not support continuous monitoring, asthey require the subject to engage in certain activities. Thesetechnology platforms and procedures enable investigations ofsweat creatinine and urea and their relationships to chronickidney disease stages, as the first step toward the potentialdevelopment of a testing approach that does not requireblood.
ResultsSoft epidermal microfluidic devices for capturing sweat
Sweat capture and manipulation occurs in a soft, epidermalmicrofluidic device that uses natural pressures associatedwith perspiration (∼70 kPa) to induce filling (Fig. 1a),39
based on materials and designs reported elsewhere.1,39 Thekey functions of the devices described here include 1) analy-sis of the concentrations of creatinine and urea in sweat, aswell as its pH and 2) evaluation of sweat rate and sweat loss(Fig. 1a). As sweat enters the device from inlet ports at theskin interface, it passes through microscale channels (μ-chan-nels) and collects into a series of microscale reservoirs (μ-res-ervoirs) that fill in a sequential manner due to the use of acollection of capillary bursting valves.40 Each μ-reservoir con-tains a paper-based chemical assay or enzymes for colorimet-ric detection, as described subsequently. The sequential fill-ing allows for evaluation of changes in sweat chemistry as afunction of sweat loss. Serpentine-shaped μ-channels thatconnect to a separate inlet port enable simultaneous mea-surements of sweat rate and total loss. Here, a water-solubledye located at the inlet imparts color to the sweat as it entersthe device, thereby facilitating visualization of the extent offilling.
An exploded view schematic illustration highlights variousaspects of the multilayered structure of the system (Fig. 1b).
Lab on a ChipPaper
Publ
ishe
d on
12
Mar
ch 2
019.
Dow
nloa
ded
by U
nive
rsity
of
Mis
sour
i-C
olum
bia
on 4
/23/
2019
4:5
5:55
PM
. View Article Online

Lab Chip, 2019, 19, 1545–1555 | 1547This journal is © The Royal Society of Chemistry 2019
An ultrathin, soft biomedical adhesive (1524; 3M, MN, USA;thickness: 60 μm) with openings that define the sweat collec-tion zones (∼2.4 mm in radius for the analysis of creatinineand urea concentrations, and pH; ∼1.5 mm in radius for theevaluation of rate and loss) at the inlet ports on the skin-interfaced side of the device establishes a route for sweat toenter and creates a water-tight seal and strong bond to theskin in other regions. The techniques of soft lithographyyield a microfluidic layer of polyIJdimethylsiloxane) (PDMS;∼550 μm thick) that includes (1) a serpentine μ-channel formeasuring local sweat rate and loss and (2) three otherμ-channels that connect to three separate sets of connected,circular μ-reservoirs configured for measurements of pH andof concentrations of creatinine and urea. Chemical assaycomponents in each μ-reservoir support colorimetric sensingof each of these species. A capping layer (PDMS; ∼350 μmthick) seals the entire system. A thin transparent polyesteradhesive film (THERML film SELECT® 10852; FLEXcon, MA,
USA; 25 μm thick) with printed color reference markersbonds to this capping layer to aid the quantitative extractionof color information from digital images of the device. Fig. 1cshows an image of a representative device in a deformedstate. The ability to bend freely allows the device to bindtightly to the skin in a non-invasive and non-irritating man-ner (Fig. 1d).
Quantitative colorimetric analysis
As described previously, creatinine and urea are importantbiomarkers of renal function. The concentration of creatininein serum serves as a measure of the glomerular filtration rate(GFR) and provides a clinically accepted index of renal func-tion.17 Creatinine can be measured using the Jaffe method,41
isotope dilution-liquid chromatography-mass spectrometry(IDLC-MS),42 gas chromatography-mass spectrometry (GC-MS)43 or capillary electrophoresis.44 The scheme reported
Fig. 1 Overview, schematic illustration, and optical images of an epidermal microfluidic sweat sensor. (a) Overview of the functionality of thecolorimetric detection scheme with insets at the right, left and top that illustrate the range of colors across a corresponding relevant range forsweat. (b) Exploded view illustration of the different layers and components of the system. (c) Image of a device in a flat (left) and bent (right) state.(d) Image of a device mounted on the forearm.
Lab on a Chip Paper
Publ
ishe
d on
12
Mar
ch 2
019.
Dow
nloa
ded
by U
nive
rsity
of
Mis
sour
i-C
olum
bia
on 4
/23/
2019
4:5
5:55
PM
. View Article Online

1548 | Lab Chip, 2019, 19, 1545–1555 This journal is © The Royal Society of Chemistry 2019
here relies on a colorimetric assay (Creatinine Assay Kit,MAK080, Sigma-Aldrich, MO) that is suitable for use with se-rum, plasma, urine, and other biological fluids. This assay in-volves a H2O2-responsive dye (4-aminophenazone) and a se-quence of reactions catalyzed by enzymes that includecreatininase, creatinase, sarcosine oxidase, and peroxidase.45
Although bilirubin is known to interfere with this assay,sweat is free of bilirubin.46 Casting corresponding solutionsof the enzymes and the probe with optimized formulationsinto the μ-reservoirs and drying under vacuum creates activefilms for colorimetric sensing of creatinine concentrationsrelevant to sweat. Analysis involves quantitatively relating thedecrease in the green level of RGB values extracted from im-ages of a μ-reservoir with increases in creatinine concentra-tion, for a range between 0–500 μM (Fig. 2a).
Most methods for measuring urea rely on LC-MS,47
HPLC,48 NMR,49 or electrochemical techniques.50–52 Commer-cially available urea colorimetric assay kits operate over arange of concentrations (0.01–0.1 mM) that is too low forevaluation of sweat. Healthy humans have urea concentra-tions range from ∼5 to ∼40 mM; concentrations above 100mM are suggestive of kidney dysfunction.16,23 The colorimet-ric strategies introduced here address this full range via ascheme that colorimetrically evaluates increases in pH thatresult from the production of ammonium and hydroxyl ions(OH–) by urease mediated hydrolysis of urea.53 This catalyticeffect of urease, immobilized in pH paper, raises the pH.54,55
The resulting changes in the color of the pH paper correlateto the concentration of urea (Fig. 2b). Specifically, as the con-centration of urea in sweat increases, the red level decreaseswith concentration from 10, 50, 100 to 250 mM, correspond-ing to pH values from 7.1, 8.4, 8.8, to 8.9. For concentrationsabove 100 mM, the value reaches a plateau, corresponding toa pH ∼ 8.9, due to the ammonia deactivation of urease.56
The evaluation of pH occurs separately using an indicatoroptimized for sensitivity across a range relevant to sweat (pH5 to 7),57 which includes dyes such as bromothymol blue,methyl red and phenolphthalein to yield colorimetric re-sponses (Fig. 2c).
As shown in Fig. 2d and e, the RGB values extracted fromdigital images of these assays collected at 37 °C and underwhite light conditions gradually stabilize with time upon in-troduction of aqueous solutions of urea or creatinine atknown concentrations until they reach a final state. For con-centrations across ranges relevant to sweat at pH 6, the satu-rated, stabilized final state for both urea and creatinine as-says occurs within 15 minutes at body temperature. The colorresponse time of pH paper is less than one second.
The rate of hydrolysis of urea into ammonium and OH–
can be influenced by the pH of sweat,58 which typically liesbetween 5–7 due to the secretion of metabolic lactic acid.59
Analyzing the percentage change in red level from RGB valuescollected as a function of time under physiologically relevantranges of pH and various sweat urea concentrations suggests
Fig. 2 Quantitative colorimetric analysis of sweat creatinine, urea, and pH. Standard calibration curve between normalized percentage of red,green and blue levels from RGB analysis of the image and concentration of (a) creatinine, (b) urea and (c) pH. The normalized percentage of thechange in green and red levels with time at various concentrations of (d) creatinine and (e) urea. (f) Plateau, normalized percentage of red levelwith pH at various sweat urea concentrations.
Lab on a ChipPaper
Publ
ishe
d on
12
Mar
ch 2
019.
Dow
nloa
ded
by U
nive
rsity
of
Mis
sour
i-C
olum
bia
on 4
/23/
2019
4:5
5:55
PM
. View Article Online
Lab Chip, 2019, 19, 1545–1555 | 1549This journal is © The Royal Society of Chemistry 2019
that pH influences the dynamics of color development. Spe-cifically, changes in color cease after ∼35, 15 and 14 minfor pH of 5, 6, and 7 respectively (Fig. S1a–c†); the latter
two values are similar possibly because as the pH ap-proaches a neutral value, the differences in reaction rateare small. The sweat pH, however, does not significantly
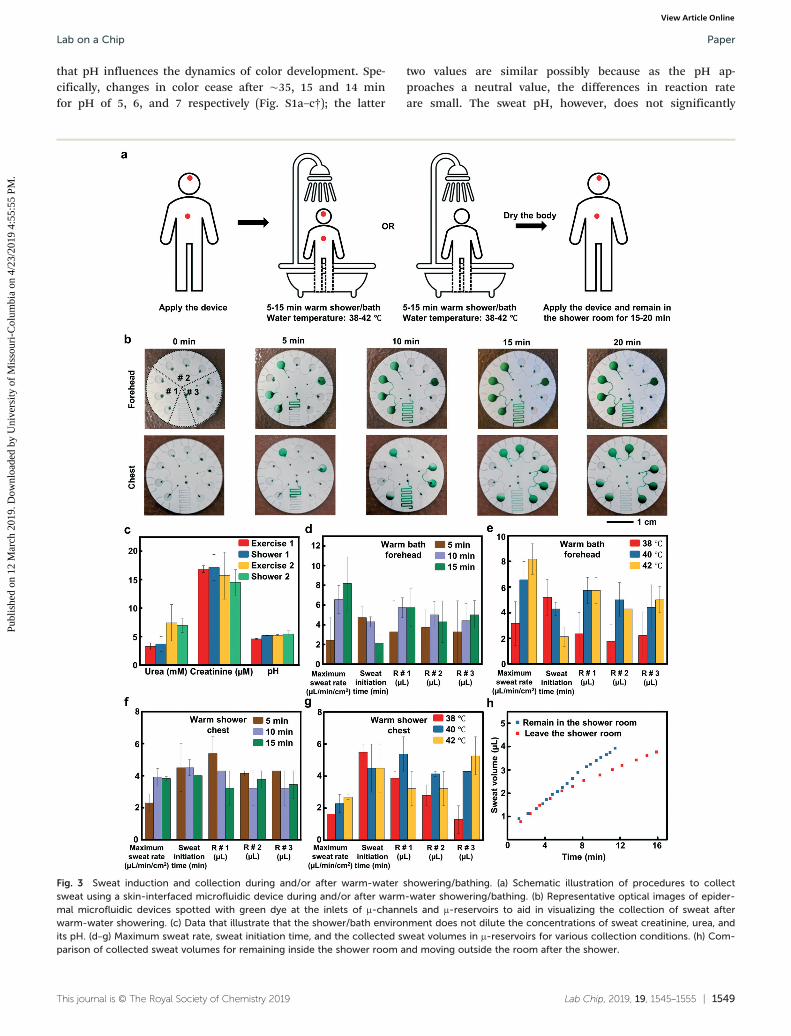
Fig. 3 Sweat induction and collection during and/or after warm-water showering/bathing. (a) Schematic illustration of procedures to collectsweat using a skin-interfaced microfluidic device during and/or after warm-water showering/bathing. (b) Representative optical images of epider-mal microfluidic devices spotted with green dye at the inlets of μ-channels and μ-reservoirs to aid in visualizing the collection of sweat afterwarm-water showering. (c) Data that illustrate that the shower/bath environment does not dilute the concentrations of sweat creatinine, urea, andits pH. (d–g) Maximum sweat rate, sweat initiation time, and the collected sweat volumes in μ-reservoirs for various collection conditions. (h) Com-parison of collected sweat volumes for remaining inside the shower room and moving outside the room after the shower.
Lab on a Chip Paper
Publ
ishe
d on
12
Mar
ch 2
019.
Dow
nloa
ded
by U
nive
rsity
of
Mis
sour
i-C
olum
bia
on 4
/23/
2019
4:5
5:55
PM
. View Article Online

1550 | Lab Chip, 2019, 19, 1545–1555 This journal is © The Royal Society of Chemistry 2019
influence the final colors across various urea concentrations(Fig. 2f).
As mentioned previously, sweat rate affects the concentra-tion of biomarkers in sweat. Specifically, the concentrationsof urea and creatinine increase with deceasing sweat rate.14 Adecrease in the rate of sweating, for otherwise similar condi-tions, is an indicator for dehydration,60 an important factorin kidney disorders.61 Increasing water intake may have bene-ficial effects on renal function of patients with chronic kid-ney disease.61 Measurements of sweat rate and loss are,therefore, important in the context of applications consideredhere. Options include capacitance hygrometry,62,63 electricalimpedance,11,13 and, most recently, the kinetics of filling intomicrofluidic systems like those reported here.39 For this thirdoption, fluid delivered using external pumping apparatusmimics the process of sweating to allow for calibration (Fig.S2†). A green dye located in a μ-reservoir (diameter, 1.5 mm)located near the inlet facilitates visualization of the fillingprocess (Fig. S2†). The capabilities for performing measure-ments of concentrations of creatinine and urea in sweatalong with sweat dynamics in a single platform provide atechnical foundation for future studies of the relationshipsbetween these concentrations and sweat rate.
Sweat induction and collection
Collection of sweat can be accomplished via initiation basedon physical exercise, mental stress, exposure to warm, humidenvironments (e.g. a sauna) or delivery of stimulating agoniststo the sweat glands with electrical current.9,36–38 The first twomethods have utility in certain contexts, but they do not applyeffectively to infants or to elderly patients, nor can they be usedmore generally with subjects whose health conditions preventsexercise. The third requires access to specialized facilities. Thefourth also demands special setups, and the process can alsoinduce pain and/or inflammation at the skin interface.
Here we introduce a patient-friendly, convenient methodthat can be applied in the home. The process captures sweatimmediately after or during warm-water showering or bath-ing, as illustrated schematically in Fig. 3a. Fig. 3b presentsrepresentative optical images of devices for sweat captured af-ter emerging from a shower, applied on the forehead andchest after drying with a towel and cleaning with an alcoholpad. Fig. 3b suggests that this method can capture severalmicroliters of sweat easily from these locations even with theunoptimized designs reported here (∼0.18 cm2 collectionzone) within 15 min, for on-demand collection and in situanalysis. Experimental studies indicate that there are no sig-nificant differences between the concentrations of urea orcreatinine, or of pH in sweat captured in this manner com-pared to that obtained via physical exercise, for comparablerates (Fig. 3c and Table S1†).
Experiments at three different water temperatures (38, 40and 42 °C) for three different durations (5, 10 and 15 min) attwo body locations (forehead and chest) provide additionalinsights into the process. As illustrated in the shower/chest
and bath/forehead study in Fig. 3d–g and Table S2,† sweatcollection begins within a few minutes. Increasing the tem-perature of the water from 38 to 42 °C and the length of theshower and bath from 5 to 15 min, reduces the initiationtime and increases the sweat rate, respectively. Experimentalresults for other conditions including shower/forehead andbath/chest show similar trends, as in Fig. S3.† Only minor dif-ferences in sweat generation profiles occur for collectiontimes of 10 and 15 min and for water temperatures of 40 °Cand 42 °C, for both bathing and showering. The relative hu-midity level in the shower room reaches ∼99% for these vari-ous conditions. The temperature of the room is an importantfactor. As shown in Fig. 3h, collection in the bathing/showerroom (∼28 °C) leads to a constant sweat rate. Collection out-side of this room (20 °C, relative humidity level 70–80%)leads to decreases in the sweat rate, as might be expected.For bathing, sweat capture occurs more efficiently from theforehead than the chest (Fig. 3 and S3†), consistent with thehigh density of sweat glands on the former.64 Interestingly,for the warm-water shower, the chest yields more sweat thanthe forehead (Fig. 3 and S3†), possibly due to the localwarming effect of clothing on the former.
Further adaptations of the devices simplify the process byallowing for sweat collection during the showering/bathingsession itself. Fig. S4a and b† show devices that feature a cap-illary bursting at the outlet to prevent backfilling of waterinto the devices.40,65 Other modifications include a reductionof the volumes of the μ-reservoirs from 2.2 μL to 1.0 μL. Withthis reduced capacity, the serpentine channel, added afterthe μ-reservoir, fills with sweat after the μ-reservoir, therebypreventing dye or chemicals in the μ-reservoir from passingdirectly onto the skin. Fig. S4c and d† demonstrate that sweatcan be captured in this manner (showering with water tem-perature of 40 °C; duration: 10 min). Experimental observa-tions suggest that a negligible amount of water passes fromthe bath/shower through the constituent materials of the de-vices and into the channels/μ-reservoirs during the collectionperiod, consistent with diffusion calculations. Observationsalso suggest that no backfilling occurs.
Field studies
The studies use epidermal microfluidic devices mounted onthe forehead and chest of healthy volunteers, with sweat cap-tured immediately after exiting the shower in the showerroom. This process fills the μ-reservoirs with sweat to allowassessments via colorimetric measurements of digital images.Sweat enters the device and fills each μ-reservoir in a sequen-tial fashion. Sweat does not continue to enter a μ-reservoirthat is already full. This configuration avoids dilution andflow-through effects that might otherwise alter the color de-velopment. In practical testing, color extraction only occursfrom filled μ-reservoirs. Specifically, capturing an image ofthe device using a smartphone camera yields data that canbe used to determine concentrations of creatinine and urea,and pH (Fig. 4a). In parallel, conventional collection methods
Lab on a ChipPaper
Publ
ishe
d on
12
Mar
ch 2
019.
Dow
nloa
ded
by U
nive
rsity
of
Mis
sour
i-C
olum
bia
on 4
/23/
2019
4:5
5:55
PM
. View Article Online

Lab Chip, 2019, 19, 1545–1555 | 1551This journal is © The Royal Society of Chemistry 2019
using absorbent pads taped to the skin and covered withfilms of polyimide (25 μm thick) to prevent sweat evaporationyield ∼1 mL volumes of sweat from the forehead for subse-quent instrumental analysis using LC-MS/MS, NMR, and apH meter (Fig. S5†). As shown in Fig. 4b–d and S6,† creati-nine and urea concentrations and pH values measured usingthe microfluidic skin-interfaced devices exhibit good correla-tion to those determined using standard approaches. The re-sults for different subjects range from 9 μM to 15 μM for cre-atinine, 2 mM to 15 mM for urea, and 4.5–7.5 for pH, all ofwhich are consistent with normal values for healthy sub-jects.16,23,39 In additional to digital image analysis, the colorreference markers facilitate approximate analysis by simplevisual inspection, possibly of use in rapid disease screening.
Conclusions
The findings presented here establish the utility of user-friendly, convenient methods for sweat capture and analysisthat exploit soft, skin-interfaced microfluidic devices and nat-ural sweat processes during and/or immediately after warm-water showering or bathing. A collection of enzymatic chem-istries enables colorimetric sensing of creatinine and urea insweat, and a standard indicator yields pH values, each of po-tential relevance for diagnosing and/or monitoring patients
with kidney disease. Studies of human subjects demonstratethese capabilities, with validation against standard collectionschemes and laboratory diagnostic instruments.
Materials and methodsDevice fabrication
Patterning photoresist (KMPR 1010; Microchem, MA, USA) ona silicon wafer (1 mm thick) and deep reactive ion etching(STS Pegasus ICP-DRIE; SPTS Technologies, Newport, UnitedKingdom) of the exposed regions generated a pattern of reliefin the geometry of the μ-channels and μ-reservoirs. A thinlayer of polyIJmethylmethacrylate) (PMMA; Microchem, MA,USA) spin cast (3000 rpm) onto this silicon mold to serve asan anti-adhesion layer. Pouring a mixture of a white dye(Reynolds Advanced Material, 5 wt%) and a precursor ofPDMS (Sylgard 184 at a 10 : 1 mixing ratio of base to curingagent; Dow Corning, MI, USA) on the mold, spin coating at200 rpm and baking at 70 °C for 45 min generated the micro-fluidic channel layer (∼550 μm thick). The chemical assayswere located at the positions of the μ-reservoirs. Separately,sequential spin coating of precursors of PDMS with mixingratios of 10 : 1 and 50 : 1 at 400 and 1000 rpm, respectively,for 1 min and then baking at 70 °C for 45 min yielded a cap-ping layer (∼350 μm thick). The 50 : 1 PDMS provided a tacky
Fig. 4 Human subject studies. (a) Images of devices applied to the forehead and chest collected at various times during the study. (b–d)Concentrations of biomarkers in sweat obtained using the devices versus laboratory-based analysis of sweat collected from absorbing pads (n =8). Data points with the same color are measured during the same test. *P < 0.05, two-tailed test.
Lab on a Chip Paper
Publ
ishe
d on
12
Mar
ch 2
019.
Dow
nloa
ded
by U
nive
rsity
of
Mis
sour
i-C
olum
bia
on 4
/23/
2019
4:5
5:55
PM
. View Article Online

1552 | Lab Chip, 2019, 19, 1545–1555 This journal is © The Royal Society of Chemistry 2019
surface to facilitate bonding to the microfluidic channellayer. A transparent polyester film (25 μm thick; THERMLfilmSELECT® 10852; FLEXcon, MA, USA) placed on top of the de-vice supported the color reference markers. A corona treat-ment (30 s; Electro-Technic Products) enabled bonding of amedical grade acrylate adhesive (60 μm thick; 1524; 3M, MN,USA) the bottom of the device for robust adhesion to theskin.
Forming the colorimetric assays
1) Urea: a 0.01 mg mL−1 solution of urease (urease fromCanavalia ensiformis, Jack bean, type III; Sigma-Aldrich, MO,USA) was prepared in deionized water (pH = 7). Immobilizing2 μL of this solution onto piece of pH paper (diameter, 3mm, Hydrion Strips B 1-11, Micro Essential Laboratory, NY,USA) and drying under vacuum in a desiccator for 15 minyielded the assay.
2) Creatinine: mixing creatininase, creatinase, and enzymein a 1 : 1 : 1 ratio yielded the creatinine assay solution. Spot-ting 0.5 μL of this cocktail solution onto the μ-reservoir anddrying under vacuum in a desiccator for 1 h produced the as-say. Next, spotting 0.25 μL of creatinine probe at an adjacentlocation and drying in a desiccator for another 1 h completedthe process. (Creatinine Assay Kit; Sigma-Aldrich, MO, USA).
3) pH: pH cocktail solution resulted from thoroughlyvortexing 4 mL of universal pH dye (Fisher Scientific, NH,USA), 274 mg of polyvinyl chloride (M.W. ∼233 000, Sigma-Al-drich, MO, USA), 635 μL of o-nitrophenyloctylether (Sigma-Al-drich, MO, USA) and 508 μL of aliquot in 10 mL of tetrahy-drofuran (Sigma-Aldrich, MO, USA) to yield a homogenoussuspension. Dipping a piece of filter paper into the resultingsolution for 10 s and allowing it to dry under ambient condi-tions for 15 min formed a solid-state pH assay. Finally, ametal punch (diameter, 3 mm) cut circular pads of the paperto sizes to match those of the μ-reservoirs.
Standard color development and color reference markerpreparation
Color reference markers facilitate accurate color extractionunder a range of illumination conditions. Preparation ofthese markers began with in vitro tests using standard sam-ples of artificial sweat to produce reference colors. Digital im-aging and analysis under controlled lighting provided colorvalue for each assay. Standard solutions of creatinine usecommercial materials (Sigma-Aldrich, MO, USA) and artificialsweat. Those for urea (Sigma-Aldrich, MO, USA) used artifi-cial sweat for urea. The pH buffer solution used artificialsweat with pH adjusted with NaOH (Sigma-Aldrich, MO,USA). A pH meter (Mettler Toledo, Greifensee, Switzerland)determined the pH value. The tests for creatinine, urea andpH each used 2 μL of standard solution in the μ-reservoirs.Here, the volume of 2 μL was selected to match the size ofμ-reservoirs in the microfluidic system. Incubation involvedheating in an oven at 37 °C for 15 min. A digital SLR camera(EOS 6D; Canon, Tokyo, Japan) captured the images. Photo-
shop (Adobe Systems, CA, USA) served as a means forextracting color information. The white background of themicrofluidic device established reference for white balance. Acolor laser printer (C454 PS; Konica Minolta, Tokyo, Japan)produced a reference marker on PET film at 1200 DPI resolu-tion, with colors to match those determined using themethods described above.
Laboratory analysis of creatinine, urea, and pH
NMR. All 1H NMR experiments were performed on aBruker Neo 600 MHz system equipped with a z-gradientHFCN Cryo probe. A series of standard urea solutions rang-ing from 1 mM to 500 mM was prepared by dissolving 0.3003g urea crystal in 5 mL artificial sweat and diluting with artifi-cial sweat. Samples of sweat were passed through syringe fil-ters with pore size 0.2 μm (Sigma-Aldrich, MO, USA). Eachsample was mixed with 5% D2O (v/v) and 500 μL volumes ofeach were loaded into a standard 5 mm NMR tube for themeasurements. Urea and water signals were measured follow-ing a reported sequence.49 The receiver gain was fixed at 25.4for all sample. For different samples, the free induction decay(FID) signal was set from 1–64 for a decent signal to noise ra-tio. Each sample was analyzed 3 times.
LC-MS/MS. The method for determining creatinine withLC-MS/MS appears elsewhere.66 Chromatographic separationof creatinine and creatinine-d3 were performed on an Atlan-tis Silica HILIC 3 μm 2.1 mm × 50 mm column (Waters, MA,USA). The flow rate was maintained at 0.3 mL min−1. The gra-dient of A and B was 5% A for 1 min, to 55% A in 6 min, at55% A for 2 min, to 5% A in 0.1 min, at 5% A for 1.9 min,where A was water with 0.1% formic acid and B was acetoni-trile with 0.1% formic acid. Quantification of creatinine wasperformed on a Bruker AmaZon-X. Creatinine and creatinine-d3 were monitored using characteristic precursor-productionion transitions: 114 ≥ 86 for creatinine and 117 ≥ 89 for cre-atinine-d3. Creatinine-d3 served as an internal standard solu-tion. The calibration standard solution of creatinine (Sigma-Aldrich, MO, USA) ranging from 1 to1000 μM was preparedwith 1% formic acid. The internal standard solution ofcreatinine-d3 (CDN Isotopes, Quebec, Canada) was finalizedat 500 μM in 1% formic acid. Sweat samples were also fil-tered before measurement. Each sample was mixed with theinternal standard solution in a 5 : 1 ratio. The concentrationof creatinine was calculated from the peak area ratio of creat-inine to creatinine-d3. Each sample was analyzed 3 times.
pH. Analysis of sweat pH was conducted with a pocket ionsensitive field effect transistor (ISFET) pH meter (Model24004, DeltaTrak, CA, USA), which required only 50 μL ofsweat sample.
Human testing. Testing involved healthy young adults asvolunteers during normal physical activity with no additionalhuman-subject risk. All subjects provided their consent priorto participation.
For comparisons between sweat induced by showeringand exercising, each volunteer engaged in 30 min of exercise
Lab on a ChipPaper
Publ
ishe
d on
12
Mar
ch 2
019.
Dow
nloa
ded
by U
nive
rsity
of
Mis
sour
i-C
olum
bia
on 4
/23/
2019
4:5
5:55
PM
. View Article Online

Lab Chip, 2019, 19, 1545–1555 | 1553This journal is © The Royal Society of Chemistry 2019
and 10 min of shower at 40 °C. The sweat for laboratory anal-ysis was collected with a Kimwipe (Fisher Scientific, NH,USA) covered with a 25 μm thick film of polyimide to preventevaporation or moisture condensation during exercise andshower. Each sweat sample was centrifuged and filtered be-fore analysis.
For studies of sweat induction and collection, the watertemperature was adjusted to the testing temperature (38, 40,or 42 °C) with subjects then engaging in a shower/bath for awell-defined time duration (5, 10, or 15 min). To study the ef-fect of time duration, the testing temperature was controlledat 40 °C. To study the effect of temperature, time durationwas controlled at 5 min for shower and 10 min for bath.Sweat collection devices were attached onto desired locationswhere they remained in place for 15–20 min after exiting theshower/bath or before shower/bath depending on the deviceand experimental design. Images were collected to record thevolume at different times for calculations of sweat rate andtotal volume.
For field studies, subjects engaged in a warm shower at 40°C for 10 min as described previously, followed by attach-ment of devices on desired body locations. After 15 to 40min, digital images were collected using a smartphone forfurther image analysis. White balance was performed withreference to the white microfluidic channel. Analysis at threedifferent locations from each assay provided an averagedcolor value that was then matched to the average value forthe corresponding reference marker to yield concentrationsfor each biomarker. Most colorimetric results correspond toevaluations from a single filled μ-reservoir. In cases with mul-tiple filled μ-reservoirs, the colors were the same, to withinuncertainties.
Calculations of diffusive transport
The water may diffuse through the device and into theμ-channels during the shower/bath. Here, a one-dimensionalmodel for diffusion of water into the film is established. Thepolyester layer serves as the main barrier to prevent diffusionof water into the devices or sweat out of the devices. The dif-fusivity of water in polyester is at least three orders of magni-tude lower than that in PDMS.67,68 Here, we only consider dif-fusion in polyester. With the origin located at the bottomand the y axis in thickness direction running upward, the dif-fusion equation is
D wy
wt
y h
2
2 00, (1)
where w is the water concentration that depends on positiony and time t, D the water diffusivity in polyester, and h0 theinitial thicknesses of the polyester layer. A constant waterconcentration w0 at the top surface and zero water concentra-tion at the bottom surface of the polyester layer give theboundary conditions
w w
wy h
y
0
0
00
(2)
The initial condition of zero water concentration in polyestergives
w|t=0 = 0 (0 ≤ y < h0) (3)
By the method of separation of variables,
w = Y(y)T(t) (4)
which yields
DYY
TT
(5)
with λ being the eigenvalue. By solving eqn (5), we have
Y EDy F
Dy
T t
sin cos
e
(6)
where E and F are constants to be determined. According thehomogeneous boundary conditions of eqn (2), i.e., w|y=h0
=0 and w|y=0 = 0, we have Y|y=h0
= 0 and w|y=0 = 0, which give F= 0 and
sin Dh0 0
(7)
The eigenvalues are thus obtained from eqn (7) as
n D nh
n
0
2
1 2 3 , , , (8)
Therefore, the homogeneous solution of water concentrationis
w C nhyn
D nh
t
nh e
0
2
01sin (9)
with the constants Cn to be determined. The general solu-tion of the problem is obtained by the sum of eqn (9)and a particular solution wp = w0y/h0 that satisfies eqn (1)and (2):
w why C n
hyn
D nh
t
n
0
0 01
0
2
e
sin (10)
Substituting eqn (10) into the initial condition in eqn (3),we obtain
Lab on a Chip Paper
Publ
ishe
d on
12
Mar
ch 2
019.
Dow
nloa
ded
by U
nive
rsity
of
Mis
sour
i-C
olum
bia
on 4
/23/
2019
4:5
5:55
PM
. View Article Online

1554 | Lab Chip, 2019, 19, 1545–1555 This journal is © The Royal Society of Chemistry 2019
Cw
nn
n
2 1 0
(11)
The final solution is thus obtained as
w y t w yh n
nhy
n D nh
t
n, sin
00 01
2 10
2
e
(12)
The water volume through the polyester layer within the time
period 0 − Δt is determined by v D w y A wy
t
water / dt 0 00
,
where A represents the cross-sectional area of the μ-reservoir.Further simplification gives
v D rh
D thI t
t
water d
2
00
02
12
; (13)
where r is the radius of the μ-reservoir, and
z nzI n
n; cos
1 2 22
1e is the Jacobi theta function,
where I is the imaginary unit. With D × 1012 = 0.025–0.78 m2 s−1
(at 90 °C),68 r = 1.1 mm, h0 = 25 μm, and Δt = 20 min, theamount of water that passes is 2 × 10⁻⁵ – 0.13 μL.
Conflicts of interest
J. A. R. and R. G. co-founded a company, Epicore Biosystems,Inc., which develops soft microfluidics systems for commer-cial deployment.
Acknowledgements
Y. Z., H. G., S. B. K. contributed equally to this work. Y. Z. ac-knowledges financial support from the University of Missouri-Columbia start-up fund. R. L. acknowledges the support fromthe Young Elite Scientists Sponsorship Program by CAST (grant2015QNRC001) and Fundamental Research Funds for the Cen-tral Universities (grant DUT18GF101). This work utilized North-western University Micro/Nano Fabrication Facility (NUFAB),which is partially supported by Soft and Hybrid Nanotechnol-ogy Experimental (SHyNE) Resource (NSF ECCS-1542205). Thiswork made use of the Integrated Molecular Structure Educationand Research Center (IMSERC) at Northwestern, which is par-tially supported by NIH 1S10OD012016-01/1S10RR019071-01A1and the Office for Research at Northwestern University.
Notes and references
1 J. Choi, R. Ghaffari, L. B. Baker and J. A. Rogers, Sci. Adv.,2018, 4, eaar3921.
2 M. Bariya, H. Y. Y. Nyein and A. Javey, Nat. Electron., 2018, 1,160–171.
3 A. Mena-Bravo and M. D. L. de Castro, J. Pharm. Biomed.Anal., 2014, 90, 139–147.
4 J. K. Davis, L. B. Baker, K. Barnes, C. Ungaro and J. Stofan,Sports Med., 2016, 46, 1391–1405.
5 P. M. Farrell, B. J. Rosenstein, T. B. White, F. J. Accurso, C.Castellani, G. R. Cutting, P. R. Durie, V. A. LeGrys, J. Massie,R. B. Parad, M. J. Rock and P. W. Campbell, J. Pediatr.,2008, 153, S4–S14.
6 H. Lee, C. Song, Y. S. Hong, M. S. Kim, H. R. Cho, T. Kang,K. Shin, S. H. Choi, T. Hyeon and D. H. Kim, Sci. Adv.,2017, 3, e1601314.
7 A. Kaushik, A. Vasudev, S. K. Arya, S. K. Pasha and S.Bhansali, Biosens. Bioelectron., 2014, 53, 499–512.
8 O. Parlak, S. T. Keene, A. Marais, V. F. Curto and A. Salleo,Sci. Adv., 2018, 4, eaar2904.
9 S. Emaminejad, W. Gao, E. Wu, Z. A. Davies, H. Y. Y. Nyein,S. Challa, S. P. Ryan, H. M. Fahad, K. Chen, Z. Shahpar, S.Talebi, C. Milla, A. Javey and R. W. Davis, Proc. Natl. Acad.Sci. U. S. A., 2017, 114, 4625–4630.
10 J. T. Korpelainen, K. A. Sotaniemi and V. V. Myllyla, Stroke,1992, 23, 1271–1275.
11 H. Y. Y. Nyein, L. C. Tai, Q. P. Ngo, M. H. Chao, G. B. Zhang,W. Gao, M. Bariya, J. Bullock, H. Kim, H. M. Fahad and A.Javey, ACS Sens., 2018, 3, 944–952.
12 Z. Sonner, E. Wilder, J. Heikenfeld, G. Kasting, F. Beyette, D.Swaile, F. Sherman, J. Joyce, J. Hagen, N. Kelley-Loughnaneand R. Naik, Biomicrofluidics, 2015, 9, 031301.
13 S. B. Kim, K. Lee, M. S. Raj, B. Lee, J. T. Reeder, J. Koo, A.Hourlier-Fargette, A. J. Bandodkar, S. M. Won, Y. Sekine, J.Choi, Y. Zhang, J. Yoon, B. H. Kim, Y. Yun, S. Lee, J. Shin, J.Kim, R. Ghaffari and J. A. Rogers, Small, 2018, 14, e1802876.
14 H. M. Emrich, E. Stoll, B. Friolet, J. P. Colombo, R.Richterich and E. Rossi, Pediatr. Res., 1968, 2, 464–478.
15 M. J. Buono, K. D. Ball and F. W. Kolkhorst, J. Appl. Physiol.,2007, 103, 990–994.
16 C. T. Huang, M. L. Chen, L. L. Huang and I. F. Mao, Chin. J.Physiol., 2002, 45, 109–115.
17 A. S. Levey, J. P. Bosch, J. B. Lewis, T. Greene, N. Rogers andD. Roth, Ann. Intern. Med., 1999, 130, 461–470.
18 D. J. van Veldhuisen, L. M. Ruilope, A. S. Maisel and K.Damman, Eur. Heart J., 2016, 37, 2577–2585.
19 J. P. Kassirer, N. Engl. J. Med., 1971, 285, 385–389.20 U. Lad, S. Khokhar and G. M. Kale, Anal. Chem., 2008, 80,
7910–7917.21 A. Tricoli and G. Neri, Sensors, 2018, 18, 942.22 R. W. Keller, J. L. Bailey, Y. H. Wang, J. D. Klein and J. M.
Sands, Physiol. Rep., 2016, 4, e12825.23 Y. Y. AlTamer, E. A. Hadi and I. E. I. AlBadrani, Urol. Res.,
1997, 25, 337–340.24 T. C. Boysen, S. Yanagawa, F. Sato and K. Sato, J. Appl. Physiol.:
Respir., Environ. Exercise Physiol., 1984, 56, 1302–1307.25 V. F. Curto, C. Fay, S. Coyle, R. Byrne, C. O'Toole, C. Barry, S.
Hughes, N. Moyna, D. Diamond and F. Benito-Lopez, Sens.Actuators, B, 2012, 171, 1327–1334.
26 M. J. Patterson, S. D. R. Galloway and M. A. Nimmo, ActaPhysiol. Scand., 2002, 174, 41–46.
27 R. M. Morgan, M. J. Patterson and M. A. Nimmo, ActaPhysiol. Scand., 2004, 182, 37–43.
Lab on a ChipPaper
Publ
ishe
d on
12
Mar
ch 2
019.
Dow
nloa
ded
by U
nive
rsity
of
Mis
sour
i-C
olum
bia
on 4
/23/
2019
4:5
5:55
PM
. View Article Online

Lab Chip, 2019, 19, 1545–1555 | 1555This journal is © The Royal Society of Chemistry 2019
28 N. Nakanishi, M. Fukui, M. Tanaka, H. Toda, S. Imai, M.Yamazaki, G. Hasegawa, Y. Oda and N. Nakamura, KidneyBlood Pressure Res., 2012, 35, 77–81.
29 E. Gallardo and J. A. Queiroz, Biomed. Chromatogr., 2008, 22,795–821.
30 W. Gao, S. Emaminejad, H. Y. Y. Nyein, S. Challa, K. V.Chen, A. Peck, H. M. Fahad, H. Ota, H. Shiraki, D. Kiriya,D. H. Lien, G. A. Brooks, R. W. Davis and A. Javey, Nature,2016, 529, 509–514.
31 A. J. Bandodkar and J. Wang, Trends Biotechnol., 2014, 32,363–371.
32 D. H. Kim, N. S. Lu, R. Ma, Y. S. Kim, R. H. Kim, S. D.Wang, J. Wu, S. M. Won, H. Tao, A. Islam, K. J. Yu, T. I.Kim, R. Chowdhury, M. Ying, L. Z. Xu, M. Li, H. J. Chung, H.Keum, M. McCormick, P. Liu, Y. W. Zhang, F. G. Omenetto,Y. G. Huang, T. Coleman and J. A. Rogers, Science,2011, 333, 838–843.
33 J. Kim, A. Banks, H. Y. Cheng, Z. Q. Xie, S. Xu, K. I. Jang,J. W. Lee, Z. J. Liu, P. Gutruf, X. Huang, P. H. Wei, F. Liu, K.Li, M. Dalal, R. Ghaffari, X. Feng, Y. G. Huang, S. Gupta, U.Paik and J. A. Rogers, Small, 2015, 11, 906–912.
34 J. D. Pegan, J. Zhang, M. Chu, T. Nguyen, S. J. Park, A. Paul,J. Kim, M. Bachman and M. Khine, Nanoscale, 2016, 8,17295–17303.
35 T. Yokota, P. Zalar, M. Kaltenbrunner, H. Jinno, N.Matsuhisa, H. Kitanosako, Y. Tachibana, W. Yukita, M.Koizumi and T. Someya, Sci. Adv., 2016, 2, e1501856.
36 S. B. Kim, Y. Zhang, S. M. Won, A. J. Bandodkar, Y. Sekine,Y. G. Xue, J. Koo, S. W. Harshman, J. A. Martin, J. M. Park,T. R. Ray, K. E. Crawford, K. T. Lee, J. Choi, R. L. Pitsch, C. C.Grigsby, A. J. Strang, Y. Y. Chen, S. Xu, J. Kim, A. Koh, J. S.Ha, Y. G. Huang, S. W. Kim and J. A. Rogers, Small, 2018, 14,1703334.
37 Y. Sekine, S. B. Kim, Y. Zhang, A. J. Bandodkar, S. Xu, J.Choi, M. Irie, T. R. Ray, P. Kohli, N. Kozai, T. Sugita, Y. X.Wu, K. Lee, K. T. Lee, R. Ghaffari and J. A. Rogers, Lab Chip,2018, 18, 2178–2186.
38 A. Hoshi, H. Watanabe, M. Kobayashi, M. Chiba, Y. Inaba,N. Kimura and T. Ito, Tohoku J. Exp. Med., 2001, 195,163–169.
39 A. Koh, D. Kang, Y. Xue, S. Lee, R. M. Pielak, J. Kim, T.Hwang, S. Min, A. Banks, P. Bastien, M. C. Manco, L. Wang,K. R. Ammann, K. I. Jang, P. Won, S. Han, R. Ghaffari, U.Paik, M. J. Slepian, G. Balooch, Y. G. Huang and J. A. Rogers,Sci. Transl. Med., 2016, 8, 366ra165.
40 J. Choi, D. Kang, S. Han, S. B. Kim and J. A. Rogers, Adv.Healthcare Mater., 2017, 6, 1601355.
41 M. Jaffé, Z. Physiol. Chem., 1886, 10, 391–400.42 M. J. Welch, A. Cohen, H. S. Hertz, K. J. Ng, R. Schaffer, P.
Van der Lijn and E. t. White, Anal. Chem., 1986, 58,1681–1685.
43 D. Tsikas, A. Wolf, A. Mitschke, F. M. Gutzki, W. Will andM. Bader, J. Chromatogr. B: Anal. Technol. Biomed. Life Sci.,2010, 878, 2582–2592.
44 J. A. Muñoz, M. López-Mesas and M. Valiente, Talanta,2010, 81, 392–397.
45 H. Crocker, M. D. Shephard and G. H. White, J. Clin. Pathol.,1988, 41, 576–581.
46 T. K. With, Acta Physiol. Scand., 1945, 10, 355–365.47 J. S. Wang, Y. Gao, D. W. Dorshorst, F. Cai, M. Bremer, D.
Milanowski, T. L. Staton, S. S. Cape, B. Dean and X. Ding,J. Pharm. Biomed. Anal., 2017, 133, 96–104.
48 M. Czauderna and J. Kowalczyk, Czech J. Anim. Sci., 2012, 57,19–27.
49 L. Liu, H. Mo, S. Wei and D. Raftery, Analyst, 2012, 137,595–600.
50 Y. P. Chen, B. Liu, H. T. Lian and X. Y. Sun, Electroanalysis,2011, 23, 1454–1461.
51 W. O. Ho, S. Krause, C. J. McNeil, J. A. Pritchard, R. D.Armstrong, D. Athey and K. Rawson, Anal. Chem., 1999, 71,1940–1946.
52 R. Sha, K. Komori and S. Badhulika, Electrochim. Acta,2017, 233, 44–51.
53 J. L. Orsonneau, C. Massoubre, M. Cabanes and P.Lustenberger, Clin. Chem., 1992, 38, 619–623.
54 Z. F. Gao, E. E. Sann, X. D. Lou, R. Y. Liu, J. Dai, X. L. Zuo,F. Xia and L. Jiang, NPG Asia Mater., 2018, 10, 177–189.
55 L. Li, Y. Long, J. M. Gao, K. Song and G. Q. Yang, Nanoscale,2016, 8, 4458–4462.
56 P. T. Vasdudevan and Y. Gokarn, Appl. Biochem. Biotechnol.,1996, 60, 49–61.
57 J. Kim, T. N. Cho, G. Valdes-Ramirez and J. Wang, Talanta,2016, 150, 622–628.
58 M. Fidaleo and R. Lavecchia, Chem. Biochem. Eng. Q.,2003, 17, 311–318.
59 H. Lee, T. K. Choi, Y. B. Lee, H. R. Cho, R. Ghaffari, L.Wang, H. J. Choi, T. D. Chung, N. S. Lu, T. Hyeon, S. H.Choi and D. H. Kim, Nat. Nanotechnol., 2016, 11, 566–572.
60 M. Pearcy, S. Robinson, D. I. Miller, J. T. Thomas, Jr. and J.Debrota, J. Appl. Physiol., 1956, 8, 621–626.
61 W. F. Clark, J. M. Sontrop, S. H. Huang, L. Moist, N. Boubyand L. Bankir, Am. J. Nephrol., 2016, 43, 281–292.
62 P. Salvo, F. Di Francesco, D. Costanzo, C. Ferrari, M. G.Trivella and D. De Rossi, IEEE Sens. J., 2010, 10, 1557–1558.
63 S. Coyle, D. Morris, K. Lau, D. Diamond, N. Taccini, D.Costanzo, P. Salvo, F. D. Francesco, M. G. Trivella, J. Porchetand J. Luprano, Proc. of 3rd Int. Conf. on IEEE PervasiveComputing Technologies for Healthcare, 2009, 1–6.
64 N. A. Taylor and C. A. Machado-Moreira, Extrem. Physiol.Med., 2013, 2, 4.
65 H. Cho, H. Y. Kim, J. Y. Kang and T. S. Kim, J. ColloidInterface Sci., 2007, 306, 379–385.
66 X. Q. Zhao, S. H. Zeisel and S. C. Zhang, Electrophoresis,2015, 36, 2207–2214.
67 G. C. Randall and P. S. Doyle, Proc. Natl. Acad. Sci. U. S. A.,2005, 102, 10813–10818.
68 N. L. Post, F. Riebel, A. Zhou, T. Keller, S. W. Case and J. J.Lesko, J. Compos. Mater., 2009, 43, 75–96.
Lab on a Chip Paper
Publ
ishe
d on
12
Mar
ch 2
019.
Dow
nloa
ded
by U
nive
rsity
of
Mis
sour
i-C
olum
bia
on 4
/23/
2019
4:5
5:55
PM
. View Article Online