Embed Size (px)
Citation preview
arX
iv:a
stro
-ph/
0306
129v
1 5
Jun
200
3Draft version November 1, 2018
Preprint typeset using LATEX style emulateapj v. 11/12/01
CHANDRA DISCOVERY OF AN X-RAY JET AND EXTENDED X-RAY STRUCTURE IN Z=0.63QUASAR, B2 0738+313
Aneta Siemiginowska1, Carlo Stanghellini2, Gianfranco Brunetti3, Fabrizio Fiore4,Thomas L. Aldcroft1, Jill Bechtold5, Martin Elvis1 Stephen S. Murray1 L.A.
Antonelli4 & S. Colafrancesco4
1 Harvard-Smithsonian Center for Astrophysics2 IRA-CNR, Noto, Italy
3 IRA-CNR Bologna, Italy4 INAF - Osservatorio Astronomico di Roma, Italy
5 Steward Observatory, University of [email protected] version November 1, 2018
ABSTRACT
We have made a ∼ 30 ksec Chandra observation of the redshift z=0.63 GPS quasar B2 0738+313. Wedetected X-ray emission from the core and have discovered a 200 kpc (projected on the sky) X-ray jet.The X-ray jet is narrow and curves, following the extended radio structure to the south of the quasar,and ending with a hot spot at the southernmost part of the radio lobe. The jet has a knot at ∼ 13arcsec away from the core. The knot emission is consistent with the X-rays being created by the inverseCompton scattering of the cosmic microwave background (CMB) photons and requires jet bulk Lorentzfactors of a few (Γbulk ∼ 5− 7). We discuss the emission mechanisms that may be responsible for the jetemission. We present new VLA data of the core and jet, and discuss the relation between the extendedradio and X-ray emission. Extended emission observed in several GPS sources has been interpreted asa signature of the source past activity, while the GPS source is young and newly expanded. We arguethat B2 0738+313 may be an example of a new class of radio sources similar to the FRII radio galaxiesin their high jet bulk velocities, but with the powerful GPS-like nucleus.B2 0738+313 also has two damped Lyman-α systems along the line of sight, at zabs = 0.0912 and
0.2212. We discuss the possible connection between the X-ray absorption (7.2±0.9×1020 cm−2) detectedin the ACIS spectrum and these two intervening absorbers. We also investigate an extended structurewithin the central 10 arcsec of the core in the relation to structure seen in the optical.
Subject headings: Quasars: individual (B2 0738+313) – galaxies: jets – X-Rays: Galaxies
1. introduction
GigaHertz-Peaked Spectrum (GPS) and Compact SteepSpectrum (CSS) sources compose a significant fractionof the bright radio source population (10-20%, O’Deaet al. 1998). However, because this classification isbased entirely on the spectral shape in the radio band,the GPS/CSS sample is heterogeneous and contains bothgalaxies and quasars with a range of luminosities andmorphology. Until recently, most GPS/CSS sources werethought to be very compact with the radio emission con-tained within ∼ 1 − 10 kpc of the core. About ∼ 25% ofGPS/CSS sources exhibit faint extended radio emission onscales larger than the size of the host galaxy (Baum et al1990, Stanghellini et al 1990, O’Dea 1998, Fanti et al 2001)with only a few sources showing any radio structures onMpc scales (Schoenmakers et al 1999, Siemiginowska et al2002, Marecki et al 2002). This extended radio emissionis amorphous or jet-like, but is usually hard to classify be-cause of being weak. A detection of a faint radio structurein the vicinity of a strong GPS/CSS core requires difficult,high dynamic range observations and careful data analy-sis. Even then the extended emission may be difficult todetect.The unprecedented sub-arcsecond resolution (Van Spey-
broeck et al, 1997) of the Chandra X-ray Observatory(Weisskopf et al 2002) gives us, for the first time, the
opportunity to study details of the X-ray structures inthe vicinity of AGN and quasars. Discoveries of manyX-ray jets associated with radio sources show that X-rayjets have large bulk Lorentz factors (Γbulk ∼ 3 − 10) athundred kpc distances from the nucleus. Recent Chandraobservations (Schwartz et al 2000, Tavecchio et al. 2000;Celotti et al. 2001; Siemiginowska et al. 2002; Brunettiet al. 2002, Sambruna et al. 2002) have shown that ifeven mildly relativistic plasma is present in a jet with highbulk velocity then it can result in a strong X-ray emission.The cosmic microwave background (CMB) photons Comp-ton scatter off relatively low energy relativistic electrons(γ ∼ 10 − 300) within a jet creating X-rays. Both highΓbulk and the increased energy density of the CMB radia-tion (as (1+z)4) contribute to the final X-ray intensity (seeCelotti et al 2001, Harris & Krawczynski 2002, Schwartz2002). Thus X-rays provide a good indicator of the largescale environment of GPS quasars revealing jets or dif-fuse cluster emission at high redshift (Siemiginowska et al2003) allowing a differention between truly compact and“extended” sources within the GPS/CSS sample. The re-liable separation of jet dominated GPS/CSS sources fromothers in this heterogeneous class may clarify the nature ofnon jet dominated GPS/CSS sources. At the end of Sec-tion 7.1 we discuss the similarities between B2 0738+313and other core dominated quasars and the implications ofour observation on the classification of this source.
1
2 Siemiginowska et al.
B2 0738+313 (OI 363) is a redshift z=0.63 radio-loudquasar with a peak in its radio spectrum at ∼5 GHz.B2 0738+313 is a low polarization quasar. The radiostructure (Stanghellini et al. 1997, 2001, Kellermann etal. 1998) shows a jet on the milliarcsecond scale. Thejet is elongated towards the south for about 5 milliarcsec(> 45 parsecs at z=0.63). It then bends by about 45 de-grees in the south-west direction, where it is visible forother 5 milliarcseconds. A bright knot is located at thejet’s bend. Murphy et al. (1993) and Stanghellini et.al.(1998) presented a VLA radio map which shows a faint ra-dio structure on the arcmin scale, extending north-southin both directions from the core.B2 0738+313 has also two intervening damped Lyman-α
absorption systems (DLA) along the line of sight at red-shifts 0.0912 and 0.2212 (Rao & Turnshek 1998). Theselarge column density systems can produce significant lowenergy X-ray absorption (Bechtold et al 2001, Turnshek etal 2003). There is no Lyman-α absorption at the quasarredshift.We observed B2 0738+313 with Chandra in order to
study both extended X-ray emission indicated by theROSAT HRI imaging, and to search for absorption possi-bly related to the DLA systems. Here we present the re-sults of both ROSAT and Chandra observations. In Chan-dra we detect a curved X-ray jet which extends ∼ 35′′ awayfrom the quasar. We also detect symmetric, extended X-ray emission within 10′′ of the quasar in the Chandra data.We have obtained new VLA radio data, and combined
previously published data to study B2 0738+313 at dif-ferent frequencies and antenna configurations. We discussthe correlation between radio and X-ray structures. Wemodel the radio to X-ray jet emission, and discuss theimplications for possible emission processes. Synchrotronemission can explain the hot spot located at the furthestdistance from the quasar core. The emission from the knotat ∼ 13′′ from the nucleus requires an additional compo-nent and we argue that the interactions between the rela-tivistic particles and the CMB photons are responsible forthe observed X-ray flux.We discuss briefly the X-ray spectrum of the quasar core,
its luminosity and absorption column. We consider a pos-sibility that the observed absorption is related to one orboth of the two DLA systems. We also compare the X-raystructure within ∼ 10′′ from the core to optical images anddiscuss their possible relation to the DLA galaxies.We assume H0=75 km sec−1Mpc−1, q0 = 0.5 (1 arcsec
∼ 5.6 kpc). Adopting the best fit cosmological parametersimplied by the recent WMAP results (Spergel et al. 2003)H0=71 km sec−1Mpc−1, Ωλ=0.7, and ΩM=0.3 changesthe luminosity distance by about 10%.
2. x-ray data
Table 1 lists the dates of the X-ray observations. Thepurpose of the ROSAT HRI (Rontgen Satellite High-Resolution Imager1) imaging of B2 0738+313 in 1994 wasto search for the extended X-ray emission surrounding thesource. The only published results from this observation isthe conference contribution of Antonelli and Fiore (1997).There is a hint of the extended emission in the ∼ 3′′ res-olution image which prompted us to ask for the higher
resolution Chandra observations. Here we present boththe analysis and results of the ROSAT HRI observationsand the new Chandra results.
2.1. ROSAT HRI observations
The ROSAT HRI observation was taken on April 5-12,1994 with total exposure time of 47,508 sec. HRI sourcecounts were accumulated in channels 2-12, to reduce thebackground and possible UV contamination and were ex-tracted from a circle with 20 arcsec radius. Backgroundwas extracted in two ways: from annuli of inner and outerradii: 0.4’-0.8’ and 1.7’-2.1’ and from boxes of various sizes,from 20′′ to 3′ on side, around the quasar. Point sourceswith signal to noise ratio > 3 were excluded from the back-ground regions. Different background regions gave essen-tially the same results. We obtain 860±30 source counts(within 20 arcsec radius circle) corresponding to the countrate of 0.018 counts sec−1 with the background level of1.04×10−6 counts sec−1 arcsec−2 (e.g. 62 counts within20 arcsec radius circle).The ROSAT HRI observations were obtained over the
span of a few days. There are groups of contiguous data(several OBIs, Observation Intervals) separated by gapsof 0.5-1 days. To search for systematic aspect-related er-rors we examined the HRI images from separate groupsof contiguous OBIs. Each image contains between 80 and200 counts. The faintness of the quasar count rate pre-vents a finer splitting of the data (as in Morse et al. 1995)since the error on the centroid position is of the order of afew arcsec (∼ 2 arcsec) for images with about 80 counts.We found no evidence for a systematic shift of the imagecentroids between each data set and therefore no artifi-cial broadening in the final image. The final location ofthe centroid is offset from the optical position by 1.9 arc-sec which is within a typical accuracy (∼ 2 arcsec) of thesource location obtained with ROSAT HRI.To check for residual spurious broadening of the HRI
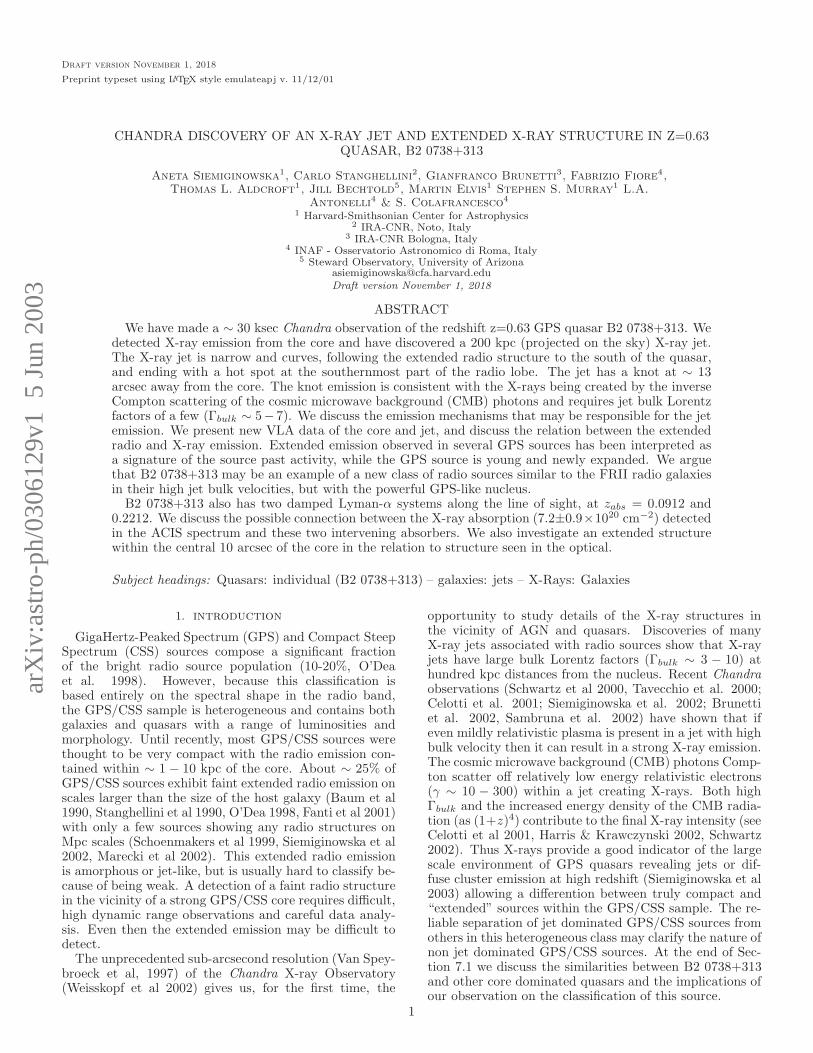
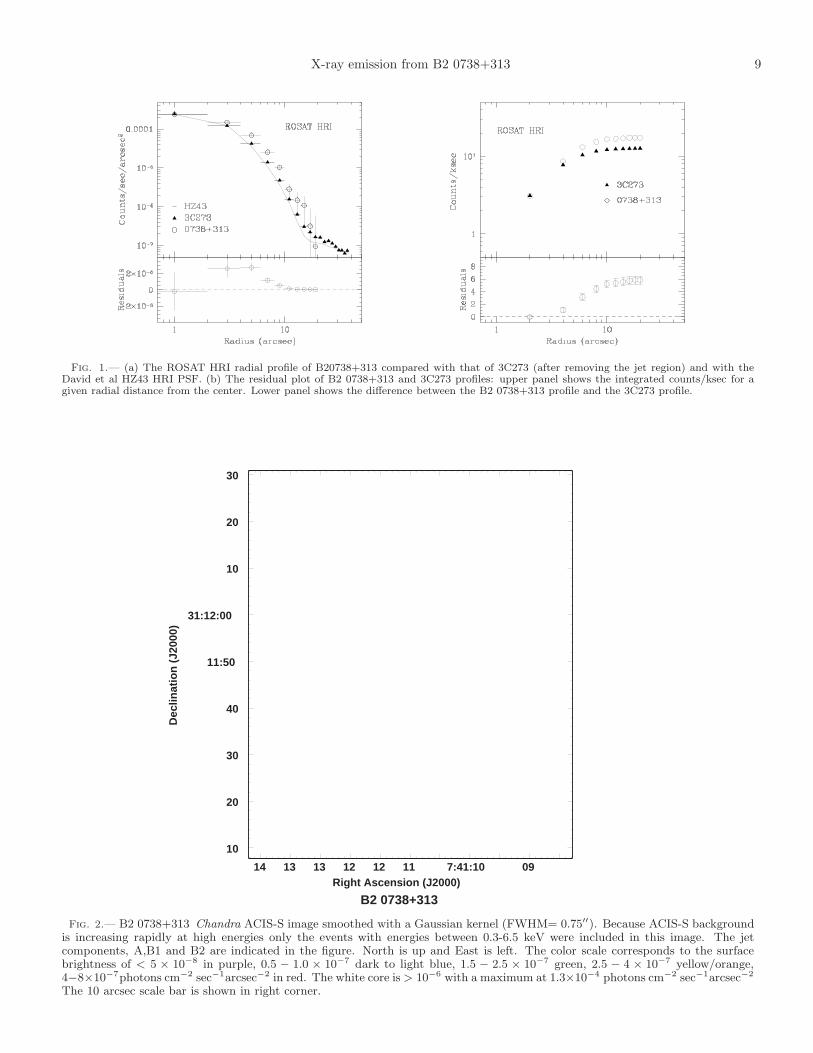
PSF we analyzed the observation of the bright quasar3C273. 3C273 is a point-like source except for the jetemission and therefore can be used to evaluate the pa-rameterization of the HRI PSF. In figure 1a we showthe radial profile of B2 0738+313 compared with thatof 3C273 (after removing the jet region) and with theHRI PSF, as parameterized by David et al (1993). Theprofile of 3C273 differs slightly from the HRI PSF be-yond about 5 arcsec radius. This broadening is likely tobe due to residual systematic uncertainties in the aspectsolution as a function of time, as the satellite wobbledback and forth by several arcmin. The excess of countsin 3C273 with respect to the PSF is ∼ 20% between 5and 10 arcsec and ∼ 45% between 10 and 20 arcsec. ForB2 0738+313 the excess of counts with respect to the PSFis 110± 15% between 5 and 10 arcsec and 190± 70% be-tween 10 and 20 arcsec. We therefore conclude that signifi-cant extended emission is present in B20738+313 on scalesfrom 5 to about 20 arcsec, where the source starts to be-come fainter than the background. This is shown moreclearly in the residual plot of Figure 1b, where we plotintegrated counts at a given radius away from the centerfor both B2 0738+313 and 3C273 and show the differencebetween both profiles. We estimated the count rate in
1 http://heasarc.gsfc.nasa.gov/docs/rosat/rosdocs.html
X-ray emission from B2 0738+313 3
the extended emission to be within 4.8-5.8 counts ksec−1,which is about 30% of the total quasar count rate. Theobserved 0.1-2 keV flux in the extended component is oforder 1.6×10⁻¹³ergs cm2 sec−1, which corresponds to therest frame luminosity of 1.5×1044ergs sec−1.The Chandra observation described in the next section
allowed further investigation of the extended emission seenin the HRI data.
2.2. Chandra ACIS-S Observations
We observed B2 0738+313 for 27,600 seconds with thespectroscopic array of the Chandra Advanced CCD Imag-ing Spectrometer (ACIS-S, Wiesskopf et al 2002) on 2000October 10 (ObsID 377) without any transmission gratingin place. The source was located on the back illuminatedchip (S3) and offset by ∼ 35′′ from the default aim pointposition to avoid the node boundary (Chandra Proposers’Observatory Guide, POG, 2000). Chandra ACIS-S3 datawere reprocessed with the pipeline version 6.0.1 on June13, 2001. We have used the reprocessed data and cali-bration files available in CALDB v.2.9. We note that theaspect uncertainty on the absolute position is less than∼ 0.5′′ and the uncertainty of the aspect solution is lessthan ∼ 0.1′′ (Aldcroft et al 2000). The PSF FWHM atthe quasar core is about 0.75′′. The X-ray position of thequasar (J2000: 07:41:10.7 +31:12:00.2) agrees with the op-tical position (Johnston et al 1995) to better than 1′′, asexpected given the quality of the Chandra aspect solution(Aldcroft et al 2000). We used CIAO (version 2.2 2) soft-ware to analyze the data.The extended emission detected with the ROSAT HRI
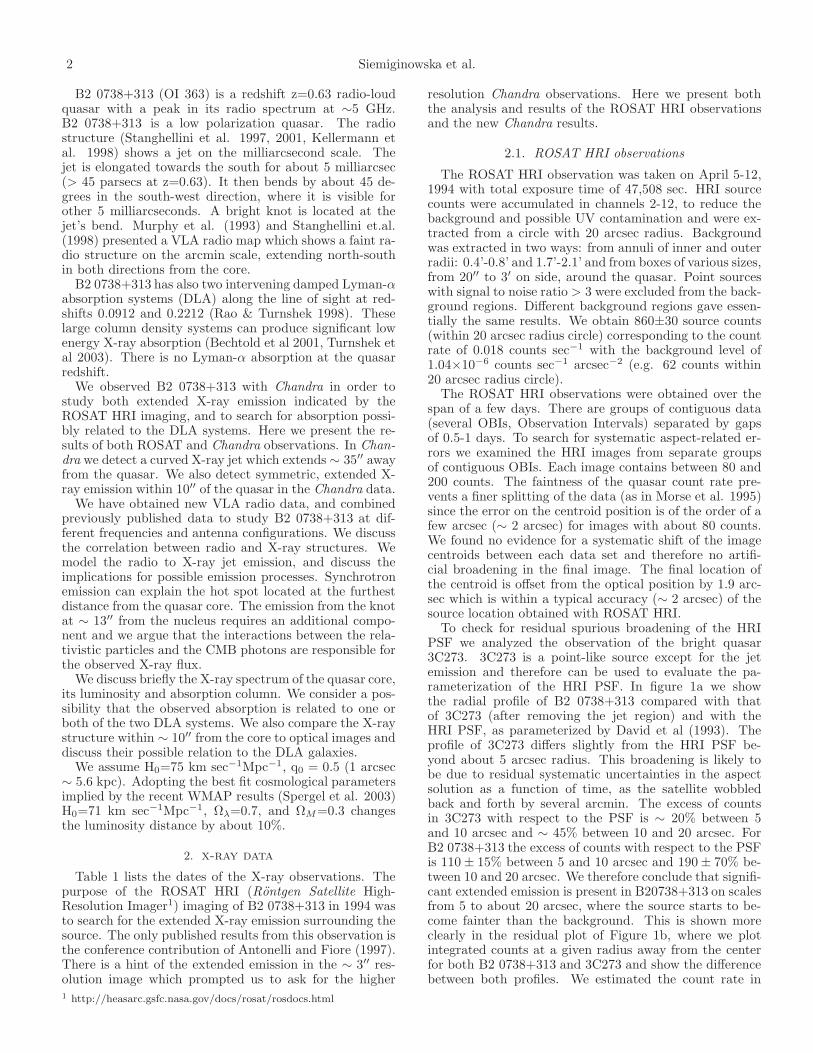
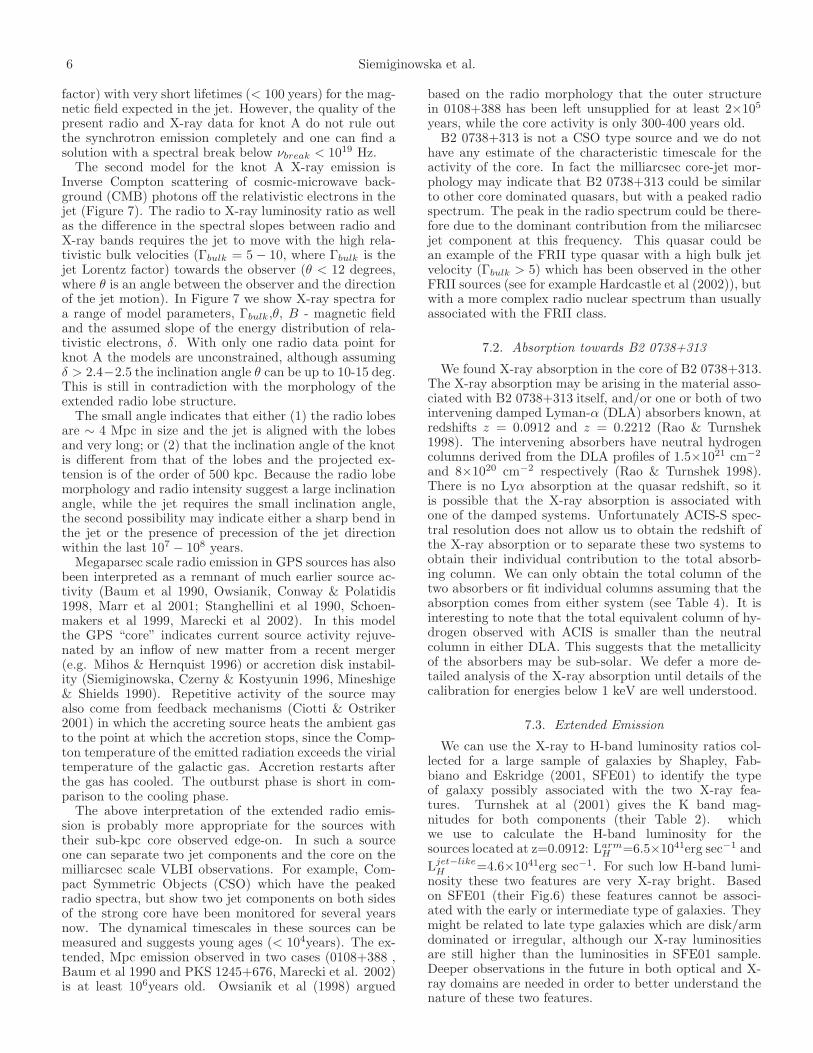
observations is resolved into smaller structures in theChandra ACIS-S data. Here we can clearly identify thebright quasar, a few features within 3-10 arcsec from thequasar and the curved jet extending up to ∼ 35′′ into theSouth-East.A smoothed image of B2 0738+313 in 0.3-6.5 keV is
shown in Figure 2. The original event file was binned (into1/3 of ACIS-S pixel size = 0.164′′), divided by the expo-sure map to obtain a surface brightness image and thensmoothed with the Gaussian kernel (FWHM=0.75′′). Theintensity in the image (Figure 2) has been scaled logarith-mically to emphasize the faint jet emission. The smallChandra Point Spread Function (PSF), especially the lowpower in the scattering wings (r > 1′′), allows for a highdynamic range image, which is essential to the detectionand resolution of the extended structure. A total of 3,691counts was detected in the quasar core (for a 2.7 arcsecradius of the circular extraction region) and 124 counts inthe jet (assuming a polygon region along the jet). Thus,the total jet emission is ∼ 30 times fainter than the coreand the individual components in the jet are ∼ 100 timesfainter than the core.
3. vla data and radio morphology
B2 0738+313 has been observed at the VLA 3 with var-ious configurations and frequencies (see Table 1). The Bconfiguration data at 1.36 and 1.66 GHz were taken dur-ing 2 observing sessions on August 22, 1998 and September
21, 1998. We did not use September 21, 1998 data in theanalysis, because they were of poor quality due to stronginterferences across the observing band. The C configu-ration data were taken on July 26, 1997 at 4.5, 4.9, 8.0and 8.4 GHz. Two or three ∼5 minutes snapshots havebeen obtained at different hour angles for each data set toimprove the UV coverage. To improve the resolution atlow frequency we also made use of a short ∼10 minutesobservation on August 10, 1999, at 1.36 GHz in A con-figuration. Calibration, self-calibration and imaging hasbeen done in AIPS following the standard procedures. Toimprove the resolution and to better disentangle the morecompact emitting regions from the diffuse emission, whilepreserving the good sensitivity the images at 1.36 GHzand 1.66 GHz were made with a tempered uniform weight-ing (ROBUST 0 in task IMAGR in AIPS), while at otherfrequencies (not shown) they were made with a naturalweighting to maximize the sensitivity.High dynamic range data are necessary to measure the
low brightness structure in the presence of a very strongcomponent. After several iterations of self calibration andclean/restore procedure, we have achieved an r.m.s. noiseclose to the thermal noise (< 0.1mJy) in most of the field-of-view. This corresponds to a peak to r.m.s. noise ratio of>20000, but the removal of the side lobes is less accurateclose to the strong core emission (∼ 2Jy at 1.3/1.6 GHz,∼ 4 Jy at 4.7/8.2 GHZ), resulting in confusion betweenthe true emission and some residual side lobes. This maybe particularly true at 1.66 GHz which is known to be afrequency plagued by interference at the VLA. In additionit is hard to separate the contributions of the compactcomponents from the diffuse lobe emission.We have made images at different resolutions cutting or
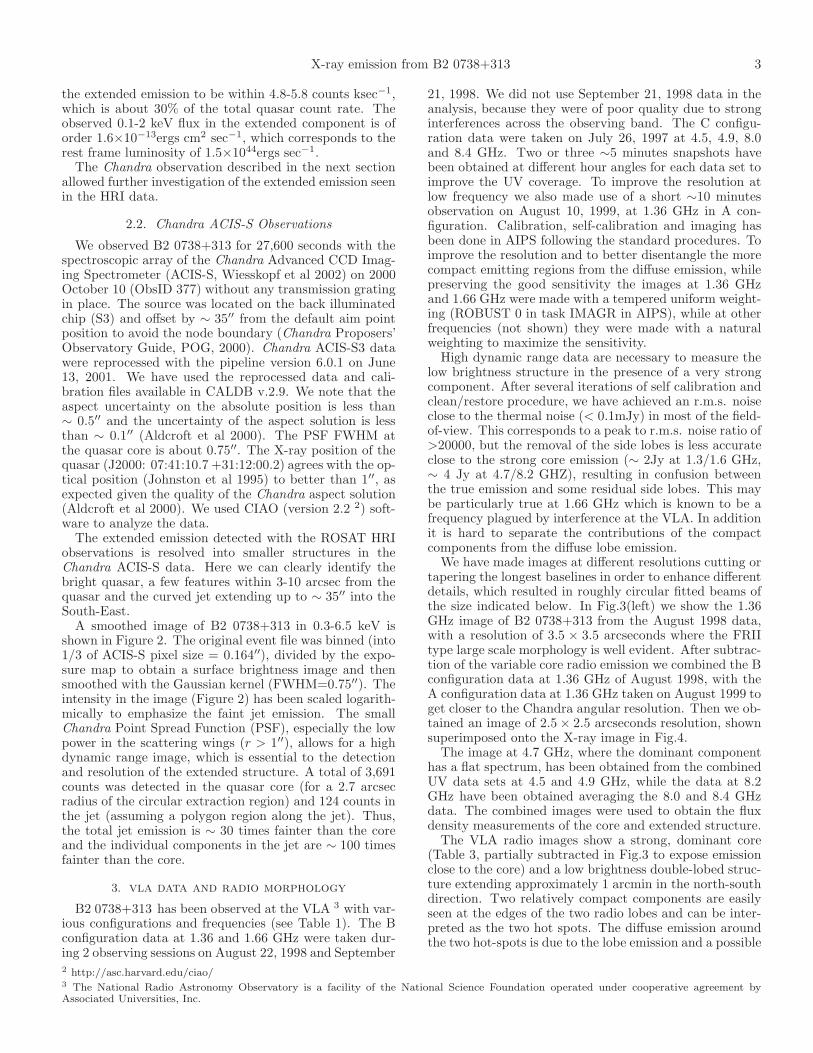
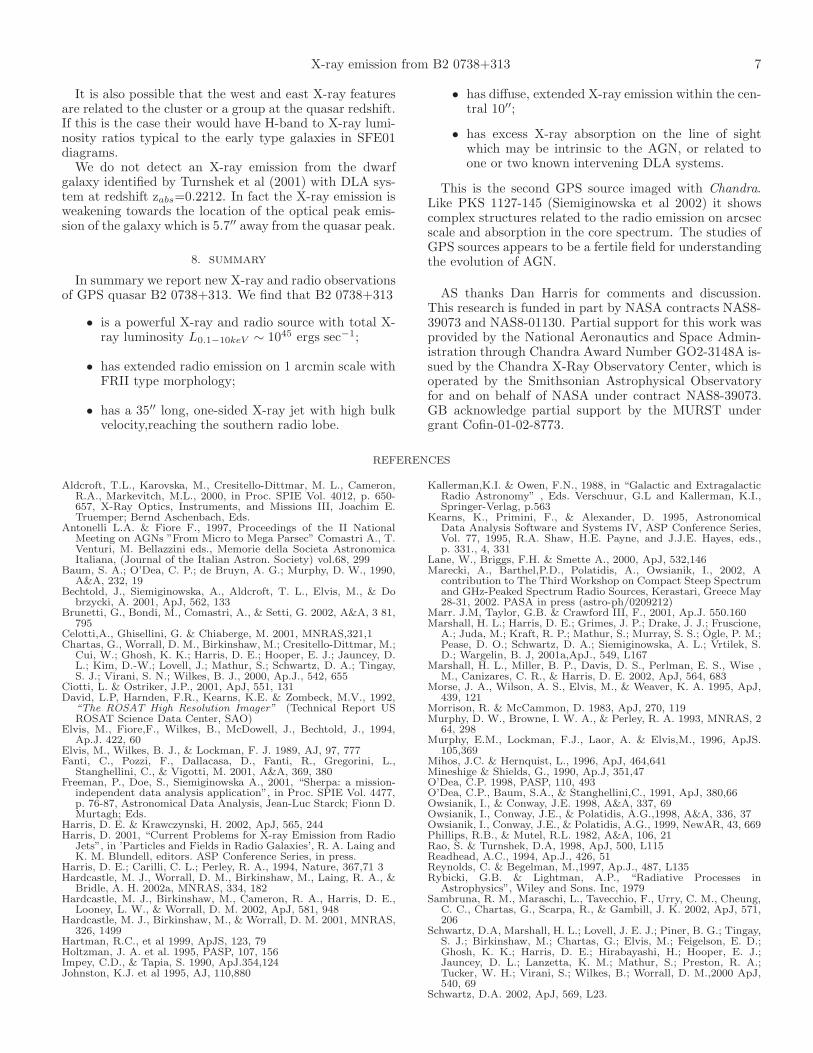
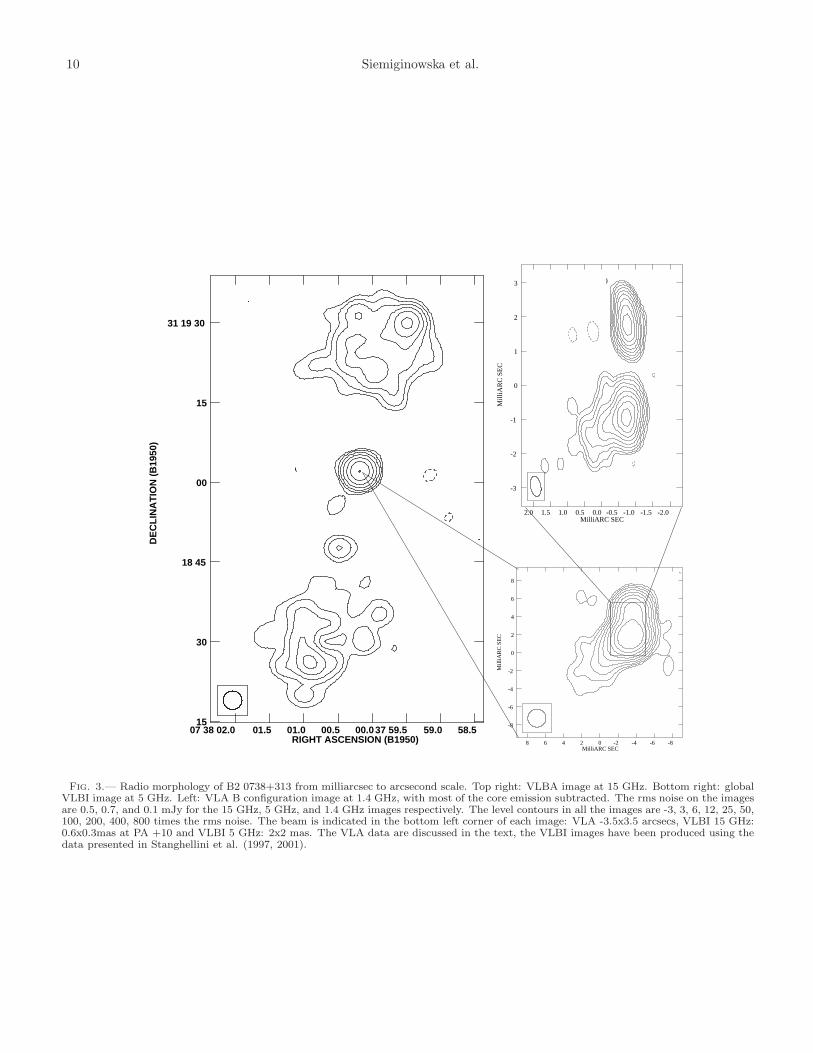
tapering the longest baselines in order to enhance differentdetails, which resulted in roughly circular fitted beams ofthe size indicated below. In Fig.3(left) we show the 1.36GHz image of B2 0738+313 from the August 1998 data,with a resolution of 3.5 × 3.5 arcseconds where the FRIItype large scale morphology is well evident. After subtrac-tion of the variable core radio emission we combined the Bconfiguration data at 1.36 GHz of August 1998, with theA configuration data at 1.36 GHz taken on August 1999 toget closer to the Chandra angular resolution. Then we ob-tained an image of 2.5× 2.5 arcseconds resolution, shownsuperimposed onto the X-ray image in Fig.4.The image at 4.7 GHz, where the dominant component
has a flat spectrum, has been obtained from the combinedUV data sets at 4.5 and 4.9 GHz, while the data at 8.2GHz have been obtained averaging the 8.0 and 8.4 GHzdata. The combined images were used to obtain the fluxdensity measurements of the core and extended structure.The VLA radio images show a strong, dominant core
(Table 3, partially subtracted in Fig.3 to expose emissionclose to the core) and a low brightness double-lobed struc-ture extending approximately 1 arcmin in the north-southdirection. Two relatively compact components are easilyseen at the edges of the two radio lobes and can be inter-preted as the two hot spots. The diffuse emission aroundthe two hot-spots is due to the lobe emission and a possible
2 http://asc.harvard.edu/ciao/3 The National Radio Astronomy Observatory is a facility of the National Science Foundation operated under cooperative agreement byAssociated Universities, Inc.
4 Siemiginowska et al.
contribution from the jet. Previous VLA A configurationobservations (Stanghellini et al. 1998) did not reveal theextended lobes because they were shorter snapshots andbecause the longer baselines of the A configuration are lesssensitive to extended emission.The dominant radio core component is resolved in VLBI
images into the core-jet structure shown in Fig.3(right)(Stanghellini et al 1997, 2001) suggesting that the coreemission is a result of the inner jet emission relativisticallyboosted towards us.
4. jet morphology and spectra
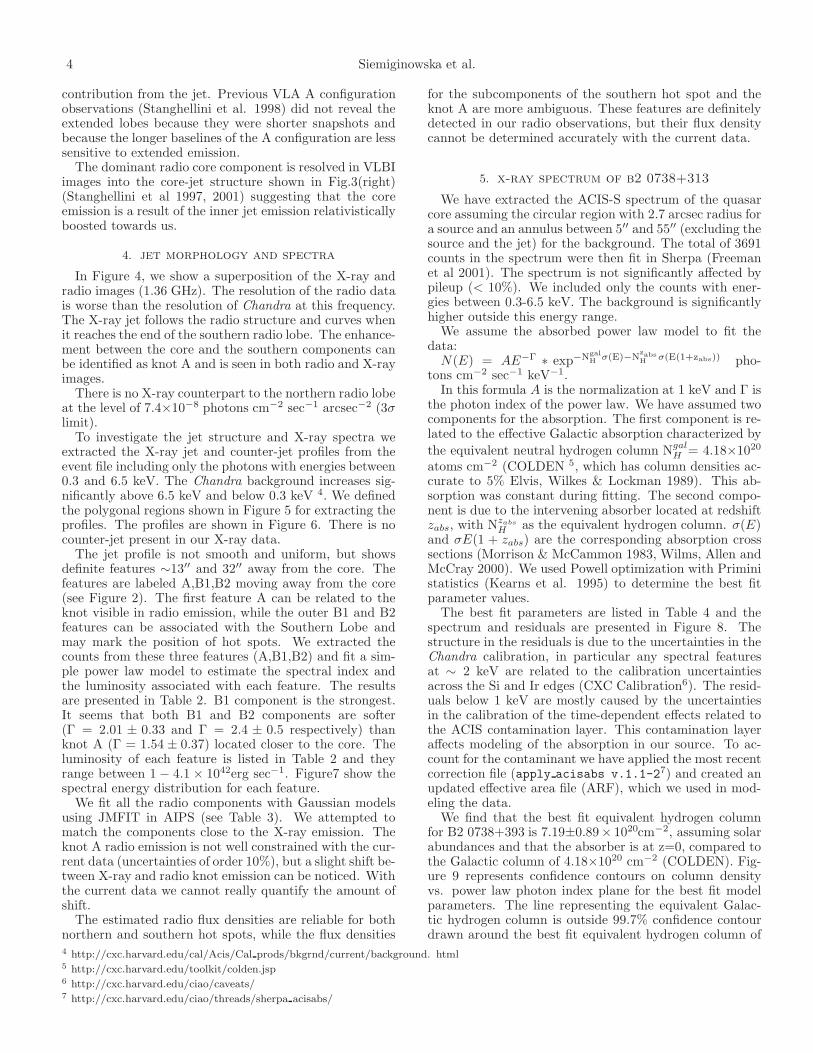
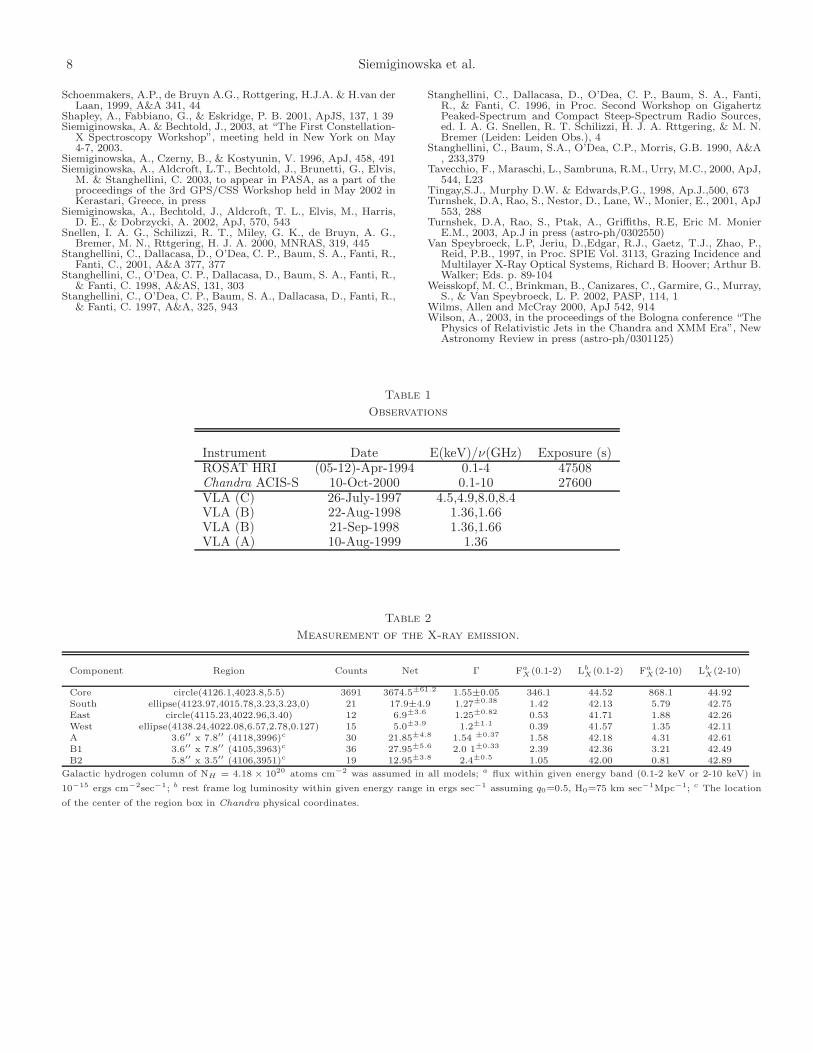
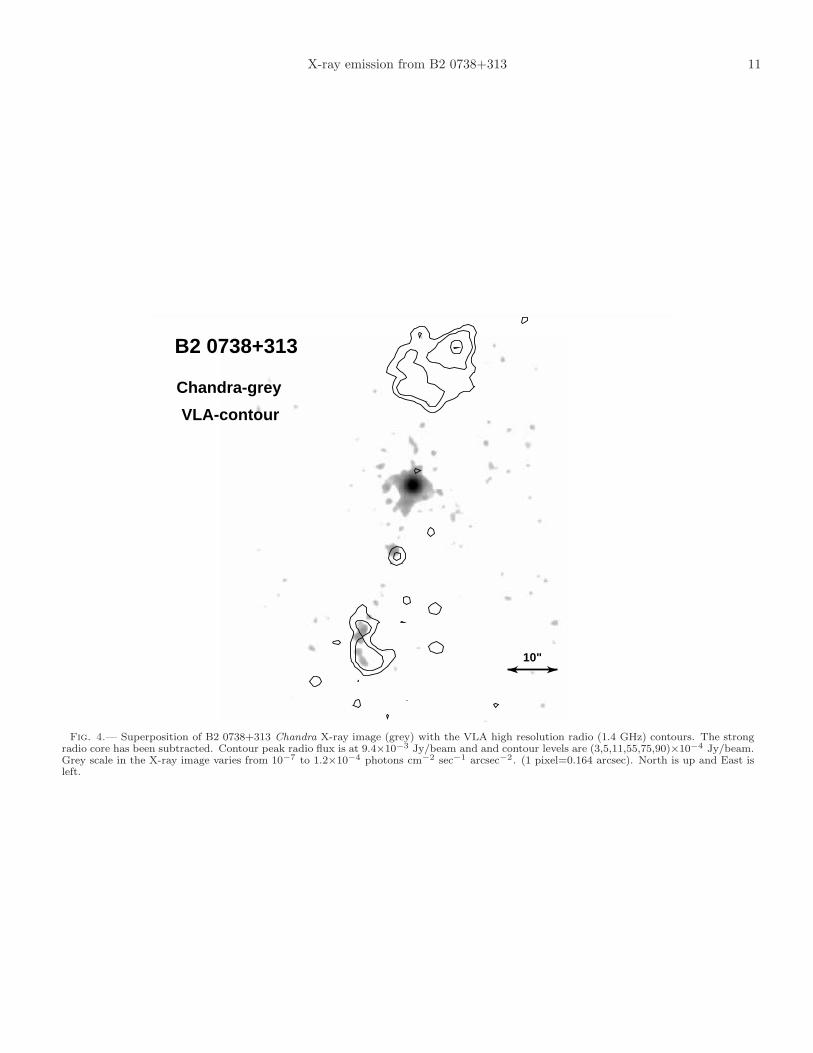
In Figure 4, we show a superposition of the X-ray andradio images (1.36 GHz). The resolution of the radio datais worse than the resolution of Chandra at this frequency.The X-ray jet follows the radio structure and curves whenit reaches the end of the southern radio lobe. The enhance-ment between the core and the southern components canbe identified as knot A and is seen in both radio and X-rayimages.There is no X-ray counterpart to the northern radio lobe
at the level of 7.4×10⁻⁸ photons cm−2 sec−1 arcsec−2 (3σlimit).To investigate the jet structure and X-ray spectra we
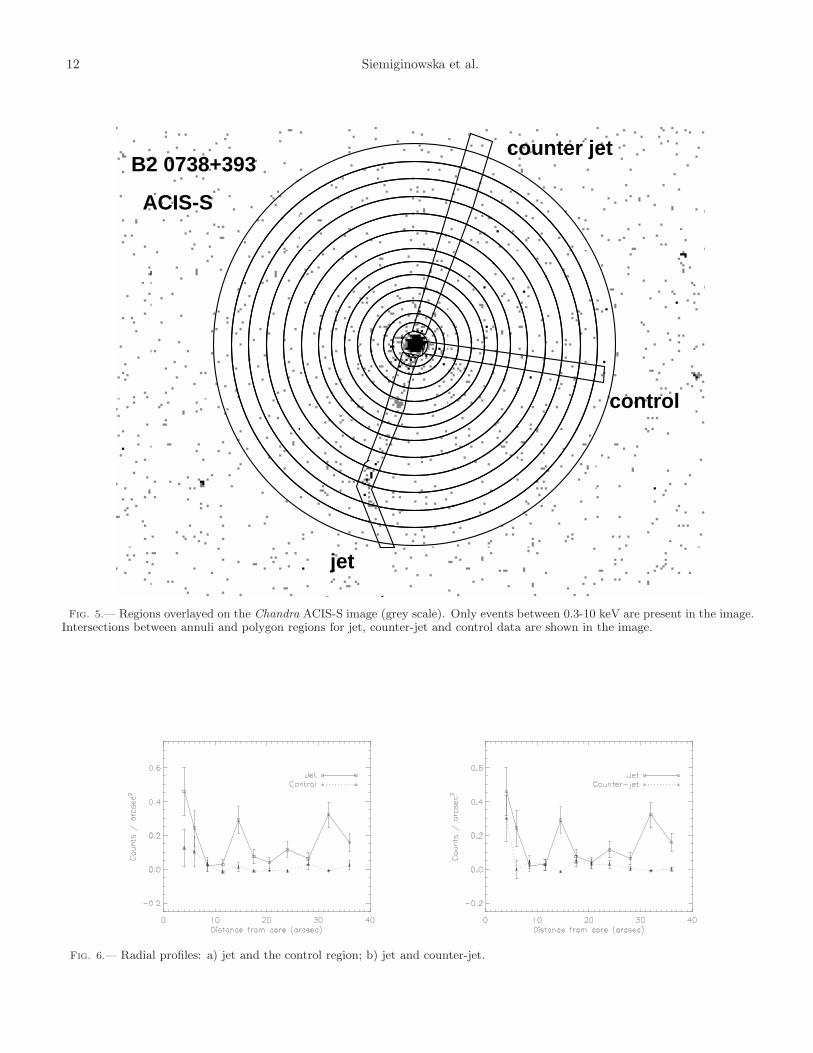
extracted the X-ray jet and counter-jet profiles from theevent file including only the photons with energies between0.3 and 6.5 keV. The Chandra background increases sig-nificantly above 6.5 keV and below 0.3 keV 4. We definedthe polygonal regions shown in Figure 5 for extracting theprofiles. The profiles are shown in Figure 6. There is nocounter-jet present in our X-ray data.The jet profile is not smooth and uniform, but shows
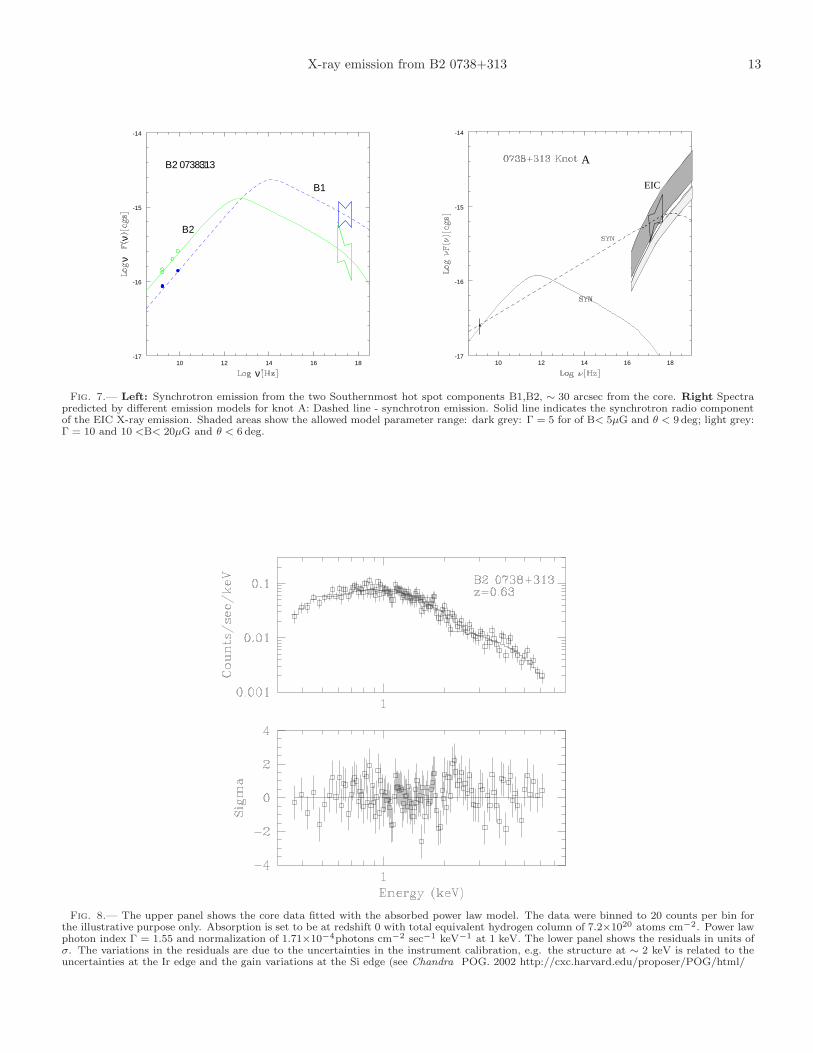
definite features ∼13′′ and 32′′ away from the core. Thefeatures are labeled A,B1,B2 moving away from the core(see Figure 2). The first feature A can be related to theknot visible in radio emission, while the outer B1 and B2features can be associated with the Southern Lobe andmay mark the position of hot spots. We extracted thecounts from these three features (A,B1,B2) and fit a sim-ple power law model to estimate the spectral index andthe luminosity associated with each feature. The resultsare presented in Table 2. B1 component is the strongest.It seems that both B1 and B2 components are softer(Γ = 2.01 ± 0.33 and Γ = 2.4 ± 0.5 respectively) thanknot A (Γ = 1.54 ± 0.37) located closer to the core. Theluminosity of each feature is listed in Table 2 and theyrange between 1 − 4.1 × 1042erg sec−1. Figure7 show thespectral energy distribution for each feature.We fit all the radio components with Gaussian models
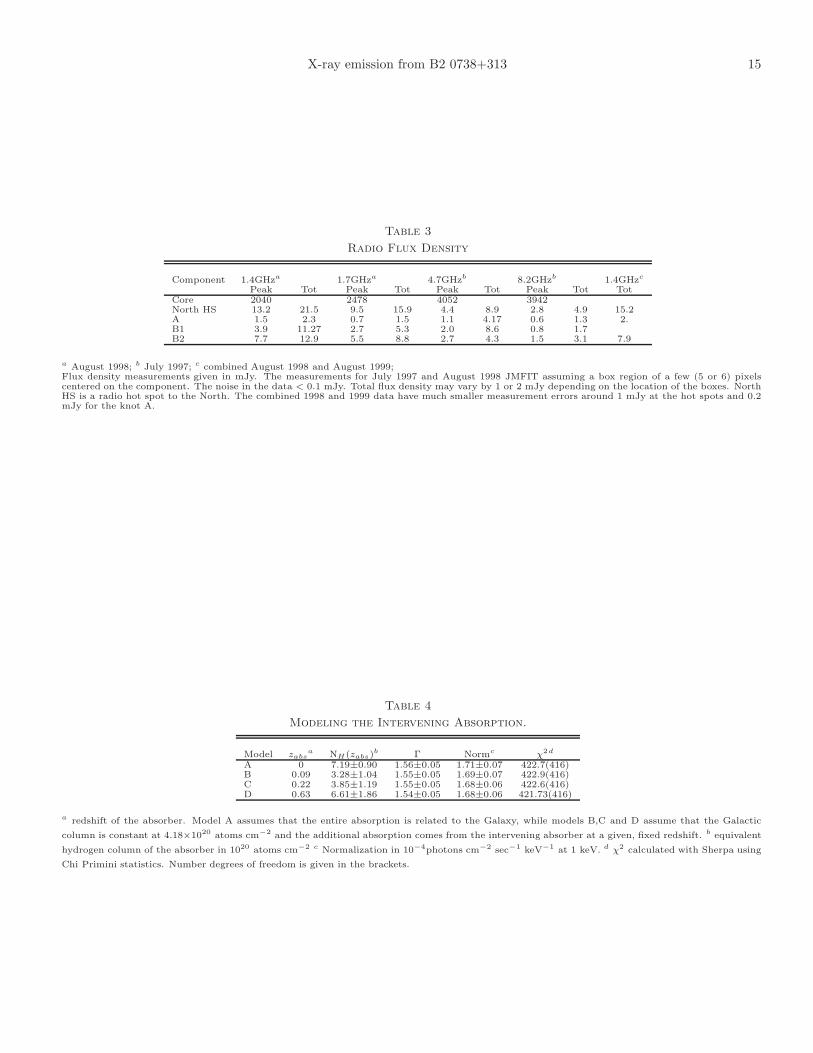
using JMFIT in AIPS (see Table 3). We attempted tomatch the components close to the X-ray emission. Theknot A radio emission is not well constrained with the cur-rent data (uncertainties of order 10%), but a slight shift be-tween X-ray and radio knot emission can be noticed. Withthe current data we cannot really quantify the amount ofshift.The estimated radio flux densities are reliable for both
northern and southern hot spots, while the flux densities
for the subcomponents of the southern hot spot and theknot A are more ambiguous. These features are definitelydetected in our radio observations, but their flux densitycannot be determined accurately with the current data.
5. x-ray spectrum of b2 0738+313
We have extracted the ACIS-S spectrum of the quasarcore assuming the circular region with 2.7 arcsec radius fora source and an annulus between 5′′ and 55′′ (excluding thesource and the jet) for the background. The total of 3691counts in the spectrum were then fit in Sherpa (Freemanet al 2001). The spectrum is not significantly affected bypileup (< 10%). We included only the counts with ener-gies between 0.3-6.5 keV. The background is significantlyhigher outside this energy range.We assume the absorbed power law model to fit the
data:N(E) = AE−Γ
∗ exp−Ngal
Hσ(E)−N
zabsH
σ(E(1+zabs)) pho-tons cm−2 sec−1 keV−1.In this formula A is the normalization at 1 keV and Γ is
the photon index of the power law. We have assumed twocomponents for the absorption. The first component is re-lated to the effective Galactic absorption characterized by
the equivalent neutral hydrogen column NgalH = 4.18×10²⁰
atoms cm−2 (COLDEN 5, which has column densities ac-curate to 5% Elvis, Wilkes & Lockman 1989). This ab-sorption was constant during fitting. The second compo-nent is due to the intervening absorber located at redshiftzabs, with Nzabs
H as the equivalent hydrogen column. σ(E)and σE(1 + zabs) are the corresponding absorption crosssections (Morrison & McCammon 1983, Wilms, Allen andMcCray 2000). We used Powell optimization with Priministatistics (Kearns et al. 1995) to determine the best fitparameter values.The best fit parameters are listed in Table 4 and the
spectrum and residuals are presented in Figure 8. Thestructure in the residuals is due to the uncertainties in theChandra calibration, in particular any spectral featuresat ∼ 2 keV are related to the calibration uncertaintiesacross the Si and Ir edges (CXC Calibration6). The resid-uals below 1 keV are mostly caused by the uncertaintiesin the calibration of the time-dependent effects related tothe ACIS contamination layer. This contamination layeraffects modeling of the absorption in our source. To ac-count for the contaminant we have applied the most recentcorrection file (apply acisabs v.1.1-27) and created anupdated effective area file (ARF), which we used in mod-eling the data.We find that the best fit equivalent hydrogen column
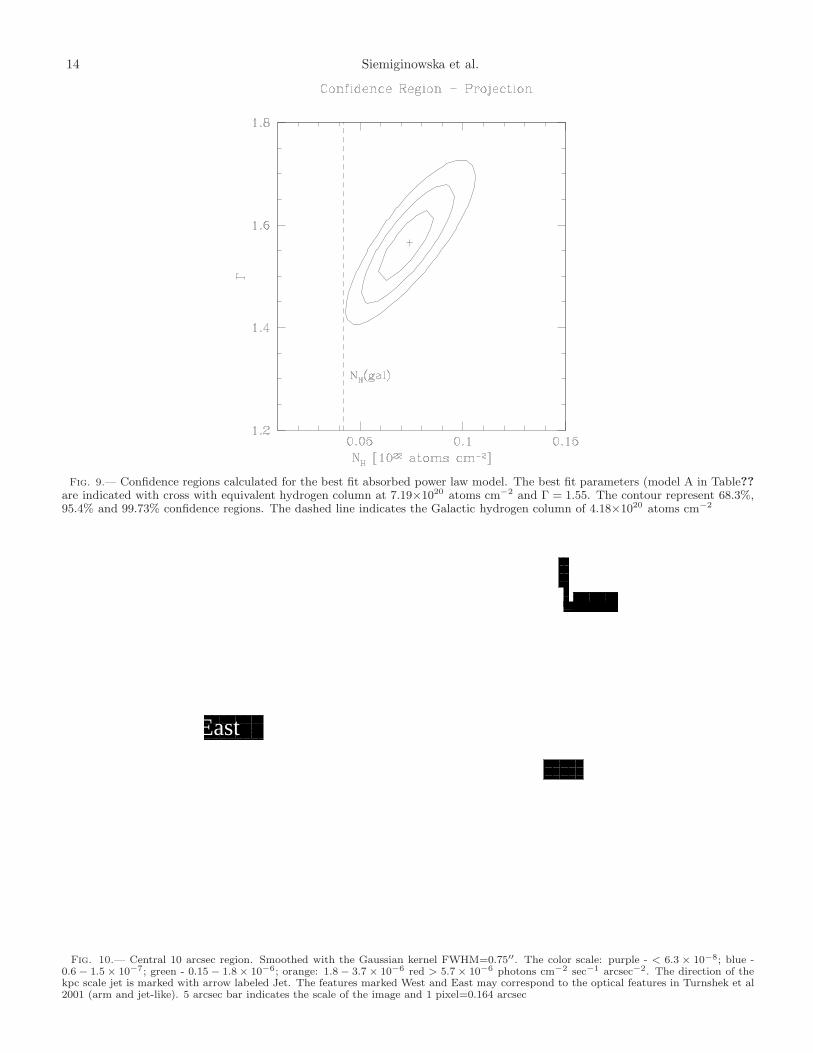
for B2 0738+393 is 7.19±0.89× 1020cm−2, assuming solarabundances and that the absorber is at z=0, compared tothe Galactic column of 4.18×1020 cm−2 (COLDEN). Fig-ure 9 represents confidence contours on column densityvs. power law photon index plane for the best fit modelparameters. The line representing the equivalent Galac-tic hydrogen column is outside 99.7% confidence contourdrawn around the best fit equivalent hydrogen column of
4 http://cxc.harvard.edu/cal/Acis/Cal prods/bkgrnd/current/background. html5 http://cxc.harvard.edu/toolkit/colden.jsp6 http://cxc.harvard.edu/ciao/caveats/7 http://cxc.harvard.edu/ciao/threads/sherpa acisabs/
X-ray emission from B2 0738+313 5
7.19±0.89 × 1020cm−2. Thus there is a small excess inthe absorption towards the quasar, however our signal-to-noise and current knowledge of the instrument below1keV make the evidence for the excess absorption uncer-tain. Note that ∼ 10% pileup may affect the total detectedcolumn. Photon index and the absorption column are cor-related. The pileup results in hardening of the spectrumand therefore in lower fitted absorption column, thus thetrue column density may be higher by a factor of∼2. How-ever, archival XMM-Newton data agree with the measuredby Chandra column density (Siemiginowska & Bechtold2003).
6. x-ray emission within 10′′ region around thequasar
ROSAT HRI data indicated that the extended emis-sion is present at distances smaller than 10′′ away fromB2 0738+393. We studied carefully this central 10′′ re-gion in the Chandra ACIS-S image to identify the natureof the extended emission. Extended emission could be as-sociated with the environment of the GPS quasar or withthe intervening DLA systems.First we ran wavdetect (detection tool in CIAO based
on wavelets) on the central part of the image (50′′ × 50′′).The quasar and the jet features were detected. The Chan-dra PSF is very narrow (FWHM ∼0.75′′ at the locationof our source) but the contribution from the PSF wingsfrom the strong core could affect the extended structureat distances greater than 1′′ from the quasar. Therefore,we have used three methods to understand the amountof the quasar contribution to the emission within the 10′′
circle.(1) We excluded the core component (within a 1.5′′ cir-
cle) and fill the excluded regions with Poisson noise. Wethen smoothed the diffuse image assuming a Gaussian ker-nel. (2) We fit the image data with the PSF created fromthe PSF library using mkpsf and subtracted the PSF con-tribution related to the quasar core emission. We analyzedthe residuals and also created a smoothed image of theresiduals (assuming Gaussian kernel with FWHM=0.75′′).(3) We fit the surface brightness with 2D Gaussian andLorentzian models as an approximation of a quasar PSFand analyzed the residuals for any significant structure.The result in each case was the structure presented
in Figure 10 with three distinct 1.3-3.6σ features within∼ 6 arcsec to the south, west and east of the quasar. Weextracted counts from each feature assuming regions spec-ified in the Table 2. The X-ray emission is the strongest(3.6σ) at ∼3.8′′ south of the quasar core in the directionof the jet (shown with an arrow in Fig. 10). This emissioncan indicate the location of the innermost components ofthe jet.The two features seen in our Figure 10 – one to the
west and the structure to the east – may correspond tothe structures observed in the optical by Turnshek etal.(2001; see their Fig.1). We extracted spectra fromthe west and east features. The number of counts andthe corresponding flux for each feature are listed in theTable 2. The table lists also the regions used to ex-tract the spectra (dmextract tool in CIAO). We calculatethe X-ray flux assuming galactic NH of 4.18×1020 cm−2
and a power law index Γ=1.25. We obtained 5.34±3.2×
10−16 ergs cm−2sec−1 for the east feature and 3.9±3.2×10⁻¹⁶ ergs cm−2sec−1 for the west components.The location of the west and east X-ray features cor-
respond to the location of the optical “arm” and a “jet-like” structures, identified by Turnshek et al (2001) withthe DLA system at z=0.0912. The agreement in posi-tion is less than 1 arcsec. Assuming that both X-raycomponents are related to the DLA system at z=0.0912their X-ray (0.1-2keV) luminosity 8.5×1039 ergs sec−1 and6.5×1039 ergs sec−1 respectively (H0 = 75km sec−1Mpc−1,q0 = 0.5).These two features may also be associated with the emis-
sion at the quasar redshift and not related to the DLAsystem. They may indicate a presence of a cluster ora group at the quasar redshift. The east and the westX-ray emission would be then associated with individ-ual galaxies and indicate their X-ray luminosities of order5.1×1041 ergs sec−1 and 3.7×1041 ergs sec−1 respectively.ROSAT HRI data indicated an extended emission
within 5-20 arcsec from the quasar of a total (0.5-2 keV)flux of order 1.3-1.6×10⁻¹³ ergs cm−2 sec−1. The Chan-dra flux including all the resolved structures (jet and threefeatures) accounts only for about 50% of the ROSAT HRIflux. This discrepancy could be related to the difference inthe PSF wings, which could affect the ROSAT HRI mea-surements.
7. discussion
7.1. Jet models
Several emission processes are potentially responsiblefor the jet X-ray emission: synchrotron, synchrotron self-compton (SSC), external inverse compton (EIC) models,and thermal emission (for review see Harris & Krawczyn-ski 2002). Thermal emission from jet knots or hot spotsis quite unlikely since the observed X-ray luminosities re-quire unphysical conditions. We fit the radio-X-ray dataof the knot and two components of the southern hot spotconsidering only non-thermal processes.The X-ray emission from the two components of the hot
spot in the southern lobe (B1 and B2) is consistent withthe synchrotron model (Figure 7). From the measured sizeof the radio emitting regions and the flux density we canestimate the equipartition magnetic field in the hot spotto be of order of ∼20 µG. The radio flux symmetry be-tween the South and North hot spots indicate an absenceof strong Doppler boosting of the radio photons. We canalso put a rough limit on the Doppler boosting in the hotspots using the difference in the length of the two lobes.Assuming that the hot spot is moving at velocity β = v
c,
the difference in the length (factor of about 1.3) is com-patible with an angle with the line of sight of 15-25 degand β = 0.1− 0.15.The radio data do not provide good constraints for the
synchrotron radio emission of knot A. Figure 7 shows theradio and data points and X-ray spectrum together withallowed models for knot A. The spectral break at high fre-quencies in synchrotron models provides a measure of themaximum energy of the oldest plasma in the post shock re-gion. In general, powerful jets have spectral breaks within< 1015 − 1016Hz (Hardcastle et al 2002a, Sambruna et al2002). Here this break is at νbreak > 1019 Hz and implieselectron energies of at least γ ∼ 109 (where γ is the Lorentz
6 Siemiginowska et al.
factor) with very short lifetimes (< 100 years) for the mag-netic field expected in the jet. However, the quality of thepresent radio and X-ray data for knot A do not rule outthe synchrotron emission completely and one can find asolution with a spectral break below νbreak < 1019 Hz.The second model for the knot A X-ray emission is
Inverse Compton scattering of cosmic-microwave back-ground (CMB) photons off the relativistic electrons in thejet (Figure 7). The radio to X-ray luminosity ratio as wellas the difference in the spectral slopes between radio andX-ray bands requires the jet to move with the high rela-tivistic bulk velocities (Γbulk = 5 − 10, where Γbulk is thejet Lorentz factor) towards the observer (θ < 12 degrees,where θ is an angle between the observer and the directionof the jet motion). In Figure 7 we show X-ray spectra fora range of model parameters, Γbulk,θ, B - magnetic fieldand the assumed slope of the energy distribution of rela-tivistic electrons, δ. With only one radio data point forknot A the models are unconstrained, although assumingδ > 2.4−2.5 the inclination angle θ can be up to 10-15 deg.This is still in contradiction with the morphology of theextended radio lobe structure.The small angle indicates that either (1) the radio lobes
are ∼ 4 Mpc in size and the jet is aligned with the lobesand very long; or (2) that the inclination angle of the knotis different from that of the lobes and the projected ex-tension is of the order of 500 kpc. Because the radio lobemorphology and radio intensity suggest a large inclinationangle, while the jet requires the small inclination angle,the second possibility may indicate either a sharp bend inthe jet or the presence of precession of the jet directionwithin the last 107 − 108 years.Megaparsec scale radio emission in GPS sources has also
been interpreted as a remnant of much earlier source ac-tivity (Baum et al 1990, Owsianik, Conway & Polatidis1998, Marr et al 2001; Stanghellini et al 1990, Schoen-makers et al 1999, Marecki et al 2002). In this modelthe GPS “core” indicates current source activity rejuve-nated by an inflow of new matter from a recent merger(e.g. Mihos & Hernquist 1996) or accretion disk instabil-ity (Siemiginowska, Czerny & Kostyunin 1996, Mineshige& Shields 1990). Repetitive activity of the source mayalso come from feedback mechanisms (Ciotti & Ostriker2001) in which the accreting source heats the ambient gasto the point at which the accretion stops, since the Comp-ton temperature of the emitted radiation exceeds the virialtemperature of the galactic gas. Accretion restarts afterthe gas has cooled. The outburst phase is short in com-parison to the cooling phase.The above interpretation of the extended radio emis-
sion is probably more appropriate for the sources withtheir sub-kpc core observed edge-on. In such a sourceone can separate two jet components and the core on themilliarcsec scale VLBI observations. For example, Com-pact Symmetric Objects (CSO) which have the peakedradio spectra, but show two jet components on both sidesof the strong core have been monitored for several yearsnow. The dynamical timescales in these sources can bemeasured and suggests young ages (< 104years). The ex-tended, Mpc emission observed in two cases (0108+388 ,Baum et al 1990 and PKS 1245+676, Marecki et al. 2002)is at least 106years old. Owsianik et al (1998) argued
based on the radio morphology that the outer structurein 0108+388 has been left unsupplied for at least 2×10⁵
years, while the core activity is only 300-400 years old.B2 0738+313 is not a CSO type source and we do not
have any estimate of the characteristic timescale for theactivity of the core. In fact the milliarcsec core-jet mor-phology may indicate that B2 0738+313 could be similarto other core dominated quasars, but with a peaked radiospectrum. The peak in the radio spectrum could be there-fore due to the dominant contribution from the miliarcsecjet component at this frequency. This quasar could bean example of the FRII type quasar with a high bulk jetvelocity (Γbulk > 5) which has been observed in the otherFRII sources (see for example Hardcastle et al (2002)), butwith a more complex radio nuclear spectrum than usuallyassociated with the FRII class.
7.2. Absorption towards B2 0738+313
We found X-ray absorption in the core of B2 0738+313.The X-ray absorption may be arising in the material asso-ciated with B2 0738+313 itself, and/or one or both of twointervening damped Lyman-α (DLA) absorbers known, atredshifts z = 0.0912 and z = 0.2212 (Rao & Turnshek1998). The intervening absorbers have neutral hydrogencolumns derived from the DLA profiles of 1.5×1021 cm−2
and 8×1020 cm−2 respectively (Rao & Turnshek 1998).There is no Lyα absorption at the quasar redshift, so itis possible that the X-ray absorption is associated withone of the damped systems. Unfortunately ACIS-S spec-tral resolution does not allow us to obtain the redshift ofthe X-ray absorption or to separate these two systems toobtain their individual contribution to the total absorb-ing column. We can only obtain the total column of thetwo absorbers or fit individual columns assuming that theabsorption comes from either system (see Table 4). It isinteresting to note that the total equivalent column of hy-drogen observed with ACIS is smaller than the neutralcolumn in either DLA. This suggests that the metallicityof the absorbers may be sub-solar. We defer a more de-tailed analysis of the X-ray absorption until details of thecalibration for energies below 1 keV are well understood.
7.3. Extended Emission
We can use the X-ray to H-band luminosity ratios col-lected for a large sample of galaxies by Shapley, Fab-biano and Eskridge (2001, SFE01) to identify the typeof galaxy possibly associated with the two X-ray fea-tures. Turnshek at al (2001) gives the K band mag-nitudes for both components (their Table 2). whichwe use to calculate the H-band luminosity for thesources located at z=0.0912: Larm
H =6.5×1041erg sec−1 and
Ljet−likeH =4.6×1041erg sec−1. For such low H-band lumi-
nosity these two features are very X-ray bright. Basedon SFE01 (their Fig.6) these features cannot be associ-ated with the early or intermediate type of galaxies. Theymight be related to late type galaxies which are disk/armdominated or irregular, although our X-ray luminositiesare still higher than the luminosities in SFE01 sample.Deeper observations in the future in both optical and X-ray domains are needed in order to better understand thenature of these two features.
X-ray emission from B2 0738+313 7
It is also possible that the west and east X-ray featuresare related to the cluster or a group at the quasar redshift.If this is the case their would have H-band to X-ray lumi-nosity ratios typical to the early type galaxies in SFE01diagrams.We do not detect an X-ray emission from the dwarf
galaxy identified by Turnshek et al (2001) with DLA sys-tem at redshift zabs=0.2212. In fact the X-ray emission isweakening towards the location of the optical peak emis-sion of the galaxy which is 5.7′′ away from the quasar peak.
8. summary
In summary we report new X-ray and radio observationsof GPS quasar B2 0738+313. We find that B2 0738+313
• is a powerful X-ray and radio source with total X-ray luminosity L0.1−10keV ∼ 1045 ergs sec−1;
• has extended radio emission on 1 arcmin scale withFRII type morphology;
• has a 35′′ long, one-sided X-ray jet with high bulkvelocity,reaching the southern radio lobe.
• has diffuse, extended X-ray emission within the cen-tral 10′′;
• has excess X-ray absorption on the line of sightwhich may be intrinsic to the AGN, or related toone or two known intervening DLA systems.
This is the second GPS source imaged with Chandra.Like PKS 1127-145 (Siemiginowska et al 2002) it showscomplex structures related to the radio emission on arcsecscale and absorption in the core spectrum. The studies ofGPS sources appears to be a fertile field for understandingthe evolution of AGN.
AS thanks Dan Harris for comments and discussion.This research is funded in part by NASA contracts NAS8-39073 and NAS8-01130. Partial support for this work wasprovided by the National Aeronautics and Space Admin-istration through Chandra Award Number GO2-3148A is-sued by the Chandra X-Ray Observatory Center, which isoperated by the Smithsonian Astrophysical Observatoryfor and on behalf of NASA under contract NAS8-39073.GB acknowledge partial support by the MURST undergrant Cofin-01-02-8773.
REFERENCES
Aldcroft, T.L., Karovska, M., Cresitello-Dittmar, M. L., Cameron,R.A., Markevitch, M.L., 2000, in Proc. SPIE Vol. 4012, p. 650-657, X-Ray Optics, Instruments, and Missions III, Joachim E.Truemper; Bernd Aschenbach, Eds.
Antonelli L.A. & Fiore F., 1997, Proceedings of the II NationalMeeting on AGNs ”From Micro to Mega Parsec” Comastri A., T.Venturi, M. Bellazzini eds., Memorie della Societa AstronomicaItaliana, (Journal of the Italian Astron. Society) vol.68, 299
Baum, S. A.; O’Dea, C. P.; de Bruyn, A. G.; Murphy, D. W., 1990,A&A, 232, 19
Bechtold, J., Siemiginowska, A., Aldcroft, T. L., Elvis, M., & Dobrzycki, A. 2001, ApJ, 562, 133
Brunetti, G., Bondi, M., Comastri, A., & Setti, G. 2002, A&A, 3 81,795
Celotti,A., Ghisellini, G. & Chiaberge, M. 2001, MNRAS,321,1Chartas, G., Worrall, D. M., Birkinshaw, M.; Cresitello-Dittmar, M.;
Cui, W.; Ghosh, K. K.; Harris, D. E.; Hooper, E. J.; Jauncey, D.L.; Kim, D.-W.; Lovell, J.; Mathur, S.; Schwartz, D. A.; Tingay,S. J.; Virani, S. N.; Wilkes, B. J., 2000, Ap.J., 542, 655
Ciotti, L. & Ostriker, J.P., 2001, ApJ, 551, 131David, L.P, Harnden, F.R., Kearns, K.E. & Zombeck, M.V., 1992,
“The ROSAT High Resolution Imager” (Technical Report USROSAT Science Data Center, SAO)
Elvis, M., Fiore,F., Wilkes, B., McDowell, J., Bechtold, J., 1994,Ap.J. 422, 60
Elvis, M., Wilkes, B. J., & Lockman, F. J. 1989, AJ, 97, 777Fanti, C., Pozzi, F., Dallacasa, D., Fanti, R., Gregorini, L.,
Stanghellini, C., & Vigotti, M. 2001, A&A, 369, 380Freeman, P., Doe, S., Siemiginowska A., 2001, “Sherpa: a mission-
independent data analysis application”, in Proc. SPIE Vol. 4477,p. 76-87, Astronomical Data Analysis, Jean-Luc Starck; Fionn D.Murtagh; Eds.
Harris, D. E. & Krawczynski, H. 2002, ApJ, 565, 244Harris, D. 2001, “Current Problems for X-ray Emission from Radio
Jets”, in ’Particles and Fields in Radio Galaxies’, R. A. Laing andK. M. Blundell, editors. ASP Conference Series, in press.
Harris, D. E.; Carilli, C. L.; Perley, R. A., 1994, Nature, 367,71 3Hardcastle, M. J., Worrall, D. M., Birkinshaw, M., Laing, R. A., &
Bridle, A. H. 2002a, MNRAS, 334, 182Hardcastle, M. J., Birkinshaw, M., Cameron, R. A., Harris, D. E.,
Looney, L. W., & Worrall, D. M. 2002, ApJ, 581, 948Hardcastle, M. J., Birkinshaw, M., & Worrall, D. M. 2001, MNRAS,
326, 1499Hartman, R.C., et al 1999, ApJS, 123, 79Holtzman, J. A. et al. 1995, PASP, 107, 156Impey, C.D., & Tapia, S. 1990, ApJ.354,124Johnston, K.J. et al 1995, AJ, 110,880
Kallerman,K.I. & Owen, F.N., 1988, in “Galactic and ExtragalacticRadio Astronomy” , Eds. Verschuur, G.L and Kallerman, K.I.,Springer-Verlag, p.563
Kearns, K., Primini, F., & Alexander, D. 1995, AstronomicalData Analysis Software and Systems IV, ASP Conference Series,Vol. 77, 1995, R.A. Shaw, H.E. Payne, and J.J.E. Hayes, eds.,p. 331., 4, 331
Lane, W., Briggs, F.H. & Smette A., 2000, ApJ, 532,146Marecki, A., Barthel,P.D., Polatidis, A., Owsianik, I., 2002, A
contribution to The Third Workshop on Compact Steep Spectrumand GHz-Peaked Spectrum Radio Sources, Kerastari, Greece May28-31, 2002. PASA in press (astro-ph/0209212)
Marr. J.M, Taylor, G.B. & Crawford III, F., 2001, Ap.J. 550.160Marshall, H. L.; Harris, D. E.; Grimes, J. P.; Drake, J. J.; Fruscione,
A.; Juda, M.; Kraft, R. P.; Mathur, S.; Murray, S. S.; Ogle, P. M.;Pease, D. O.; Schwartz, D. A.; Siemiginowska, A. L.; Vrtilek, S.D.; Wargelin, B. J, 2001a,ApJ., 549, L167
Marshall, H. L., Miller, B. P., Davis, D. S., Perlman, E. S., Wise ,M., Canizares, C. R., & Harris, D. E. 2002, ApJ, 564, 683
Morse, J. A., Wilson, A. S., Elvis, M., & Weaver, K. A. 1995, ApJ,439, 121
Morrison, R. & McCammon, D. 1983, ApJ, 270, 119Murphy, D. W., Browne, I. W. A., & Perley, R. A. 1993, MNRAS, 2
64, 298Murphy, E.M., Lockman, F.J., Laor, A. & Elvis,M., 1996, ApJS.
105,369Mihos, J.C. & Hernquist, L., 1996, ApJ, 464,641Mineshige & Shields, G., 1990, Ap.J, 351,47O’Dea, C.P. 1998, PASP, 110, 493O’Dea, C.P., Baum, S.A., & Stanghellini,C., 1991, ApJ, 380,66Owsianik, I., & Conway, J.E. 1998, A&A, 337, 69Owsianik, I., Conway, J.E., & Polatidis, A.G.,1998, A&A, 336, 37Owsianik, I., Conway, J.E., & Polatidis, A.G., 1999, NewAR, 43, 669Phillips, R.B., & Mutel, R.L. 1982, A&A, 106, 21Rao, S. & Turnshek, D.A, 1998, ApJ, 500, L115Readhead, A.C., 1994, Ap.J., 426, 51Reynolds, C. & Begelman, M.,1997, Ap.J., 487, L135Rybicki, G.B. & Lightman, A.P., “Radiative Processes in
Astrophysics”, Wiley and Sons. Inc, 1979Sambruna, R. M., Maraschi, L., Tavecchio, F., Urry, C. M., Cheung,
C. C., Chartas, G., Scarpa, R., & Gambill, J. K. 2002, ApJ, 571,206
Schwartz, D.A, Marshall, H. L.; Lovell, J. E. J.; Piner, B. G.; Tingay,S. J.; Birkinshaw, M.; Chartas, G.; Elvis, M.; Feigelson, E. D.;Ghosh, K. K.; Harris, D. E.; Hirabayashi, H.; Hooper, E. J.;Jauncey, D. L.; Lanzetta, K. M.; Mathur, S.; Preston, R. A.;Tucker, W. H.; Virani, S.; Wilkes, B.; Worrall, D. M.,2000 ApJ,540, 69
Schwartz, D.A. 2002, ApJ, 569, L23.
8 Siemiginowska et al.
Schoenmakers, A.P., de Bruyn A.G., Rottgering, H.J.A. & H.van derLaan, 1999, A&A 341, 44
Shapley, A., Fabbiano, G., & Eskridge, P. B. 2001, ApJS, 137, 1 39Siemiginowska, A. & Bechtold, J., 2003, at “The First Constellation-
X Spectroscopy Workshop”, meeting held in New York on May4-7, 2003.
Siemiginowska, A., Czerny, B., & Kostyunin, V. 1996, ApJ, 458, 491Siemiginowska, A., Aldcroft, L.T., Bechtold, J., Brunetti, G., Elvis,
M. & Stanghellini, C. 2003, to appear in PASA, as a part of theproceedings of the 3rd GPS/CSS Workshop held in May 2002 inKerastari, Greece, in press
Siemiginowska, A., Bechtold, J., Aldcroft, T. L., Elvis, M., Harris,D. E., & Dobrzycki, A. 2002, ApJ, 570, 543
Snellen, I. A. G., Schilizzi, R. T., Miley, G. K., de Bruyn, A. G.,Bremer, M. N., Rttgering, H. J. A. 2000, MNRAS, 319, 445
Stanghellini, C., Dallacasa, D., O’Dea, C. P., Baum, S. A., Fanti, R.,Fanti, C., 2001, A&A 377, 377
Stanghellini, C., O’Dea, C. P., Dallacasa, D., Baum, S. A., Fanti, R.,& Fanti, C. 1998, A&AS, 131, 303
Stanghellini, C., O’Dea, C. P., Baum, S. A., Dallacasa, D., Fanti, R.,& Fanti, C. 1997, A&A, 325, 943
Stanghellini, C., Dallacasa, D., O’Dea, C. P., Baum, S. A., Fanti,R., & Fanti, C. 1996, in Proc. Second Workshop on GigahertzPeaked-Spectrum and Compact Steep-Spectrum Radio Sources,ed. I. A. G. Snellen, R. T. Schilizzi, H. J. A. Rttgering, & M. N.Bremer (Leiden: Leiden Obs.), 4
Stanghellini, C., Baum, S.A., O’Dea, C.P., Morris, G.B. 1990, A&A, 233,379
Tavecchio, F., Maraschi, L., Sambruna, R.M., Urry, M.C., 2000, ApJ,544, L23
Tingay,S.J., Murphy D.W. & Edwards,P.G., 1998, Ap.J.,500, 673Turnshek, D.A, Rao, S., Nestor, D., Lane, W., Monier, E., 2001, ApJ
553, 288Turnshek, D.A, Rao, S., Ptak, A., Griffiths, R.E, Eric M. Monier
E.M., 2003, Ap.J in press (astro-ph/0302550)Van Speybroeck, L.P, Jeriu, D.,Edgar, R.J., Gaetz, T.J., Zhao, P.,
Reid, P.B., 1997, in Proc. SPIE Vol. 3113, Grazing Incidence andMultilayer X-Ray Optical Systems, Richard B. Hoover; Arthur B.Walker; Eds. p. 89-104
Weisskopf, M. C., Brinkman, B., Canizares, C., Garmire, G., Murray,S., & Van Speybroeck, L. P. 2002, PASP, 114, 1
Wilms, Allen and McCray 2000, ApJ 542, 914Wilson, A., 2003, in the proceedings of the Bologna conference “The
Physics of Relativistic Jets in the Chandra and XMM Era”, NewAstronomy Review in press (astro-ph/0301125)
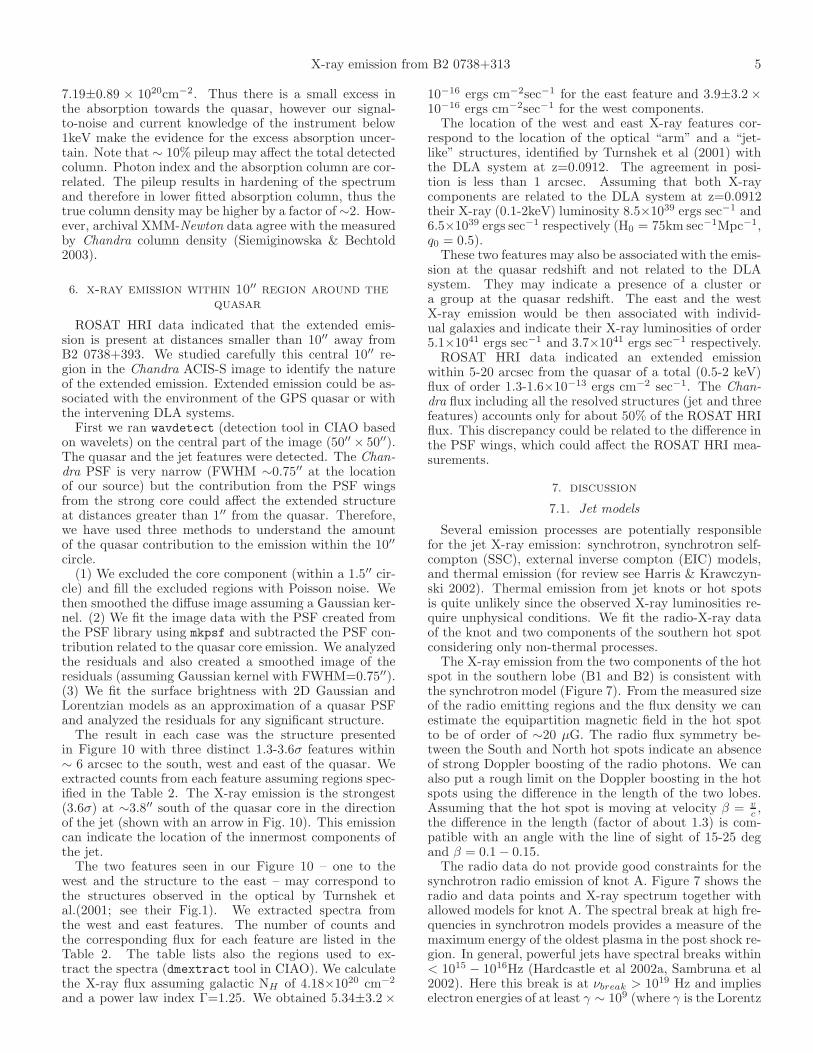
Table 1
Observations
Instrument Date E(keV)/ν(GHz) Exposure (s)ROSAT HRI (05-12)-Apr-1994 0.1-4 47508Chandra ACIS-S 10-Oct-2000 0.1-10 27600VLA (C) 26-July-1997 4.5,4.9,8.0,8.4VLA (B) 22-Aug-1998 1.36,1.66VLA (B) 21-Sep-1998 1.36,1.66VLA (A) 10-Aug-1999 1.36
Table 2
Measurement of the X-ray emission.
Component Region Counts Net Γ Fa
X(0.1-2) Lb
X(0.1-2) Fa
X(2-10) Lb
X(2-10)
Core circle(4126.1,4023.8,5.5) 3691 3674.5±61.2 1.55±0.05 346.1 44.52 868.1 44.92South ellipse(4123.97,4015.78,3.23,3.23,0) 21 17.9±4.9 1.27±0.38 1.42 42.13 5.79 42.75East circle(4115.23,4022.96,3.40) 12 6.9±3.6 1.25±0.82 0.53 41.71 1.88 42.26West ellipse(4138.24,4022.08,6.57,2.78,0.127) 15 5.0±3.9 1.2±1.1 0.39 41.57 1.35 42.11A 3.6′′ x 7.8′′ (4118,3996)c 30 21.85±4.8 1.54 ±0.37 1.58 42.18 4.31 42.61B1 3.6′′ x 7.8′′ (4105,3963)c 36 27.95±5.6 2.0 1±0.33 2.39 42.36 3.21 42.49B2 5.8′′ x 3.5′′ (4106,3951)c 19 12.95±3.8 2.4±0.5 1.05 42.00 0.81 42.89
Galactic hydrogen column of NH = 4.18 × 10²⁰ atoms cm−2 was assumed in all models; a flux within given energy band (0.1-2 keV or 2-10 keV) in
10−15 ergs cm−2sec−1; b rest frame log luminosity within given energy range in ergs sec−1 assuming q0=0.5, H0=75 km sec−1Mpc−1; c The location
of the center of the region box in Chandra physical coordinates.
X-ray emission from B2 0738+313 9
Fig. 1.— (a) The ROSAT HRI radial profile of B20738+313 compared with that of 3C273 (after removing the jet region) and with theDavid et al HZ43 HRI PSF. (b) The residual plot of B2 0738+313 and 3C273 profiles: upper panel shows the integrated counts/ksec for agiven radial distance from the center. Lower panel shows the difference between the B2 0738+313 profile and the 3C273 profile.
7:41:1013 13 12 12 1114 09
31:12:00
20
10
30
11:50
40
30
20
10
Right Ascension (J2000)
Dec
linat
ion
(J2
000)
B2 0738+313
ACIS-S
Chandra
B2
B1 Hot Spots
Knot A
Core
10"
Fig. 2.— B2 0738+313 Chandra ACIS-S image smoothed with a Gaussian kernel (FWHM= 0.75′′). Because ACIS-S backgroundis increasing rapidly at high energies only the events with energies between 0.3-6.5 keV were included in this image. The jetcomponents, A,B1 and B2 are indicated in the figure. North is up and East is left. The color scale corresponds to the surfacebrightness of < 5 × 10⁻⁸ in purple, 0.5 − 1.0 × 10⁻⁷ dark to light blue, 1.5 − 2.5 × 10⁻⁷ green, 2.5 − 4 × 10⁻⁷ yellow/orange,4−8×10−7photons cm−2 sec−1arcsec−2 in red. The white core is> 10−6 with a maximum at 1.3×10⁻⁴ photons cm−2 sec−1arcsec−2
The 10 arcsec scale bar is shown in right corner.
10 Siemiginowska et al.
DE
CL
INA
TIO
N (
B19
50)
RIGHT ASCENSION (B1950)07 38 02.0 01.5 01.0 00.5 00.037 59.5 59.0 58.5
31 19 30
15
00
18 45
30
15
Mill
iAR
C S
EC
MilliARC SEC2.0 1.5 1.0 0.5 0.0 -0.5 -1.0 -1.5 -2.0
3
2
1
0
-1
-2
-3
Mill
iAR
C S
EC
MilliARC SEC8 6 4 2 0 -2 -4 -6 -8
8
6
4
2
0
-2
-4
-6
-8
Fig. 3.— Radio morphology of B2 0738+313 from milliarcsec to arcsecond scale. Top right: VLBA image at 15 GHz. Bottom right: globalVLBI image at 5 GHz. Left: VLA B configuration image at 1.4 GHz, with most of the core emission subtracted. The rms noise on the imagesare 0.5, 0.7, and 0.1 mJy for the 15 GHz, 5 GHz, and 1.4 GHz images respectively. The level contours in all the images are -3, 3, 6, 12, 25, 50,100, 200, 400, 800 times the rms noise. The beam is indicated in the bottom left corner of each image: VLA -3.5x3.5 arcsecs, VLBI 15 GHz:0.6x0.3mas at PA +10 and VLBI 5 GHz: 2x2 mas. The VLA data are discussed in the text, the VLBI images have been produced using thedata presented in Stanghellini et al. (1997, 2001).
X-ray emission from B2 0738+313 11
B2 0738+313
VLA-contour
Chandra-grey
10"
Fig. 4.— Superposition of B2 0738+313 Chandra X-ray image (grey) with the VLA high resolution radio (1.4 GHz) contours. The strongradio core has been subtracted. Contour peak radio flux is at 9.4×10⁻³ Jy/beam and and contour levels are (3,5,11,55,75,90)×10−4 Jy/beam.Grey scale in the X-ray image varies from 10−7 to 1.2×10⁻⁴ photons cm−2 sec−1 arcsec−2. (1 pixel=0.164 arcsec). North is up and East isleft.
12 Siemiginowska et al.
ACIS-S
control
jet
counter jetB2 0738+393
Fig. 5.— Regions overlayed on the Chandra ACIS-S image (grey scale). Only events between 0.3-10 keV are present in the image.Intersections between annuli and polygon regions for jet, counter-jet and control data are shown in the image.
Fig. 6.— Radial profiles: a) jet and the control region; b) jet and counter-jet.
X-ray emission from B2 0738+313 13
10 12 14 16 18-17
-16
-15
-14
ν
νν
Β2 0738+313
Β1
Β2
10 12 14 16 18-17
-16
-15
-14
A
EIC
Fig. 7.— Left: Synchrotron emission from the two Southernmost hot spot components B1,B2, ∼ 30 arcsec from the core. Right Spectrapredicted by different emission models for knot A: Dashed line - synchrotron emission. Solid line indicates the synchrotron radio componentof the EIC X-ray emission. Shaded areas show the allowed model parameter range: dark grey: Γ = 5 for of B< 5µG and θ < 9 deg; light grey:Γ = 10 and 10 <B< 20µG and θ < 6 deg.
Fig. 8.— The upper panel shows the core data fitted with the absorbed power law model. The data were binned to 20 counts per bin forthe illustrative purpose only. Absorption is set to be at redshift 0 with total equivalent hydrogen column of 7.2×10²⁰ atoms cm−2. Power lawphoton index Γ = 1.55 and normalization of 1.71×10⁻⁴photons cm−2 sec−1 keV−1 at 1 keV. The lower panel shows the residuals in units ofσ. The variations in the residuals are due to the uncertainties in the instrument calibration, e.g. the structure at ∼ 2 keV is related to theuncertainties at the Ir edge and the gain variations at the Si edge (see Chandra POG. 2002 http://cxc.harvard.edu/proposer/POG/html/
14 Siemiginowska et al.
Fig. 9.— Confidence regions calculated for the best fit absorbed power law model. The best fit parameters (model A in Table??are indicated with cross with equivalent hydrogen column at 7.19×10²⁰ atoms cm−2 and Γ = 1.55. The contour represent 68.3%,95.4% and 99.73% confidence regions. The dashed line indicates the Galactic hydrogen column of 4.18×10²⁰ atoms cm−2
5"
B2 0738+313
East
West
Jet
N
E
EastWest
ACIS−S
Fig. 10.— Central 10 arcsec region. Smoothed with the Gaussian kernel FWHM=0.75′′. The color scale: purple - < 6.3 × 10⁻⁸; blue -0.6 − 1.5× 10⁻⁷; green - 0.15 − 1.8× 10⁻⁶; orange: 1.8− 3.7 × 10⁻⁶ red > 5.7× 10⁻⁶ photons cm−2 sec−1 arcsec−2. The direction of thekpc scale jet is marked with arrow labeled Jet. The features marked West and East may correspond to the optical features in Turnshek et al2001 (arm and jet-like). 5 arcsec bar indicates the scale of the image and 1 pixel=0.164 arcsec
X-ray emission from B2 0738+313 15
Table 3
Radio Flux Density
Component 1.4GHza 1.7GHza 4.7GHzb 8.2GHzb 1.4GHzc
Peak Tot Peak Tot Peak Tot Peak Tot TotCore 2040 2478 4052 3942North HS 13.2 21.5 9.5 15.9 4.4 8.9 2.8 4.9 15.2A 1.5 2.3 0.7 1.5 1.1 4.17 0.6 1.3 2.B1 3.9 11.27 2.7 5.3 2.0 8.6 0.8 1.7B2 7.7 12.9 5.5 8.8 2.7 4.3 1.5 3.1 7.9
a August 1998; b July 1997; c combined August 1998 and August 1999;Flux density measurements given in mJy. The measurements for July 1997 and August 1998 JMFIT assuming a box region of a few (5 or 6) pixelscentered on the component. The noise in the data < 0.1 mJy. Total flux density may vary by 1 or 2 mJy depending on the location of the boxes. NorthHS is a radio hot spot to the North. The combined 1998 and 1999 data have much smaller measurement errors around 1 mJy at the hot spots and 0.2mJy for the knot A.
Table 4
Modeling the Intervening Absorption.
Model zabsa NH(zabs)
b Γ Normc χ2d
A 0 7.19±0.90 1.56±0.05 1.71±0.07 422.7(416)B 0.09 3.28±1.04 1.55±0.05 1.69±0.07 422.9(416)C 0.22 3.85±1.19 1.55±0.05 1.68±0.06 422.6(416)D 0.63 6.61±1.86 1.54±0.05 1.68±0.06 421.73(416)
a redshift of the absorber. Model A assumes that the entire absorption is related to the Galaxy, while models B,C and D assume that the Galactic
column is constant at 4.18×10²⁰ atoms cm−2 and the additional absorption comes from the intervening absorber at a given, fixed redshift. b equivalent
hydrogen column of the absorber in 1020 atoms cm−2 c Normalization in 10−4photons cm−2 sec−1 keV−1 at 1 keV. d χ2 calculated with Sherpa using
Chi Primini statistics. Number degrees of freedom is given in the brackets.