Embed Size (px)
Citation preview
of a tendency for steer wheel lock-up
(understeer). This highlights another
important factor that is not evident in the
graphs. The mode of failure needs to be
considered.
If the performance is limited by front axle
lock-up, which typically occurred for the
European truck, understeer occurs but
the driver can correct this by reducing
brake level. If however, the performance
is limited by the drive-axle group locking
up, which results in jack-knife; it is
unlikely that the driver can correct it.
Locking up of the trailer tri-axle group
leads to trailer swing, which is probably
correctable, but it takes longer to control
than understeer. Therefore, the way in
which the loss of stability occurs is also
important. Mixing the European prime
mover with the Australian trailer and
vice-versa results in poorer performance
because these vehicles have poorly
balance brakes.
The main conclusion from the tests is that
best directional stability occurs when
the trailer has load-sensing brakes. For a
typical Australian trailer set-up setting
the load-sensing valve to give 65% brake
level when unladen results in good brake
balance. The European combination also
gives satisfactory performance because
this combination is well balanced. It is
brake balance that determines directional
stability at high brake levels.
Peter Hart
ARTSA Chair
Chairman’s Technical Column
primemovermag.com.au 73.
ARTSA recently
commissioned two
separate investigations
into the brake
performance of semi-
trailers. The tests were done to provide
a basis for the recommendations in the
ARTSA brake code. In this article I want
to describe the results of an investigation
into brake balance on a semi-trailer with
various brake set-ups. Later articles will
consider the performance of Antilock
brakes (ABS) and Electronic Stability
Control (ESC).
Stopping tests were conducted using a
semi-trailer that had been modified so
that the brake level on each axle could be
set. Effectively, the brake level could be
altered on each of the three axle groups
by independently setting the brake air
pressure. The maximum deceleration
that could be achieved without the
combination vehicle leaving a curved test
lane was tested.
The tests were conducted by the
Australian Road research Board (ARRB)
at DECA’s Shepparton test track. ARTSA
gratefully acknowledges the excellent
commitment of ARRB and the financial
sponsorship of the Queensland
Department of Transport and Main
Roads.
The tests were modelled on the ‘braking
in a curve test’ which is in the US braking
rule FMVSS 121. This rule requires
demonstration of directional control on
a 500 ft (152.4 m) radius path of 9 ft (3.7
m) width, by a semi-trailer vehicle that
has a prime mover with antilock brakes.
The entry speed was 30 mph (48 km/h).
In ARTSA’s tests there were no electronic
brake controls.
The test prime mover and its semi-trailer
were modified so that the foundation
brakes on each of the three-axle groups
were supplied from an independently
controllable and regulated air-pressure
tanks. Braking was triggered by depressing
the clutch pedal, which initiated sudden
electrical operation of three solenoid
valves, which applied the pre-set air
pressure to the brake actuators of each
axle group, with the engine disconnected.
By varying the levels of the three
regulated air supplies, the test vehicles
could be set-up to simulate common
Australian and European brake setups.
Typical Australian prime mover and
trailer setting were made. These did not
have load-sensing brakes. The Australian
prime-mover (“ADR prime-mover”) had
75 per cent brake capacity on the steer
axle compared to the European (“ECE
prime-mover”) prime mover and the
Australian prime-mover had 115% drive
–axle group brake capacity compared to
the European prime-mover. The laden
Australian trailer (“ADR trailer”) tri-axle
group had about 140% brake capability
compared to the laden European trailer
(“ECE trailer”).
For some tests the lightly laden and half-
laden Australian trailer group was set-up
to simulate load-sensing brakes; that is,
the brake levels decrease as the weight on
the axle decreases. Load-sensing brakes
of the Australian set-ups were simulated
by setting the trailer brake air pressure to
65 per cent of the full-load value (“ADR
LSV”). The European truck and European
trailer brakes were set to comply with the
international brake rule ECE Regulation
13, which is mandated in Europe. A
certified European brake calculation
program was used to determine the
necessary settings. The European set-ups
both have simulated load-sensing brakes
as this has been a long-time requirement
in rule ECE R13. The European load-
sensing valve set-ups are lower than 65
per cent.
Tests were conducted with four different
load levels as shown in the table. A
satisfactory brake set-up can achieve
relatively high deceleration levels without
losing directional control for all the
loading conditions.
During testing, the brake control level
was increased progressively until the
vehicle could not be stopped within the
3.7 m wide lane on a wetted track. When
a failure occurred, the brake control level
was set to the previous pass level and the
previous test was verified. This was the
recorded pass level. Both the prime mover
and the trailer had disk brakes and air-bag
suspensions the rear axle groups. The
steer tyres were 295/80R whilst all other
tyres were 11R22.5. Preliminary straight-
line tests were conducted to determine the
force levels that each axle group produced
at key air pressures.
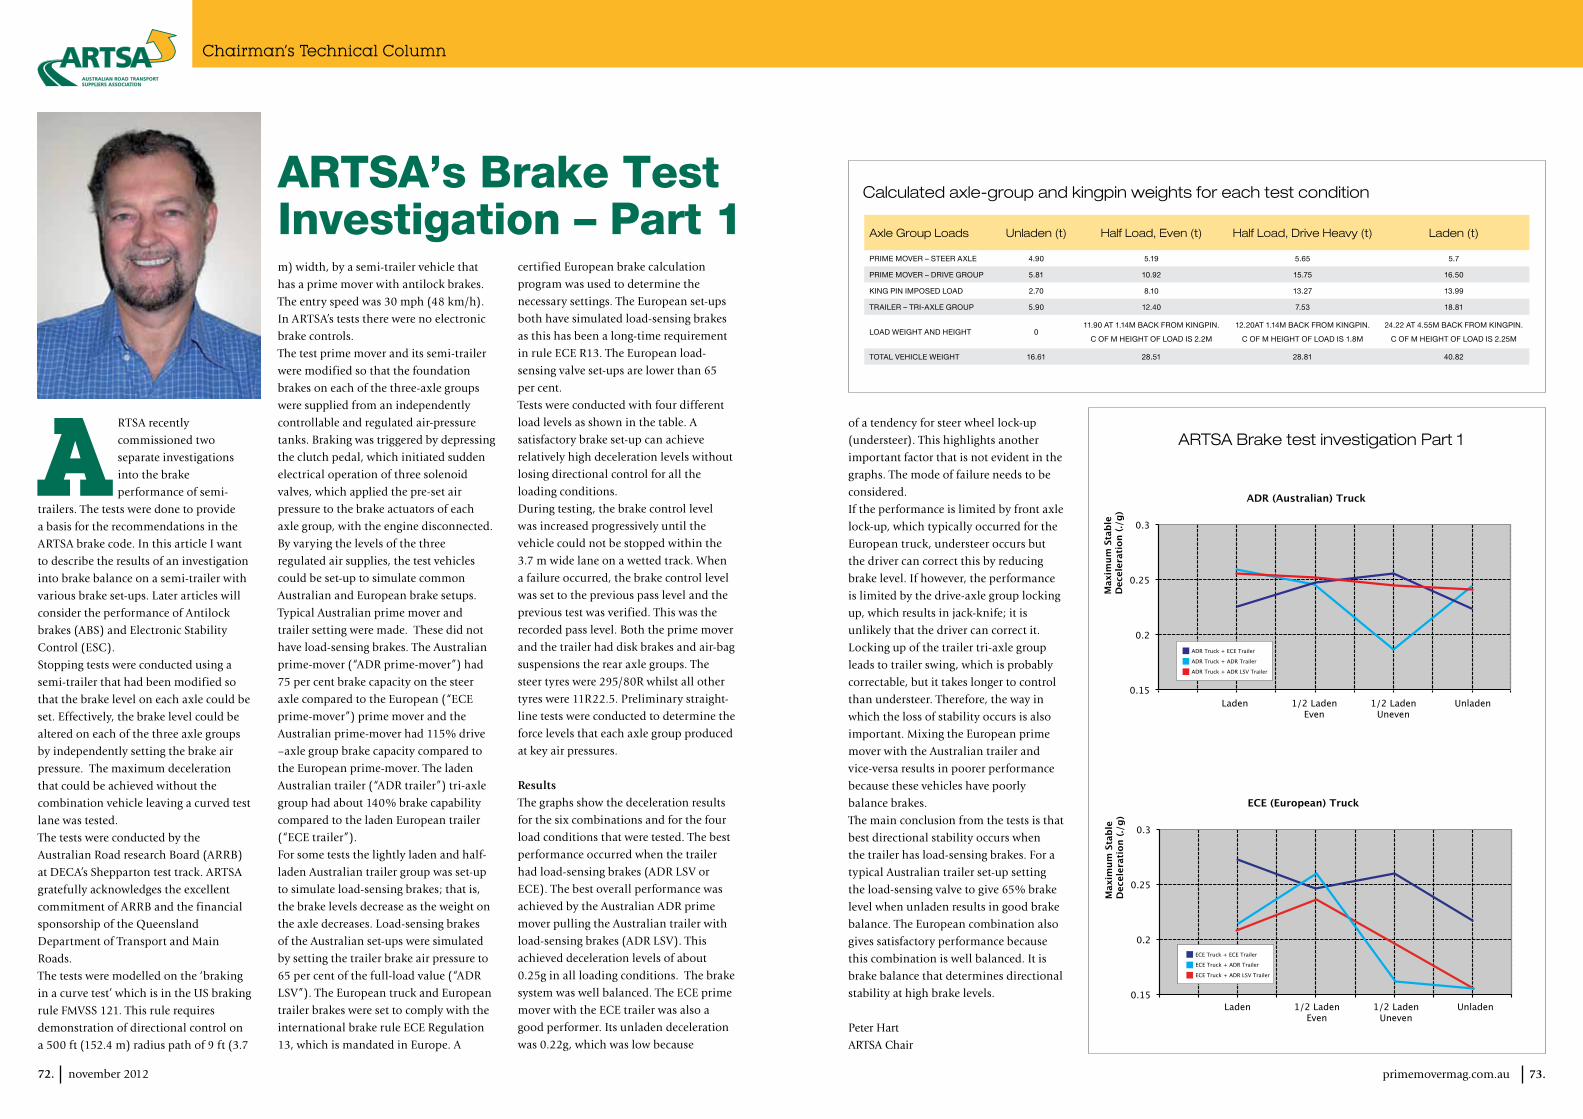
ResultsThe graphs show the deceleration results
for the six combinations and for the four
load conditions that were tested. The best
performance occurred when the trailer
had load-sensing brakes (ADR LSV or
ECE). The best overall performance was
achieved by the Australian ADR prime
mover pulling the Australian trailer with
load-sensing brakes (ADR LSV). This
achieved deceleration levels of about
0.25g in all loading conditions. The brake
system was well balanced. The ECE prime
mover with the ECE trailer was also a
good performer. Its unladen deceleration
was 0.22g, which was low because
ARTSA’s Brake Test Investigation – Part 1
72. november 2012
Axle Group Loads Unladen (t) Half Load, Even (t) Half Load, Drive Heavy (t) Laden (t)
Prime mover – steer axle 4.90 5.19 5.65 5.7
Prime mover – drive grouP 5.81 10.92 15.75 16.50
King Pin imPosed load 2.70 8.10 13.27 13.99
trailer – tri-axle grouP 5.90 12.40 7.53 18.81
load weight and height 011.90 at 1.14m bacK from KingPin.
c of m height of load is 2.2m
12.20at 1.14m bacK from KingPin.
c of m height of load is 1.8m
24.22 at 4.55m bacK from KingPin.
c of m height of load is 2.25m
total vehicle weight 16.61 28.51 28.81 40.82
Calculated axle-group and kingpin weights for each test condition
0.15
0.2
0.25
0.3
Max
imum
Sta
ble
Dec
eler
atio
n (./
g)
ECE (European) Truck
0.15Laden 1/2 Laden
Even1/2 Laden
UnevenUnladen Laden 1/2 Laden
Even1/2 Laden
UnevenUnladen
0.2
0.25
0.3
Max
imum
Sta
ble
Dec
eler
atio
n (./
g)
ADR (Australian) Truck
ADR Truck + ECE Trailer
ADR Truck + ADR Trailer
ADR Truck + ADR LSV Trailer
ECE Truck + ECE Trailer
ECE Truck + ADR Trailer
ECE Truck + ADR LSV Trailer
ARTSA Brake test investigation Part 1
group weights were: steer axle - 6150
kg, drive group - 8850 kg, tri-axle trailer
group - 8650 kg, all up weight - 26,650
kg. Wheel lock-up was observed to occur
on the drive- and trailer-axle groups (but
not the steer axle) during tests.
There is an optimal tyre footprint for
braking. To maintain the optimal tyre
footprint the tyre inflation pressure
should change with load on the
tyre. If properly set, a Central Tyre
Inflation (CTI) system can manage tyre
pressure according to manufacturer’s
recommendations. Some stopping tests
were conducted with the tyre pressures
set to high (656 kPa = 95 psi which is
appropriate for a fully loaded tyre) and
low (290 kPa = 42 psi which is optimum
for the lightly-laden tyre) to determine
the effect of tyre pressure on stopping
distance.
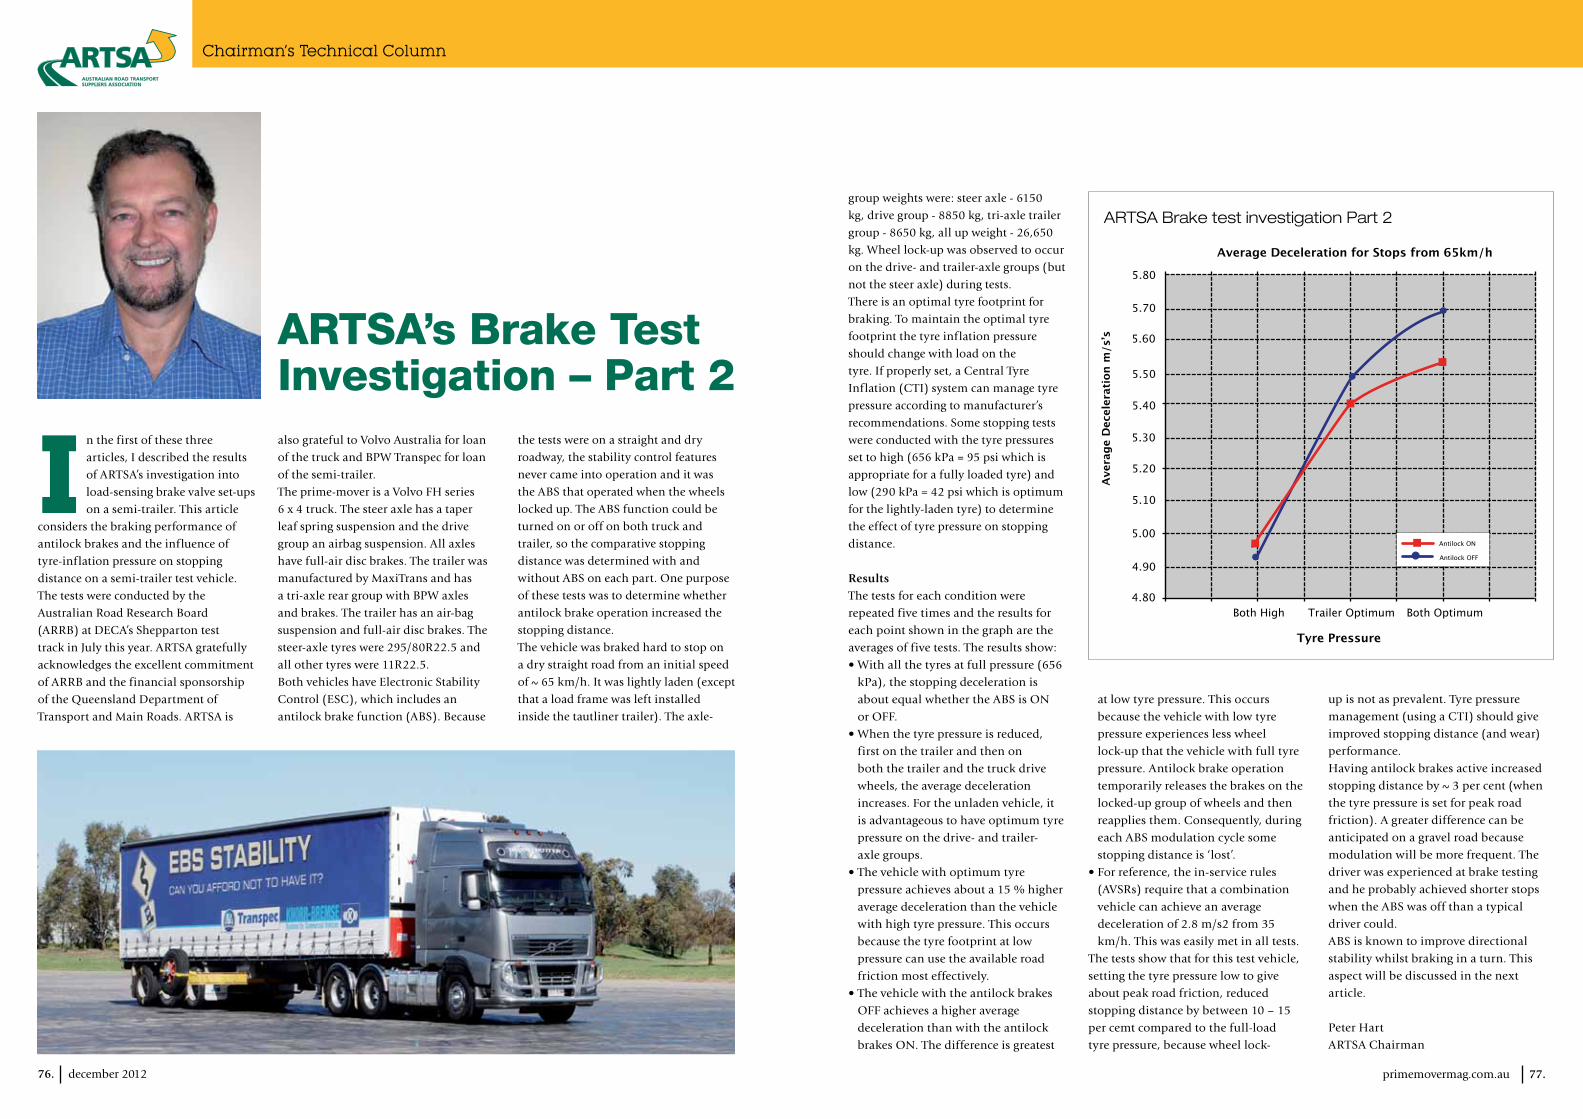
ResultsThe tests for each condition were
repeated five times and the results for
each point shown in the graph are the
averages of five tests. The results show:
• With all the tyres at full pressure (656
kPa), the stopping deceleration is
about equal whether the ABS is ON
or OFF.
• When the tyre pressure is reduced,
first on the trailer and then on
both the trailer and the truck drive
wheels, the average deceleration
increases. For the unladen vehicle, it
is advantageous to have optimum tyre
pressure on the drive- and trailer-
axle groups.
• The vehicle with optimum tyre
pressure achieves about a 15 % higher
average deceleration than the vehicle
with high tyre pressure. This occurs
because the tyre footprint at low
pressure can use the available road
friction most effectively.
• The vehicle with the antilock brakes
OFF achieves a higher average
deceleration than with the antilock
brakes ON. The difference is greatest
at low tyre pressure. This occurs
because the vehicle with low tyre
pressure experiences less wheel
lock-up that the vehicle with full tyre
pressure. Antilock brake operation
temporarily releases the brakes on the
locked-up group of wheels and then
reapplies them. Consequently, during
each ABS modulation cycle some
stopping distance is ‘lost’.
• For reference, the in-service rules
(AVSRs) require that a combination
vehicle can achieve an average
deceleration of 2.8 m/s2 from 35
km/h. This was easily met in all tests.
The tests show that for this test vehicle,
setting the tyre pressure low to give
about peak road friction, reduced
stopping distance by between 10 – 15
per cemt compared to the full-load
tyre pressure, because wheel lock-
up is not as prevalent. Tyre pressure
management (using a CTI) should give
improved stopping distance (and wear)
performance.
Having antilock brakes active increased
stopping distance by ~ 3 per cent (when
the tyre pressure is set for peak road
friction). A greater difference can be
anticipated on a gravel road because
modulation will be more frequent. The
driver was experienced at brake testing
and he probably achieved shorter stops
when the ABS was off than a typical
driver could.
ABS is known to improve directional
stability whilst braking in a turn. This
aspect will be discussed in the next
article.
Peter Hart
ARTSA Chairman
Chairman’s Technical Column
primemovermag.com.au 77.
In the first of these three
articles, I described the results
of ARTSA’s investigation into
load-sensing brake valve set-ups
on a semi-trailer. This article
considers the braking performance of
antilock brakes and the influence of
tyre-inflation pressure on stopping
distance on a semi-trailer test vehicle.
The tests were conducted by the
Australian Road Research Board
(ARRB) at DECA’s Shepparton test
track in July this year. ARTSA gratefully
acknowledges the excellent commitment
of ARRB and the financial sponsorship
of the Queensland Department of
Transport and Main Roads. ARTSA is
also grateful to Volvo Australia for loan
of the truck and BPW Transpec for loan
of the semi-trailer.
The prime-mover is a Volvo FH series
6 x 4 truck. The steer axle has a taper
leaf spring suspension and the drive
group an airbag suspension. All axles
have full-air disc brakes. The trailer was
manufactured by MaxiTrans and has
a tri-axle rear group with BPW axles
and brakes. The trailer has an air-bag
suspension and full-air disc brakes. The
steer-axle tyres were 295/80R22.5 and
all other tyres were 11R22.5.
Both vehicles have Electronic Stability
Control (ESC), which includes an
antilock brake function (ABS). Because
the tests were on a straight and dry
roadway, the stability control features
never came into operation and it was
the ABS that operated when the wheels
locked up. The ABS function could be
turned on or off on both truck and
trailer, so the comparative stopping
distance was determined with and
without ABS on each part. One purpose
of these tests was to determine whether
antilock brake operation increased the
stopping distance.
The vehicle was braked hard to stop on
a dry straight road from an initial speed
of ~ 65 km/h. It was lightly laden (except
that a load frame was left installed
inside the tautliner trailer). The axle-
ARTSA’s Brake Test Investigation – Part 2
76. december 2012
ARTSA Brake test investigation Part 2
4.80
4.90
5.00
5.10
5.20
5.30
5.40
5.60
5.70
5.80
5.50
Ave
rage
Dec
eler
atio
n m
/sʼs
Average Deceleration for Stops from 65km/h
Tyre Pressure
Both High Trailer Optimum Both Optimum
Antilock ON
Antilock OFF
Chairman’s Technical Column
primemovermag.com.au 81.
This article, which is Part 3
in the series of four articles,
describes testing that
ARTSA commissioned to
investigate the effectiveness
of roll-stability control on a semi-
trailer. The tests provide a basis for
the recommendations in the ARTSA
brake code.
Stopping tests were conducted using a
semi-trailer that was braked to stop on
a sealed, dry, flat and curved roadway
having a ‘J-turn’ radius of 46m (150 ft).
The test semi-trailer driver attempted to
follow the ‘J-turn’ within a 3.7 m lane, at
a constant speed. The maximum entry
speed that could be achieved without
the trailer rolling over was determined.
Rollover was judged to have occurred
when the outrigger safety-wheel touched
the roadway. The same driver drove all
of the 99 test runs and the driver did not
apply the brakes until the performance
had been determined.
Testing was conducted with truck
Electronic Stability Control (ESC) on or
off and with the trailer Electronic Braking
System (EBS) on or off. Both the ESC and
EBS have a roll-stability control feature.
Because the tests did not involve any
sudden evasive maneouvers, there was
no ABS intervention and no differential
ESC intervention. The only response
that could be triggered was for the roll-
stability control feature to apply the
brakes and slow the vehicle for tests with
the electronic control system turned on.
The prime-mover was a Volvo FH 6x4 and
the trailer was MaxiTRANS with a BPW
tri-axle set. (See article 2 for additional
vehicle details). Volvo and BPW provided
the test vehicles without charge and the
financial support of the Queensland
Department of Transport and Main Roads
is also gratefully acknowledged. The tests
were conducted professionally by the
Australian Road Research Board (ARRB)
at DECA’s Shepparton test track.
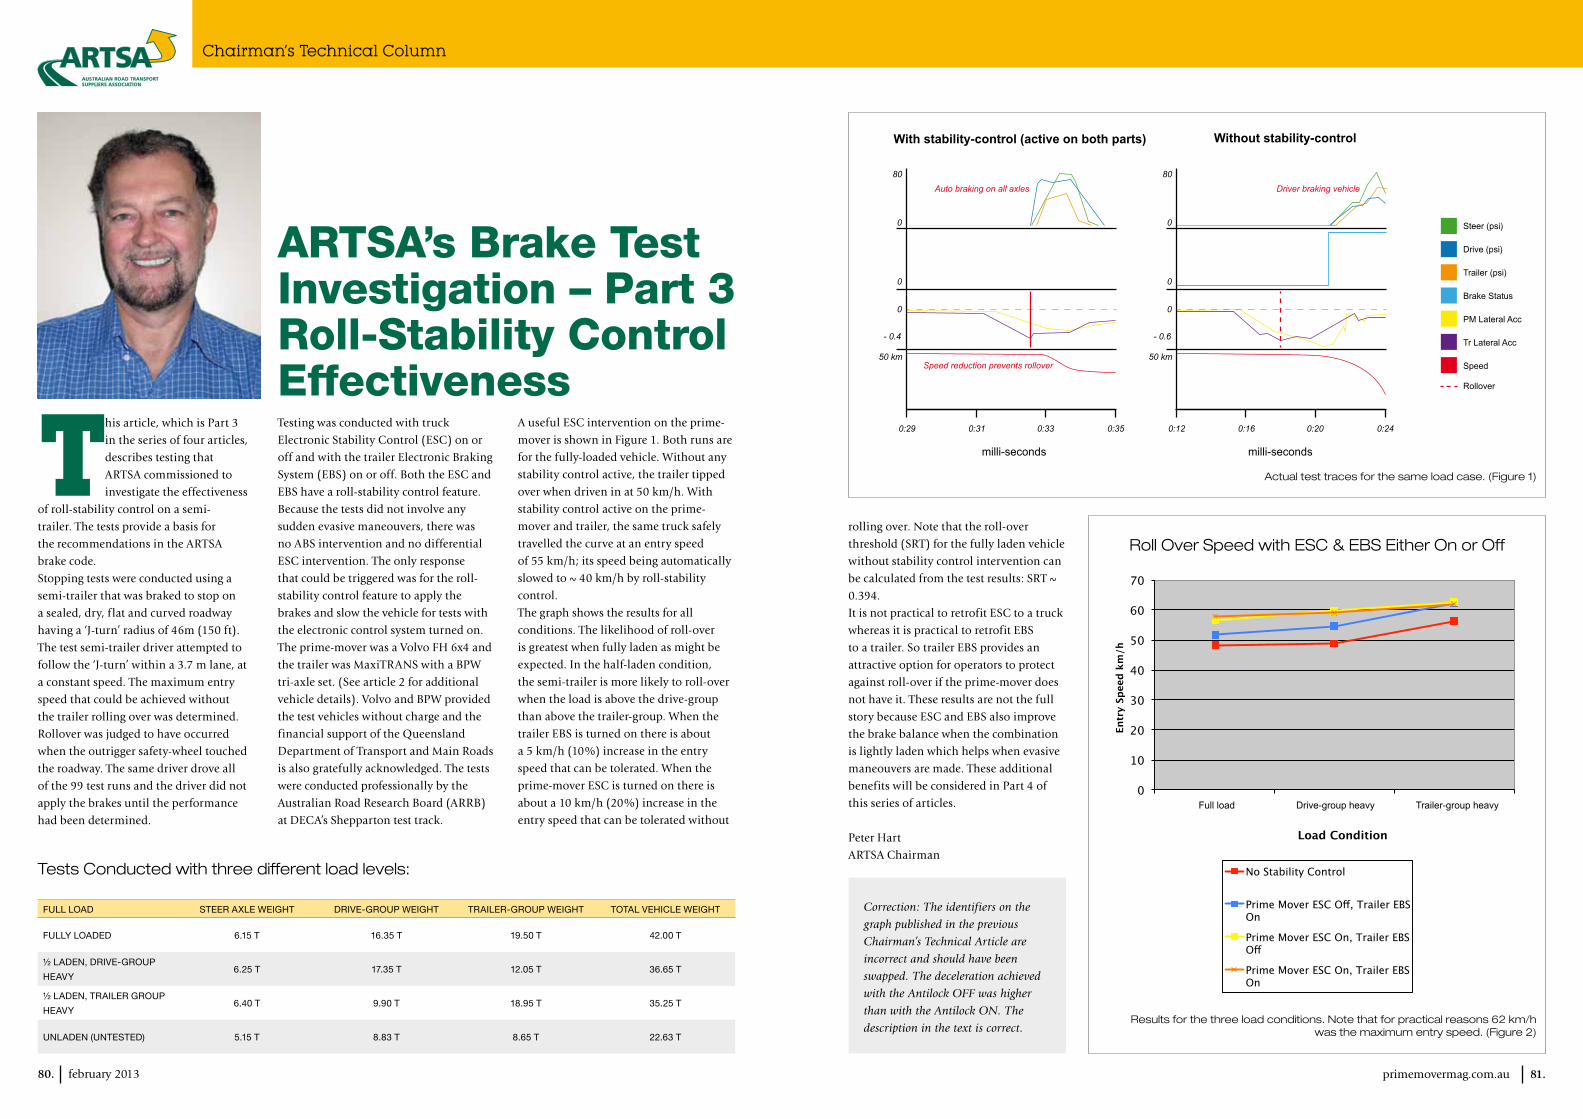
A useful ESC intervention on the prime-
mover is shown in Figure 1. Both runs are
for the fully-loaded vehicle. Without any
stability control active, the trailer tipped
over when driven in at 50 km/h. With
stability control active on the prime-
mover and trailer, the same truck safely
travelled the curve at an entry speed
of 55 km/h; its speed being automatically
slowed to ~ 40 km/h by roll-stability
control.
The graph shows the results for all
conditions. The likelihood of roll-over
is greatest when fully laden as might be
expected. In the half-laden condition,
the semi-trailer is more likely to roll-over
when the load is above the drive-group
than above the trailer-group. When the
trailer EBS is turned on there is about
a 5 km/h (10%) increase in the entry
speed that can be tolerated. When the
prime-mover ESC is turned on there is
about a 10 km/h (20%) increase in the
entry speed that can be tolerated without
ARTSA’s Brake Test Investigation – Part 3Roll-Stability Control Effectiveness
80. february 2013
Full load Steer axle Weight drive-group Weight trailer-group Weight total vehicle Weight
Fully loaded 6.15 t 16.35 t 19.50 t 42.00 t
½ laden, drive-group
heavy6.25 t 17.35 t 12.05 t 36.65 t
½ laden, trailer group
heavy6.40 t 9.90 t 18.95 t 35.25 t
unladen (unteSted) 5.15 t 8.83 t 8.65 t 22.63 t
Tests Conducted with three different load levels:
rolling over. Note that the roll-over
threshold (SRT) for the fully laden vehicle
without stability control intervention can
be calculated from the test results: SRT ~
0.394.
It is not practical to retrofit ESC to a truck
whereas it is practical to retrofit EBS
to a trailer. So trailer EBS provides an
attractive option for operators to protect
against roll-over if the prime-mover does
not have it. These results are not the full
story because ESC and EBS also improve
the brake balance when the combination
is lightly laden which helps when evasive
maneouvers are made. These additional
benefits will be considered in Part 4 of
this series of articles.
Peter Hart
ARTSA Chairman
Correction: The identifiers on the
graph published in the previous
Chairman’s Technical Article are
incorrect and should have been
swapped. The deceleration achieved
with the Antilock OFF was higher
than with the Antilock ON. The
description in the text is correct.
Without stability-control
milli-secondsmilli-seconds
With stability-control (active on both parts)
Steer (psi)
Drive (psi)
Trailer (psi)
Brake Status
PM Lateral Acc
Tr Lateral Acc
Speed
Rollover
Auto braking on all axles
Speed reduction prevents rollover50 km
0:29 0:31 0:33 0:35 0:12 0:16 0:20 0:24
0
0
0
80
- 0.4
50 km
0
0
0
80
- 0.6
Driver braking vehicle
Actual test traces for the same load case. (Figure 1)
0
10
20
30
40
50
60
70
1 3
Entr
y Sp
eed
km/h
Load Condition
Roll Over Speed with ESC & EBS Either On or Off
No Stability Control
Prime Mover ESC Off, Trailer EBS On
Prime Mover ESC On, Trailer EBS Off
Prime Mover ESC On, Trailer EBS On
Results for the three load conditions. Note that for practical reasons 62 km/h was the maximum entry speed. (Figure 2)
0
10
20
30
40
50
60
70
1 3
Entr
y Sp
eed
km/h
Load Condition
Roll Over Speed with ESC & EBS Either On or Off
No Stability Control
Prime Mover ESC Off, Trailer EBS On
Prime Mover ESC On, Trailer EBS Off
Prime Mover ESC On, Trailer EBS On
Full load Drive-group heavy Trailer-group heavy
Roll Over Speed with ESC & EBS Either On or Off
Load Case TruCk esC TraiLer esC enTry speed km/h exiT speed km/hbrake inTervenTions oCCurred
sTeer axLe drive Group TraiLer axLe Group
unLaden
ToTaL 23.6 T
on on 43.8 34.5 noyes. Two puLses of
~ 35 kpano
on off 43.8* 34.5* noyes. Two puLses of
~ 35 kpano
off on 38.8 35.7 no no no
off off 38.8* 35.7* no no no
drive
heavy
ToTaL 35.7 T
on on 40.3 30.5 noyes. Two puLses of
~ 35 kpano
on off 34.8 33.5 noyes. Two puLses of
~ 35 kpano
off on 35.5 33.2 no no no
off off 37.0 34.3 no no no
TraiLer
heavy
ToTaL 35.3 T
on on 43.3 35.1 noyes. Two puLses of
~ 35 kpa
yes. Three puLses
of ~ 140 kpa
on off 42.6 30.8 noyes. Two puLses of
~ 35 kpa
yes. Two puLses of
~ 140 kpa
off on 38.4 33.2 no noyes. one puLse of ~
140 kpa
off off 42.3 35.9 no no no
Chairman’s Technical Column
primemovermag.com.au 73.
This is the fourth article about
ARTSA’a brake test program.
The tests were conducted to
measure the performance
of new brake technologies
on the stopping distance and stability
performance of a semi-trailer combination.
The first article considered the brake
balance performance of typical Australian
and European brake set-ups. The best
performance occurred with an Australian
prime mover pulling an Australian trailer
that had a load sensing valve (LSV) set to
65 per cent when unladen and 100 per cent
when fully laden.
The second article reported on the effect
of Antilock brakes (ABS) and Central
Tyre Inflation (CTI) on the straight-line
emergency stopping distance performance
of the unladen semi-trailer combination
on a dry road. The best performance
occurred when the tyre pressure was set
to give the optimum footprint, which
occurred with tyre pressure at 290 kPa.
With optimum tyre pressure, the stopping
distance is about 15 per cent shorter than
with high tyre pressure (650 kpa). Antilock
brakes result in slightly increased stopping
distances because brake modulation
temporarily releases the brakes, however
the change is insignificant with high
tyre pressure. The ABS benefit is the
improvement in directional control for all
tyre pressure levels.
The third article described the cornering
stability of the laden semi-trailer
combination when the prime-mover and
/ or the trailer had an active roll-stability
system (RSP). For cornering at 60 km/h
the prime-mover RSP (which is a feature
of the prime-mover Electronic Stability
Control system) gives about a 10 km/h
safety benefit whilst the trailer RSP gives
about a 5 km/h safety benefit.
This article concerns Electronic Stability
Control (ESC). For the prime-mover,
ESC is an intelligent electronic brake
control system that can activate selected
prime-mover brakes and / or all the trailer
brakes keep the vehicle on, or close to
the desired path. To do this, the system
monitors the forward velocity, the yaw
velocity, the stopping deceleration, the
cornering deceleration, and the driver’s
control inputs. All the sensors and valves
communicate electronically. ESC always
includes an antilock brake feature, roll-
stability program (RSP) and electronic
brake management; which takes account of
the load on the rear suspension.
The prime-mover was a Volvo FH 540
(6x4) that is equipped with a Knorr
Bremse ESC system. The semi-trailer was
a MaxiTrans tri-axle trailer with BPW
foundation disc brakes and Electronically
Controlled Brake System (EBS). During
our tests the ESC only activated all the
drive- ‐group brakes and all the trailer
brakes. Therefore the prime-mover ESC
has a two-level intervention. These
interventions are intended to slow the
vehicle. The autonomous brake action on
the drive-group can be different on each
side, whereas autonomous trailer braking
is always the same on each side.
The trailer EBS includes a roll-stability
program (RSP) and because of this it can
be regarded as a ‘trailer ESC’ however,
unlike the prime-mover ESC, it cannot
activate braking on one side of the trailer
only. The trailer EBS will intervene to slow
the vehicle when a high risk of roll-over is
determined. This action might be triggered
during the double lane-change maneouver.
The sensors located on the prime-mover
will experience the maneouver before the
sensors on the trailer do. So intervention
by the prime-mover ESC will probably
occur before the trailer EBS intervenes.
The performance of ESC was investigated
by conducting a double-lane-change
maneouver. The vehicle was driven in at
successively higher starting speeds and
then the same avoidance maneuover was
made by the driver. The intended trajectory
was a sudden diversion from one lane into
the next lane and then back. The same
driver achieved about the same steering
input each time. The test track was kept
wet to promote sliding of the wheels. A
run through the course was classified as a
‘pass’ if the observers and the GPS record
declared that the vehicle stayed within the
3.7 m lane width.
The tests were conducted for three loading
conditions; which were:
• Unladen.Totalweight–23.6t.
• Half-ladenwiththeaddedloadabove
the drive-axle group. Total weight =
35.7t.
• Half-ladenwiththeaddedloadabove
the trailer tri-axle group. Total weight =
35.3 t.
The fully laden case was not tested
because it induced a roll-over response,
which had been previously tested (see the
third article). This round of testing was
intended to induce a response to sliding.
It was however, noted during preliminary
checks that both truck and trailer ESCs did
intervene for the fully laden condition.
The results are given in the table. The
following important observations were
made:
• Forthistestvehicle,allpasseshadan
exist speed of less than 36 km/h.
• ThetrailerEBSintervention(whichis
due to the Roll Stability Program) only
occurs when the trailer is loaded.
• Theprime-moverESCintervention
occurred for all the load cases.
• Theprime-moversteer-axlebrakes
were never part of the truck ESC
intervention.
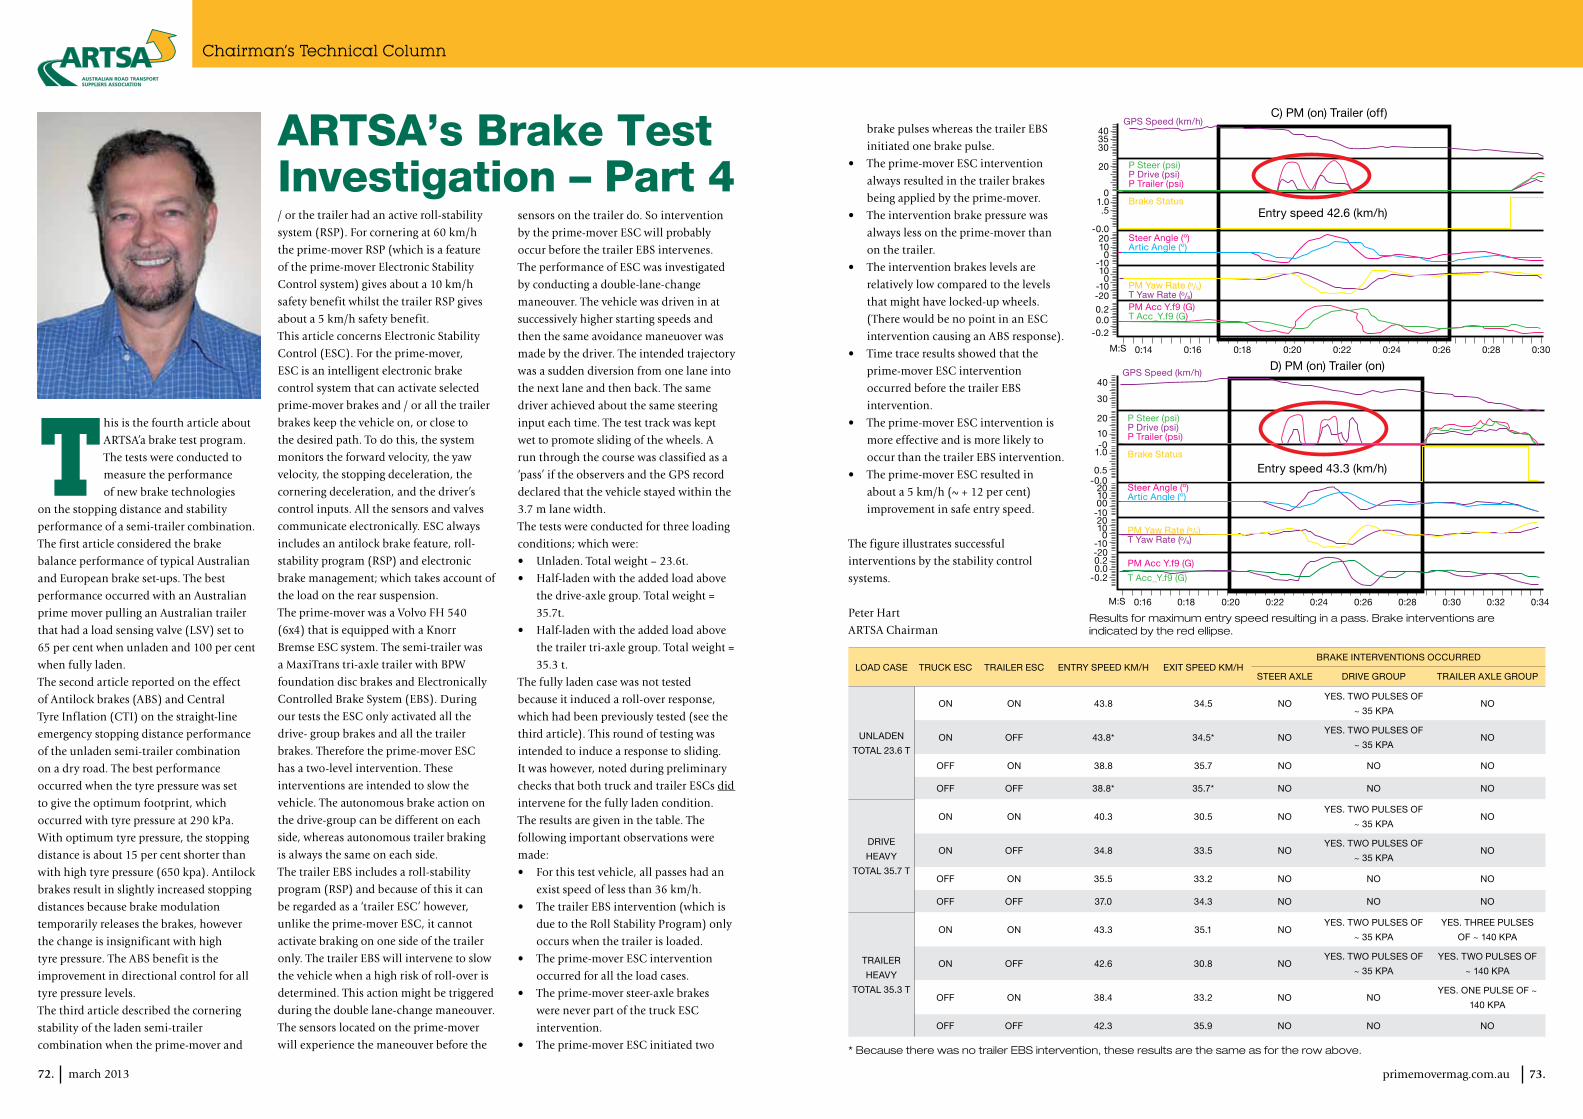
• Theprime-moverESCinitiatedtwo
ARTSA’s Brake Test Investigation – Part 4
72. march 2013
brake pulses whereas the trailer EBS
initiated one brake pulse.
• Theprime-moverESCintervention
always resulted in the trailer brakes
being applied by the prime-mover.
• Theinterventionbrakepressurewas
always less on the prime-mover than
on the trailer.
• Theinterventionbrakeslevelsare
relatively low compared to the levels
that might have locked-up wheels.
(There would be no point in an ESC
intervention causing an ABS response).
• Timetraceresultsshowedthatthe
prime-mover ESC intervention
occurred before the trailer EBS
intervention.
• Theprime-moverESCinterventionis
more effective and is more likely to
occur than the trailer EBS intervention.
• Theprime-moverESCresultedin
about a 5 km/h (~ + 12 per cent)
improvement in safe entry speed.
The figure illustrates successful
interventions by the stability control
systems.
Peter Hart
ARTSA Chairman
* Because there was no trailer EBS intervention, these results are the same as for the row above.
Results for maximum entry speed resulting in a pass. Brake interventions are indicated by the red ellipse.
40
m:s
Gps speed (km/h)
entry speed 42.6 (km/h)
C) pm (on) Trailer (off)
p steer (psi)p drive (psi)p Trailer (psi)
steer angle (º)artic angle (º)
pm yaw rate ( )T yaw rate ( )pm acc y.f9 (G)T acc_y.f9 (G)
brake status
0:14 0:16 0:18 0:20 0:22 0:24 0:26 0:28 0:30
3530
20
01.0.5
-0.020100
-10100
-10-20
0.20.0
-0.2
40
30
20
10-0
1.0
0.5-0.0
201000-1020100
-10-200.20.0
-0.2
m:s
Gps speed (km/h)
entry speed 43.3 (km/h)
d) pm (on) Trailer (on)
p steer (psi)p drive (psi)p Trailer (psi)
steer angle (º)artic angle (º)
pm yaw rate ( )T yaw rate ( )
pm acc y.f9 (G)
T acc_y.f9 (G)
brake status
0:16 0:18 0:20 0:22 0:24 0:26 0:28 0:30 0:340:32