Embed Size (px)
Citation preview

Arts & Sciences Enrollment 2006-2012

Fall 2012 Overview: Students admitted
College Last Year Current % Change
CAS 967 876 -9.4
Business 162 180 +11.0
Professional Studies 807 743 -7.9
General University 516 499 -3.3
2452 2298 -6.3

2012 CAS Fall Overview
• Art & Design 175 +8• Biology 170 -2• CAPS 32 -21• Chemistry 51 -4• Economics 2 -1• English 50 +12• EEGS 63 -4

2012 Fall Overview
• History 31 -5• Int Studies 9 +1• MLL 5 +3• Math & CS 45 -6• Music 12 -12• Physics 6 -3• Pre-Med 75 -5

2012 CAS Fall Overview
• Philosophy 2 -1• Political Science 29 -17• Psychology 71 -42*
* Applied child development suspended (18)


2006-2012 First Major
• Art & Design 600 726 +21%• Biology 399 635 +60%• CAPS 340 259 -24%• Chemistry 116 143 +23%• Economics 37 33 -10%• English 394 306 -22%• EEGS 220 302 +37%

2006-2012 First Major
• History 214 142 -34%• MLL 97 88 -10%• Math & CS 182 184 +1%• Music 77 36 -53%• NAS 0 0 0%• Physics 27 29 +7%• Pre Prof’ (health) 118 127 +8%

2006-2012 First Major
• Philosophy 18 16 -11%• Political Science 210 130 -38%• Psychology 325 323 +0.5

Which majors have seen the greatest growth & decline?

Biology 2006-12
• Biology 118 198• Biochem’ 0 1• Botany 12 0• Ecology 32 54• Fisheries 0 50• Microbiology 13 25• Physiology 100 110

Biology
• Pre- Optometry 6 5• Pre Physical Therap’ 24• Pre- Vet 26 36• Biology Sec Ed 6 11• Zoology 86 121

Art & Design

Presentation to the Educational Policy Committee for Enhanced Faculty Positions December 5, 2011
School of Art and Design
Chemistry

Chemistry 2006-12
• Biochemistry 33 45• Chemistry (ACS) 11 33• Chemistry 29 0• Forensic Biochem’ 13 43• Pre- Pharmacy 24 19• Chem Sec. Ed. 3 2• Water Science 3 0
EEGS

EEGS 2006-12
• Environ’ Cons’ 70 48*• Earth Science 19 27• Environ’ Sci’ 71 78• Environ’ Sust’ 0 113• Human Geog’ 12 3*• Physical Geog’ 24 7*• Planning 11 0*
* Suspended as part of curriculum reform
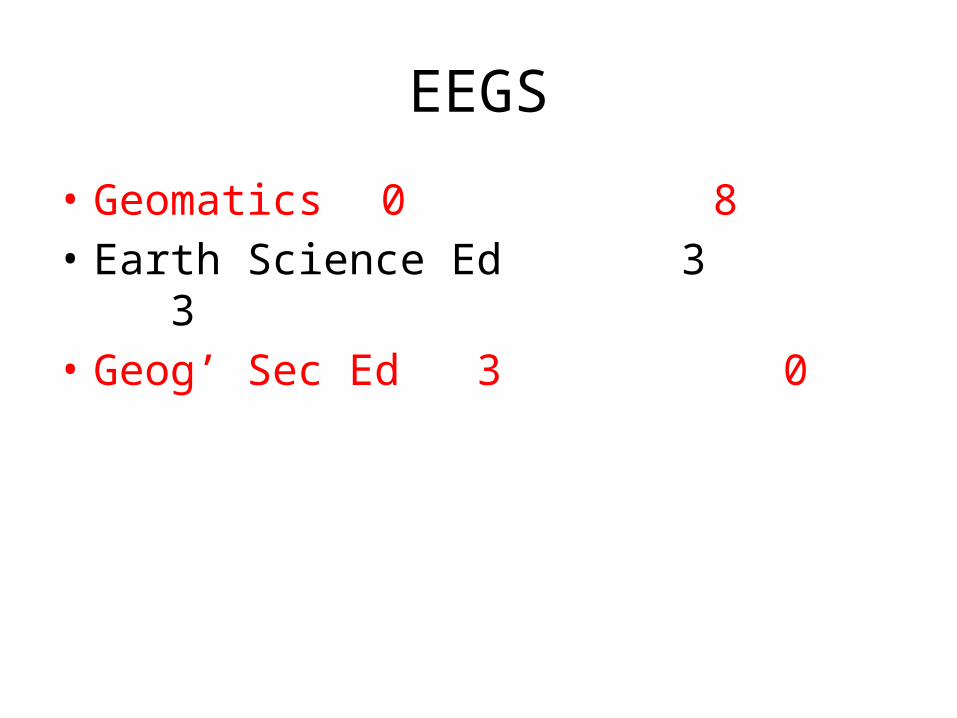
EEGS
• Geomatics 0 8• Earth Science Ed 3 3• Geog’ Sec Ed 3 0
Departments with declining enrollments
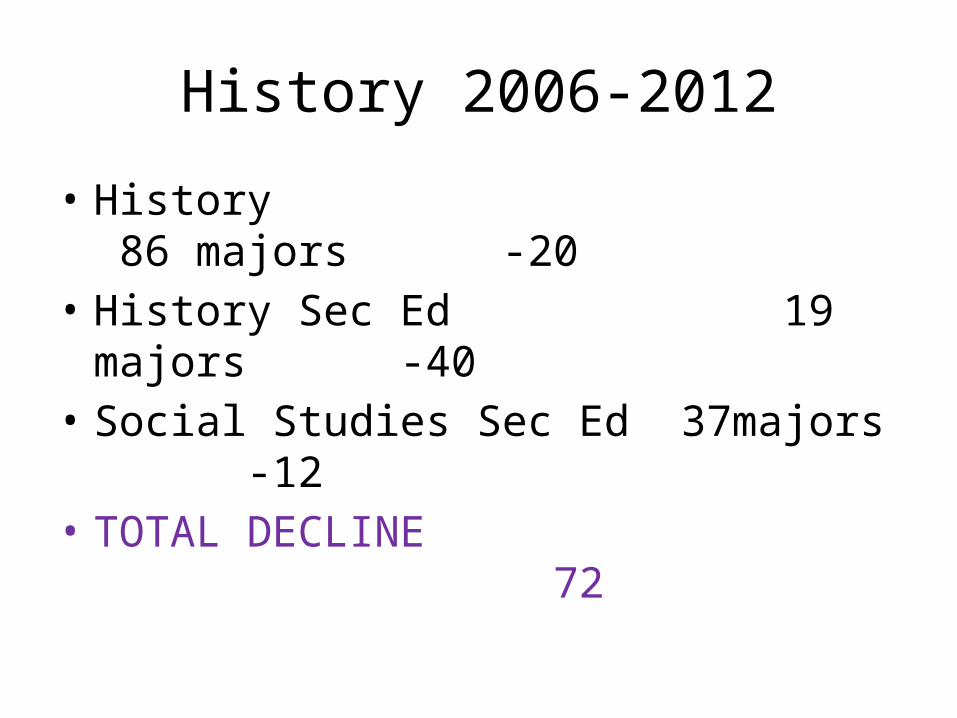
History 2006-2012
• History 86 majors -20• History Sec Ed 19 majors -40• Social Studies Sec Ed 37majors -12• TOTAL DECLINE 72


Political Science 2006-12
• Public Management 4 majors + 4• Pre-Law 13 majors -14• Political Science 41 majors -8• Political Science- Pre Law 47 majors -6• Public Administration 24 majors -51• Political Science Ed 1 major -5• TOTAL DECLINE 80

Music
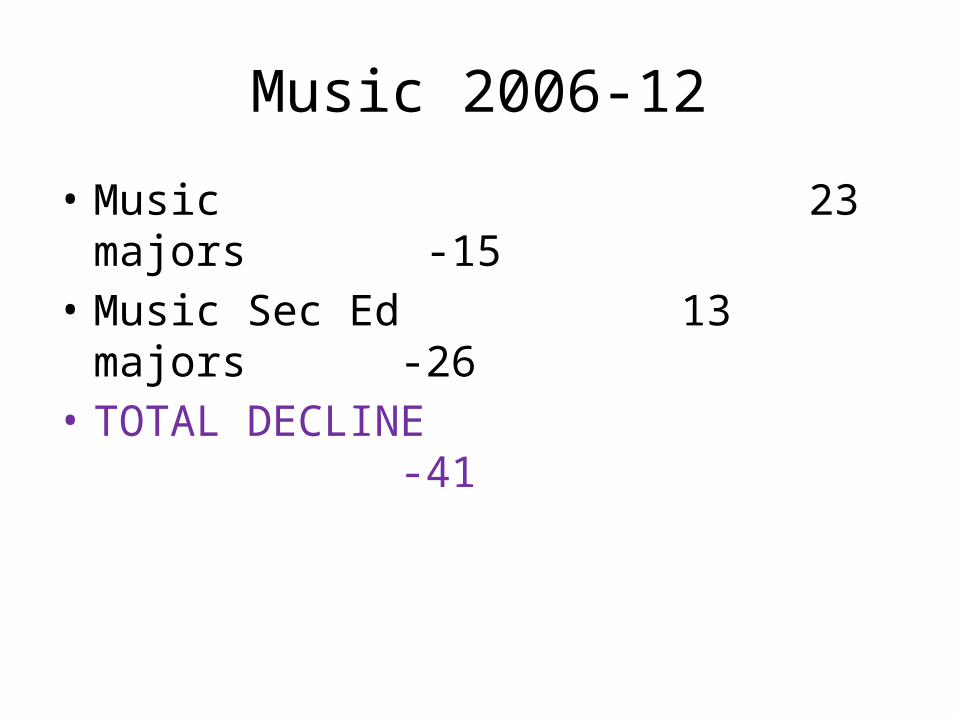
Music 2006-12
• Music 23 majors -15• Music Sec Ed 13 majors -26• TOTAL DECLINE -41

Communication & Performance Studies

CAPS 2006-12
• Communication Studies 54 majors • Electronic Journalism 20 majors -23 • Entertainment & Sport 30 majors -47• Multimedia Journalism 12 majors• Media Production 63 majors -14• Public Relations 52 majors -40• Theatre 28 majors +2 • TOTAL DECLINE 81
Speech communication and Media studies discontinued 25 majors in ‘06

English 2012

English 2006-12
• Creative Writing 20 +3• English Grad Bound 14 -5• English 129 +3• English Sec Ed 59 -31• English Writing 84 -58• TOTAL DECLINE 88

Conclusions
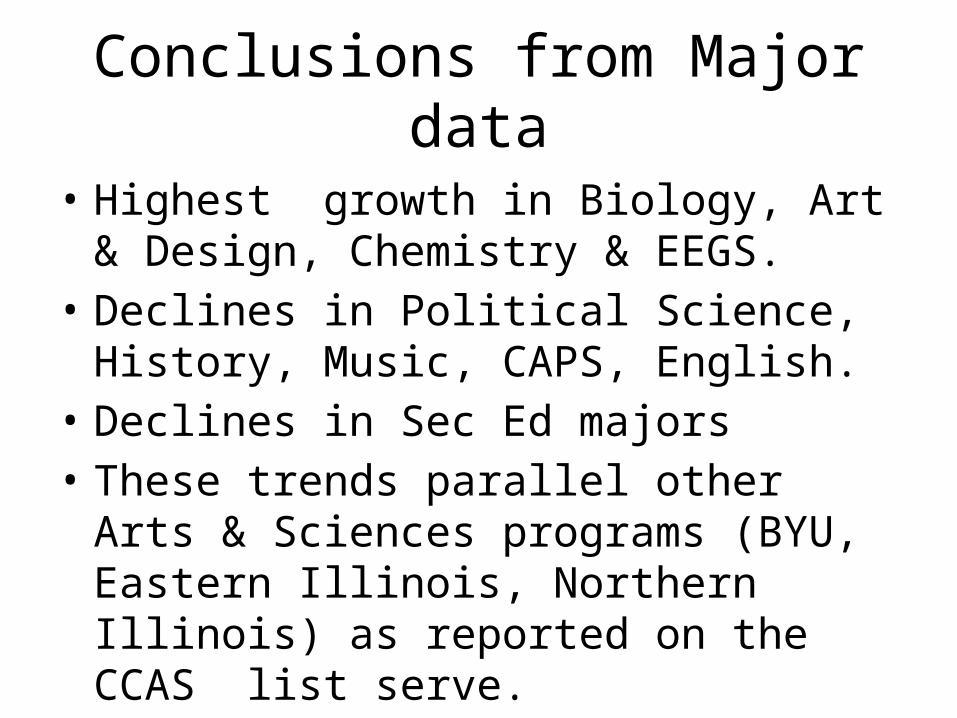
Conclusions from Major data
• Highest growth in Biology, Art & Design, Chemistry & EEGS.
• Declines in Political Science, History, Music, CAPS, English.
• Declines in Sec Ed majors• These trends parallel other Arts & Sciences
programs (BYU, Eastern Illinois, Northern Illinois) as reported on the CCAS list serve.