Embed Size (px)
Citation preview
NBER WORKING PAPER SERIES
ARTIFICIAL INTELLIGENCE AND ECONOMIC GROWTH
Philippe AghionBenjamin F. Jones
Charles I. Jones
Working Paper 23928http://www.nber.org/papers/w23928
NATIONAL BUREAU OF ECONOMIC RESEARCH1050 Massachusetts Avenue
Cambridge, MA 02138October 2017
We are grateful to Ajay Agrawal, Mohammad Ahmadpoor, Adrien Auclert, Sebastian Di Tella, Patrick Francois, Joshua Gans, Avi Goldfarb, Pete Klenow, Hannes Mahlmberg, Pascual Restrepo, Chris Tonetti, Michael Webb, and participants at the NBER Conference on Artificial Intelligence for helpful discussion and comments. The views expressed herein are those of the authors and do not necessarily reflect the views of the National Bureau of Economic Research.
NBER working papers are circulated for discussion and comment purposes. They have not been peer-reviewed or been subject to the review by the NBER Board of Directors that accompanies official NBER publications.
© 2017 by Philippe Aghion, Benjamin F. Jones, and Charles I. Jones. All rights reserved. Short sections of text, not to exceed two paragraphs, may be quoted without explicit permission provided that full credit, including © notice, is given to the source.
Artificial Intelligence and Economic GrowthPhilippe Aghion, Benjamin F. Jones, and Charles I. JonesNBER Working Paper No. 23928October 2017JEL No. O3,O4
ABSTRACT
This paper examines the potential impact of artificial intelligence (A.I.) on economic growth. We model A.I. as the latest form of automation, a broader process dating back more than 200 years. Electricity, internal combustion engines, and semiconductors facilitated automation in the last century, but A.I. now seems poised to automate many tasks once thought to be out of reach, from driving cars to making medical recommendations and beyond. How will this affect economic growth and the division of income between labor and capital? What about the potential emergence of “singularities” and “superintelligence,” concepts that animate many discussions in the machine intelligence community? How will the linkages between A.I. and growth be mediated by firm-level considerations, including organization and market structure? The goal throughout is to refine a set of critical questions about A.I. and economic growth and to contribute to shaping an agenda for the field. One theme that emerges is based on Baumol’s “cost disease” insight: growth may be constrained not by what we are good at but rather by what is essential and yet hard to improve.
Philippe AghionCollege de France3 Rue D'Ulm75005 [email protected]
Benjamin F. JonesNorthwestern UniversityKellogg School of ManagementDepartment of Management and Strategy2001 Sheridan RoadEvanston, IL 60208and [email protected]
Charles I. JonesGraduate School of BusinessStanford University655 Knight WayStanford, CA 94305-4800and [email protected]
2 P. AGHION, B. JONES, AND C. JONES
1. Introduction
This paper considers the implications of artificial intelligence for economic growth.
Artificial intelligence (A.I.) can be defined as “the capability of a machine to imitate
intelligent human behavior” or “an agent’s ability to achieve goals in a wide range of
environments.”1 These definitions immediately evoke fundamental economic issues.
For example, what happens if A.I. allows an ever-increasing number of tasks previously
performed by human labor to become automated? A.I. may be deployed in the ordinary
production of goods and services, potentially impacting economic growth and income
shares. But A.I. may also change the process by which we create new ideas and tech-
nologies, helping to solve complex problems and scaling creative effort. In extreme ver-
sions, some observers have argued that A.I. can become rapidly self-improving, lead-
ing to “singularities” that feature unbounded machine intelligence and/or unbounded
economic growth in finite time (Good (1965), Vinge (1993), Kurzweil (2005)). Nordhaus
(2015) provides a detailed overview and discussion of the prospects for a singularity
from the standpoint of economics.
In this paper, we speculate on how A.I. may affect the growth process. Our primary
goal is to help shape an agenda for future research. To do so, we focus on the following
questions:
• If A.I. increases automation in the production of goods and services, how will it
impact economic growth?
• Can we reconcile the advent of A.I. with the observed constancy in growth rates
and capital share over most of the 20th century? Should we expect such constancy
to persist in the 21st century?
• Do these answers change when A.I. and automation apply to the production of
new ideas?
• Can A.I. drive massive increases in growth rates, or even a singularity, as some
observers predict? Under what conditions, and are these conditions plausible?
• How are the links between A.I. and economic growth modulated by firm-level
1The former definition comes from the Miriam-Webster dictionary, while the latter is from Legg andHutter (2007).
ARTIFICIAL INTELLIGENCE AND ECONOMIC GROWTH 3
considerations, including market structure and innovation incentives? How does
A.I. affect the internal organization of firms, and with what implications?
In thinking about these questions, we develop two main themes. First, we model
A.I. as the latest form in a process of automation that has been ongoing for at least 200
years. From the spinning jenny to the steam engine to electricity to computer chips, the
automation of aspects of production has been a key feature of economic growth since
the Industrial Revolution. This perspective is taken explicitly in two key papers that we
build upon, Zeira (1998) and Acemoglu and Restrepo (2016). We view A.I. as a new form
of automation that may allow tasks that were previously thought to be out of reach from
automation to succumb. These tasks may be non-routine (to use the language of Autor,
Levy and Murnane (2003)), like self-driving cars, or they may involve high levels of skill,
such as legal services, radiology, and some forms of scientific lab-based research. An
advantage of this approach is that it allows us to use historical experience on economic
growth and automation to discipline our modeling of A.I.
A second theme that emerges in our paper is that the growth consequences of au-
tomation and A.I. may be constrained by Baumol’s “cost disease.” Baumol (1967) ob-
served that sectors with rapid productivity growth, such as agriculture and even manu-
facturing today, often see their share of GDP decline while those sectors with relatively
slow productivity growth — perhaps including many services — experience increases.
As a consequence, economic growth may be constrained not by what we do well but
rather by what is essential and yet hard to improve. We suggest that combining this
feature of growth with automation can yield a rich description of the growth process,
including consequences for future growth and income distribution. When applied to a
model in which A.I. automates the production of goods and services, Baumol’s insight
generates sufficient conditions under which one can get overall balanced growth with a
constant capital share that stays well below 100%, even with nearly complete automa-
tion. When applied to a model in which A.I. automates the production of ideas, these
same considerations can prevent explosive growth.2
The paper proceeds as follows. Section 2 begins by studying the role of A.I. in au-
tomating the production of goods and services. In Section 3, we extend A.I. and au-
2In the Appendix we show that if some steps in the innovation process require human R&D, A.I. couldpossibly slow or even end growth by exacerbating business-stealing, which in turn discourages humaninvestments in innovation.
4 P. AGHION, B. JONES, AND C. JONES
tomation to the production of new ideas. Section 4 then discusses the possibility that
A.I. could lead to superintelligence or even a singularity. In Section 5, we look at A.I.
and firms, with particular attention to market structure, organization, reallocation, and
wage inequality. In Section 6, we examine sectoral evidence on the evolution of capital
shares in tandem with automation. Finally, Section 7 concludes.
2. A.I. and Automation of Production
One way of looking at the last 150 years of economic progress is that it is driven by
automation. The industrial revolution used steam and then electricity to automate
many production processes. Relays, transistors, and semiconductors continued this
trend. Perhaps artificial intelligence is the next phase of this process rather than a
discrete break. It may be a natural progression from autopilots, computer-controlled
automobile engines, and MRI machines to self-driving cars and A.I. radiology reports.
While up until recently, automation has mainly affected routine or low-skilled tasks,
it appears that A.I. may increasingly automate non-routine, cognitive tasks performed
by high-skilled workers.3 An advantage of this perspective is that it allows us to use
historical experience to inform us about the possible future effects of A.I.
2.1 The Zeira (1998) Model of Automation and Growth
A clear and elegant model of automation is provided by Zeira (1998). In its simplest
form, Zeira considers a production function like
Y = AXα11 Xα2
2 · ... ·Xαnn where
n∑i=1
αi = 1. (1)
While Zeira thought of the Xi’s as intermediate goods, we follow Acemoglu and Autor
(2011) and refer to these as tasks; both interpretations have merit, and we will go back
and forth between these interpretations. Tasks that have not yet been automated can
be produced one-for-one by labor. Once a task is automated, one unit of capital can be
3Autor, Levy and Murnane (2003) discuss the effects of traditional software automating routine tasks.Webb, Thornton, Legassick and Suleyman (2017) use the text of patent filings to study the different tasksthat A.I., software, and robotics are best-positioned to automate.
ARTIFICIAL INTELLIGENCE AND ECONOMIC GROWTH 5
used instead:
Xi =
Li if not automated
Ki if automated(2)
If the aggregate capitalK and laborL are assigned to these tasks optimally, the produc-
tion function can be expressed (up to an unimportant constant) as
Yt = AtKαt L
1−αt (3)
where it is now understood that the exponent α reflects the overall share and impor-
tance of tasks that have been automated. For the moment, we treat α as a constant and
consider comparative statics that increase the share of tasks that get automated.
Next, embed this setup into a standard neoclassical growth model with a constant
investment rate; in fact, for the remainder of the paper this is how we will close the
capital/investment side of all our models. The share of factor payments going to capital
is given by α and the long-run growth rate of y ≡ Y/L is
gy =g
1− α, (4)
where g is the growth rate of A. An increase in automation will therefore increase the
capital share α and, because of the multiplier effect associated with capital accumula-
tion, increase the long-run growth rate.
Zeira emphasizes that automation has been going on at least since the industrial
revolution, and his elegant model helps us to understand that. However, its strong
predictions that growth rates and capital shares should be rising with automation go
against the famous Kaldor (1961) stylized facts that growth rates and capital shares are
relatively stable over time. In particular, this stability is a good characterization of the
U.S. economy for the bulk of the 20th century; for example, see Jones (2016). The Zeira
framework, then, needs to be improved so that it is consistent with historical evidence.
Acemoglu and Restrepo (2016) provide one approach to solving this problem. Their
rich environment allows CES production and endogenizes the number of tasks as well
as automation. In particular, they suppose that research can take two different direc-
tions: discovering how to automate an existing task or discovering new tasks that can
be used in production. In their setting, α reflects the fraction of tasks that have been
6 P. AGHION, B. JONES, AND C. JONES
automated. This leads them to emphasize one possible resolution to the empirical
shortcoming of Zeira: perhaps we are inventing new tasks just as quickly as we are
automating old tasks. The fraction of tasks that are automated could be constant,
leading to a stable capital share and a stable growth rate.
Several other important contributions to this rapidly expanding literature should
also be noted. Peretto and Seater (2013) explicitly consider a research technology that
allows firms to change the exponent in a Cobb-Douglas production function; while
they do not emphasize the link to the Zeira model, with hindsight the connections to
that approach to automation are interesting. The model of Hemous and Olsen (2016)
is closely related to what follows in the next subsection. They focus on CES produc-
tion instead of Cobb-Douglas, as we do below, but emphasize the implications of their
framework for wage inequality between high-skilled and low-skilled workers. Agrawal,
McHale and Oettl (2017) incorporate artificial intelligence and the “recombinant growth”
of Weitzman (1998) into an innovation-based growth model to show how A.I. can speed
up growth along a transition path.
The next section takes a complementary approach, building on this literature and
using the insights of Zeira and automation to understand the structural change associ-
ated with Baumol’s cost disease.
2.2 Automation and Baumol’s Cost Disease
The share of agriculture in GDP or employment is falling toward zero. The same is true
for manufacturing in many countries of the world. Maybe automation increases the
capital share in these sectors and also interacts with nonhomotheticities in production
or consumption to drive the GDP shares toward zero. The aggregate capital share is
then a balance of a rising capital share in agriculture/manufacturing/automated goods
with a declining GDP share of these goods in the economy.
Looking toward the future, 3D-printing techniques and nanotechnology that allow
production to start at the molecular or even atomic level could someday automate all
manufacturing. Could A.I. do the same thing in many service sectors? What would
economic growth look like in such a world?
This section expands on the Zeira (1998) and Acemoglu and Restrepo (2016) models
to develop a framework that is consistent with the large structural changes in the econ-
ARTIFICIAL INTELLIGENCE AND ECONOMIC GROWTH 7
omy. Baumol (1967) observed that rapid productivity growth in some sectors relative
to others could result in a “cost disease” in which the slow growing sectors become
increasingly important in the economy. We explore the possibility that automation is
the force behind these changes.4
2.2.1 Model
GDP is a CES combination of goods with an elasticity of substitution less than one:
Yt = At
(∫ 1
0Xρitdi
)1/ρ
where ρ < 0 (5)
where At = A0egt captures standard technological change, which we take to be exoge-
nous for now. Having the elasticity of substitution less than one means that tasks are
gross complements. Intuitively, this is a “weak link” production function, where GDP is
in some sense limited by the output of the weakest links. Here, these will be the tasks
performed by labor, and this structure is the source of the Baumol effect.
As in Zeira, another part of technical change is the automation of production. Goods
that have not yet been automated can be produced one-for-one by labor. When a good
has been automated, one unit of capital can be used instead:
Xit =
Lit if not automated
Kit if automated(6)
This division is stark to keep the model simple. An alternative would be to say that
goods are produced with a Cobb-Douglas combination capital and labor, and when a
good is automated, it is produced with a higher exponent on capital.5
The remainder of the model is neoclassical:
Yt = Ct + It (7)
4The growth literature on this structural transformation emphasizes a range of possible mechanisms;see Kongsamut, Rebelo and Xie (2001), Ngai and Pissarides (2007), Herrendorf, Rogerson and Valentinyi(2014), Boppart (2014), and Comin, Lashkari and Mestieri (2015). The approach we take next has a reducedform that is similar to one of the special cases in Alvarez-Cuadrado, Long and Poschke (2017).
5A technical condition is required, of course, so that tasks that have been automated are actuallyproduced with capital instead of labor. We assume this condition holds.
8 P. AGHION, B. JONES, AND C. JONES
Kt = It − δKt (8)∫ 1
0Kitdi = Kt (9)
∫ 1
0Litdi = L (10)
We assume a fixed endowment of labor for simplicity.
Let βt be the fraction of goods that that have been automated as of date t. Here and
throughout the paper, we assume that capital and labor are allocated symmetrically
across tasks. Therefore, Kt/βt units of capital are used in each automated task and
L/(1−βt) units of labor are used on each non-automated task. The production function
can then be written as
Yt = At
[βt
(Kt
βt
)ρ+ (1− βt)
(L
1− βt
)ρ]1/ρ. (11)
Collecting the automation terms simplifies this to
Yt = At
(β1−ρt Kρ
t + (1− βt)1−ρLρ)1/ρ
. (12)
This setup therefore reduces to a particular version of the neoclassical growth model,
and the allocation of resources can be decentralized in a standard competitive equilib-
rium. In this equilibrium, the share of automated goods in GDP equals the share of
capital in factor payments:
αKt ≡∂Yt∂Kt
Kt
Yt= β1−ρt Aρt
(Kt
Yt
)ρ. (13)
Similarly, the share of non-automated goods in GDP equals the labor share of factor
payments:
αLt ≡∂Yt∂Lt
LtYt
= β1−ρt Aρt
(LtYt
)ρ. (14)
Therefore the ratio of automated to nonautomated output — or the ratio of the capital
share to the labor share — equals
αKtαLt
=
(βt
1− βt
)1−ρ(Kt
Lt
)ρ. (15)
ARTIFICIAL INTELLIGENCE AND ECONOMIC GROWTH 9
We specified from the beginning that we are interested in the case in which the elas-
ticity of substitution between goods is less than one, so that ρ < 0. From equation (15),
there are two basic forces that move the capital share (or, equivalently, the share of
the economy that is automated). First, an increase in the fraction of goods that are
automated, βt, will increase the share of automated goods in GDP and increase the
capital share (holdingK/L constant). This is intuitive and repeats the logic of the Zeira
model. Second, as K/L rises, the capital share and the value of the automated sector
as a share of GDP will decline. Essentially, with an elasticity of substitution less than
one, the price effects dominate. The price of automated goods declines relative to the
price of non-automated goods because of capital accumulation. Because demand is
relatively inelastic, the expenditure share of these goods declines as well. Automation
and Baumol’s cost disease are then intimately linked. Perhaps the automation of agri-
culture and manufacturing leads these sectors to grow rapidly and causes their shares
in GDP to decline.6
The bottom line is that there is a race between these two forces. As more sectors
are automated, βt increases, and this tends to increase the share of automated goods
and capital. But because these automated goods experience faster growth, their price
declines, and the low elasticity of substitution means that their shares of GDP also
decline.
Following Acemoglu and Restrepo (2016), we could endogenize automation by spec-
ifying a technology in which research effort leads goods to be automated. But it is
relatively clear that depending on exactly how one specifies this technology, βt1−βt can
rise faster or slower than (Kt/Lt)ρ declines. That is, the result would depend on detailed
assumptions related to automation, and we do not have strong priors on how to make
these assumptions. This is an important direction for future research. For now, how-
ever, we treat automation as exogenous and consider what happens when βt changes
in different ways.
6Manuelli and Seshadri (2014) offer a systematic account of the how the tractor gradually replaced thehorse and in American agriculture between 1910 and 1960.
10 P. AGHION, B. JONES, AND C. JONES
2.2.2 Balanced Growth (Asymptotically)
To understand some of these possibilities, notice that the production function in equa-
tion (12) is just a special case of a neoclassical production function:
Yt = AtF (BtKt, CtLt) where Bt ≡ β1−ρρ
t and Ct ≡ (1− βt)1−ρρ . (16)
With ρ < 0, notice that ↑βt ⇒ ↓Bt and ↑Ct. That is, automation is equivalent to
a combination of labor-augmenting technical change and capital-depleting technical
change. This is surprising. One might have thought of automation as somehow capital
augmenting. Instead, it is very different: it is labor augmenting and simultaneously
dilutes the stock of capital. Notice that these conclusions would be reversed if the
elasticity of substitution were greater than one; they importantly rely on ρ < 0.
The intuition for this surprising result can be seen by noting that automation has
two basic effects; these can be seen most easily by looking back at equation (11). First,
capital can be applied to a larger number of tasks, which is a basic capital-augmenting
force. However, this also means that a fixed amount of capital is spread more thinly, a
capital-depleting effect. When the tasks are substitutes (ρ > 0), the augmenting effect
dominates and automation is capital augmenting. However, when tasks are comple-
ments (ρ < 0), the depletion effect dominates and automation is capital depleting.
Notice that for labor, the opposite forces are at work: automation concentrates a given
quantity of labor onto a smaller number of tasks and hence is labor augmenting when
ρ < 0.7
This opens up one possibility that we will explore next: what happens if the evolu-
tion of βt is such that Ct grows at a constant exponential rate? This can occur if 1 − βtfalls at a constant exponential rate toward zero, meaning that βt → 1 in the limit and
the economy gets ever closer to full automation (but never quite reaches that point).
The logic of the neoclassical growth model suggests that this could produce a balanced
growth path with constant factor shares, at least in the limit. (This requires At to be
7In order for automation to increase output, we require a technical condition:(K
β
)ρ<
(L
1− β
)ρ.
For ρ < 0, this requires K/β > L/1 − β. That is, the amount of capital that we allocate to each task mustexceed the amount of labor we allocate to each task. Automation raises output by allowing us to use ourplentiful capital on more of the tasks performed by relatively scarce labor.
ARTIFICIAL INTELLIGENCE AND ECONOMIC GROWTH 11
constant.)
In particular, we want to consider an exogenous time path for the fraction of tasks
that are automated, βt, such that βt → 1 but in a way that Ct grows at a constant
exponential rate. This turns out to be straightfoward. Let γt ≡ 1− βt, so that Ct = γ1−ρρ
t .
Because the exponent is negative (ρ < 0), if γ falls at a constant exponential rate,Ct will
grow at a constant exponential rate. This occurs if βt = θ(1−βt), implying that gγ = −θ.
Intuitively, a constant fraction, θ, of the tasks that have not yet been automated become
automated each period.
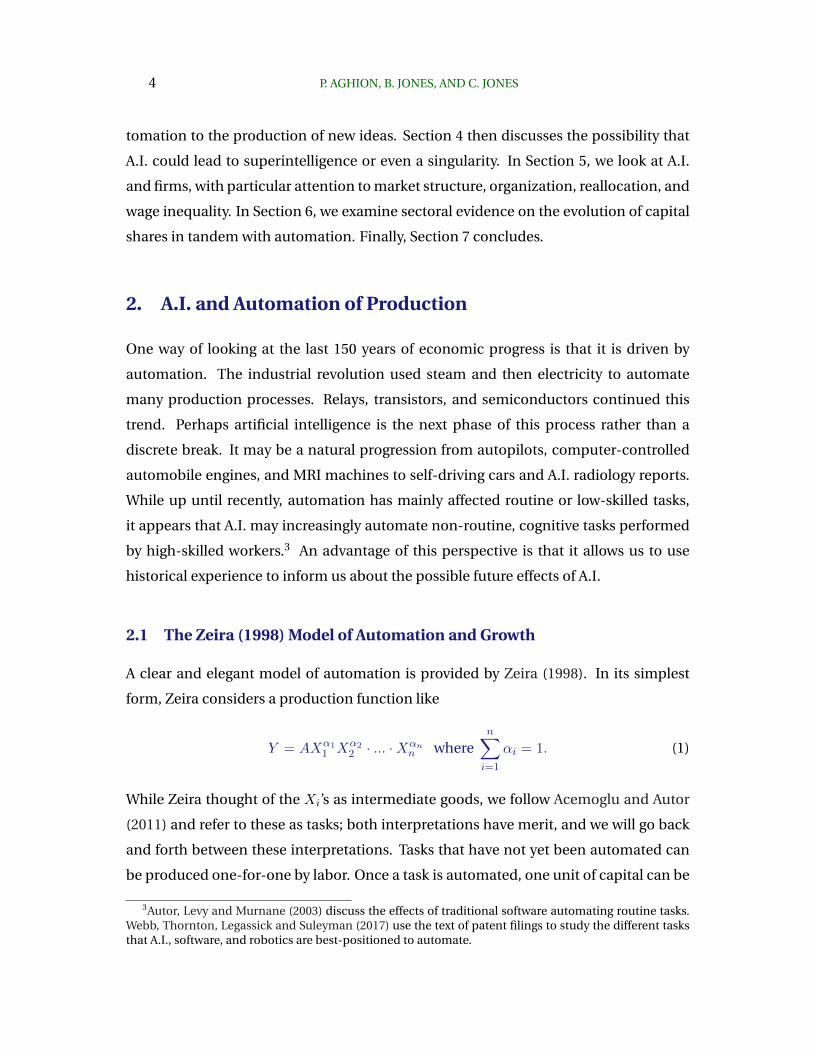
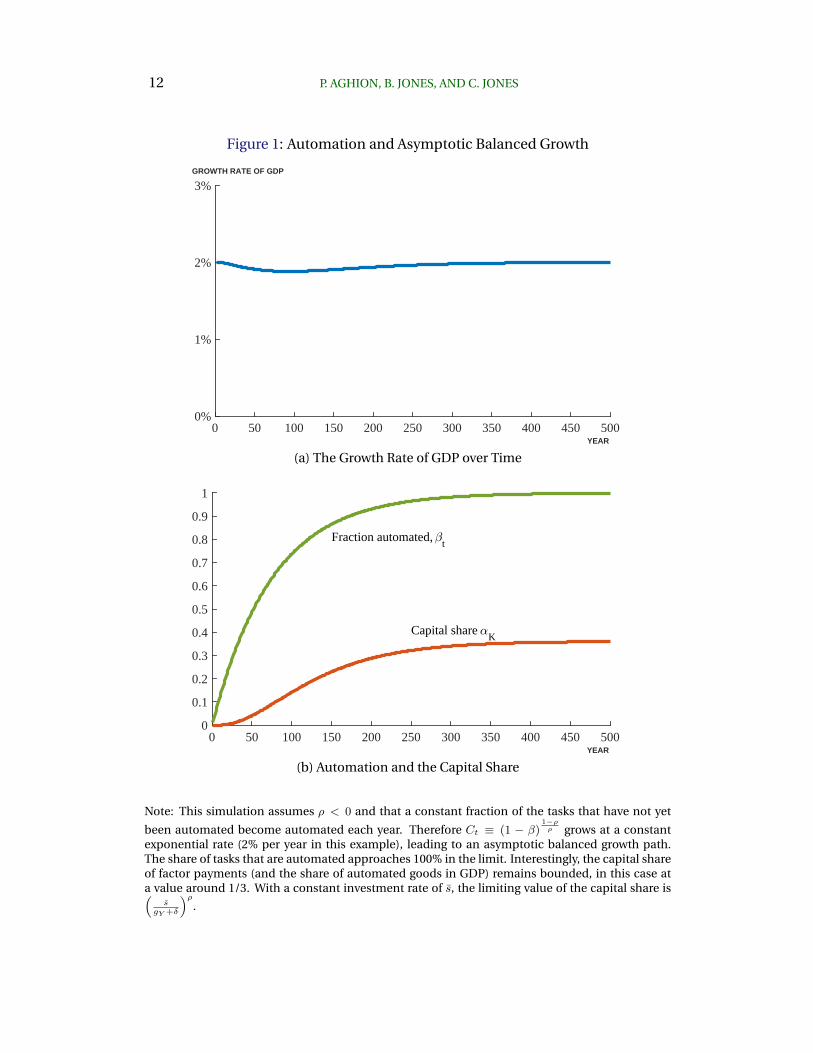
Figure 1 shows that this example can produce steady exponential growth. We begin
in year 0 with none of the goods being automated, and then have a constant fraction
of the remainder being automated each year. There is obviously enormous structural
change underlying — and generating — the stable exponential growth of GDP in this
case. The capital share of factor payments begins at zero and then rises gradually over
time, eventually asymptoting to a value around 1/3. Even though an ever-vanishing
fraction of the economy has not yet been automated, so labor has less and less to do, the
fact that automated goods are produced with cheap capital combined with an elasticity
of substitution less than one means that the automated share of GDP remains at 1/3
and labor still earns around 2/3 of GDP asymptotically. This is a consequence of the
Baumol force: the labor tasks are the “weak links” that are essential and yet expensive,
and this keeps the labor share elevated.8
Along such a path, however, sectors like agriculture and manufacturing exhibit a
structural transformation. For example, let sectors on the interval [0, 1/3] denote agri-
culture and the automated portion of manufacturing as of some year, such as 1990.
These sectors experience a declining share of GDP over time, as their prices fall rapidly.
The automated share of the economy will be constant only because new goods are
becoming automated.
The analysis so far requires At to be constant, so that the only form of technical
change is automation. This seems too extreme: surely technical progress is not only
about substituting machines for labor, but also about creating better machines. This
can be incorporated in the following way. SupposeAt is capital-augmenting rather than
8The neoclassical outcome here requires that θ not be too large (e.g. relative to the exogenousinvestment rate). If θ is sufficiently high, the capital share can asymptote to one and the model becomes“AK.” We are grateful to Pascual Restrepo for working this out.
12 P. AGHION, B. JONES, AND C. JONES
Figure 1: Automation and Asymptotic Balanced Growth
0 50 100 150 200 250 300 350 400 450 500
0%
1%
2%
3%
YEAR
GROWTH RATE OF GDP
(a) The Growth Rate of GDP over Time
0 50 100 150 200 250 300 350 400 450 5000
0.1
0.2
0.3
0.4
0.5
0.6
0.7
0.8
0.9
1
Fraction automated, t
Capital share K
YEAR
(b) Automation and the Capital Share
Note: This simulation assumes ρ < 0 and that a constant fraction of the tasks that have not yet
been automated become automated each year. Therefore Ct ≡ (1 − β)1−ρρ grows at a constant
exponential rate (2% per year in this example), leading to an asymptotic balanced growth path.The share of tasks that are automated approaches 100% in the limit. Interestingly, the capital shareof factor payments (and the share of automated goods in GDP) remains bounded, in this case ata value around 1/3. With a constant investment rate of s, the limiting value of the capital share is(
sgY +δ
)ρ.
ARTIFICIAL INTELLIGENCE AND ECONOMIC GROWTH 13
Hick’s-neutral, so that the production function in (16) becomes Yt = F (AtBtKt, CtLt).
In this case, one could get a BGP if At rises at precisely the rate that Bt declines, so that
technological change is essentially purely labor-augmenting on net: better computers
would decrease the capital share at precisely the rate that automation raises it, leading
to balanced growth. At first, this seems like a knife-edge result that would be unlikely in
practice. However, the logic of this example is somewhat related to the model in Gross-
man, Helpman, Oberfield and Sampson (2017); that paper presents an environment in
which it is optimal to have something similar to this occur. So perhaps this alternative
approach could be given good microfoundations. We leave this possibility to future
research.
2.2.3 Constant Factor Shares
Another interesting case worth considering is under what conditions can this model
produce factor shares that are constant over time? Taking logs and derivatives of (15),
the capital share will be constant if and only if
gβt = (1− βt)(−ρ
1− ρ
)gkt, (17)
where gkt is the growth rate of k ≡ K/L. This is very much a knife-edge condition. It
requires the growth rate of βt to slow over time at just the right rate as more and more
goods get automated.
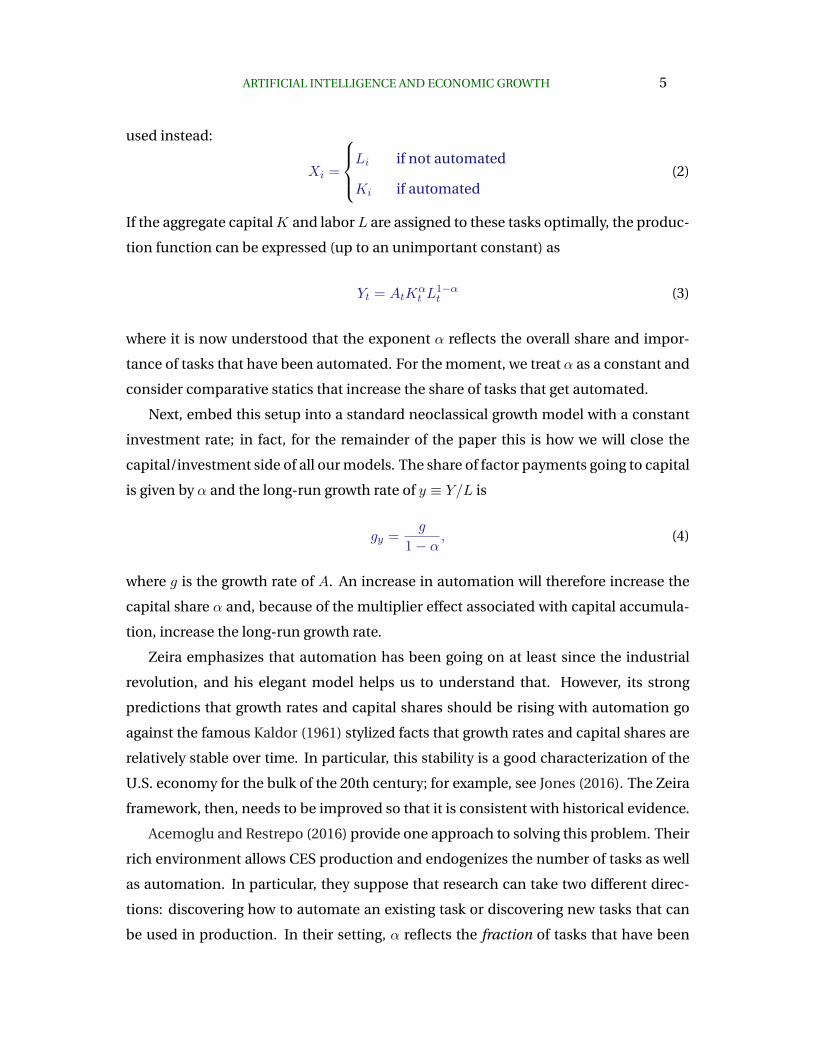
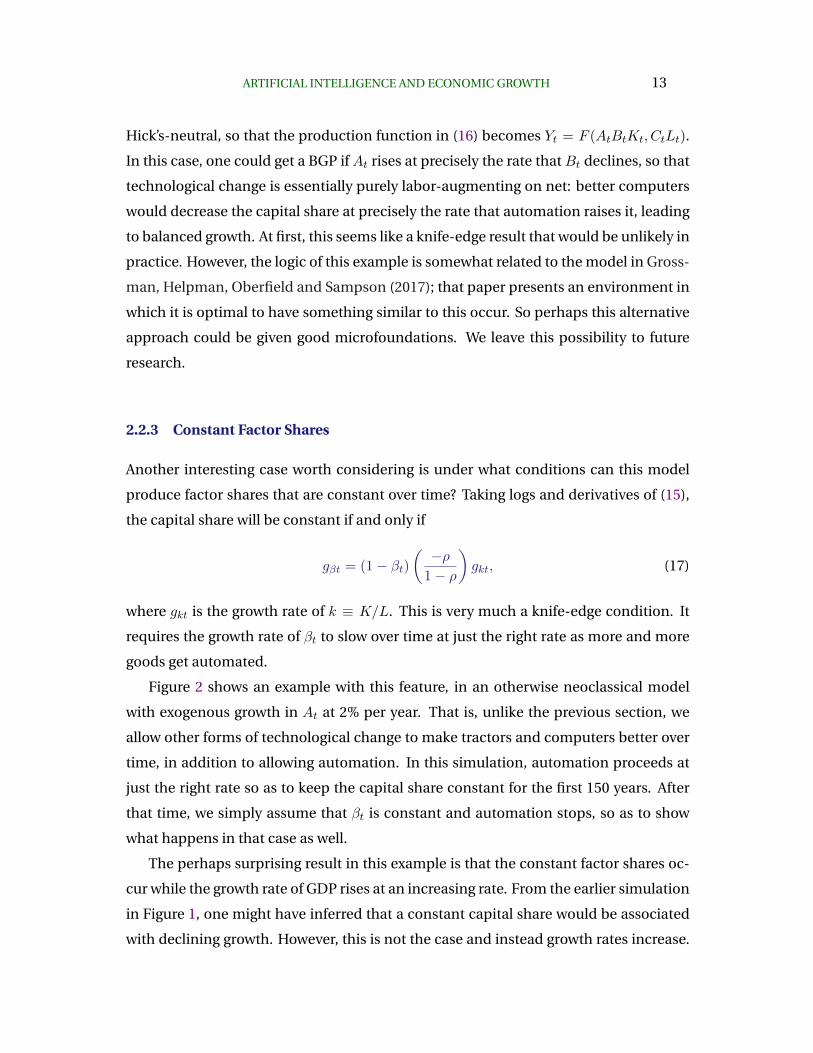
Figure 2 shows an example with this feature, in an otherwise neoclassical model
with exogenous growth in At at 2% per year. That is, unlike the previous section, we
allow other forms of technological change to make tractors and computers better over
time, in addition to allowing automation. In this simulation, automation proceeds at
just the right rate so as to keep the capital share constant for the first 150 years. After
that time, we simply assume that βt is constant and automation stops, so as to show
what happens in that case as well.
The perhaps surprising result in this example is that the constant factor shares oc-
cur while the growth rate of GDP rises at an increasing rate. From the earlier simulation
in Figure 1, one might have inferred that a constant capital share would be associated
with declining growth. However, this is not the case and instead growth rates increase.
14 P. AGHION, B. JONES, AND C. JONES
Figure 2: Automation with a Constant Capital Share
0 50 100 150 200 250 300
2%
3%
4%
5%
YEAR
GROWTH RATE OF GDP
(a) The Growth Rate of GDP over Time
0 50 100 150 200 250 3000
0.1
0.2
0.3
0.4
0.5
0.6
0.7Fraction automated,
t
Capital share K
YEAR
(b) Automation and the Capital Share
Note: This simulation assumes ρ < 0 and sets βt so that the capital share is constant between year0 and year 150. After year 150, we assume βt stays at its constant value. At is assumed to grow at aconstant rate of 2% per year throughout.
ARTIFICIAL INTELLIGENCE AND ECONOMIC GROWTH 15
The key to the explanation is to note that with some algebra, we can show that the
constant factor share case requires
gY t = gA + βtgKt. (18)
First, consider the case with gA = 0. We know that a true balanced growth path requires
gY = gK . This can occur in only two ways if gA = 0: either βt = 1 or gY = gK = 0 if
βt < 1. The first case is the one that we explored in the previous example back in
Figure 1. The second case shows that if gA = 0, then constant factor shares will be
associated with zero exponential growth.
Now we can see the reconciliation between Figures 1 and 2. In the absence of
gA > 0, the growth rate of the economy would fall to zero. Introducing gA > 0 with
constant factor shares does increases the growth rate. To see why growth has to accel-
erate, equation (18) is again useful. If growth were balanced, then gY = gK . But then
the rise in βt would tend to raise gY and gK . This is why growth accelerates.
2.2.4 Regime Switching
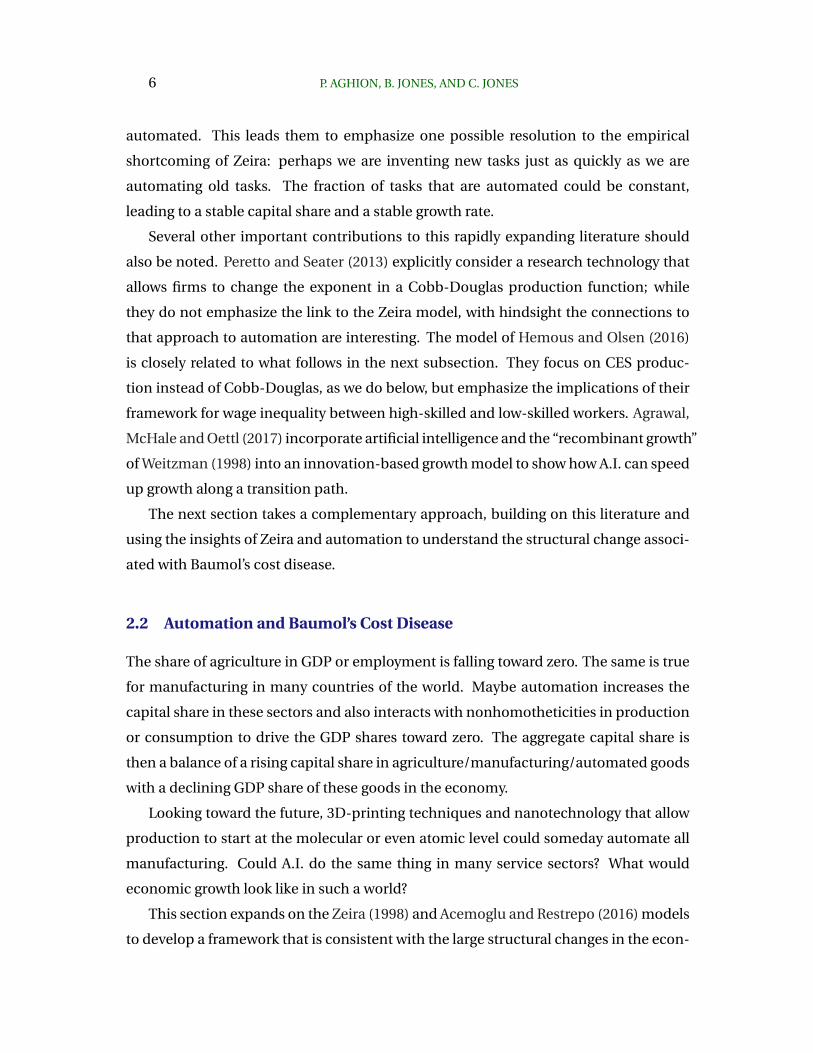
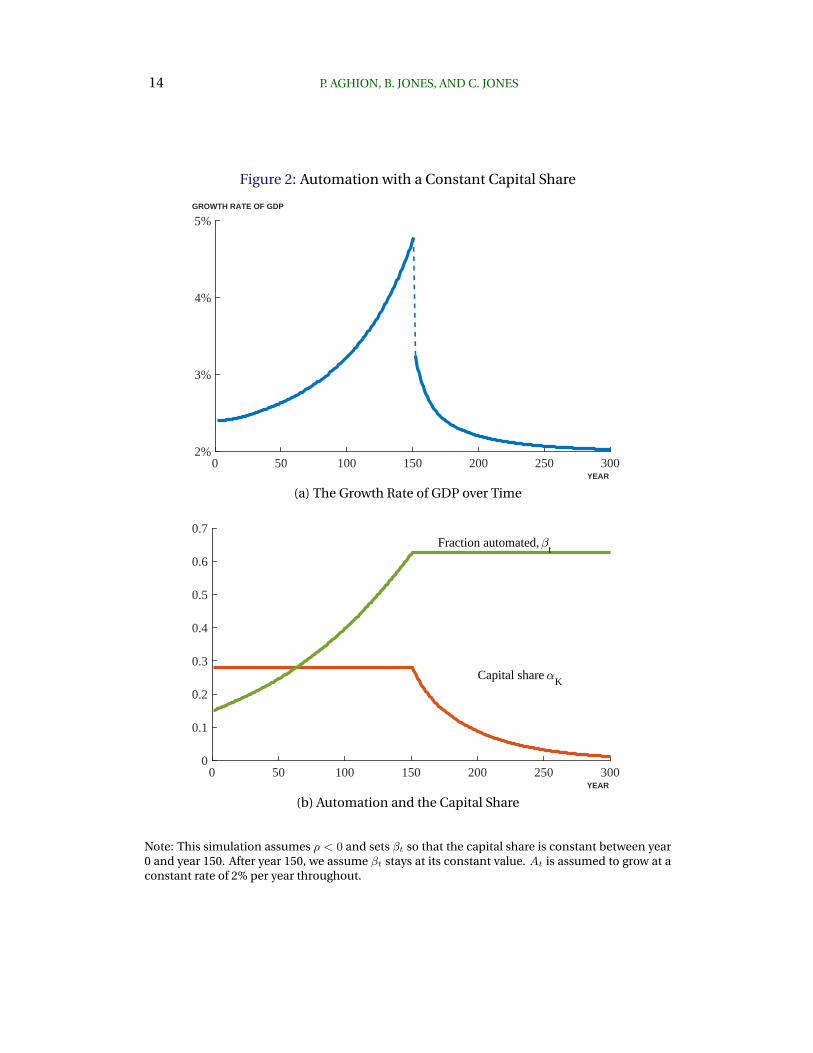
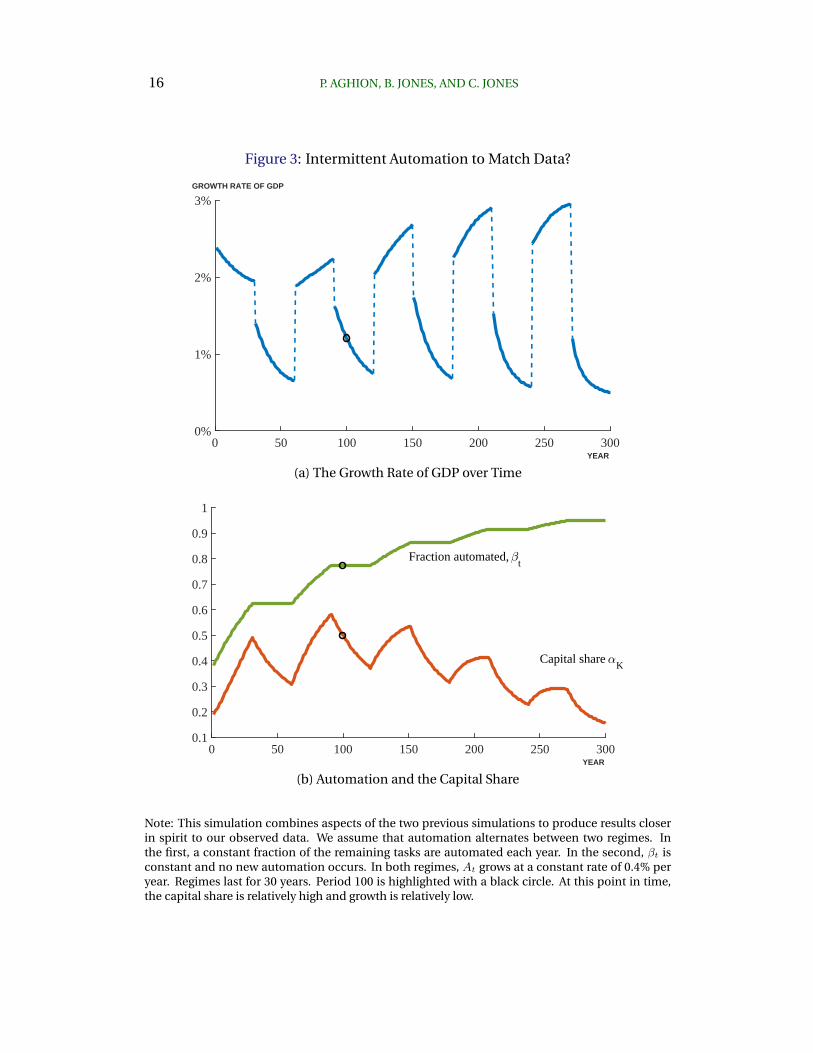
A final simulation shown in Figure 3 combines aspects of the two previous simulations
to produce results closer in spirit to our observed data, albeit in a highly stylized way.
We assume that automation alternates between two regimes. The first is like Figure 1,
in which a constant fraction of the remaining tasks are automated each year, tending
to raise the capital share and produce high growth. In the second, βt is constant and
no new automation occurs. In both regimes, At grows at a constant rate of 0.4% per
year, so that even when the fraction of tasks being automated is stagnant, the nature
of automation is improving, which tends to depress the capital share. Regimes last for
30 years. Period 100 is highlighted with a black circle. At this point in time, the capital
share is relatively high and growth is relatively low.
By playing with parameter values, including the growth rate of At and βt, it is possi-
ble to get a wide range of outcomes. For example, the fact that the capital share in the
future is lower than in period 100 instead of higher can be reversed.
16 P. AGHION, B. JONES, AND C. JONES
Figure 3: Intermittent Automation to Match Data?
0 50 100 150 200 250 300
0%
1%
2%
3%
YEAR
GROWTH RATE OF GDP
(a) The Growth Rate of GDP over Time
0 50 100 150 200 250 3000.1
0.2
0.3
0.4
0.5
0.6
0.7
0.8
0.9
1
Fraction automated, t
Capital share K
YEAR
(b) Automation and the Capital Share
Note: This simulation combines aspects of the two previous simulations to produce results closerin spirit to our observed data. We assume that automation alternates between two regimes. Inthe first, a constant fraction of the remaining tasks are automated each year. In the second, βt isconstant and no new automation occurs. In both regimes, At grows at a constant rate of 0.4% peryear. Regimes last for 30 years. Period 100 is highlighted with a black circle. At this point in time,the capital share is relatively high and growth is relatively low.
ARTIFICIAL INTELLIGENCE AND ECONOMIC GROWTH 17
2.2.5 Summing Up
Automation — an increase in βt — can be viewed as a“twist” of the capital- and labor-
augmenting terms in a neoclassical production function. From Uzawa’s famous theo-
rem, since we do not in general have purely labor-augmenting technical change, this
setting will not lead to balanced growth. In this particular application (e.g. with ρ <
0), either the capital share or the growth rate of GDP will tend to increase over time,
and sometimes both. We showed one special case in which all tasks are ultimately
automated that produced balanced growth in the limit with a constant capital share
less than 100%. A shortcoming of this case is that it requires automation to be the only
form of technological change. If, instead, the nature of automation itself improves
over time — consider the plow, then the tractor, then the combine-harvester, then
GPS tracking — then the model is best thought of as featuring both automation and
something like improvements inAt. In this case, one would generally expect growth not
to be balanced. However, a combination of periods of automation followed by periods
of respite, like that shown in Figure 3 does seem capable of producing dynamics at
least superficially similar to what we’ve seen in the U.S. in recent years: a period of a
high capital share with relatively slow economic growth.
3. A.I. in the Idea Production Function
In the previous section, we examined the implications of introducing A.I. in the pro-
duction function for goods and services. But what if the tasks of the innovation process
themselves can be automated? How would A.I. interact with the production of new
ideas? In this section, we introduce A.I. in the production technology for new ideas and
look at how A.I. can affect growth through this channel.
A moment of introspection into our own research process reveals many ways in
which automation can matter for the production of ideas. Research tasks that have
benefited from automation and technological change include typing and distributing
our papers, obtaining research materials and data (e.g., from libraries), ordering sup-
plies, analyzing data, solving math problems, and computing equilibrium outcomes.
Beyond economics, other examples include carrying out experiments, sequencing genomes,
exploring various chemical reactions and materials. In other words, applying the same
18 P. AGHION, B. JONES, AND C. JONES
task-based model to the idea production function and considering the automation of
research tasks seems relevant.
To keep things simple, suppose the production function for goods and services just
uses labor and ideas:
Yt = AtLt. (19)
But suppose that various tasks are used to make new ideas according to
At = Aφt
(∫ 1
0Xρitdi
)1/ρ
where ρ < 0 (20)
Assuming some fraction βt of tasks have been automated — using a similar setup to
that in Section 2 — the idea production function can be expressed as
At = Aφt ((BtKt)ρ + (CtSt)
ρ)1/ρ ≡ Aφt F (BtKt, CtSt) (21)
where St is the research labor used to make ideas, and Bt and Ct are defined as before,
namely Bt ≡ β1−ρρ
t and Ct ≡ (1− βt)1−ρρ .
Several observations then follow from this setup. First, consider the case in which
βt is constant at some value but then increases to a higher value (recall that this leads to
a one-time decrease in Bt and increase in Ct). The idea production function can then
be written as
At = Aφt StF(BKtSt, C)
∼ Aφt CSt(22)
where the “∼” notation means “is asymptotically proportional to.” The second line fol-
lows if Kt/St is growing over time (i.e. if there is economic growth) and if the elasticity
of substitution in F (·) is less than one, which we’ve assumed. In that case, the CES
function is bounded by its scarcest argument, in this case researchers. Automation then
essentially produces a level effect but leaves the long-run growth rate of the economy
unchanged if φ < 1. Alternatively, if φ = 1 — the classic endogenous growth case —
then automation raises long-run growth.
Next, consider this same case of a one-time increase in β, but suppose the elasticity
of substitution in F (·) equals one, so that F (·) is Cobb-Douglas. In this case, as in
the Zeira model, it is easy to show that a one-time increase in automation will raise
ARTIFICIAL INTELLIGENCE AND ECONOMIC GROWTH 19
the long-run growth rate. Essentially, an accumulable factor in production (capital)
becomes permanently more important, and this leads to a multiplier effect that raises
growth.
Third, suppose now that the elasticity of substitution is greater than one. In this
case, the argument given before reverses, and now the CES function asymptotically
looks like the plentiful factor, in this case Kt. The model will then deliver explosive
growth under fairly general conditions, with incomes becoming infinite in finite time.9
But this is true even without any automation. Essentially, in this case researchers are
not a necessary input and so standard capital accumulation is enough to generate
explosive growth. This is one reason why the case of ρ < 0 — i.e. an elasticity of
substitution less than one — is the natural case to consider. We focus on this case for
the remainder of this section.
3.1 Continuous Automation
We can now consider the special case in which automation is such that the newly-
automated tasks constitute a constant fraction, θ, of the tasks that have not yet been
automated. Recall that this was the case that delivered a balanced growth path back in
Section 2.2.2. In this case, Bt → 1 and CtCt→ gC = −1−ρ
ρ · θ > 0 asymptotically.
The same logic that gave us equation (22) now implies that
At = Aφt CtStF(BtKtCtSt
, 1)
∼ Aφt CtSt(23)
where the second line holds as long as BK/CS → ∞, which holds for a large class of
parameter values.10
This reduces to the Jones (1995) kind of setup, except that now “effective” research
grows faster than the population because of A.I. Dividing both sides of the last expres-
sion by At givesAtAt
=CtSt
A1−φt .
(24)
In order for the left-hand side to be constant, we require that the numerator and de-
9A closely-related case is examined explicitly in the discussion surrounding equation (27) below.10Since Bt → 1, we just need that gk > gC . This will hold — see below — for example if φ > 0.
20 P. AGHION, B. JONES, AND C. JONES
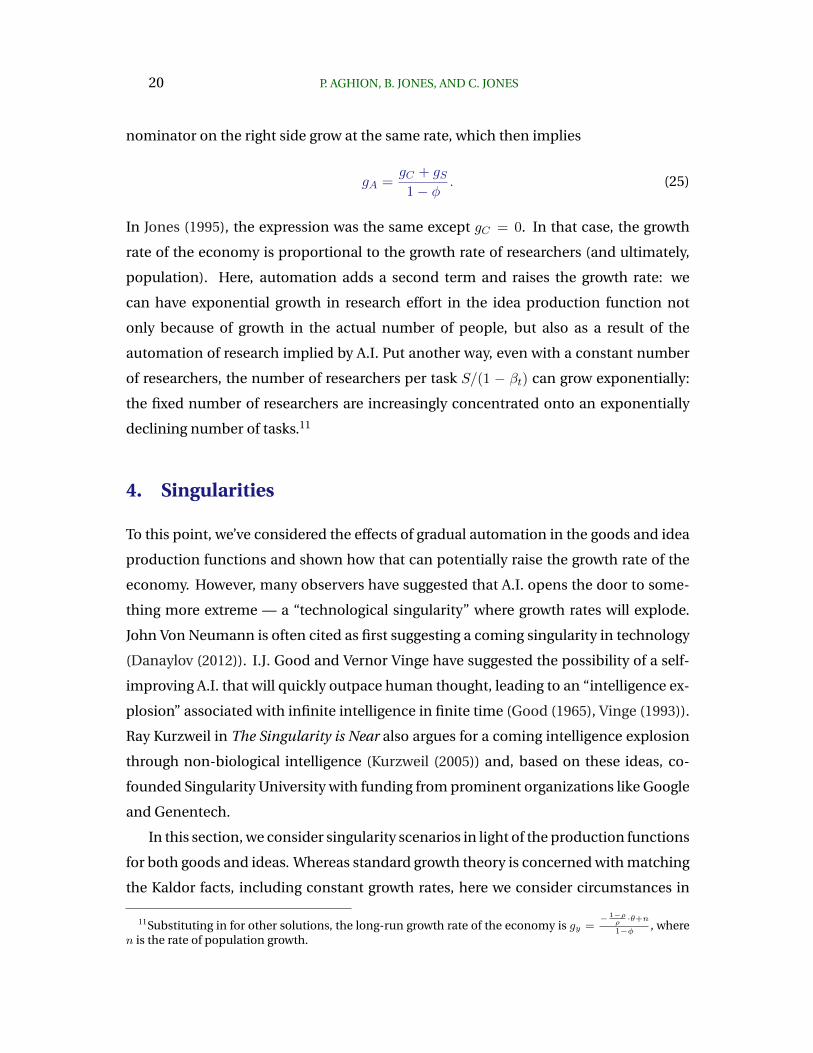
nominator on the right side grow at the same rate, which then implies
gA =gC + gS1− φ
. (25)
In Jones (1995), the expression was the same except gC = 0. In that case, the growth
rate of the economy is proportional to the growth rate of researchers (and ultimately,
population). Here, automation adds a second term and raises the growth rate: we
can have exponential growth in research effort in the idea production function not
only because of growth in the actual number of people, but also as a result of the
automation of research implied by A.I. Put another way, even with a constant number
of researchers, the number of researchers per task S/(1 − βt) can grow exponentially:
the fixed number of researchers are increasingly concentrated onto an exponentially
declining number of tasks.11
4. Singularities
To this point, we’ve considered the effects of gradual automation in the goods and idea
production functions and shown how that can potentially raise the growth rate of the
economy. However, many observers have suggested that A.I. opens the door to some-
thing more extreme — a “technological singularity” where growth rates will explode.
John Von Neumann is often cited as first suggesting a coming singularity in technology
(Danaylov (2012)). I.J. Good and Vernor Vinge have suggested the possibility of a self-
improving A.I. that will quickly outpace human thought, leading to an “intelligence ex-
plosion” associated with infinite intelligence in finite time (Good (1965), Vinge (1993)).
Ray Kurzweil in The Singularity is Near also argues for a coming intelligence explosion
through non-biological intelligence (Kurzweil (2005)) and, based on these ideas, co-
founded Singularity University with funding from prominent organizations like Google
and Genentech.
In this section, we consider singularity scenarios in light of the production functions
for both goods and ideas. Whereas standard growth theory is concerned with matching
the Kaldor facts, including constant growth rates, here we consider circumstances in
11Substituting in for other solutions, the long-run growth rate of the economy is gy =− 1−ρ
ρ·θ+n
1−φ , wheren is the rate of population growth.
ARTIFICIAL INTELLIGENCE AND ECONOMIC GROWTH 21
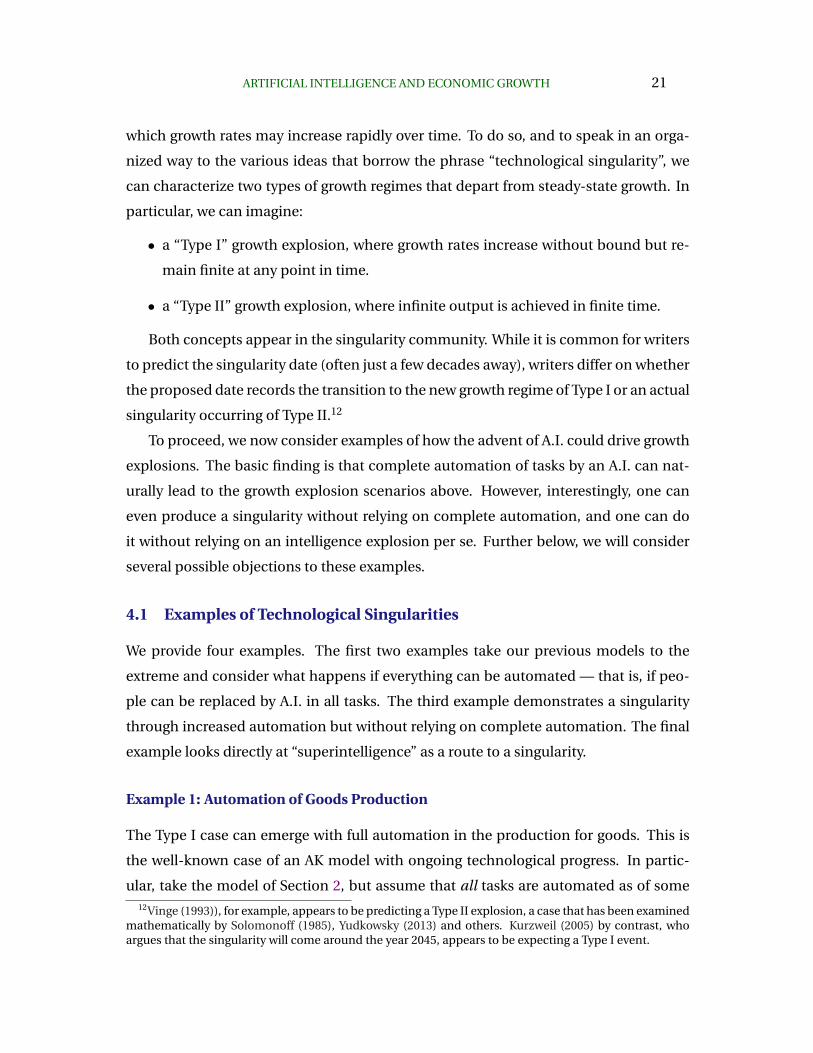
which growth rates may increase rapidly over time. To do so, and to speak in an orga-
nized way to the various ideas that borrow the phrase “technological singularity”, we
can characterize two types of growth regimes that depart from steady-state growth. In
particular, we can imagine:
• a “Type I” growth explosion, where growth rates increase without bound but re-
main finite at any point in time.
• a “Type II” growth explosion, where infinite output is achieved in finite time.
Both concepts appear in the singularity community. While it is common for writers
to predict the singularity date (often just a few decades away), writers differ on whether
the proposed date records the transition to the new growth regime of Type I or an actual
singularity occurring of Type II.12
To proceed, we now consider examples of how the advent of A.I. could drive growth
explosions. The basic finding is that complete automation of tasks by an A.I. can nat-
urally lead to the growth explosion scenarios above. However, interestingly, one can
even produce a singularity without relying on complete automation, and one can do
it without relying on an intelligence explosion per se. Further below, we will consider
several possible objections to these examples.
4.1 Examples of Technological Singularities
We provide four examples. The first two examples take our previous models to the
extreme and consider what happens if everything can be automated — that is, if peo-
ple can be replaced by A.I. in all tasks. The third example demonstrates a singularity
through increased automation but without relying on complete automation. The final
example looks directly at “superintelligence” as a route to a singularity.
Example 1: Automation of Goods Production
The Type I case can emerge with full automation in the production for goods. This is
the well-known case of an AK model with ongoing technological progress. In partic-
ular, take the model of Section 2, but assume that all tasks are automated as of some12Vinge (1993)), for example, appears to be predicting a Type II explosion, a case that has been examined
mathematically by Solomonoff (1985), Yudkowsky (2013) and others. Kurzweil (2005) by contrast, whoargues that the singularity will come around the year 2045, appears to be expecting a Type I event.
22 P. AGHION, B. JONES, AND C. JONES
date t0. The production function is thereafter Yt = AtKt and growth rates themselves
grow exponentially with At. Ongoing productivity growth — for example through the
discovery of new ideas — would then produce ever-accelerating growth rates over time.
Specifically, with a standard capital accumulation specification (Kt = sYt − δKt) and
technological progress proceeding at rate g, the growth rate of output becomes
gY = g + sAt − δ (26)
which grows exponentially with At.
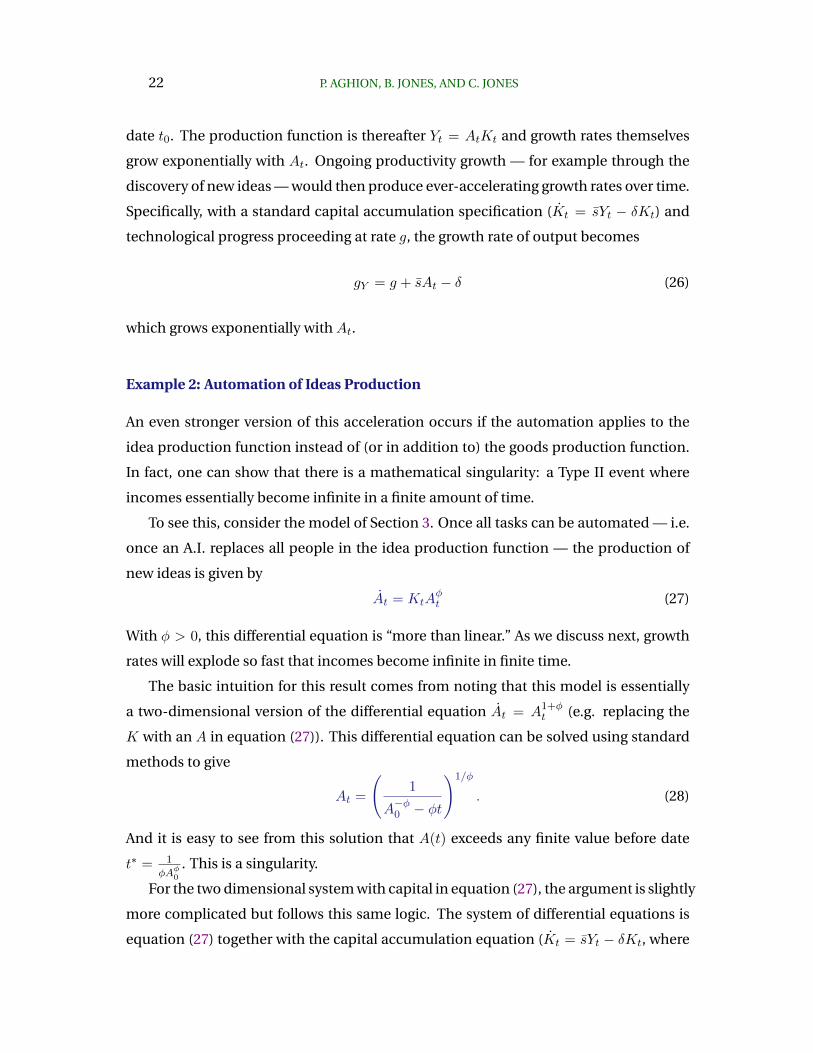
Example 2: Automation of Ideas Production
An even stronger version of this acceleration occurs if the automation applies to the
idea production function instead of (or in addition to) the goods production function.
In fact, one can show that there is a mathematical singularity: a Type II event where
incomes essentially become infinite in a finite amount of time.
To see this, consider the model of Section 3. Once all tasks can be automated — i.e.
once an A.I. replaces all people in the idea production function — the production of
new ideas is given by
At = KtAφt (27)
With φ > 0, this differential equation is “more than linear.” As we discuss next, growth
rates will explode so fast that incomes become infinite in finite time.
The basic intuition for this result comes from noting that this model is essentially
a two-dimensional version of the differential equation At = A1+φt (e.g. replacing the
K with an A in equation (27)). This differential equation can be solved using standard
methods to give
At =
(1
A−φ0 − φt
)1/φ
. (28)
And it is easy to see from this solution that A(t) exceeds any finite value before date
t∗ = 1
φAφ0. This is a singularity.
For the two dimensional system with capital in equation (27), the argument is slightly
more complicated but follows this same logic. The system of differential equations is
equation (27) together with the capital accumulation equation (Kt = sYt − δKt, where
ARTIFICIAL INTELLIGENCE AND ECONOMIC GROWTH 23
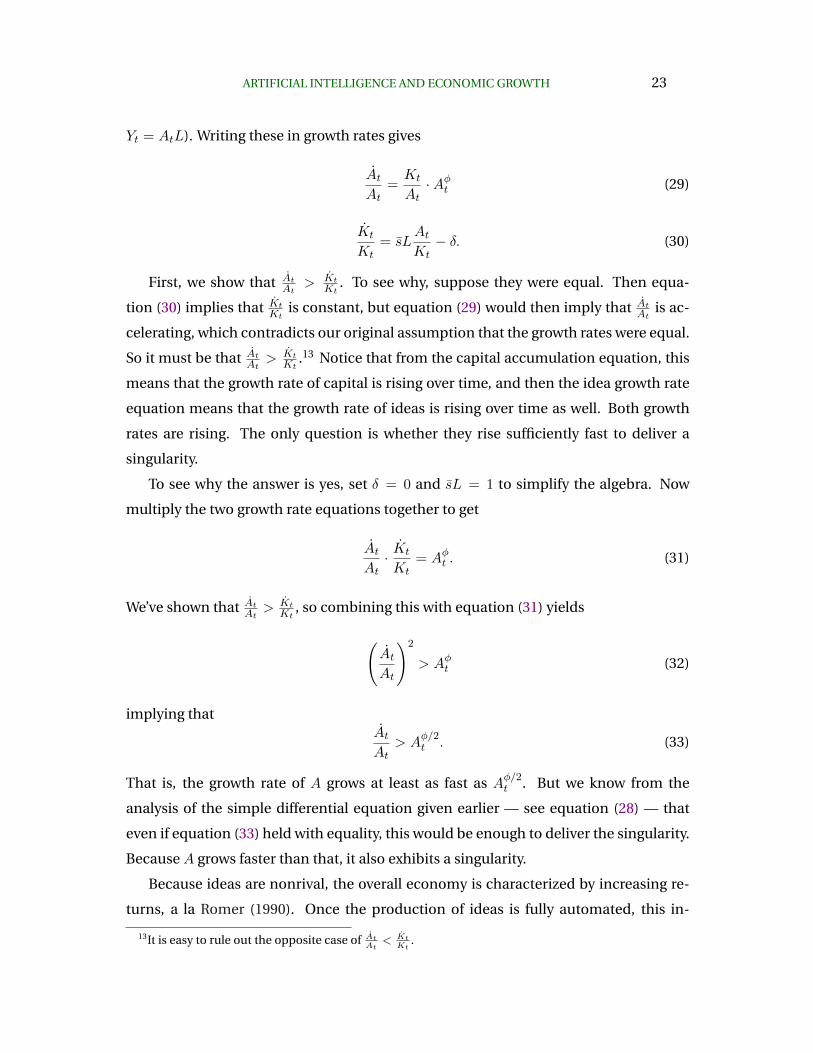
Yt = AtL). Writing these in growth rates gives
AtAt
=Kt
At·Aφt (29)
Kt
Kt= sL
AtKt− δ. (30)
First, we show that AtAt
> KtKt
. To see why, suppose they were equal. Then equa-
tion (30) implies that KtKt
is constant, but equation (29) would then imply that AtAt
is ac-
celerating, which contradicts our original assumption that the growth rates were equal.
So it must be that AtAt
> KtKt
.13 Notice that from the capital accumulation equation, this
means that the growth rate of capital is rising over time, and then the idea growth rate
equation means that the growth rate of ideas is rising over time as well. Both growth
rates are rising. The only question is whether they rise sufficiently fast to deliver a
singularity.
To see why the answer is yes, set δ = 0 and sL = 1 to simplify the algebra. Now
multiply the two growth rate equations together to get
AtAt· Kt
Kt= Aφt . (31)
We’ve shown that AtAt >KtKt
, so combining this with equation (31) yields
(AtAt
)2
> Aφt (32)
implying thatAtAt
> Aφ/2t . (33)
That is, the growth rate of A grows at least as fast as Aφ/2t . But we know from the
analysis of the simple differential equation given earlier — see equation (28) — that
even if equation (33) held with equality, this would be enough to deliver the singularity.
Because A grows faster than that, it also exhibits a singularity.
Because ideas are nonrival, the overall economy is characterized by increasing re-
turns, a la Romer (1990). Once the production of ideas is fully automated, this in-
13It is easy to rule out the opposite case of AtAt
< KtKt
.
24 P. AGHION, B. JONES, AND C. JONES
creasing returns applies to “accumulable factors,” which then leads to a Type II growth
explosion – i.e., a mathematical singularity.
Example 3: Singularities without Complete Automation
The above examples consider complete automation of goods production (Example 1)
and ideas production (Example 2). With the CES case and an elasticity of substitution
less than one, we require that all tasks are automated. If only a fraction of the tasks
are automated, then the scarce factor (labor) will dominate, and growth rates do not
explode. We show in this section that with Cobb-Douglas production, a Type II singu-
larity can occur as long as a sufficient fraction of the tasks are automated. In this sense,
the singularity might not even require full automation.
Suppose the production function for goods is Yt = AσtKαt L
1−α (a constant pop-
ulation simplifies the analysis, but exogenous population growth would not change
things). The capital accumulation equation and the idea production function are then
specified as
Kt = sLAσtKαt − δKt. (34)
At = Kβt S
λAφt (35)
where 0 < α < 1 and 0 < β < 1 and where we also take S (research effort) to be
constant. Following the Zeira (1998) model discussed earlier, we interpret α as the
fraction of goods tasks that have been automated and β as the fraction of tasks in idea
production that have been automated.
The standard endogenous growth result requires “constant returns to accumulable
factors.” To see what this means, it is helpful to define a key parameter:
γ :=σ
1− α· β
1− φ. (36)
In this setup, the endogenous growth case corresponds to γ = 1. Not surprisingly, then,
the singularity case occurs if γ > 1. Importantly, notice that this can occur with both α
and β less than one — i.e. when tasks are not fully automated. For example, in the case
in which α = β = φ = 1/2, then γ = 2 · σ, so explosive growth and a singularity will
occur if σ > 1/2. We show that γ > 1 delivers a Type II singularity in the remainder of
ARTIFICIAL INTELLIGENCE AND ECONOMIC GROWTH 25
this section. The argument builds on the argument given in the previous subsection.
In growth rates, the laws of motion for capital and ideas are
Kt
Kt= sL1−α Aσt
K1−αt
− δ. (37)
AtAt
= SλKβt
A1−φt
(38)
It is easy to show that these growth rates cannot be constant if γ > 1.14
If the growth rates are rising over time to infinity, then eventually either gAt > gKt, or
the reverse, or the two growth rates are the same. Consider the first case, i.e. gAt > gKt;
the other cases follow the same logic. Once again, to simplify the algebra, set δ = 0,
S = 1, and sL1−α = 1. Multiplying the growth rates together in this case gives
AtAt· Kt
Kt=
Kβt
A1−φt
· AσtK1−αt
. (39)
Since gA > gK , we then have
(AtAt
)2>
Kβt
A1−φt
· AσtK1−αt
> 1Kt· Kβ
t
A1−φt
· AσtK1−αt
(since Kt > 1 eventually)
> 1
K1−βt
· 1
A1−φt
· AσtK1−αt
(rewriting)
> 1
A1−βt
· 1
A1−φt
· AσtA1−αt
(since At > Kt eventually)
> Aγ−1t (collecting terms)
Therefore,AtAt
> Aγ−1
2t . (40)
With γ > 1, the growth rate grows at least as fast as At raised to a positive power. But
even if it grew just this fast we would have a singularity, by the same arguments given
before. The case with gKt > gAt can be handled in the same way, using K’s instead of
A’s. QED.
14If the growth rate of K is constant, then σgA = (1 − α)gK , so K is proportional to Aσ/(1−α). Makingthis substitution in (35) and using γ > 1 then implies that the growth rate of A would explode, and thisrequires the growth rate of K to explode.
26 P. AGHION, B. JONES, AND C. JONES
Example 4: Singularities via Superintelligence
The examples of growth explosions above are based in automation. These examples
can also be read as creating “superintelligence” as an artifact of automation, in the
sense that advances of At across all tasks include, implicitly, advances across cognitive
tasks, and hence a resulting singularity can be conceived of as commensurate with an
intelligence explosion. It is interesting that automation itself can provoke the emer-
gence of superintelligence. However, in the telling of many futurists, the story runs
differently, where an intelligence explosion occurs first and then, through the insights
of this superintelligence, a technological singularity may be reached. Typically the A.I.
is seen as “self-improving”through a recursive process.
This idea can be modeled using similar ideas to those presented above. To do so in
a simple manner, divide tasks into two types: physical and cognitive. Define a common
level of intelligence across the cognitive tasks by a productivity term Acognitive, and
further define a common productivity at physical tasks,Aphysical. Now imagine we have
a unit of A.I. working to improve itself, where progress follows
Acognitive = A1+ωcognitive (41)
We have studied this differential equation above, but now we apply it to cognition
alone. If ω > 0, then the process of self-improvement explodes, resulting in an un-
bounded intelligence in finite time.
The next question is how this superintelligence would affect the rest of the economy.
Namely, would such superintelligence also produce an output singularity? One route
to a singularity could run through the goods production function: to the extent that
physical tasks are not essential (i.e. ρ ≥ 0 ), then the intelligence explosion will drive a
singularity in output. However, it seems noncontroversial to assert that physical tasks
are essential to producing output, in which case the singularity will have potentially
modest effects directly on the goods production channel.
The second route lies in the idea production function. Here the question is how
the superintelligence would advance the productivity at physical tasks, Aphysical. For
example, if we write
Aphysical = AγcognitiveF (K,L) (42)
ARTIFICIAL INTELLIGENCE AND ECONOMIC GROWTH 27
where γ > 0, then it is clear that Aphysical will also explode with the intelligence ex-
plosion. That is, we imagine that the superintelligent A.I.can figure out ways to vastly
increase the rate of innovation at physical tasks. In the above specification, the output
singularity would then follow directly upon the advent of the superintelligence. Of
course, the idea production functions (41) and (42) are particular, and there are reasons
to believe they would not be the correct specifications, as we will discuss in the next
section.
4.2 Objections to singularities
The above examples show ways in which automation may lead to rapid accelerations of
growth, including ever increasing growth rates or even a singularity. Here we can con-
sider several possible objections to these scenarios, which can broadly be characterized
as “bottlenecks” that A.I. cannot resolve.
Automation Limits
One kind of bottleneck, which has been discussed above, emerges when some essential
input(s) to production are not automated. Whether A.I. can ultimately perform all
essential cognitive tasks, or more generally achieve human intelligence, is widely de-
bated. If not, then growth rates may still be larger with more automation and capital in-
tensity (Sections 2 and 3) but the “labor free” singularities featured above (Section 4.1)
become out of reach.
Search Limits
A second kind of bottleneck may occur even with complete automation. This type of
bottleneck occurs when the creative search process itself prevents especially rapid pro-
ducitivy gains. To see this, consider again the idea production function. In the second
example above, we allow for complete automation and show that a true mathematical
singularity can ensue. But note also that this result depends on the parameter φ. In the
differential equation
At = A1+φt
28 P. AGHION, B. JONES, AND C. JONES
we will have explosive growth only if φ > 0. If φ ≤ 0, then the growth rate declines
as At advances. Many models of growth and associated evidence suggest that, on av-
erage, innovation may be becoming harder, which is consistent with low values of φ
on average.15 Fishing out or burden of knowledge processes can point toward φ < 0.
Interestingly, the burden of knowledge mechanism (Jones (2009)), which is based on
the limits of human cognition, may not restrain an A.I., if an A.I. can comprehend a
much greater share of the knowledge stock than a human can. Fishing out processes,
however, viewed as a fundamental feature of the search for new ideas (Kortum (1997)),
would presumably also apply to an A.I. seeking new ideas. Put another way, A.I. may
resolve a problem with the fishermen, but it wouldn’t change what is in the pond. Of
course, “fishing out” search problems can apply not only to overall productivity but
also to the emergence of a superintelligence, limiting the potential rate of an A.I.’s self-
improvement (see (41)), and hence limiting the potential for growth explosions through
the superintelligence channel.
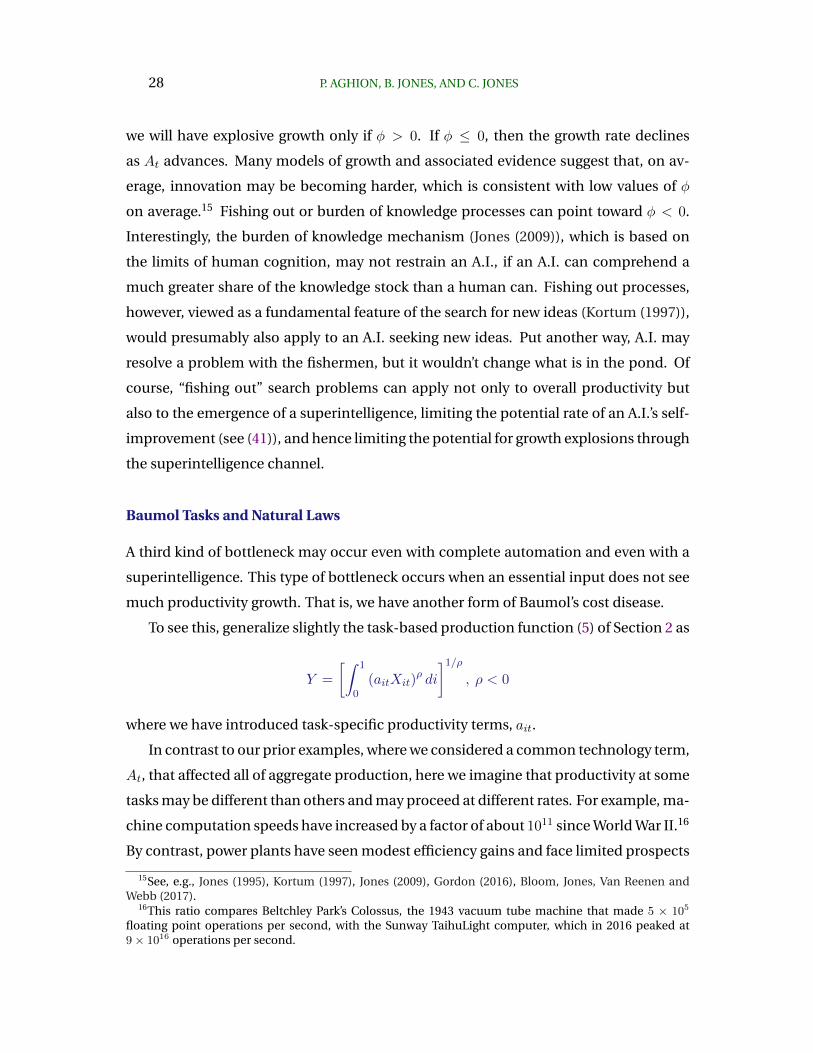
Baumol Tasks and Natural Laws
A third kind of bottleneck may occur even with complete automation and even with a
superintelligence. This type of bottleneck occurs when an essential input does not see
much productivity growth. That is, we have another form of Baumol’s cost disease.
To see this, generalize slightly the task-based production function (5) of Section 2 as
Y =
[∫ 1
0(aitXit)
ρ di
]1/ρ, ρ < 0
where we have introduced task-specific productivity terms, ait.
In contrast to our prior examples, where we considered a common technology term,
At, that affected all of aggregate production, here we imagine that productivity at some
tasks may be different than others and may proceed at different rates. For example, ma-
chine computation speeds have increased by a factor of about 1011 since World War II.16
By contrast, power plants have seen modest efficiency gains and face limited prospects
15See, e.g., Jones (1995), Kortum (1997), Jones (2009), Gordon (2016), Bloom, Jones, Van Reenen andWebb (2017).
16This ratio compares Beltchley Park’s Colossus, the 1943 vacuum tube machine that made 5 × 10⁵
floating point operations per second, with the Sunway TaihuLight computer, which in 2016 peaked at9× 1016 operations per second.
ARTIFICIAL INTELLIGENCE AND ECONOMIC GROWTH 29
given constraints like Carnot’s theorem. This distinction is important, because with
ρ < 0, output and growth end up being determined not by what we are good at, but by
what is essential but hard to improve.
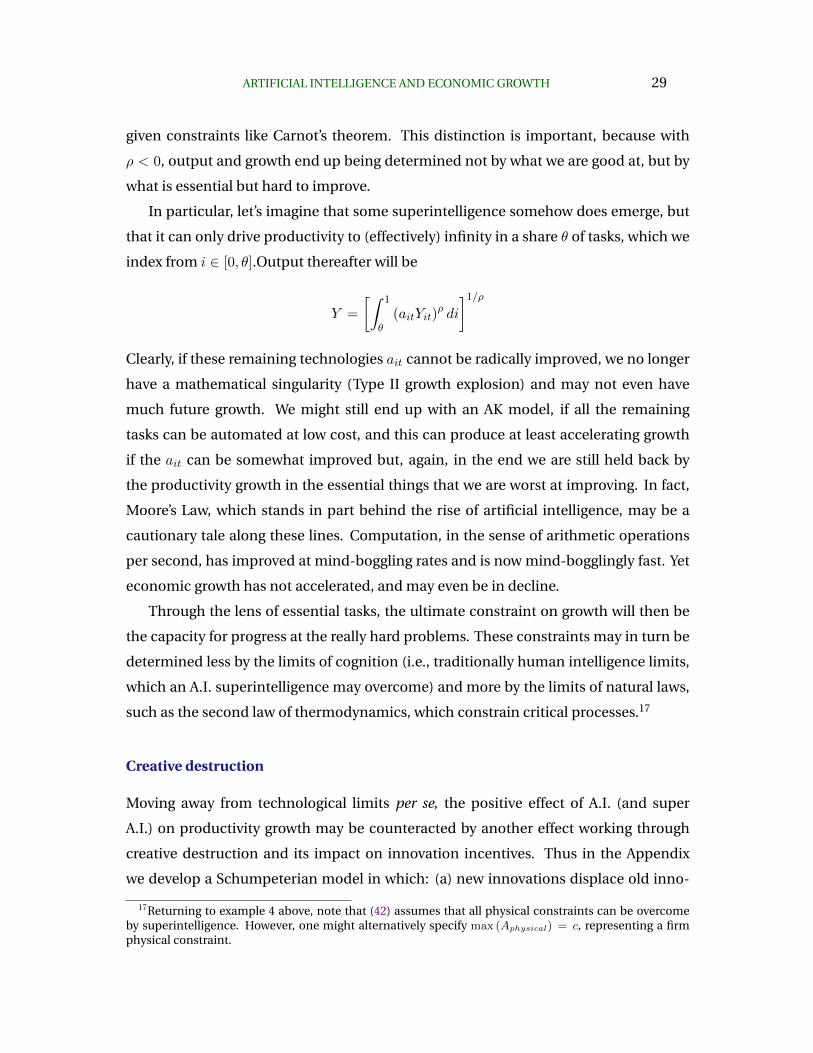
In particular, let’s imagine that some superintelligence somehow does emerge, but
that it can only drive productivity to (effectively) infinity in a share θ of tasks, which we
index from i ∈ [0, θ].Output thereafter will be
Y =
[∫ 1
θ(aitYit)
ρ di
]1/ρClearly, if these remaining technologies ait cannot be radically improved, we no longer
have a mathematical singularity (Type II growth explosion) and may not even have
much future growth. We might still end up with an AK model, if all the remaining
tasks can be automated at low cost, and this can produce at least accelerating growth
if the ait can be somewhat improved but, again, in the end we are still held back by
the productivity growth in the essential things that we are worst at improving. In fact,
Moore’s Law, which stands in part behind the rise of artificial intelligence, may be a
cautionary tale along these lines. Computation, in the sense of arithmetic operations
per second, has improved at mind-boggling rates and is now mind-bogglingly fast. Yet
economic growth has not accelerated, and may even be in decline.
Through the lens of essential tasks, the ultimate constraint on growth will then be
the capacity for progress at the really hard problems. These constraints may in turn be
determined less by the limits of cognition (i.e., traditionally human intelligence limits,
which an A.I. superintelligence may overcome) and more by the limits of natural laws,
such as the second law of thermodynamics, which constrain critical processes.17
Creative destruction
Moving away from technological limits per se, the positive effect of A.I. (and super
A.I.) on productivity growth may be counteracted by another effect working through
creative destruction and its impact on innovation incentives. Thus in the Appendix
we develop a Schumpeterian model in which: (a) new innovations displace old inno-
17Returning to example 4 above, note that (42) assumes that all physical constraints can be overcomeby superintelligence. However, one might alternatively specify max (Aphysical) = c, representing a firmphysical constraint.
30 P. AGHION, B. JONES, AND C. JONES
vations; (b) innovations involves two steps, where the first step can be performed by
machines but the second step requires human inputs to research. In a singularity-
like limit where successive innovations come with no time in-between, the private
returns to human R&D falls down to zero and as a result innovation and growth taper
off. More generally, the faster the first step of each successive innovation as a result of
A.I., the lower the return to human investment in stage-two innovation, which in turn
counteracts the direct effect of A.I. and super-A.I. on innovation-led growth pointed out
above.
4.3 Some additional thoughts
We conclude this section with additional thoughts on how A.I. and its potential singu-
larity effects might affect growth and convergence.
A first idea is that new A.I. technologies might allow imitation/learning of frontier
technologies to become automated. That is, machines would figure out in no time how
to imitate frontier technologies. Then a main source of divergence might become credit
constraints, to the extent that those might prevent poorer countries or regions from
acquiring super-intelligent machines whereas developed economies could afford such
machines. Thus one could imagine a world in which advanced countries concentrate
all their research effort on developing new product lines (i.e. on frontier innovation)
whereas poorer countries would devote a positive and increasing fraction of their re-
search labor on learning about the new frontier technologies as they cannot afford the
corresponding A.I. devices. Overall, one would expect a increasing degree of divergence
worldwide.
A second conjecture is that, anticipating the effect of A.I. on the scope and speed
of imitation, potential innovators may become reluctant to patent their inventions,
fearing that the disclosure of new knowledge in the patent would lead to straight imi-
tation. Trade secrets may then become the norm, instead of patenting. Or alternatively
innovations would become like what financial innovations are today, i.e. knowledge
creation with huge network effects and with very little scope for patenting.
Finally, with imitation and learning being performed mainly by super-machines in
developed economies, then research labor would become (almost) entirely devoted to
product innovation, increasing product variety or inventing new products (new prod-
ARTIFICIAL INTELLIGENCE AND ECONOMIC GROWTH 31
uct lines) to replace existing products. Then, more than ever, the decreasing returns
to digging deeper into an existing line of product would be offset by the increased
potential for discovering new product lines. Overall, ideas might end up being easier to
find, if only because of the singularity effect of A.I. on recombinant idea-based growth.
5. A.I., Firms, and Economic Growth
To this point, we have linked artificial intelligence to economic growth emphasizing
features of the production functions of goods and ideas. However, the advance of
artificial intelligence and its macroeconomic effects will depend on the potentially rich
behavior of firms. We have introduced one such view already in the prior section, where
considerations of creative destruction provide an incentive-oriented mechanism that
may be an important obstacle to singularities. In this section, we consider firm’s in-
centives and behavior more generally to further outline the A.I. research agenda. We
examine potentially first-order issues that emerge when introducing market structure,
sectoral differences, and organizational considerations within firms.
5.1 Market Structure
Existing work on competition and innovation-led growth points to the existence of two
counteracting effects: on the one hand, more intense product market competition (or
imitation threat) induces neck-and-neck firms at the technological frontier to innovate
in order to escape competition; on the other hand, more intense competition tends to
discourage firms behind the current technology frontier to innovate and thereby catch-
up with frontier firms. Which of these two effects dominates, in turn depends upon the
degree of competition in the economy, and/or upon how advanced the economy is:
while the escape competition effect tends to dominate at low initial levels of compe-
tition and in more advanced economies, the discouragement effect may dominate for
higher levels of competition or in less advanced economies.18
Can A.I. affect innovation and growth through potential effects it might have on
product market competition? A first potential channel is that A.I. may facilitate imi-
tation of existing products and technologies. Here we have particularly in mind the
18For example, see Aghion and Howitt (1992) and Aghion, Bloom, Blundell, Griffith and Howitt (2005).
32 P. AGHION, B. JONES, AND C. JONES
idea that A.I. might facilitate reverse engineering, and thereby facilitate imitation of
leading products and technologies. If we follow the inverted-U logic of Aghion, Bloom,
Blundell, Griffith and Howitt (2005), in sectors with initially low levels of imitation,
some A.I.- induced reverse engineering might stimulate innovation by virtue of the
escape-competition effect. But too high (or too immediate) an imitation threat will end
up discouraging innovation as potential innovators will face excessive expropriation. A
related implication of A.I., is that its introduction may speed up the process by which
each individual sector becomes congested over time. This in turn may translate into
faster decreasing returns to innovating within any existing sector (see Bloom, Gari-
cano, Sadun and Van Reenen (2014)), but by the same token it may induce potential
innovators to devote more resources to inventing new lines in order to escape compe-
tition and imitation within current lines. The overall effect on aggregate growth will in
turn depend upon the relative contributions of within-sector secondary innovation and
fundamental innovation aimed at creating new product lines (see Aghion and Howitt
(1996)) to the overall growth process.
Another channel whereby A.I. and the digital revolution may affect innovation and
growth through affecting the degree of product market competition is in relation to
the development of platforms or networks. A main objective of platform owners is to
maximize the number of participants to the platform on both sides of the correspond-
ing two-sided markets. For example Google enjoys a monopoly position as a search
platform, Facebook enjoys a similar position as a social network with more than 1.7
billion users worldwide each month, and so does Booking.com for hotel reservations
(more than 75% of hotel clients resort to this network). And the same goes for Uber
in the area of individual transportation, Airbnb for apartment renting, and so on. The
development of networks may in turn affect competition in at least two ways. First, data
access may act as an entry barrier for creating new competing networks, although it did
not prevent Facebook from developing a new network after Google. More importantly,
networks can take advantage of their monopoly positions to impose large fees on mar-
ket participants (and they do), which may discourage innovation by these participants,
whether they are firms or self-employed individuals.
At the end, whether escape competition or discouragement effects will dominate,
will depend upon the type of sector (frontier/neck-and-neck or older/lagging), the ex-
ARTIFICIAL INTELLIGENCE AND ECONOMIC GROWTH 33
tent to which A.I. facilitates reverse engineering and imitation, and upon competition
and/or regulatory policies aimed at protecting intellectual property rights while lower-
ing entry barriers. Recent empirical work (e.g. see Aghion, Howitt and Prantl (2015))
points at patent protection and competition policy being complementary in inducing
innovation and productivity growth. It would be interesting to explore how A.I. affects
this complementarity between the two policies.
5.2 Sectoral Reallocation
A recent paper by Baslandze (2016) argues that the IT revolution has produced a major
knowledge diffusion effect which in turn has induced a major sectoral reallocation
from sectors that do not rely much on technological externalities from other fields
or sectors (e.g. textile industries) to sectors that rely more heavily on technological
externalities from other sectors. Her argument, which we believe applies to A.I., rests
on the following two counteracting effects of IT on innovation incentives: on the one
hand, firms can more easily learn from each other and therefore benefit more from
knowledge diffusion from other firms and sectors; on the other hand, the improved
access to knowledge from other firms and sectors induced by IT (or A.I.) increases
the scope for business-stealing. In high-tech sectors where firms benefit more from
external knowledge, the former - knowledge diffusion - effect will dominate whereas
in sectors that do not rely much on external knowledge the latter - competition or
business-stealing- effect will tend to dominate. Indeed in more knowledge dependent
sectors firms see both their productive and their innovative capabilities increase to a
larger extent than the capabilities of firms in sectors that rely less on knowledge from
other sectors.
It then immediately follows that the diffusion of IT - and A.I. for our purpose -
should lead to an expansion of sectors which rely more on external knowledge (in which
the knowledge diffusion effect dominates) at the expense of the more traditional (and
more self-contained) sectors where firms do not rely as much on external knowledge.
Thus, in addition to its direct effects on firms’ innovation and production capabil-
ities, the introduction of IT and A.I. involve a knowledge diffusion effect which is aug-
mented by a sectoral reallocation effect at the benefit of high-tech sectors which rely
more on knowledge externalities from other fields and sectors. The positive knowledge
34 P. AGHION, B. JONES, AND C. JONES
diffusion effect is partly counteracted by the negative business-stealing effect (Baslandze
shows that the latter effect has been large in the US and that without it the IT revolu-
tion would have induced yet a much higher acceleration in productivity growth for the
whole US economy).
Based on her analysis, Baslandze (2016) responds to Gordon (2012) with the argu-
ment that Gordon only took into account the direct effect of IT and not its indirect
knowledge diffusion and sectoral reallocation effects on aggregate productivity growth.
We believe that the same points can be made with respect to A.I. instead of IT,
and one could try and reproduce Baslandze’s calibration exercise to assess the relative
importance of the direct and indirect effects of A.I., to decompose the indirect effect of
A.I. into its positive knowledge diffusion effect and its potentially negative competition
effect, and to assess the extent to which A.I. affects overall productivity growth through
its effects on sectoral reallocation.
5.3 Organization
How should we expect firms to adapt their internal organization, the skill composition
of their workforce and their wage policies to the introduction of A.I.? In his recent
book on “The Economics of the Common Good”, Tirole (2017) spells out what one may
consider to be “common wisdom”expectations on firms and A.I. Namely, introducing
A.I. should: (a) increase the wage gap between skilled and unskilled labor, as the latter
is presumably more substitutable to A.I. than the former; (b) the introduction of A.I. al-
lows firms to automate and dispense with middle-men performing monitoring tasks (in
other words, firms should become flatter, i.e. with higher spans of control); (c) should
encourage self-employment by making it easier for individuals to build up reputation.
Let us revisit these various points in more details. A.I., skills, and wage premia: On
A.I. and the increased gap between skilled and unskilled wage, the prediction brings
us back to Krusell, Ohanian, Rıos-Rull and Violante (2000): based on an aggregate pro-
duction function in which physical equipment is more substitutable to unskilled labor
than to skilled labor, these authors argued that the observed acceleration in the decline
of the relative price of production equipment goods since the mid-1970s could account
for most of the variation in the college premium over the past twenty-five years. In other
words, the rise in the college premium could largely be attributed to an increase in the
ARTIFICIAL INTELLIGENCE AND ECONOMIC GROWTH 35
rate of (capital-embodied) skill-biased technical progress. And presumably A.I. is an
extreme form of capital-embodied skill-biased technical change, as robots substitute
for unskilled labor but require skilled labor to be installed and exploited. However,
recent work by Aghion, Bergeaud, Blundell and Griffith (2017) suggests that while the
prediction of a premium to skills may hold at the macroeconomic level, it perhaps
misses important aspects of firms’ internal organization and that organization itself
may evolve as a result of introducing A.I. More specifically, Aghion, Bergeaud, Blundell
and Griffith (2017) use matched employer-employee data from the UK, which they
augment with information on R&D expenditures, to analyze the relationship between
innovativeness and average wage income across firms.
A first, not surprising, finding is that more R&D intensive firms pay higher wages
on average and employ a higher fraction of high-occupation workers than less R&D
intensive firms (see Figure 4).
This, in turn, is perfectly in line with the above prediction (a) but also with pre-
diction (b) as it suggests that more innovative (or more “frontier”) firms rely more on
outsourcing for low-occupation tasks. However, a more surprising finding in Aghion,
Bergeaud, Blundell and Griffith (2017) is that lower-skilled (lower occupation) workers
benefit more from working in more R&D intensive firms (relative to working in a firm
which does no R&D) than higher-skilled workers. This finding is summarized by Figure
5. In that Figure, we first see that higher-skilled workers earn more than lower-skilled
workers in any firm no matter how R&D intensive that firm is (the high-skill wage curve
always lies strictly above the middle-skill curve which itself always lies above the lower-
skill curve). But more interestingly the lower-skill curve is steeper than the middle-
skill and higher-skill curve. But the slope of each of these curves precisely reflects the
premium for workers with the corresponding skill level to working in a more innovative
firm.
Similarly, we should expect more A.I.-intensive firms to: (i) employ a higher fraction
of (more highly paid) high-skill workers; (ii) outsource an increasing fraction of low-
occupation tasks; (iii) give a higher premium to those low-occupation workers they
keep within the firm (unless we take the extreme view that all the functions to be per-
formed by low-occupation workers could be performed by robots).
To rationalize the above findings and these latter predictions, let us follow Aghion,
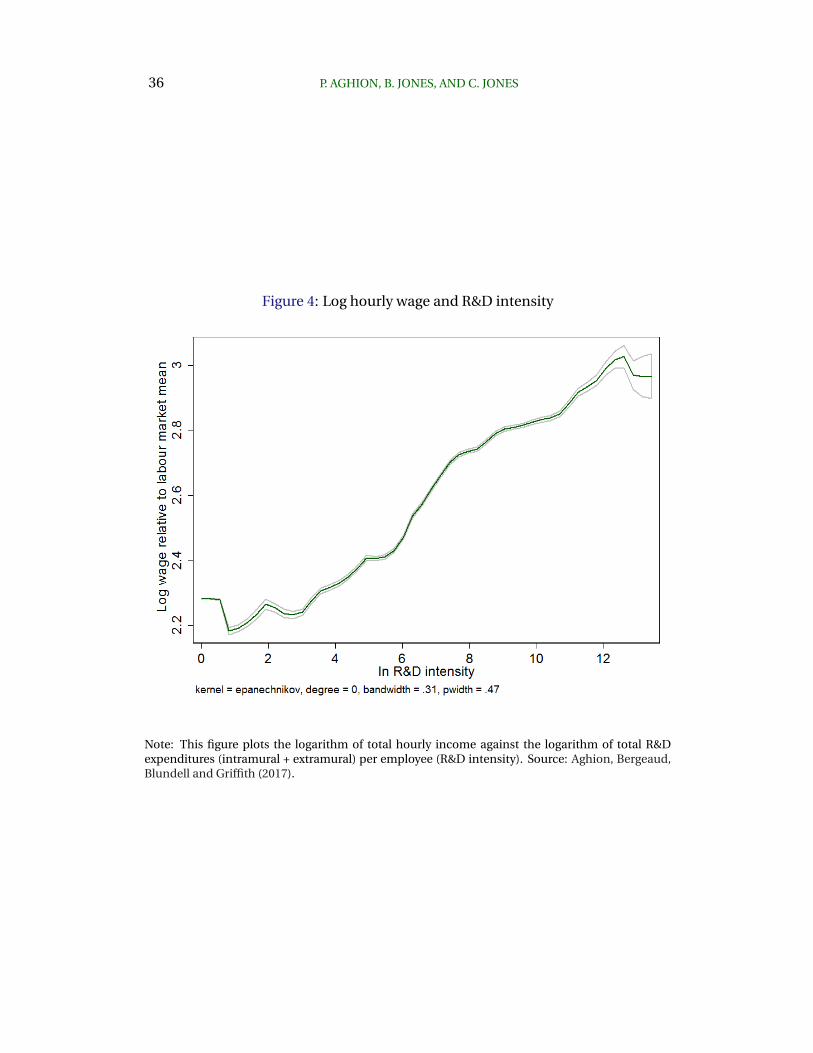
36 P. AGHION, B. JONES, AND C. JONES
Figure 4: Log hourly wage and R&D intensity
Note: This figure plots the logarithm of total hourly income against the logarithm of total R&Dexpenditures (intramural + extramural) per employee (R&D intensity). Source: Aghion, Bergeaud,Blundell and Griffith (2017).
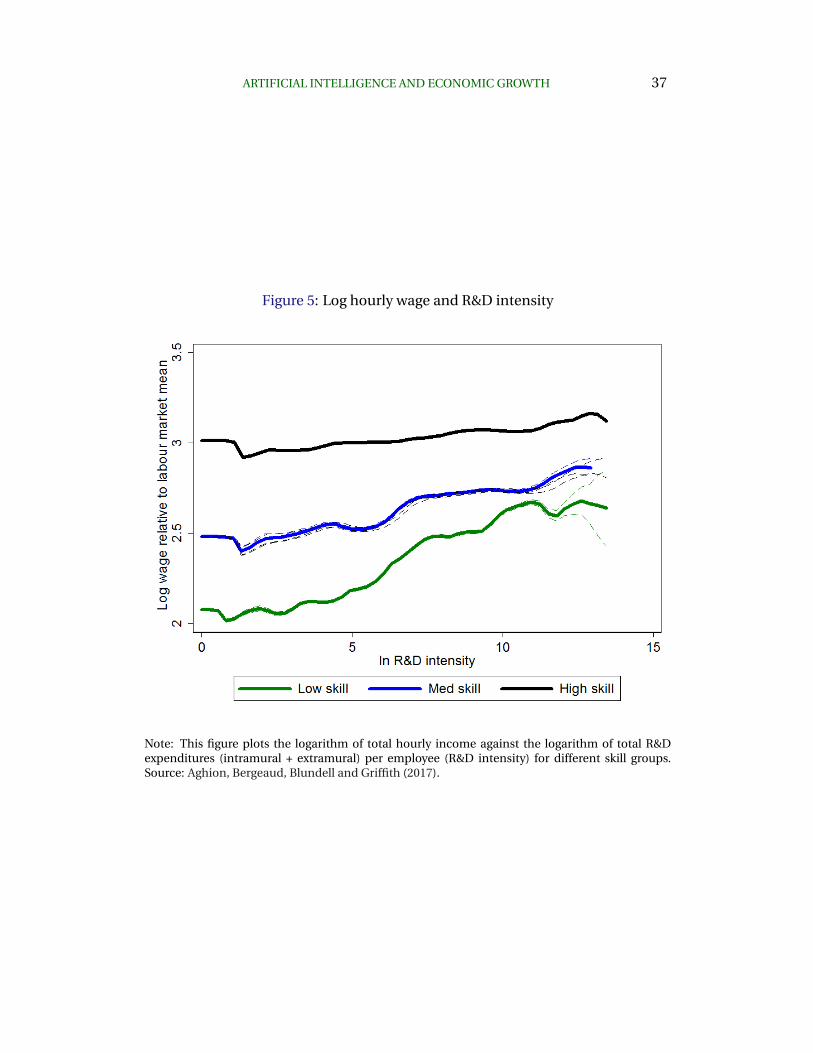
ARTIFICIAL INTELLIGENCE AND ECONOMIC GROWTH 37
Figure 5: Log hourly wage and R&D intensity
Note: This figure plots the logarithm of total hourly income against the logarithm of total R&Dexpenditures (intramural + extramural) per employee (R&D intensity) for different skill groups.Source: Aghion, Bergeaud, Blundell and Griffith (2017).
38 P. AGHION, B. JONES, AND C. JONES
Bergeaud, Blundell and Griffith (2017) who propose a model in which more innovative
firms display a higher degree of complementarity between low-skill workers and the
other production factors (capital and high-skill labor) within the firm. Another feature
of their model is that high-occupation employees’ skills are less firm-specific than low-
skill workers: namely, if the firm was to replace a high-skill worker by another high-skill
worker, the downside risk would be limited by the fact that higher-skill employees are
typically more educated employees, whose market value is largely determined by their
education and accumulated reputation, whereas low-occupation employees’ quality
is more firm-specific. This model is meant to capture the idea that low-occupation
workers can have a potentially more damaging effect on the firm’s value if the firm is
more innovative (or more A.I. intensive for our purpose).
In particular an important difference with the common wisdom, is that here in-
novativeness (or A.I. intensity) impacts on the organizational form of the firm and in
particular on complementarity or substitutability between workers with different skill
levels within the firm, whereas the common wisdom view takes this complementarity
or substitutability as given. Think of a low-occupation employee (for example an as-
sistant) who shows outstanding ability, initiative and trustworthiness. That employee
performs a set of tasks for which it might be difficult or too costly to hire a high-skill
worker; furthermore, and perhaps more importantly, the low-occupation employee
is expected to stay longer in the firm than higher-skill employees, which in turn en-
courages the firm to invest more in trust-building and firm-specific human capital and
knowledge. Overall, such low-occupation employees can make a big difference to the
firm’s performance.
This alternative view of A.I. and firms, is consistent with the work of theorists of
the firm such as Luis Garicano. Thus in Garicano (2000) downstream - low-occupation
- employees are consistently facing new problems; among these new problems they
sort out those they can solve themselves (the easier problems) and the more difficult
questions they pass on to upstream “higher-skill”- employees in the firm’s hierarchy.
Presumably, the more innovative or more A.I. intensive- the firm is, the harder it is
to solve the more difficult questions, and therefore the more valuable the time of up-
stream high-occupation employees becomes; this in turn makes it all the more im-
portant to employ downstream - low-occupation - employees with higher ability to
ARTIFICIAL INTELLIGENCE AND ECONOMIC GROWTH 39
make sure that less problems will be passed on to the upstream - high-occupation -
employees within the firm, so that these high-occupation employees will have more
free time to concentrate on solving the most difficult tasks. Another interpretation of
the higher complementarity between low-occupation and high-occupation employees
in more innovative (or more A.I.-intensive) firms, is that the potential loss from unre-
liable low-occupation employees is bigger in such firms: hence the need to select out
those low-occupation employees which are not reliable. This higher complementarity
between low-occupation workers and other production factors in more innovative (or
more A.I. intensive) firms in turn increases the bargaining power of low-occupation
workers within the firm (it increases their Shapley Value if we follow Stole and Zwiebel
(1996)). This in turn explains the higher payoff for low-occupation workers. It also
predicts that job turnover should be lower (tenure should be higher) amongst low-
occupation workers who work for more innovative (more A.I.-intensive) firms than
for low-occupation workers who work for less innovative firms, whereas the turnover
difference should be less between high-occupation workers employed by these two
types of firms. This additional prediction is also confronted to the data in Aghion,
Bergeaud, Blundell and Griffith (2017).
Note that so far R&D investment has been used as the measure of the firm’s innova-
tiveness or frontierness. We would like to test the same predictions but using explicit
measures of A.I. intensity as the RHS variable in the regressions (investment in robots,
reliance on digital platforms,..). A.I. and firm’s organizational form: Recent empirical
studies (e.g. see Bloom, Garicano, Sadun and Van Reenen (2014)), have shown that the
IT revolution has led firms to eliminate middle-range jobs and move towards flatter
organizational structure. The development of A.I. should reinforce that trend, while
perhaps also reducing the ratio to low-occupation to high-occupation jobs within firms
as we argued above.
A potentially helpful framework to think about firms’ organizational forms, is Aghion
and Tirole (1997). There, a principal can decide whether or not to delegate authority to
a downstream agent. She can delegate authority in two ways: (i) by formally allocat-
ing control rights to the agent (in that case we say that the principal delegates formal
authority to the agent); (ii) or informally through the design of the organization, e.g.
by increasing the span of control or by engaging in multiple activities: these devices
40 P. AGHION, B. JONES, AND C. JONES
enable the principal to commit to leave initiative to the agent (in that case we say that
the principal delegates real authority to the agent). And agents’ initiative particularly
matters if the firm needs to be innovative, which is particularly the case for more fron-
tier firms in their sectors. Whether she decides to delegate formal or only real authority
to her agent, the principal faces the following trade-off: more delegation of authority to
the agent induces the agent to take more initiative; on the other hand this implies that
the principal will lose some control over the firm, and therefore face the possibility that
suboptimal decisions (from her viewpoint) be taken more often. Which of these two
counteracting effects of delegation dominates, will in turn depend upon the degree
of congruence between the principal’s and the agent’s preference, but also about the
principal’s ability to reverse suboptimal decisions.
How should the introduction of A.I. affect this trade-off between loss of control
and initiative? To the extent that A.I. makes it easier for the principal to monitor the
agent, more delegation of authority will be required in order to still elicit initiative from
the agent. The incentive to delegate more authority to downstream agents, will also
be enhanced by the fact that with A.I., suboptimal decision-making by downstream
agents can be more easily corrected and reversed: in other words, A.I. should reduce
the loss of control involved in delegating authority downstream. A third reason for why
A.I. may encourage decentralization in decision-making, has to do with coordination
costs: namely, it may be costly for the principal to delegate decision making to down-
stream units if this prevents these units from coordinating within the firm (see Hart and
Holmstrom (2010)). But here again, A.I. may help overcome this problem by reducing
the monitoring costs between the principal and its multiple downstream units, and
thereby induce more decentralization of authority.
More delegation of authority in turn can be achieved through various means: in par-
ticular by eliminating intermediate layers in the firm’s hierarchy, or by turning down-
stream units into profit centers or fully independent firms, or through horizontal inte-
gration which will commit the principal to spending time on other activities. Overall,
one can imagine that the development of A.I. in more frontier sectors should lead to
larger and more horizontally integrated firms, to flatter firms with more profit centers,
which outsource an increasing number of tasks to independent self-employed agents.
The increased reliance on self-employed independent agents will in turn be facilitated
ARTIFICIAL INTELLIGENCE AND ECONOMIC GROWTH 41
by the fact that, as well explained by Tirole (2017), A.I. helps agents to quickly develop
individual reputations. This brings us to the third aspect of A.I. and organizations on
self-employment. A.I. and self-employment: As stressed above, A.I. favors the devel-
opment of self-employment for at least two reasons: first, it may induce A.I. inten-
sive firms to outsource tasks, starting with low-occupation tasks; second, it makes it
easier for independent agents to develop individual reputations. Does that imply that
A.I. should result in the end of large integrated firms with individuals only interacting
with each other through platforms? And which agents are more likely to become self-
employed?
On the first question: Tirole (2017) provides at least two reasons for why firms should
survive the introduction of A.I. First, some activities involve large sunk costs and/or
large fixed costs that cannot be borne by a single individual. Second, some activities
involve a level of risk-taking which also may not be borne by one single agent. To this we
should add the transaction cost argument that vertical integration facilitates relation-
specific investments in situations of contractual incompleteness: can we truly imagine
that A.I. will by itself fully overcome contractual incompleteness?
On the second question: Our above discussion suggests that low-skill activities in-
volving limited risk and for which A.I. helps develop individual reputations (hotel or
transport services, health assistance to the elder and/or handicapped, catering ser-
vices, house cleaning,..) are primary candidates for increasingly becoming self-employment
jobs as A.I. diffuses in the economy. And indeed recent studies by Saez (2010), Chetty,
Friedman, Olsen and Pistaferri (2011), and Kleven and Waseem (2013) point to low-
income individuals being more responsive to tax or regulatory changes aimed at facil-
itating self-employment. Natural extensions of these studies would be to explore the
extent to which such regulatory changes have had more impact in sectors with higher
A.I. penetration.
The interplay between A.I. and self-employment also involves potentially interest-
ing dynamic aspects. Thus it might be worth looking at whether self-employment helps
individuals accumulate human capital (or at least protects them against the risk of
human capital depreciation following the loss of a formal job), and the more so in
sectors with higher A.I. penetration. Also interesting would be to look at how the in-
terplay between self-employment and A.I. is itself affected by government policies and
42 P. AGHION, B. JONES, AND C. JONES
institutions, and here we have primarily in mind education policy and social or income
insurance for the self-employed. How do these policies affect the future performance
of currently self-employed individuals, and are they at all complemented by the in-
troduction of A.I.? In particular, do currently self-employed individuals move back to
working for larger firms, and how does the probability of moving back to a regular
employment vary with A.I., government policy, and the interplay between the two?
Presumably, a more performing basic education system and a more comprehensive
social insurance system should both encourage self-employed individuals to better
take advantage of A.I. opportunities and support to accumulate skills and reputation
and thereby improve their future career prospects. On the other hand, some may argue
that A.I. will have a discouraging effect on self-employed individuals, if it lowers their
prospects of ever reintegrating a regular firm in the future, as more A.I. intensive firms
reduce their demand for low-occupation workers.
6. Evidence on Capital Shares and Automation to Date
Models that conceptualize A.I. as a force of increasing automation suggest that an up-
swing in automation may be seen in the factor payments going to capital — the capital
share. In recent years, the rise in the capital share in the U.S. and around the world
has been a central topic of research. For example, see Karabarbounis and Neiman
(2013), Elsby, Hobijn and Sahin (2013), and Kehrig and Vincent (2017). In this section,
we explore this evidence, first for industries within the United States, second for the
motor vehicles industry in the U.S. and Europe, and finally by looking at how changes
in capital shares over time correlate with the adoption of robots.
Figure 6 reports capital shares by industry from the U.S. KLEMS data of Jorgenson,
Ho and Samuels (2017); shares are smoothed using an HP filter with smoothing pa-
rameter 400 to focus on the medium- to long-run trends. It is well-known that the
aggregate capital share has increased since at least the year 2000 in the U.S. economy.
Figure 6 shows that this aggregate trend holds up across a large number of sectors,
including agriculture, construction, chemicals, computer equipment manufacturing,
motor vehicles, publishing, telecommunications, and wholesale and retail trade. The
main place where one does not see this trend is in services, including education, gov-
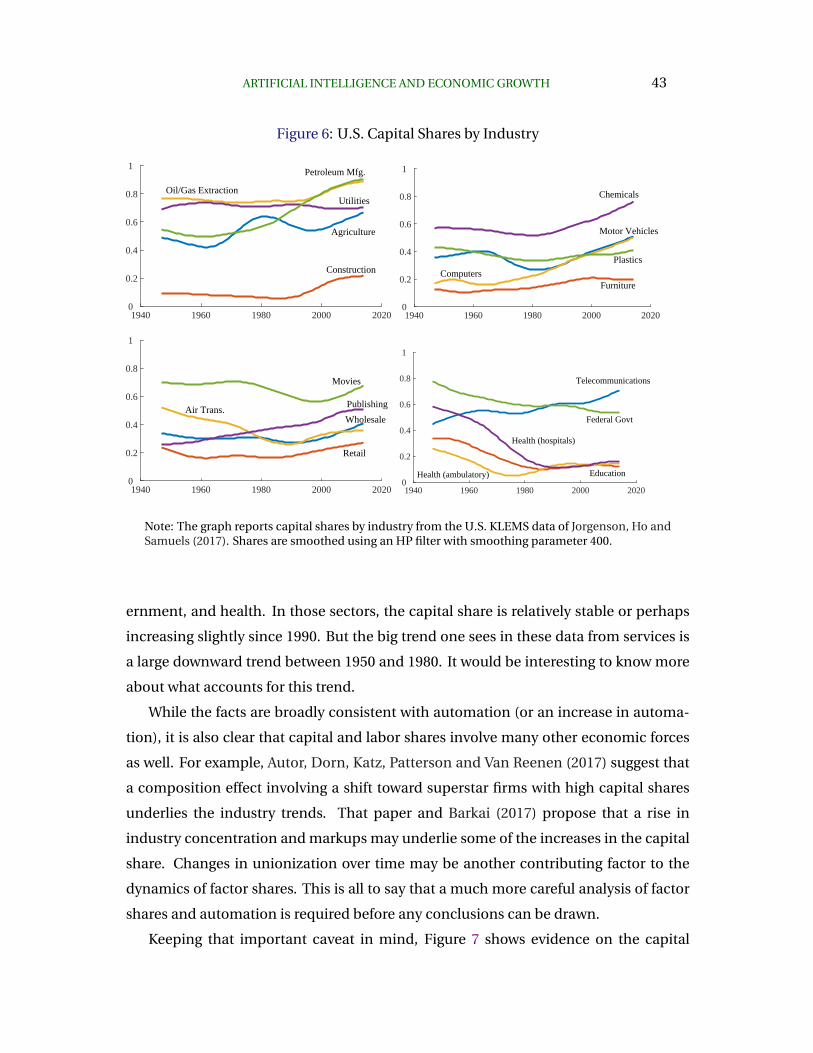
ARTIFICIAL INTELLIGENCE AND ECONOMIC GROWTH 43
Figure 6: U.S. Capital Shares by Industry
1940 1960 1980 2000 20200
0.2
0.4
0.6
0.8
1
Agriculture
Construction
Oil/Gas ExtractionUtilities
Petroleum Mfg.
1940 1960 1980 2000 20200
0.2
0.4
0.6
0.8
1
Motor Vehicles
Furniture
Computers
Chemicals
Plastics
1940 1960 1980 2000 20200
0.2
0.4
0.6
0.8
1
Wholesale
Retail
Air Trans.Publishing
Movies
1940 1960 1980 2000 20200
0.2
0.4
0.6
0.8
1
Telecommunications
EducationHealth (ambulatory)
Health (hospitals)
Federal Govt
Note: The graph reports capital shares by industry from the U.S. KLEMS data of Jorgenson, Ho andSamuels (2017). Shares are smoothed using an HP filter with smoothing parameter 400.
ernment, and health. In those sectors, the capital share is relatively stable or perhaps
increasing slightly since 1990. But the big trend one sees in these data from services is
a large downward trend between 1950 and 1980. It would be interesting to know more
about what accounts for this trend.
While the facts are broadly consistent with automation (or an increase in automa-
tion), it is also clear that capital and labor shares involve many other economic forces
as well. For example, Autor, Dorn, Katz, Patterson and Van Reenen (2017) suggest that
a composition effect involving a shift toward superstar firms with high capital shares
underlies the industry trends. That paper and Barkai (2017) propose that a rise in
industry concentration and markups may underlie some of the increases in the capital
share. Changes in unionization over time may be another contributing factor to the
dynamics of factor shares. This is all to say that a much more careful analysis of factor
shares and automation is required before any conclusions can be drawn.
Keeping that important caveat in mind, Figure 7 shows evidence on the capital
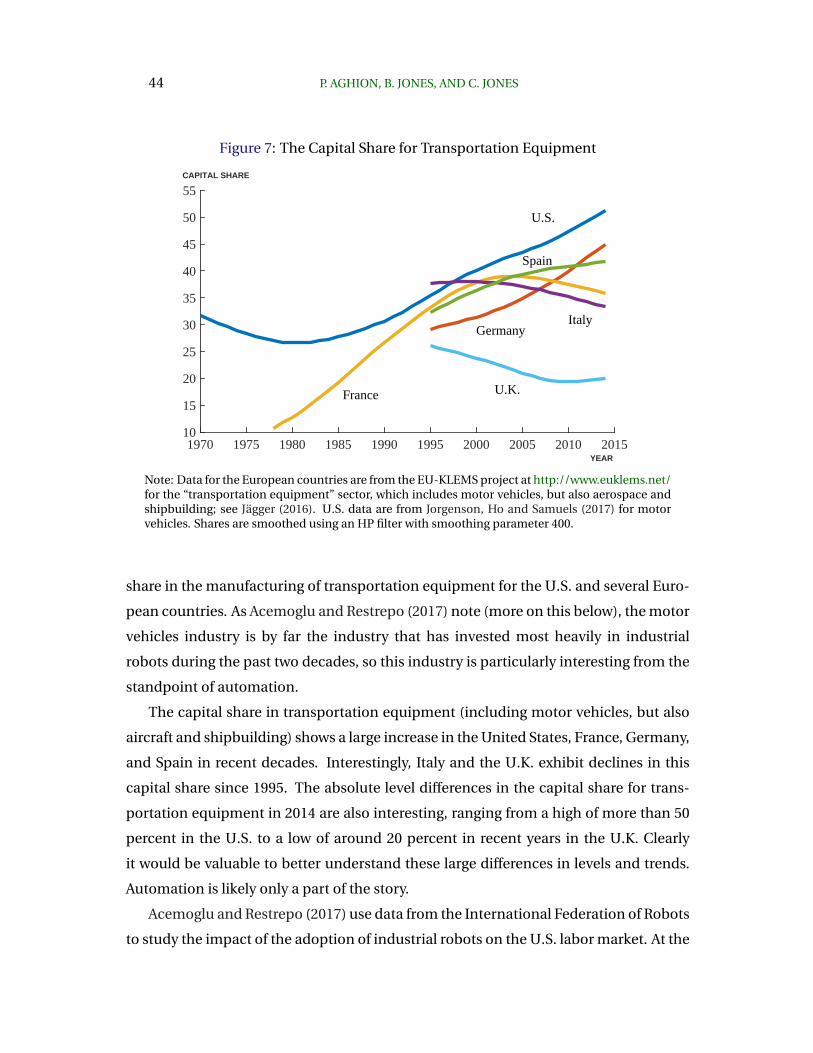
44 P. AGHION, B. JONES, AND C. JONES
Figure 7: The Capital Share for Transportation Equipment
1970 1975 1980 1985 1990 1995 2000 2005 2010 201510
15
20
25
30
35
40
45
50
55
U.S.
France
Germany
U.K.
Spain
Italy
YEAR
CAPITAL SHARE
Note: Data for the European countries are from the EU-KLEMS project at http://www.euklems.net/for the “transportation equipment” sector, which includes motor vehicles, but also aerospace andshipbuilding; see Jagger (2016). U.S. data are from Jorgenson, Ho and Samuels (2017) for motorvehicles. Shares are smoothed using an HP filter with smoothing parameter 400.
share in the manufacturing of transportation equipment for the U.S. and several Euro-
pean countries. As Acemoglu and Restrepo (2017) note (more on this below), the motor
vehicles industry is by far the industry that has invested most heavily in industrial
robots during the past two decades, so this industry is particularly interesting from the
standpoint of automation.
The capital share in transportation equipment (including motor vehicles, but also
aircraft and shipbuilding) shows a large increase in the United States, France, Germany,
and Spain in recent decades. Interestingly, Italy and the U.K. exhibit declines in this
capital share since 1995. The absolute level differences in the capital share for trans-
portation equipment in 2014 are also interesting, ranging from a high of more than 50
percent in the U.S. to a low of around 20 percent in recent years in the U.K. Clearly
it would be valuable to better understand these large differences in levels and trends.
Automation is likely only a part of the story.
Acemoglu and Restrepo (2017) use data from the International Federation of Robots
to study the impact of the adoption of industrial robots on the U.S. labor market. At the
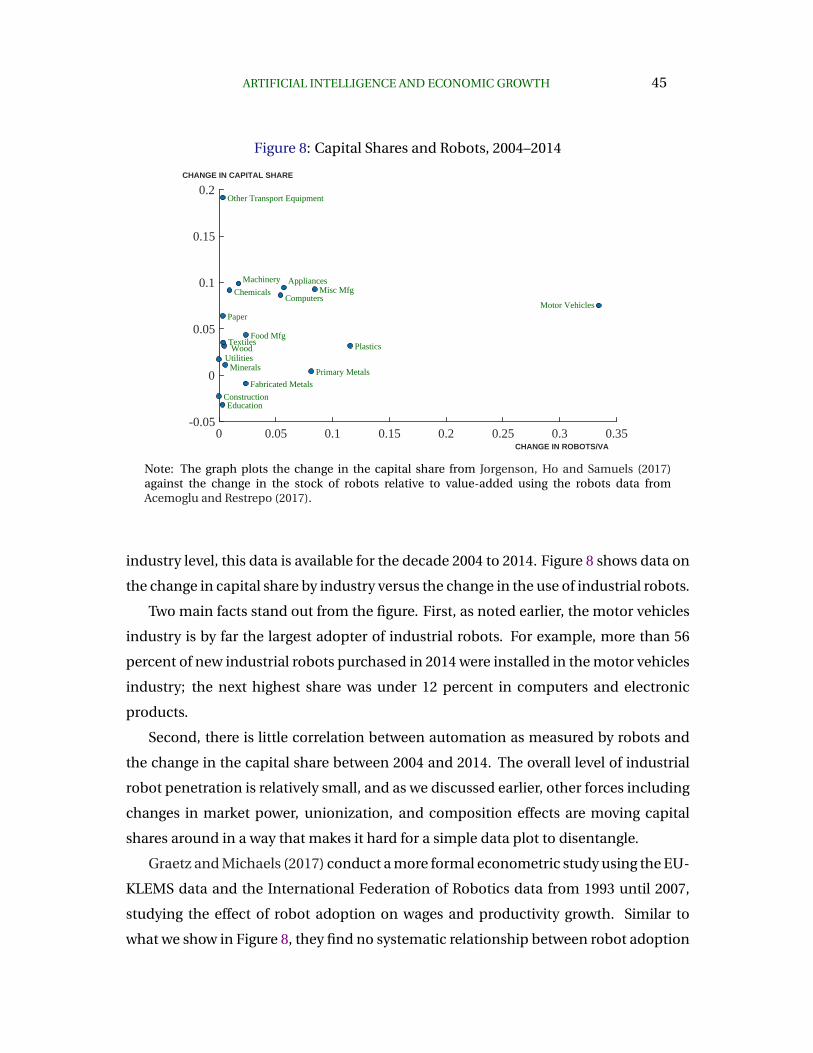
ARTIFICIAL INTELLIGENCE AND ECONOMIC GROWTH 45
Figure 8: Capital Shares and Robots, 2004–2014
0 0.05 0.1 0.15 0.2 0.25 0.3 0.35-0.05
0
0.05
0.1
0.15
0.2
Utilities
Construction
Wood
Minerals Primary Metals
Fabricated Metals
Machinery
Computers
Appliances
Motor Vehicles
Other Transport Equipment
Misc Mfg
Food Mfg Textiles
Paper
Chemicals
Plastics
Education
CHANGE IN ROBOTS/VA
CHANGE IN CAPITAL SHARE
Note: The graph plots the change in the capital share from Jorgenson, Ho and Samuels (2017)against the change in the stock of robots relative to value-added using the robots data fromAcemoglu and Restrepo (2017).
industry level, this data is available for the decade 2004 to 2014. Figure 8 shows data on
the change in capital share by industry versus the change in the use of industrial robots.
Two main facts stand out from the figure. First, as noted earlier, the motor vehicles
industry is by far the largest adopter of industrial robots. For example, more than 56
percent of new industrial robots purchased in 2014 were installed in the motor vehicles
industry; the next highest share was under 12 percent in computers and electronic
products.
Second, there is little correlation between automation as measured by robots and
the change in the capital share between 2004 and 2014. The overall level of industrial
robot penetration is relatively small, and as we discussed earlier, other forces including
changes in market power, unionization, and composition effects are moving capital
shares around in a way that makes it hard for a simple data plot to disentangle.
Graetz and Michaels (2017) conduct a more formal econometric study using the EU-
KLEMS data and the International Federation of Robotics data from 1993 until 2007,
studying the effect of robot adoption on wages and productivity growth. Similar to
what we show in Figure 8, they find no systematic relationship between robot adoption
46 P. AGHION, B. JONES, AND C. JONES
and factor shares. They do suggest that adoption is associated with boosts to labor
productivity.
7. Conclusion
In this paper we discussed potential implications of A.I. for the growth process. We
began by introducing A.I. in the production function of goods and services and tried
to reconcile evolving automation with the observed stability in the capital share and
per capita GDP growth over the last century. Our model, which introduces Baumol’s
“cost disease” insight into Zeira’s model of automation, generates a rich set of possible
outcomes. We thus derived sufficient conditions under which one can get overall bal-
anced growth with a constant capital share that stays well below 100%, even with nearly
complete automation. Essentially, Baumol’s cost disease leads to a decline in the share
of GDP associated with manufacturing or agriculture (once they are automated), but
this is balanced by the increasing fraction of the economy that is automated over time.
The labor share remains substantial because of Baumol’s insight: growth is determined
not by what we are good at but rather by what is essential and yet hard to improve. We
also saw how this model can generate a prolonged period with high capital share and
relatively low aggregate economic growth while automation keeps pushing ahead.
Next, we speculated on the effects of introducing A.I. in the production technology
for new ideas. A.I. can potentially increase growth, either temporarily or permanently,
depending on precisely how it is introduced. It is possible that ongoing automation can
obviate the role of population growth in generating exponential growth as A.I. increas-
ingly replaces people in generating ideas. Notably, in this paper, we’ve taken automa-
tion to be exogenous and the incentives for introducing A.I. in various places clearly
can have first order effects. Exploring the details of endogenous automation and A.I. in
this setup is a crucial direction for further research.,
We then discussed the (theoretical) possibility that A.I. could generate some form
of a singularity, perhaps even leading the economy to achieve infinite income in finite
time. If the elasticity of substitution in combining tasks is less than one, this seems to
require that all tasks be automated. But with Cobb-Douglas production, a singularity
could occur even with less than full automation because the nonrivalry of knowledge
ARTIFICIAL INTELLIGENCE AND ECONOMIC GROWTH 47
gives rise to increasing returns. Nevertheless, here too the Baumol theme remains
relevant: even if many tasks are automated, growth may remain limited due to areas
that remain essential yet are hard to improve. Thus in the Appendix we show that if
some steps in the innovation process require human R&D, then super A.I. may end
up slowing or even ending growth by exacerbating business-stealing which in turn
discourages human investments in innovation. Such possibilities, as well as other im-
plications of “super - A.I.” (for example for cross-country convergence and property
right protection), remain promising directions for future research.
The paper next considered how firms may influence, and be influenced by, the
advance of artificial intelligence, with further implications for understanding macroe-
conomic outcomes. We considered diverse issues of market structure, sectoral realloca-
tions, and firms’ organizational structure. Among the insights here we see that A.I. may
in part discourage future innovation by speeding up imitation; similarly, rapid creative
destruction, by limiting the returns to an innovation, may impose its own limit on the
growth process. From an organizational perspective, we also conjectured that while A.I.
should be skill-biased for the economy as a whole, more A.I.-intensive firms are likely
to: (i) outsource a higher fraction of low-occupation tasks to other firms, and; (ii) pay a
higher premium to the low-occupation workers they keep inside the firm.
Finally, we examined sectoral-level evidence regarding the evolution of capital shares
in tandem with automation. Consistent with increases in the aggregate capital share,
the capital share also appears to be rising in many sectors (especially outside services),
which is broadly consistent with an automation story. At the same time, evidence
linking these patterns to specific measures of automation at the sectoral level appears
weak, and overall there are many economic forces at work in the capital share trends.
Developing sharper measures of automation and investigating the role of automation
in the capital share dynamics are additional, important avenues for further research.
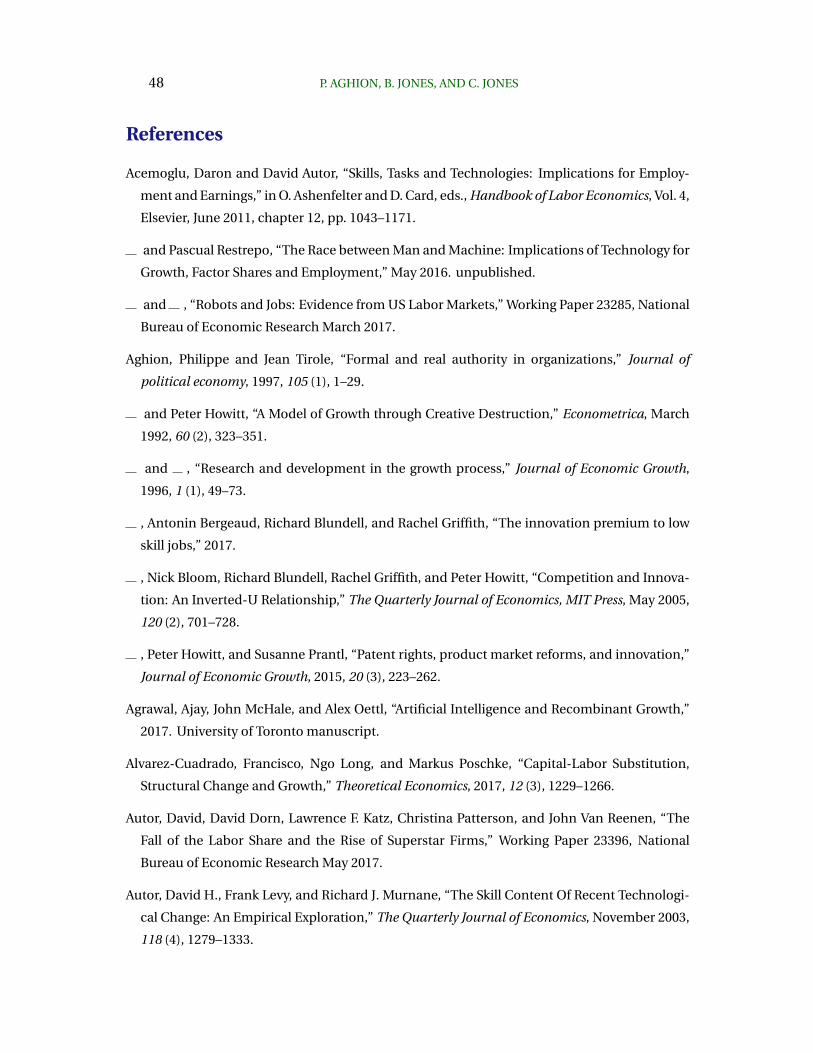
48 P. AGHION, B. JONES, AND C. JONES
References
Acemoglu, Daron and David Autor, “Skills, Tasks and Technologies: Implications for Employ-
ment and Earnings,” in O. Ashenfelter and D. Card, eds., Handbook of Labor Economics, Vol. 4,
Elsevier, June 2011, chapter 12, pp. 1043–1171.
and Pascual Restrepo, “The Race between Man and Machine: Implications of Technology for
Growth, Factor Shares and Employment,” May 2016. unpublished.
and , “Robots and Jobs: Evidence from US Labor Markets,” Working Paper 23285, National
Bureau of Economic Research March 2017.
Aghion, Philippe and Jean Tirole, “Formal and real authority in organizations,” Journal of
political economy, 1997, 105 (1), 1–29.
and Peter Howitt, “A Model of Growth through Creative Destruction,” Econometrica, March
1992, 60 (2), 323–351.
and , “Research and development in the growth process,” Journal of Economic Growth,
1996, 1 (1), 49–73.
, Antonin Bergeaud, Richard Blundell, and Rachel Griffith, “The innovation premium to low
skill jobs,” 2017.
, Nick Bloom, Richard Blundell, Rachel Griffith, and Peter Howitt, “Competition and Innova-
tion: An Inverted-U Relationship,” The Quarterly Journal of Economics, MIT Press, May 2005,
120 (2), 701–728.
, Peter Howitt, and Susanne Prantl, “Patent rights, product market reforms, and innovation,”
Journal of Economic Growth, 2015, 20 (3), 223–262.
Agrawal, Ajay, John McHale, and Alex Oettl, “Artificial Intelligence and Recombinant Growth,”
2017. University of Toronto manuscript.
Alvarez-Cuadrado, Francisco, Ngo Long, and Markus Poschke, “Capital-Labor Substitution,
Structural Change and Growth,” Theoretical Economics, 2017, 12 (3), 1229–1266.
Autor, David, David Dorn, Lawrence F. Katz, Christina Patterson, and John Van Reenen, “The
Fall of the Labor Share and the Rise of Superstar Firms,” Working Paper 23396, National
Bureau of Economic Research May 2017.
Autor, David H., Frank Levy, and Richard J. Murnane, “The Skill Content Of Recent Technologi-
cal Change: An Empirical Exploration,” The Quarterly Journal of Economics, November 2003,
118 (4), 1279–1333.
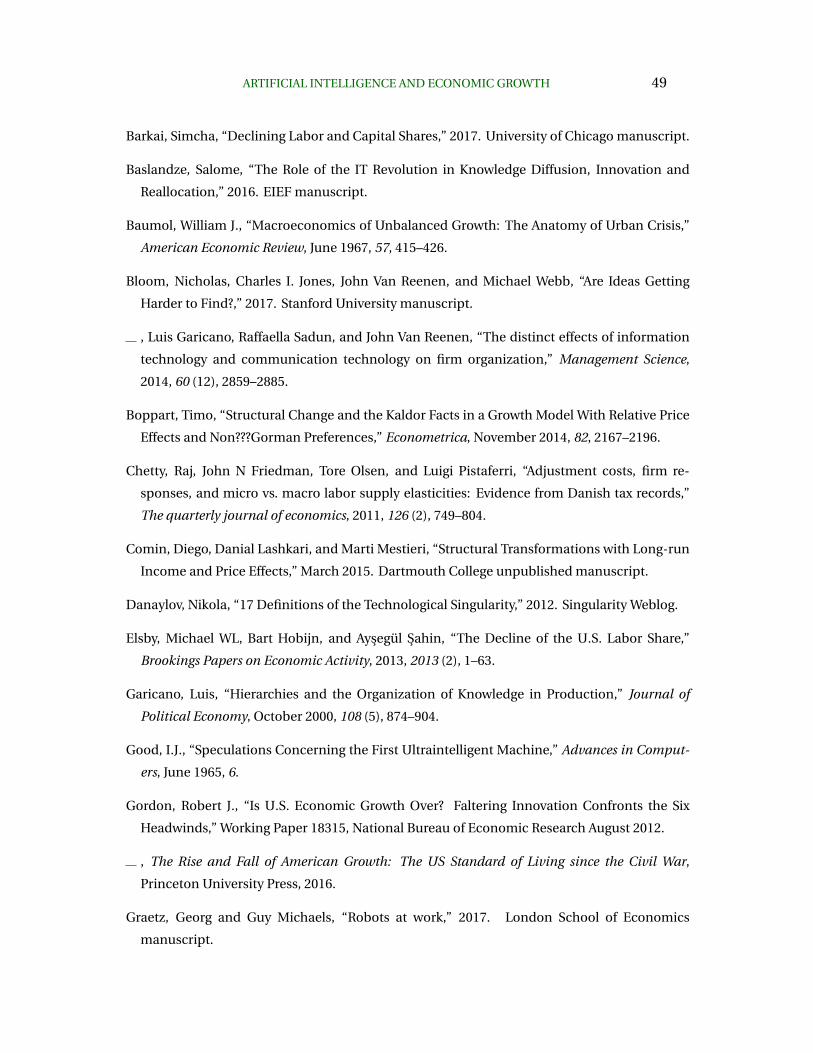
ARTIFICIAL INTELLIGENCE AND ECONOMIC GROWTH 49
Barkai, Simcha, “Declining Labor and Capital Shares,” 2017. University of Chicago manuscript.
Baslandze, Salome, “The Role of the IT Revolution in Knowledge Diffusion, Innovation and
Reallocation,” 2016. EIEF manuscript.
Baumol, William J., “Macroeconomics of Unbalanced Growth: The Anatomy of Urban Crisis,”
American Economic Review, June 1967, 57, 415–426.
Bloom, Nicholas, Charles I. Jones, John Van Reenen, and Michael Webb, “Are Ideas Getting
Harder to Find?,” 2017. Stanford University manuscript.
, Luis Garicano, Raffaella Sadun, and John Van Reenen, “The distinct effects of information
technology and communication technology on firm organization,” Management Science,
2014, 60 (12), 2859–2885.
Boppart, Timo, “Structural Change and the Kaldor Facts in a Growth Model With Relative Price
Effects and Non???Gorman Preferences,” Econometrica, November 2014, 82, 2167–2196.
Chetty, Raj, John N Friedman, Tore Olsen, and Luigi Pistaferri, “Adjustment costs, firm re-
sponses, and micro vs. macro labor supply elasticities: Evidence from Danish tax records,”
The quarterly journal of economics, 2011, 126 (2), 749–804.
Comin, Diego, Danial Lashkari, and Marti Mestieri, “Structural Transformations with Long-run
Income and Price Effects,” March 2015. Dartmouth College unpublished manuscript.
Danaylov, Nikola, “17 Definitions of the Technological Singularity,” 2012. Singularity Weblog.
Elsby, Michael WL, Bart Hobijn, and Aysegul Sahin, “The Decline of the U.S. Labor Share,”
Brookings Papers on Economic Activity, 2013, 2013 (2), 1–63.
Garicano, Luis, “Hierarchies and the Organization of Knowledge in Production,” Journal of
Political Economy, October 2000, 108 (5), 874–904.
Good, I.J., “Speculations Concerning the First Ultraintelligent Machine,” Advances in Comput-
ers, June 1965, 6.
Gordon, Robert J., “Is U.S. Economic Growth Over? Faltering Innovation Confronts the Six
Headwinds,” Working Paper 18315, National Bureau of Economic Research August 2012.
, The Rise and Fall of American Growth: The US Standard of Living since the Civil War,
Princeton University Press, 2016.
Graetz, Georg and Guy Michaels, “Robots at work,” 2017. London School of Economics
manuscript.
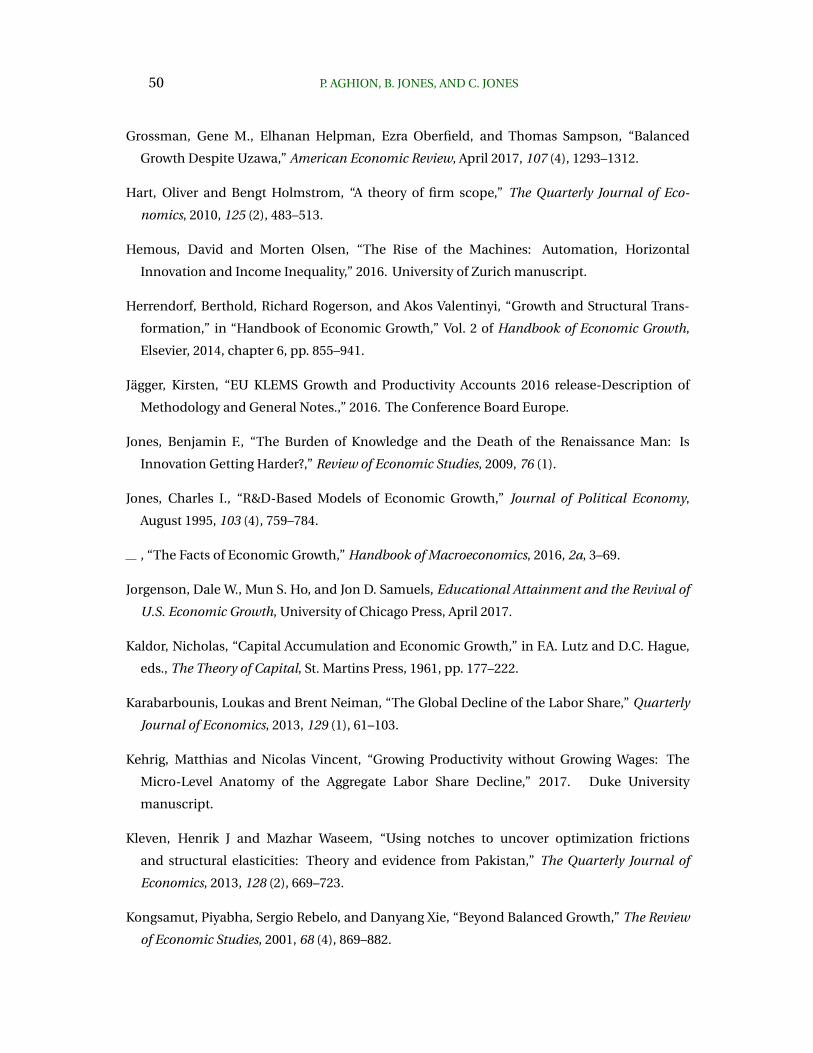
50 P. AGHION, B. JONES, AND C. JONES
Grossman, Gene M., Elhanan Helpman, Ezra Oberfield, and Thomas Sampson, “Balanced
Growth Despite Uzawa,” American Economic Review, April 2017, 107 (4), 1293–1312.
Hart, Oliver and Bengt Holmstrom, “A theory of firm scope,” The Quarterly Journal of Eco-
nomics, 2010, 125 (2), 483–513.
Hemous, David and Morten Olsen, “The Rise of the Machines: Automation, Horizontal
Innovation and Income Inequality,” 2016. University of Zurich manuscript.
Herrendorf, Berthold, Richard Rogerson, and Akos Valentinyi, “Growth and Structural Trans-
formation,” in “Handbook of Economic Growth,” Vol. 2 of Handbook of Economic Growth,
Elsevier, 2014, chapter 6, pp. 855–941.
Jagger, Kirsten, “EU KLEMS Growth and Productivity Accounts 2016 release-Description of
Methodology and General Notes.,” 2016. The Conference Board Europe.
Jones, Benjamin F., “The Burden of Knowledge and the Death of the Renaissance Man: Is
Innovation Getting Harder?,” Review of Economic Studies, 2009, 76 (1).
Jones, Charles I., “R&D-Based Models of Economic Growth,” Journal of Political Economy,
August 1995, 103 (4), 759–784.
, “The Facts of Economic Growth,” Handbook of Macroeconomics, 2016, 2a, 3–69.
Jorgenson, Dale W., Mun S. Ho, and Jon D. Samuels, Educational Attainment and the Revival of
U.S. Economic Growth, University of Chicago Press, April 2017.
Kaldor, Nicholas, “Capital Accumulation and Economic Growth,” in F.A. Lutz and D.C. Hague,
eds., The Theory of Capital, St. Martins Press, 1961, pp. 177–222.
Karabarbounis, Loukas and Brent Neiman, “The Global Decline of the Labor Share,” Quarterly
Journal of Economics, 2013, 129 (1), 61–103.
Kehrig, Matthias and Nicolas Vincent, “Growing Productivity without Growing Wages: The
Micro-Level Anatomy of the Aggregate Labor Share Decline,” 2017. Duke University
manuscript.
Kleven, Henrik J and Mazhar Waseem, “Using notches to uncover optimization frictions
and structural elasticities: Theory and evidence from Pakistan,” The Quarterly Journal of
Economics, 2013, 128 (2), 669–723.
Kongsamut, Piyabha, Sergio Rebelo, and Danyang Xie, “Beyond Balanced Growth,” The Review
of Economic Studies, 2001, 68 (4), 869–882.
ARTIFICIAL INTELLIGENCE AND ECONOMIC GROWTH 51
Kortum, Samuel S., “Research, Patenting, and Technological Change,” Econometrica, 1997, 65
(6), 1389–1419.
Krusell, Per, Lee E Ohanian, Jose-Vıctor Rıos-Rull, and Giovanni L Violante, “Capital-skill
complementarity and inequality: A macroeconomic analysis,” Econometrica, 2000, 68 (5),
1029–1053.
Kurzweil, Ray, The Singularity is Near, New York: Penguin, 2005.
Manuelli, Rodolfo E. and Ananth Seshadri, “Frictionless Technology Diffusion: The Case of
Tractors,” American Economic Review, April 2014, 104 (4), 1368–91.
Ngai, L. Rachel and Christopher A. Pissarides, “Structural Change in a Multisector Model of
Growth,” American Economic Review, March 2007, 97 (1), 429–443.
Nordhaus, William D., “Are We Approaching an Economic Singularity? Information Technology
and the Future of Economic Growth,” Working Paper 21547, National Bureau of Economic
Research September 2015.
Peretto, Pietro F. and John J. Seater, “Factor-eliminating technical change,” Journal of Monetary
Economics, 2013, 60 (4), 459–473.
Romer, Paul M., “Endogenous Technological Change,” Journal of Political Economy, October
1990, 98 (5), S71–S102.
Saez, Emmanuel, “Do taxpayers bunch at kink points?,” American Economic Journal: Economic
Policy, 2010, 2 (3), 180–212.
Solomonoff, R.J., “The Time Scale of Artificial Intelligence: Reflections on Social Effects,”
Human Systems Management, 1985, 5, 149–53.
Stole, Lars and Jeffrey Zwiebel, “Organizational Design and Technology Choice under Intrafirm
Bargaining,” 1996, 86 (1), 195–222.
Tirole, Jean, Economics for the Common Good, Princeton University Press, 2017.
Vinge, Vernor, “The Coming Technological Singularity: How to Survive in the Post-Human Era,”
Vision-21: Interdisciplinary Science and Engineering in the Era of Cyberspace, 1993, pp. 11–22.
Webb, Michael, Greg Thornton, Sean Legassick, and Mustafa Suleyman, “What Does Artificial
Intelligence Do?,” 2017. Stanford University manuscript.
Weitzman, Martin L., “Recombinant Growth,” Quarterly Journal of Economics, May 1998, 113,
331–360.
52 P. AGHION, B. JONES, AND C. JONES
Yudkowsky, Eliezer, “Intelligence Explosion Microeconomics,” 2013. Technical report 2013-1.
Zeira, Joseph, “Workers, Machines, And Economic Growth,” Quarterly Journal of Economics,
November 1998, 113 (4), 1091–1117.
A. Appendix: A.I. in a Schumpeterian model with creative
destruction
In this Appendix we describe and model a situation in which super-intelligence (or
”super A.I.”) may kill growth because it exacerbates creative destruction and thereby
discourages any human investment into R&D. We first lay out a basic version of the
Schumpeterian growth model. We then extend the model to introduce A.I. in the inno-
vation technology.
A.1 Basics
Time is continuous and individuals are infinitely lived, there is a mass L of individuals
who can decide between working in research or in production. Final output is pro-
duced according to:
y = Axα,
where x is the flow of intermediate input and A is a productivity parameter measuring
the quality of intermediate input x. Each innovation results in a new technology for
producing final output and a new intermediate good which to implement the new
technology. It augments current productivity by the multiplicative factor γ > 1 : At+1 =
γAt. Innovations in turn are the (random) outcome of research, and are assumed to
arrive discretely with Poisson rate λ.n, where n is the current flow of research.
In a steady state the allocation of labor between research and manufacturing re-
mains constant over time, and is determined by the arbitrage equation
ω = λγv, (A)
where the LHS of (A) is the productivity-adjusted wage rate ω = wA , which a worker
earns by working in the manufacturing sector; and λγv is the expected reward from
ARTIFICIAL INTELLIGENCE AND ECONOMIC GROWTH 53
investing one unit flow of labor in research. The productivity-adjusted value v of an
innovation is determined by the Bellman equation
rv = π(ω)− λnv,
where π(ω) denotes the productivity-adjusted flow of monopoly profits accruing to a
successful innovator and where the term (−λnv) corresponds to the capital loss in-
volved in being replaced by a subsequent innovator.
The above arbitrage equation, which can be reexpressed as
ω = λγπ(ω)
r + λn, (A)
together with the labor market-clearing equation
x(ω) + n = L, (L)
where x(ω) is the manufacturing demand for labor, jointly determine the steady-state
amount of research n as a function of the parameters λ, γ, L, r, α.
The average growth rate is equal to the size of each step, ln γ, times the average
number of innovations per unit of time, λn : i.e., g = λn ln γ.
A.2 A Schumpeterian model with A.I.
As before, there are L workers who can engage either in production of existing in-
termediate goods or in research aimed at discovering new intermediate goods. Each
intermediate good is linked to a particular GPT. We follow Helpman and Trajtenberg
(1994) in supposing that before any of the intermediate goods associated with GPT can
be used profitably in the final goods sector, some minimal number of them must be
available. We lose nothing essential by supposing that this minimal number is one.
Once the good has been invented, its discoverer profits from a patent on its exclusive
use in production, exactly as in the basic Schumpeterian model reviewed earlier.
Thus the difference between this model and the above basic model is that now the
discovery of a new generation of intermediate goods comes in two stages. First a new
GPT must come, and then the intermediate good must be invented that implements
54 P. AGHION, B. JONES, AND C. JONES
that GPT. Neither can come before the other. You need to see the GPT before knowing
what sort of good will implement it, and people need to see the previous GPT in action
before anyone can think of a new one. For simplicity we assume that no one directs
R&D toward the discovery of a GPT. Instead, the discovery arrives as a serendipitous
by-product of the collective experience of using the previous one.
Thus the economy will pass through a sequence of cycles, each having two phases.
GPTi arrives at time Ti. At that time the economy enters phase 1 of the ith cycle. During
phase 1, the amount n of labor is devoted to research. Phase 2 begins at time Ti + ∆i
when this research discovers an intermediate good to implement GPTi. During phase
2 all labor is allocated to manufacturing until GPTi+1 arrives, at which time the next
cycle begins.
A steady-state equilibrium is one in which people choose to do the same amount
of research each time the economy is in phase 1, that is, where n is constant from one
GPT to the next. As before, we can solve for the equilibrium value of n using a research-
arbitrage equation and a labor market-equilibrium curve. Let ωj be the wage, and vj
the expected present value of the incumbent intermediate monopolist’s future profits,
when the economy is in phase j, each divided by the productivity parameter A of the
GPT currently in use. In a steady state these productivity-adjusted variables will all be
independent of which GPT is currently in use.
Because research is conducted in phase 1 but pays off when the economy enters
into phase 2 with a productivity parameter raised by the factor γ, the usual arbitrage
condition must hold in order for there to be a positive level of research in the economy
ω1 = λγv2
Suppose that once we are in phase 2, the new GPT is delivered by a Poisson process with
a constant arrival rate equal to µ. Then the value of v2 is determined by the Bellman
equation
rv2 = π(ω2) + µ(v1 − v2)
By analogous reasoning, we have
rv1 = π(ω1)− λnv1.
ARTIFICIAL INTELLIGENCE AND ECONOMIC GROWTH 55
Combining the above equations yields the research-arbitrage equation
ω1 = λγ
[π(ω2) +
µπ(ω1)
r + λn
]/[r + µ]
Because no one does research in phase 2, we know that the value of ω2 is determined
independently of research, by the market-clearing condition L = x(ω2). Thus we can
take this value as given and regard the last equation as determining ω1 as a function
of n. The value of n is determined, as usual, by this equation together with the labor-
market equation
L− n = x(ω1)
The average growth rate will be the frequency of innovations times the size ln γ, for
exactly the same reason as in the basic model. The frequency, however, is determined
a little differently than before because the economy must pass through two phases. An
innovation is implemented each time a full cycle is completed. The frequency with
which this happens is the inverse of the expected length of a complete cycle. This in
turn is just the expected length of phase 1 plus the expected length of phase 2:
1/λn+ 1/µ =µ+ λn
µλn.
Thus we have the growth equation
g = ln γµλn
µ+ λn,
where n satisfies:
f(L− n) = λγ
[f(L) +
µπ(f(L− n))
r + λn
]/[r + µ]
with
f(.) = x−1(.)
is a decreasing function of its argument.
We are interested in the effect of µ on g, and in particular by what happens when
µ −→∞ as a result of A.I. in the production of ideas. Obviously, n −→ 0 when µ −→∞.
56 P. AGHION, B. JONES, AND C. JONES
Thus E = 1/λn+ 1/µ −→∞ and therefore
g = ln γ.1
E−→ 0.
In other words, we have described and modeled a situation where super-intelligence
exacerbates creative destruction to a point that all human investments in to R&D are
being deterred and as a result growth tapers off. However, two remarks can be made at
this stage:
Remark 1: Here, we have assumed that the second innovation stage requires human
research only. If instead A.I. allowed that stage to also be performed by machines, then
A.I. will no longer taper off and can again become explosive as in our core analysis.
Remark 2: We took automation to be completely exogenous and costless. But sup-
pose instead that it costs money to make µ increase to infinity: then, if creative destruc-
tion grows without limit as in our analysis above, the incentive to pay for increasing µ
will go down to zero since the complementary human R&D for the stage-two innova-
tion is also going to zero. But this goes against having µ −→ ∞, and therefore against
having A.I. kill the growth process. 19
19Of course one could counter-argue that super A.I. becomes increasingly costless in generating newinnovation, in which case µ would again go to infinity and growth would again go down to zero.


![Artificial Intelligence · Artificial Intelligence 2016-2017 Introduction [5] Artificial Brain: can machines think? Artificial Intelligence 2016-2017 Introduction [6] ... Deep Blue](https://img.pdfslide.us/doc/110x75/5f0538917e708231d411e192/artificial-intelligence-artificial-intelligence-2016-2017-introduction-5-artificial.jpg)