Embed Size (px)
Citation preview

July 2001 / Vol. 51 No. 7 • BioScience 545
Articles
Recognition of the concept of scale occurred rapidlyin the 1980s, but the concept itself is far older. The last
quarter of the 20th century witnessed major changes in thescience of ecology, including increases in skill and rigor in thedesign of field experiments, the growth of mathematicallybased theory, computer-mediated advances in analytical ca-pacity, and the accelerating capacity to acquire and retrievedata. These changes were accompanied by growing recogni-tion of the problem of scale (Wiens 1989, Steele 1991, Levin1992). The problem has three components. First, pressingproblems in ecology often exist at the scale of decades and largeecosystems. Second, most variables can only be measureddirectly in small areas, over short periods of time. Relativelyfew variables, such as ocean color, can be measured at fine res-olution over large areas via remote sensing. Most variables, andin particular most rates, can be measured only on site. Third,patterns measured at small scales do not necessarily hold atlarger scales; nor do processes prevailing at small scalesnecessarily prevail at large scales. Consequently, pressingproblems in ecology cannot be automatically addressed byscaling locally measured variables directly to larger areas andlonger times.
The classic example of the problem of scale is loss of bio-diversity. The causes of species extinction occur at the scaleof ecosystems, whereas measurements are of necessity con-fined to smaller areas. Yet no biologist would try to addressthe problem by direct extrapolation from local samples, be-cause it is well known that species number does not scale di-rectly with area. It has become increasingly clear that thesame principle applies to any ecological problem.
An example is research on recruitment variability in a ma-jor fishery such as that of cod, Gadus morhua (Figure 1).This fishery extended through the entire northeastern con-tinental shelf of North America (Figure 1a) for centuries,until its collapse in the early 1990s.After the collapse, eggs andfirst-year juveniles were confined to coastal areas, where sur-vival depends on suitable habitat. Habitat surveys can bemade at the scale of coves or sections of coast (Figure 1b), butdirect measurements of absolute density in relation to habi-tat can be made only by seine hauls in areas of a few hundredsquare meters (Figure 1c). Even within these small areas,habitat is highly heterogeneous (Figure 1d). Consequently, theratio of area of interest (Figure 1a, b) to area surveyed
(Figure 1c, d) cannot be used to estimate numbers andsurvival prospects at larger scales from direct measurementsat smaller scales.
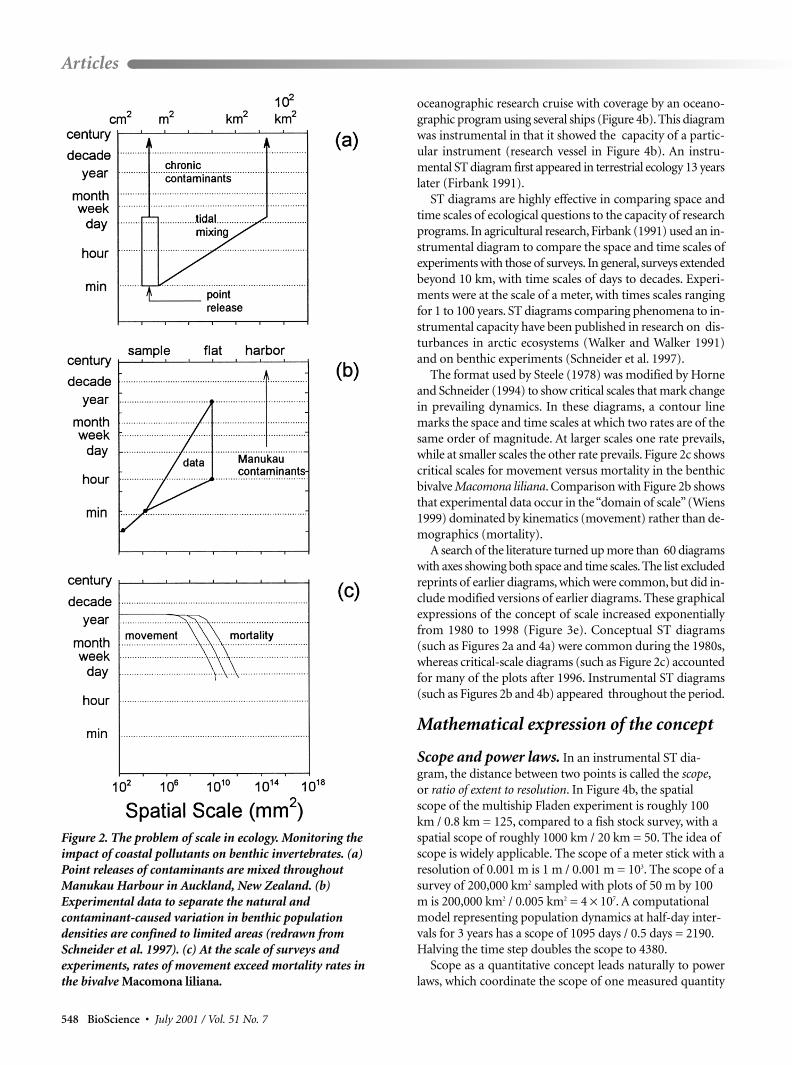
The three components of the problem of scale are illustratedin diagrammatic form (Figure 2) for the problem of moni-toring pollution-induced variation in benthic invertebratenumbers against a background of natural variation inManukau Harbour, New Zealand (Thrush et al. 1997).Pollutants are dumped at point sources (lower-left part ofFigure 2a), but continued dumping and tidal mixing extendthe problem to larger scales (upper-right corner, Figure 2a).Experiments and surveys to identify natural sources ofvariation in benthic populations are confined by costs toareas smaller than the scale of the problem (Figure 2b). Atthese smaller scales, movement rates exceed mortality rates(Figure 2c); hence an increase in mortality is difficult todetect because of organism movement across the bound-aries of monitoring sites.
The concept of scale is now widely recognized as a centralconcern in ecology. How rapidly did this occur? What are theprospects that scaling concepts will lead to theoretical unifi-cation in ecology? This article reports on these questions ata convenient point in time, the end of the 20th century.
Definition of scaleThe word scale has multiple meanings, contributing to its am-biguous usage in the ecological literature. The Oxford EnglishDictionary (Simpson and Weiner 1989) distinguishes 15 dif-ferent meanings arising from two different roots. The Old
David Schneider (e-mail: [email protected]) is a profes-
sor at Ocean Sciences Centre, Memorial University of Newfoundland,
St. John’s, Newfoundland, Canada A1B 3X9. © 2001 American In-
stitute of Biological Sciences.
The Rise of the Conceptof Scale in EcologyDAVID C. SCHNEIDER
THE CONCEPT OF SCALE IS EVOLVING
FROM VERBAL EXPRESSION TO
QUANTITATIVE EXPRESSION

546 BioScience • July 2001 / Vol. 51 No. 7
Articles
Norse root in skal (bowl) gives rise to fish scales, the scales ofjustice, and hence, by extension, measurement by means ofpairwise comparison of objects. Using an old-fashioned scale,one can assign a mass of 1 g to a beetle that balances a 1-g stan-dard mass. The Latin root in scala (ladder) gives rise to mu-sical scales, scaling a wall, and, by extension, measuring alength by counting steps or subdivisions. Using a ladderknown to be 2 m in height, one can assign a height of half aladder (1 m) to a bush.
In ecology, the word scale has acquired several commontechnical meanings. This diversity in acquired technical de-finition, added to the diversity in origin of the word, worksagainst attempts at standard definition.A more productive ap-proach is simply to ask that the word be used with an ap-propriate qualifier.
Verbal expression of the concept:Paradigm shift or sustained growth?The research literature suggests that recognition of theconcept of scale occurred suddenly in the 1980s:
[1988] Kuhn’s concept of a paradigm shift is a usefulway to interpret the annual meeting of the ESA[Ecological Society of America].... Every symposium orsession I attended featured, included, or wasstructured by the concepts of scale and spatial patterns.I left feeling I had observed one of those rare creaturesof the intellectual bestiary, a paradigm shift (Golley1989, p. 65).
[1997] We can no longer...cling to the belief that thescale on which we view systems does not affect what wesee.... This is quite a different way of viewing the worldthan that which was in vogue a decade ago, and it is byno means yet widely embraced by everyone (Wiens1999, p. 371).
Recognition of the importance of scale has been rapid,based on how frequently the word scale appears in the eco-logical research literature. In a digital version of the associatedjournals Ecology and Ecological Monographs, the term spatialscale made its first appearance in the early 1970s (Marten 1972,Wiens 1973). The term appears with increasing frequency inthe late 1970s (Figure 3a). In the 1980s, frequency of ap-pearance grew exponentially, at a pace 10 times the rate ofgrowth in number of articles per yearly volume (Figure 3a).During that decade, the term appears to have been most com-monly used in these two journals to qualify a result as beingfound at a particular spatial scale. The digital archive ends at1996, so analysis was extended by reading abstracts. Fre-quency of use in abstracts (Figure 3b) paralleled that in thetext, with some indication of decrease after 1996. The conceptof scale currently is explicitly used in about 15% of articleseach year in the two publications.
The sudden and exponential increase in explicit treatmentof the concept of scale also occurred within a relatively old andspecialized research area, the pelagic ecology of seabirds. Ina comprehensive reference list on the topic (Schneider 1991),the two oldest articles were Collins (1884) and Murphy(1914). Publications that include reference to more than onespace or time scale first appeared in 1980 (Schneider 1994b).The growth rate was exponential, at 18.9% yr–1 from 1980to 1990.
In terrestrial ecology, hierarchical levels are used to ex-press the concept of scale (Allen and Starr 1982). The conceptof organizational level in biology (cell, tissue, organ, organ-ism) was initially extended to populations and communitiesin the second edition of Odum’s ecology text (1959). The con-cept of hierarchy in ecology (Allen and Starr 1982) refers toa focal level constrained by large-scale dynamics. O’Neill etal. (1986) developed the idea that levels beyond that of the or-ganism arise during the course of energy dissipation in ecosys-tems. Because the idea that “scale matters” is central to hier-archy theory in ecology, the increasing frequency of
The type of measurement scale (Stevens 1946) distin-guishes variables quantified on a nominal scale (pres-ence/absence), an ordinal scale (ranks), an intervalscale (equal steps, such as degrees centigrade), and a ra-tio scale (equal steps and known zero, such as degreeskelvin).
Cartographic scale is the ratio of the distance on amap to the distance on the ground. A meter-wide mapof the world has a scale of about 1:39,000,000.
Scale refers to the extent relative to the grain of a vari-able indexed by time or space (Wiens 1989, Schneider1994a). Variables so indexed have a minimum resolv-able area or time period (grain or inner scale) withinsome range of measurement (extent or outer scale). Forexample, a tree-coring device resolves annual changesover periods of thousands of years.
In multiscale analysis, the variance in a measuredquantity, or the relation of two measured quantities, iscomputed with a series of different scales. This is ac-complished by systematically changing either the sep-aration (lag) between measurements or the averaginginterval (window size) for contiguous measurements(Milne 1997).
Ecological scaling (Calder 1983, Peters 1983) refers tothe use of power laws that scale a variable (e.g., respi-ration) to body size, usually according to a nonintegralexponent. Respiration typically scales as mass0.75; hence,a doubling in body size increases oxygen consumptionby 20.75 = 1.7, rather than by a factor of 2.
Powell (1989) defined scale as the distance beforesome quantity of interest changes.
Common technical definitions of scale

publication on the topic measures the rise inrecognition of the concept of scale. A com-prehensive list of 231 articles shows that thepublication rate grew exponentially from 1969to 1990 (Figure 3c). If the 63 nonecologicalpublications in the list are removed, publicationrate grew exponentially from 1973 through1991, at 18.2% yr–1.
The use of “hierarchy theory” and “spatialscale” indicates rapid recognition in the late1970s and early 1980s, but the concept of scalein ecology is far older. For example, Johnstone([1908] 1977) questioned whether catches froma limited area could be used to calculate the den-sity of organisms for the entire Irish Sea. Greig-Smith (1952) quantified spatial patterns inplants and their environment at multiple scales.In a list of books and articles that use multiscaleconcepts (Schneider 1994a), publication oc-curs throughout the 20th century, with expo-nential growth in the 40-year period after WorldWar II (Figure 3d). The drop after 1991 re-flects the completion of the reference list inearly 1992, with a few articles added duringmanuscript revisions in 1992 and 1993.
The increase in recognition of the conceptof scale depends on how the search is defined.Sudden appearance followed by exponentialgrowth was found when the term spatial scaleor the concept of hierarchy theory was con-sidered. Sustained growth over nearly a century(interrupted only by World War II) was foundin a reference list from a review that aimed atcomprehensive coverage of the concept of scalein ecology, regardless of whether the word scalewas used (Figure 3d).
Graphical expression of theconcept: Space–time diagramsFigures with both space and time scales as axesfirst appeared in the ecological literature in1978, when John Steele modified a diagramused in physical oceanography (Stommel 1963).Stommel’s three-dimensional diagram showedvariability in sea level against both space andtime scales. Steele used Stommel’s space andtime axes to draw two different diagrams.Steele’s first diagram showed the space andtime scales of patchiness of phytoplankton,zooplankton, and fish (Figure 4a). Thisspace–time (ST) diagram was conceptual,showing the scales of named phenomena. Aconceptual ST diagram first appeared in ter-restrial ecology 5 years later (Delcourt et al.1983). Steele’s second diagram compared thetime and space scales of coverage by a single
July 2001 / Vol. 51 No. 7 • BioScience 547
Articles
Figure 1. The problem of scale in ecology. Management of cod, Gadusmorhua. (a) Variation in catch rates at the geographic scale of stocks in thenorthwest Atlantic Ocean. (b) Juvenile habitat variation at the scale ofaerial surveys. (c) Habitat variation at the scale of direct measurement ofjuvenile cod density in 880 m2 seine hauls. (d) Habitat variation at the scaleof experimental investigation of juvenile survival.
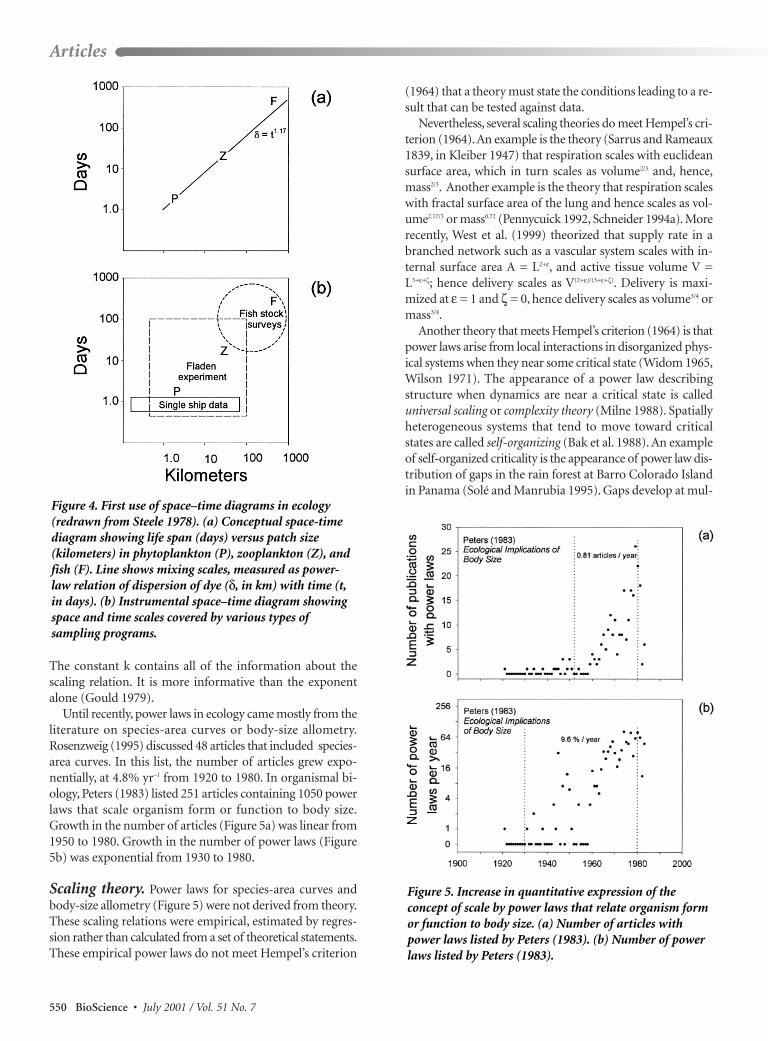
oceanographic research cruise with coverage by an oceano-graphic program using several ships (Figure 4b). This diagramwas instrumental in that it showed the capacity of a partic-ular instrument (research vessel in Figure 4b). An instru-mental ST diagram first appeared in terrestrial ecology 13 yearslater (Firbank 1991).
ST diagrams are highly effective in comparing space andtime scales of ecological questions to the capacity of researchprograms. In agricultural research, Firbank (1991) used an in-strumental diagram to compare the space and time scales ofexperiments with those of surveys. In general, surveys extendedbeyond 10 km, with time scales of days to decades. Experi-ments were at the scale of a meter, with times scales rangingfor 1 to 100 years. ST diagrams comparing phenomena to in-strumental capacity have been published in research on dis-turbances in arctic ecosystems (Walker and Walker 1991)and on benthic experiments (Schneider et al. 1997).
The format used by Steele (1978) was modified by Horneand Schneider (1994) to show critical scales that mark changein prevailing dynamics. In these diagrams, a contour linemarks the space and time scales at which two rates are of thesame order of magnitude. At larger scales one rate prevails,while at smaller scales the other rate prevails. Figure 2c showscritical scales for movement versus mortality in the benthicbivalve Macomona liliana. Comparison with Figure 2b showsthat experimental data occur in the “domain of scale”(Wiens1999) dominated by kinematics (movement) rather than de-mographics (mortality).
A search of the literature turned up more than 60 diagramswith axes showing both space and time scales. The list excludedreprints of earlier diagrams, which were common, but did in-clude modified versions of earlier diagrams. These graphicalexpressions of the concept of scale increased exponentiallyfrom 1980 to 1998 (Figure 3e). Conceptual ST diagrams(such as Figures 2a and 4a) were common during the 1980s,whereas critical-scale diagrams (such as Figure 2c) accountedfor many of the plots after 1996. Instrumental ST diagrams(such as Figures 2b and 4b) appeared throughout the period.
Mathematical expression of the concept
Scope and power laws. In an instrumental ST dia-gram, the distance between two points is called the scope,or ratio of extent to resolution. In Figure 4b, the spatialscope of the multiship Fladen experiment is roughly 100km / 0.8 km = 125, compared to a fish stock survey, with aspatial scope of roughly 1000 km / 20 km = 50. The idea ofscope is widely applicable. The scope of a meter stick with aresolution of 0.001 m is 1 m / 0.001 m = 103. The scope of asurvey of 200,000 km2 sampled with plots of 50 m by 100m is 200,000 km2 / 0.005 km2 = 4 × 10⁷. A computationalmodel representing population dynamics at half-day inter-vals for 3 years has a scope of 1095 days / 0.5 days = 2190.Halving the time step doubles the scope to 4380.
Scope as a quantitative concept leads naturally to powerlaws, which coordinate the scope of one measured quantity
Articles
548 BioScience • July 2001 / Vol. 51 No. 7
Figure 2. The problem of scale in ecology. Monitoring theimpact of coastal pollutants on benthic invertebrates. (a)Point releases of contaminants are mixed throughoutManukau Harbour in Auckland, New Zealand. (b)Experimental data to separate the natural andcontaminant-caused variation in benthic populationdensities are confined to limited areas (redrawn fromSchneider et al. 1997). (c) At the scale of surveys andexperiments, rates of movement exceed mortality rates inthe bivalve Macomona liliana.

with another according to an exponent (Schneider 1998).For isometric scaling, the exponent is, by definition, unity. Anexample is the scaling of volume to mass in large and smallorganisms:
This scaling relation applies to organisms that have the samespecific gravity as water and are close to neutrallybuoyant.
For euclidean scaling, the exponent is an integeror ratio of integers. The scaling of volume to lengthfor a euclidean object is:
Organisms are often treated as euclidean in shape,but in fact they have convoluted or “fractal” (Man-delbrot 1977) surfaces and inhabit convoluted orfractal environments (Burrough 1981). For fractalscaling, the exponent relating the scope of onequantity to measurement is not an integer:
The measured area of a lung depends in a system-atic way on the size of the boxes used. Doubling thebox size decreases the measurement of lung area by2-0.17 = 89% because detail is lost as the box size in-creases. The fractal dimension of the lung is Df = 2–(–0.17) = 2.17. The surface is more convolutedthan a flat surface (D = 2), but not so convolutedas to completely fill a volume (D = 3).
Another example of fractal scaling is river length:
The fractal dimension of the river is Df = 1 – (–0.3)= 1.3. It is more convoluted than a line (D = 1) butnot so convoluted as to fill a plane (D = 2).
Power laws, which are common in biology, usu-ally appear in forms that hide the underlying scopes.A power law equates one scope to another accord-ing to an exponent β:
This is shortened to
then further shortened to the more familiar form
July 2001 / Vol. 51 No. 7 • BioScience 549
Articles
Figure 3. Increasing use of the concept of scale in ecology. Dotted linesbracket periods in which growth rate was exponential. (a) Articles withthe term spatial scale in the text. (b) Articles with the word scale in theabstract. (c) Articles and books on hierarchy theory. (d) Articles andbooks that consider more than one space or time scale, whether or notthe word scale is used. (e) Graphical expression of the concept of scale,as measured by publication of space-time diagrams with axes as shown.
..
.
.
The constant k contains all of the information about thescaling relation. It is more informative than the exponentalone (Gould 1979).
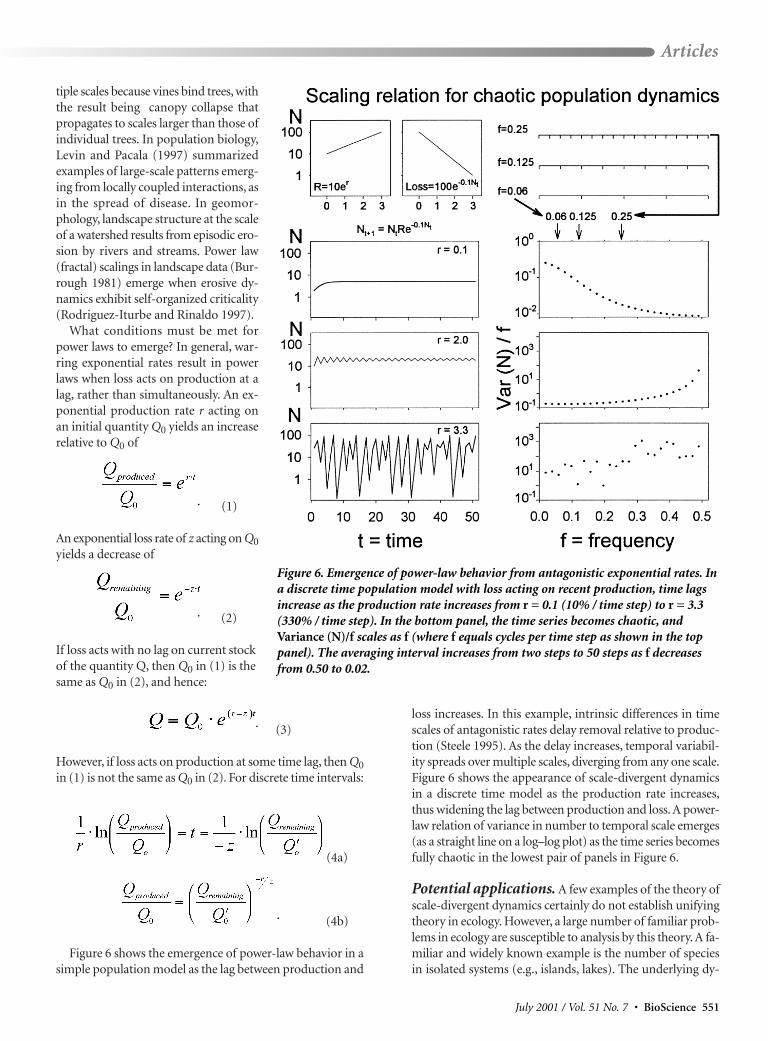
Until recently, power laws in ecology came mostly from theliterature on species-area curves or body-size allometry.Rosenzweig (1995) discussed 48 articles that included species-area curves. In this list, the number of articles grew expo-nentially, at 4.8% yr–1 from 1920 to 1980. In organismal bi-ology, Peters (1983) listed 251 articles containing 1050 powerlaws that scale organism form or function to body size.Growth in the number of articles (Figure 5a) was linear from1950 to 1980. Growth in the number of power laws (Figure5b) was exponential from 1930 to 1980.
Scaling theory. Power laws for species-area curves andbody-size allometry (Figure 5) were not derived from theory.These scaling relations were empirical, estimated by regres-sion rather than calculated from a set of theoretical statements.These empirical power laws do not meet Hempel’s criterion
(1964) that a theory must state the conditions leading to a re-sult that can be tested against data.
Nevertheless, several scaling theories do meet Hempel’s cri-terion (1964). An example is the theory (Sarrus and Rameaux1839, in Kleiber 1947) that respiration scales with euclideansurface area, which in turn scales as volume2/3 and, hence,mass2/3. Another example is the theory that respiration scaleswith fractal surface area of the lung and hence scales as vol-ume2.17/3 or mass0.72 (Pennycuick 1992, Schneider 1994a). Morerecently, West et al. (1999) theorized that supply rate in abranched network such as a vascular system scales with in-ternal surface area A = L2+ε, and active tissue volume V =L3+ε+ζ; hence delivery scales as V(2+ε)/(3+ε+ζ). Delivery is maxi-mized at ε = 1 and ζ = 0, hence delivery scales as volume3/4 ormass3/4.
Another theory that meets Hempel’s criterion (1964) is thatpower laws arise from local interactions in disorganized phys-ical systems when they near some critical state (Widom 1965,Wilson 1971). The appearance of a power law describingstructure when dynamics are near a critical state is calleduniversal scaling or complexity theory (Milne 1988). Spatiallyheterogeneous systems that tend to move toward criticalstates are called self-organizing (Bak et al. 1988). An exampleof self-organized criticality is the appearance of power law dis-tribution of gaps in the rain forest at Barro Colorado Islandin Panama (Solé and Manrubia 1995). Gaps develop at mul-
550 BioScience • July 2001 / Vol. 51 No. 7
Articles
Figure 5. Increase in quantitative expression of theconcept of scale by power laws that relate organism formor function to body size. (a) Number of articles withpower laws listed by Peters (1983). (b) Number of powerlaws listed by Peters (1983).
Figure 4. First use of space–time diagrams in ecology(redrawn from Steele 1978). (a) Conceptual space-timediagram showing life span (days) versus patch size(kilometers) in phytoplankton (P), zooplankton (Z), andfish (F). Line shows mixing scales, measured as power-law relation of dispersion of dye (δ, in km) with time (t,in days). (b) Instrumental space–time diagram showingspace and time scales covered by various types ofsampling programs.
tiple scales because vines bind trees, withthe result being canopy collapse thatpropagates to scales larger than those ofindividual trees. In population biology,Levin and Pacala (1997) summarizedexamples of large-scale patterns emerg-ing from locally coupled interactions, asin the spread of disease. In geomor-phology, landscape structure at the scaleof a watershed results from episodic ero-sion by rivers and streams. Power law(fractal) scalings in landscape data (Bur-rough 1981) emerge when erosive dy-namics exhibit self-organized criticality(Rodriguez-Iturbe and Rinaldo 1997).
What conditions must be met forpower laws to emerge? In general, war-ring exponential rates result in powerlaws when loss acts on production at alag, rather than simultaneously. An ex-ponential production rate r acting onan initial quantity Q0 yields an increaserelative to Q0 of
(1)
An exponential loss rate of z acting on Q0yields a decrease of
(2)
If loss acts with no lag on current stockof the quantity Q, then Q0 in (1) is thesame as Q0 in (2), and hence:
(3)
However, if loss acts on production at some time lag, then Q0in (1) is not the same as Q0 in (2). For discrete time intervals:
(4a)
(4b)
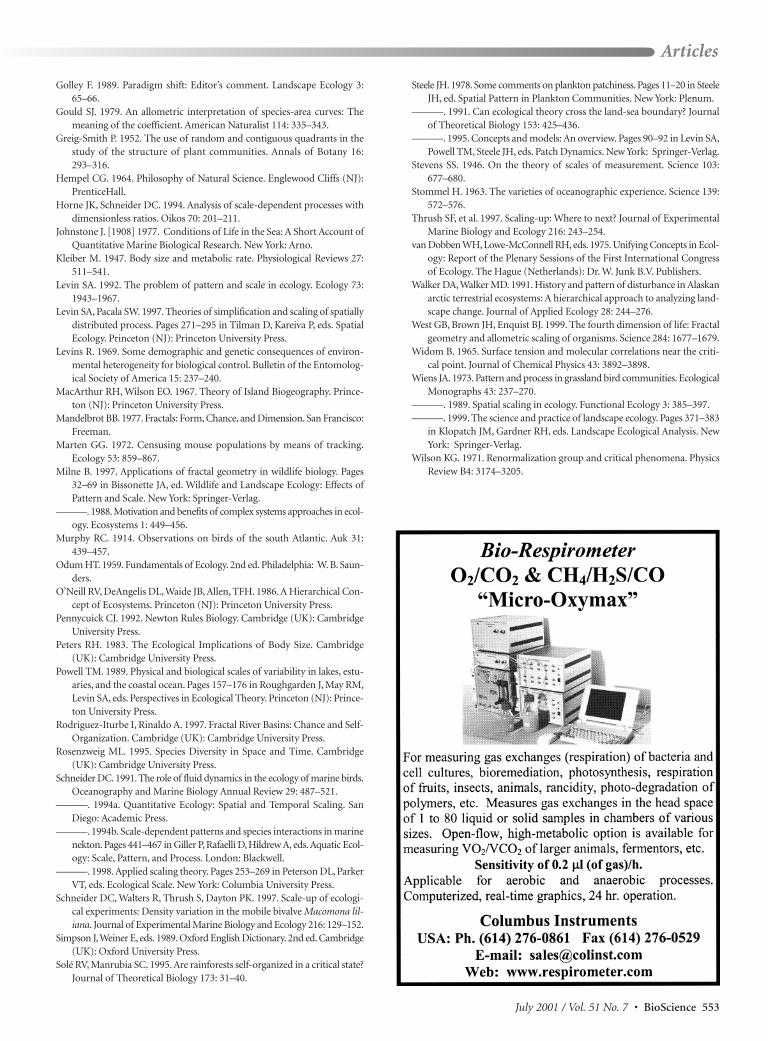
Figure 6 shows the emergence of power-law behavior in asimple population model as the lag between production and
loss increases. In this example, intrinsic differences in timescales of antagonistic rates delay removal relative to produc-tion (Steele 1995). As the delay increases, temporal variabil-ity spreads over multiple scales, diverging from any one scale.Figure 6 shows the appearance of scale-divergent dynamicsin a discrete time model as the production rate increases,thus widening the lag between production and loss. A power-law relation of variance in number to temporal scale emerges(as a straight line on a log–log plot) as the time series becomesfully chaotic in the lowest pair of panels in Figure 6.
Potential applications. A few examples of the theory ofscale-divergent dynamics certainly do not establish unifyingtheory in ecology. However, a large number of familiar prob-lems in ecology are susceptible to analysis by this theory. A fa-miliar and widely known example is the number of speciesin isolated systems (e.g., islands, lakes). The underlying dy-
July 2001 / Vol. 51 No. 7 • BioScience 551
Articles
Figure 6. Emergence of power-law behavior from antagonistic exponential rates. Ina discrete time population model with loss acting on recent production, time lagsincrease as the production rate increases from r = 0.1 (10% / time step) to r = 3.3(330% / time step). In the bottom panel, the time series becomes chaotic, andVariance (N)/f scales as f (where f equals cycles per time step as shown in the toppanel). The averaging interval increases from two steps to 50 steps as f decreasesfrom 0.50 to 0.02.
.
.
.
.

namics meet the conditions for the emergence of power-lawbehavior if losses resulting from extinction act episodicallyon species that accumulate via colonization events or evolu-tionary change. Island biogeography (MacArthur and Wilson1967) offers an equilibrium theory of loss versus colonizationin isolated ecosystems. Scale-divergent dynamics offers amore inclusive theory, leading to either equilibrium or non-equilibrium behavior, depending on whether losses act ongains with a lag.
Metapopulation analysis (Levins 1969) focuses on the crit-ical point at which recolonization offsets the probability of lo-cal extinction. With only slight refocus, the formalism un-derlying metapopulation analysis becomes a way of predictingthe emergence of power-law behavior in semi-isolated patchesof habitat.
Landscape ecology focuses on ecological processes againstbackgrounds of spatial structure such as ecotones. Fractaldescriptions of habitat structures are becoming more fre-quent. Milne (1997) listed examples for eagles, woodpeckers,gophers, and rabbits. The power-law (fractal) structure of eco-tones suggests that episodically warring rates are at work(e.g., gophers versus rabbits, grasses versus trees). In landscapeecology, one can expect to find antagonistic rates actingepisodically whenever a power law (such as a fractal) de-scribes habitat structure.
At evolutionary time scales, a change in species number canbe analyzed as the outcome of extinction rates acting on theresults of speciation. If, as seems likely, these antagonistic ratesact episodically with respect to each other, then power-lawbehavior is expected in the record of species number throughtime.
From central concept to unifying theory?
[1992] The problem of pattern and scale is the centralproblem in ecology, unifying population biology andecosystem science, and marrying basic and applied ecol-ogy (Levin 1992, p. 1943).
[1999] Although the concept that “scale matters” is acentral concern of landscape ecology, we have only frag-ments of a theory of scaling (Wiens 1999, p. 373).
Scaling has certainly become a central concept in ecology.Could it become a unifying concept? The question could nothave been asked 25 years ago. The plenary sessions of the FirstInternational Congress of Ecology were reported in a booktitled Unifying Concepts in Ecology (van Dobben and Lowe-McConnell 1975). Out of 28 contributions covering themajor ideas in ecology at the time, only three touch on mul-tiscale analysis. None uses the word scale explicitly or statesthat “scale matters.” Less than 20 years later, Allen andHoekstra (1992) placed the concept of scale at the center oftheir book Toward a Unified Ecology.
Potential applications of the theory of scale-divergent dy-namics easily exceed extant cases. It is not inconceivable thatthe concept of scale, and in particular the theory of scale-divergent dynamics (equations 1–4) will bring some theoretical
unity to ecology. In systems where loss and production act si-multaneously, where there is no memory, and where historydoes not matter, classical equilibrium theory is expected to ap-ply (equation 3). In systems where antagonistic rates actepisodically, where there is memory, and where history doesmatter, scale-divergent dynamics are expected (equation 4).
ConclusionAnalysis of key phrases (“scale” and “hierarchy theory”) sug-gests that recognition of the problem of scale in ecology oc-curred as a sudden shift beginning in the late 1970s and early1980s. The concept itself is far older. Verbal treatment of theconcept, without the use of the word scale, began early in the20th century. Graphical treatment employing both space andtime scales began in 1978. Formal treatment based on powerlaws began around 1920 for the scaling of species number toarea and for the scaling of organism form and function to bodysize. In physics, power laws describe complex behavior thatarises from nonlinear interactions near critical points. In bi-ology, power laws arise from scale-divergent dynamics whenhistory matters and either exponential losses or productionacts episodically. The theory of scale-divergent dynamics ap-plies to a wide variety of phenomena. It has the potential tobring some theoretical unity to ecology.
Acknowledgments Thanks go to D. Ings for his diligence in tracking down ref-erences and revising figures. Long-term support for researchon scaling theory came from the Natural Sciences and Engi-neering Research Council (Ottawa, Canada). The manuscriptwas completed during a sabbatical stay at the Department ofBotany, University of Hawaii, with support from the Biolog-ical Resources Division of the US Geological Survey. I thankL. Orloci,W. Steiner, and D. Greenfield for discussion and com-ments on early drafts. The manuscript was improved in re-sponse to perceptive comments by three anonymous re-viewers.
References citedAllen TFH, Hoekstra TW. 1992. Toward a Unified Ecology. New York: Co-
lumbia University Press.Allen TFH, Starr TB. 1982. Hierarchy. Chicago: University of Chicago Press.Bak P, Tang C, Wiesenfeld K. 1988. Self-organized criticality. Physics Review
A 38: 364–374.Burrough PA. 1981. Fractal dimensions of landscapes and other environmental
data. Nature 294: 240–242.Calder WA. 1983. Ecological scaling: Mammals and birds. Annual Review of
Ecology and Systematics 14: 213–230.Collins JW. 1884. Notes on the habits and methods of capture of various
species of sea birds that occur on the fishing banks off the eastern coastof North America, and which are used as bait for catching codfish by NewEngland fisherman. Report of the Commissioner of Fish and Fisheriesfor 1882 13: 311–335.
Delcourt HR, Delcourt PA, Webb T. 1983. Dynamic plant ecology: The spec-trum of vegetational change in space and time. Quaternary Science Re-views 1: 153–175.
Firbank LG. 1991. The implications of scale on the ecology and managementof weeds. Pages 91–103 in Bunce RGH, Ryszkowski L, Paoletti MG, eds.Landscape Ecology and Agroecosystems. Boca Raton (FL): Lewis.
552 BioScience • July 2001 / Vol. 51 No. 7
Articles
Golley F. 1989. Paradigm shift: Editor’s comment. Landscape Ecology 3:65–66.
Gould SJ. 1979. An allometric interpretation of species-area curves: Themeaning of the coefficient. American Naturalist 114: 335–343.
Greig-Smith P. 1952. The use of random and contiguous quadrants in thestudy of the structure of plant communities. Annals of Botany 16:293–316.
Hempel CG. 1964. Philosophy of Natural Science. Englewood Cliffs (NJ):PrenticeHall.
Horne JK, Schneider DC. 1994. Analysis of scale-dependent processes withdimensionless ratios. Oikos 70: 201–211.
Johnstone J. [1908] 1977. Conditions of Life in the Sea: A Short Account ofQuantitative Marine Biological Research. New York: Arno.
Kleiber M. 1947. Body size and metabolic rate. Physiological Reviews 27:511–541.
Levin SA. 1992. The problem of pattern and scale in ecology. Ecology 73:1943–1967.
Levin SA, Pacala SW. 1997. Theories of simplification and scaling of spatiallydistributed process. Pages 271–295 in Tilman D, Kareiva P, eds. SpatialEcology. Princeton (NJ): Princeton University Press.
Levins R. 1969. Some demographic and genetic consequences of environ-mental heterogeneity for biological control. Bulletin of the Entomolog-ical Society of America 15: 237–240.
MacArthur RH, Wilson EO. 1967. Theory of Island Biogeography. Prince-ton (NJ): Princeton University Press.
Mandelbrot BB. 1977. Fractals: Form, Chance, and Dimension. San Francisco:Freeman.
Marten GG. 1972. Censusing mouse populations by means of tracking.Ecology 53: 859–867.
Milne B. 1997. Applications of fractal geometry in wildlife biology. Pages32–69 in Bissonette JA, ed. Wildlife and Landscape Ecology: Effects ofPattern and Scale. New York: Springer-Verlag.
———. 1988. Motivation and benefits of complex systems approaches in ecol-ogy. Ecosystems 1: 449–456.
Murphy RC. 1914. Observations on birds of the south Atlantic. Auk 31:439–457.
Odum HT. 1959. Fundamentals of Ecology. 2nd ed. Philadelphia: W. B. Saun-ders.
O’Neill RV, DeAngelis DL, Waide JB, Allen, TFH. 1986. A Hierarchical Con-cept of Ecosystems. Princeton (NJ): Princeton University Press.
Pennycuick CJ. 1992. Newton Rules Biology. Cambridge (UK): CambridgeUniversity Press.
Peters RH. 1983. The Ecological Implications of Body Size. Cambridge(UK): Cambridge University Press.
Powell TM. 1989. Physical and biological scales of variability in lakes, estu-aries, and the coastal ocean. Pages 157–176 in Roughgarden J, May RM,Levin SA, eds. Perspectives in Ecological Theory. Princeton (NJ): Prince-ton University Press.
Rodriguez-Iturbe I, Rinaldo A. 1997. Fractal River Basins: Chance and Self-Organization. Cambridge (UK): Cambridge University Press.
Rosenzweig ML. 1995. Species Diversity in Space and Time. Cambridge(UK): Cambridge University Press.
Schneider DC. 1991. The role of fluid dynamics in the ecology of marine birds.Oceanography and Marine Biology Annual Review 29: 487–521.
———. 1994a. Quantitative Ecology: Spatial and Temporal Scaling. SanDiego: Academic Press.
———. 1994b. Scale-dependent patterns and species interactions in marinenekton. Pages 441–467 in Giller P, Rafaelli D, Hildrew A, eds.Aquatic Ecol-ogy: Scale, Pattern, and Process. London: Blackwell.
———. 1998. Applied scaling theory. Pages 253–269 in Peterson DL, ParkerVT, eds. Ecological Scale. New York: Columbia University Press.
Schneider DC, Walters R, Thrush S, Dayton PK. 1997. Scale-up of ecologi-cal experiments: Density variation in the mobile bivalve Macomona lil-iana. Journal of Experimental Marine Biology and Ecology 216: 129–152.
Simpson J,Weiner E, eds. 1989. Oxford English Dictionary. 2nd ed. Cambridge(UK): Oxford University Press.
Solé RV, Manrubia SC. 1995. Are rainforests self-organized in a critical state?Journal of Theoretical Biology 173: 31–40.
Steele JH. 1978. Some comments on plankton patchiness. Pages 11–20 in SteeleJH, ed. Spatial Pattern in Plankton Communities. New York: Plenum.
———. 1991. Can ecological theory cross the land-sea boundary? Journalof Theoretical Biology 153: 425–436.
———. 1995. Concepts and models: An overview. Pages 90–92 in Levin SA,Powell TM, Steele JH, eds. Patch Dynamics. New York: Springer-Verlag.
Stevens SS. 1946. On the theory of scales of measurement. Science 103:677–680.
Stommel H. 1963. The varieties of oceanographic experience. Science 139:572–576.
Thrush SF, et al. 1997. Scaling-up: Where to next? Journal of ExperimentalMarine Biology and Ecology 216: 243–254.
van Dobben WH, Lowe-McConnell RH, eds. 1975. Unifying Concepts in Ecol-ogy: Report of the Plenary Sessions of the First International Congressof Ecology. The Hague (Netherlands): Dr. W. Junk B.V. Publishers.
Walker DA, Walker MD. 1991. History and pattern of disturbance in Alaskanarctic terrestrial ecosystems: A hierarchical approach to analyzing land-scape change. Journal of Applied Ecology 28: 244–276.
West GB, Brown JH, Enquist BJ. 1999. The fourth dimension of life: Fractalgeometry and allometric scaling of organisms. Science 284: 1677–1679.
Widom B. 1965. Surface tension and molecular correlations near the criti-cal point. Journal of Chemical Physics 43: 3892–3898.
Wiens JA. 1973. Pattern and process in grassland bird communities. EcologicalMonographs 43: 237–270.
———. 1989. Spatial scaling in ecology. Functional Ecology 3: 385–397.———. 1999. The science and practice of landscape ecology. Pages 371–383
in Klopatch JM, Gardner RH, eds. Landscape Ecological Analysis. NewYork: Springer-Verlag.
Wilson KG. 1971. Renormalization group and critical phenomena. PhysicsReview B4: 3174–3205.
July 2001 / Vol. 51 No. 7 • BioScience 553
Articles

AMERICAN INSTITUTE OF BIOLOGICAL SCIENCESThe Service Organization for Researchers and Educators in Biology
Join AIBS now and check out these greatservices and benefits!
View and Search OnlineLectures in the AIBS VirtualLibrary:Through our partnership with DigiScript,Inc.,™ The Knowledge Management Com-pany™, distinguished plenary lectures andother content from the 2000 and 2001 AIBSAnnual meetings are now available onlinevia 12-month subscription and on CD-ROM, both for a small additional charge.Readers can:♦ View conference presentations - anytime & anywhere
♦ Enjoy synchronized audio, video, slides, and transcripts
♦ Search entire transcripts by keyword
Now online:
Plenary lectures from the March 2001AIBS Annual Meeting:
James H. Brown, University of New Mexico ♦ RitaColwell, National Science Foundation ♦ KathrynCottingham, Dartmouth College ♦ Paul Ehrlich, StanfordUniversity ♦ Simon A. Levin, Princeton University ♦Jane Lubchenco, Oregon State University ♦ SandraPostel, Global Water Policy Project ♦ Nancy N. Rabalais,Louisiana University Marine Consortium ♦ Joy B. Zedler,University of Wisconsin
Plenary lectures from the March 2000AIBS Annual Meeting:
Stephen Jay Gould, Harvard University ♦ Daniel H.Janzen, University of Pennsylvania ♦ Gene E. Likens,Institute of Ecosystem Studies ♦ Lynn Margulis, Uni-versity of Massachusetts ♦ Ernst Mayr, Harvard Univer-sity ♦ Gordon Orians, University of Washington ♦ SirGhillean Prance, formerly of the Royal Botanic Gardens♦ Marvalee Wake, University of California, Berkeley ♦Edward O. Wilson, Harvard University
To join AIBS and access these and other services and products, go to
www.aibs.org
Find Funding SourcesWorldwide:Individual members of AIBS have free accessto the Community of Science™ Funding Op-portunities online database, which compiles in-formation daily on more than 20,000 publicand private grants and awards worldwide forscience researchers, educators, and students.
Get BioScience:A blend of peer-reviewed articles, feature sto-ries, and reports written for researchers, K-16 teachers, and students alike, BioSciencepublishes every month and is ranked 7th outof 56 journals in the Biology category of ISI'sJournal Citation Report. Provided to all mem-bers, in print and online, as part of AIBS dues.
Think Big: Network with otherbiologists–and beyondAIBS is “on the ground” in WashingtonD.C., working for its members on research,education, and public policy initiatives atlocal, national, and international scales. Wereport to the membership via BioScience,AIBSnews, Public Policy news reports, andother outlets. Member networks includeAIBS meetings, online directories, andemail reports.
554 BioScience • July 2001 / Vol. 51 No. 7
Articles