Embed Size (px)
Citation preview

ARTICLES
Nanoscale heterogeneity promotes energydissipation in bone
KUANGSHIN TAI1*, MING DAO1*, SUBRA SURESH1,2, AHMET PALAZOGLU3 AND CHRISTINE ORTIZ1†1Department of Materials Science and Engineering, Massachusetts Institute of Technology, 77 Massachusetts Avenue, Cambridge, Massachusetts 02139, USA2Division of Biological Engineering, Massachusetts Institute of Technology, 77 Massachusetts Avenue, Cambridge, Massachusetts 02139, USA3Department of Chemical Engineering and Materials Science, University of California, One Shields Avenue, Davis, California 95616, USA*These authors contributed equally to this work†e-mail: [email protected]
Published online: 21 May 2007; doi:10.1038/nmat1911
Nanomechanical heterogeneity is expected to influence elasticity, damage, fracture and remodelling of bone. Here, the spatialdistribution of nanomechanical properties of bone is quantified at the length scale of individual collagen fibrils. Our results showelaborate patterns of stiffness ranging from ∼2 to 30 GPa, which do not correlate directly with topographical features and henceare attributed to underlying local structural and compositional variations. We propose a new energy-dissipation mechanism arisingfrom nanomechanical heterogeneity, which offers a means for ductility enhancement, damage evolution and toughening. Thishypothesis is supported by computational simulations that incorporate the nanoscale experimental results. These simulations predictthat non-uniform inelastic deformation over larger areas and increased energy dissipation arising from nanoscale heterogeneitylead to markedly different biomechanical properties compared with a uniform material. The fundamental concepts discoveredhere are applicable to a broad class of biological materials and may serve as a design consideration for biologically inspiredmaterials technologies.
Bone, like many natural materials, is inherently structurally, andhence mechanically, heterogeneous owing to spatial distributionsin the shape, size and composition of its constituent buildingblocks. Heterogeneity also arises from a multitude of differenttypes of biomacromolecule, pores containing fluids of variableviscosities and numerous interfaces (for example solid–solid, solid–fluid, damage based)1,2. As a consequence of the hierarchicalnature of bone3, mechanical heterogeneity is expected to exist atmultiple length scales. Macroscopically, significant variations inmechanical properties have been observed for different anatomicallocations4, as well as for regions within a particular anatomicallocation5, and are thought to develop in response to distinct loadingrequirements6. At the microscopic level, instrumented indentationhas further identified differences in moduli and hardness forspecific features such as trabeculae, interstitial lamellae and thickand thin lamellae in osteons, which have been attributed to collagenfibril orientation and anisotropy, as well as variations in mineralcontent7,8. Heterogeneity at this length scale is also expected toarise from the continual cellular remodelling processes resulting ina mixture of ‘old’ and ‘new’ bone at any given time. For example,osteonal bone typically undergoes substantial remodelling, whereasolder interstitial bone9 has a higher degree of mineralization10,leading to increased stiffness8. Atomic force microscopy (AFM)-based nanoindentation has been used to distinguish mechanicallyheterogeneous microscale regions in bone tissue from geneticallymodified mice with various levels of transforming growthfactor, TGF-β, which correlate with compositional heterogeneitymeasured by Raman microspectroscopy, and additionally hasbeen shown to possess the capability for quantifying nanoscaleheterogeneity11. All of these studies have ignited speculationon the role of heterogeneity in strain concentration, fracturerisk, adaptation and damage accumulation8,11–16. They also raise
important issues as to whether heterogeneity is advantageous ordisadvantageous to the mechanical function of bone2. Detailedand quantitative studies of the consequences of heterogeneity, inparticular at the nanoscale, on the structural integrity and properfunction of the tissue are largely unknown.
In this paper, we first quantify mechanical heterogeneity atnanometre length scales. Here, the mechanical response arisesfrom an individual mineralized collagen fibril within the boneextracellular matrix, which is composed of platelike carbonatedapatite mineralites (∼tens of nanometres in length and width, and3–5 nm in thickness1) that permeate in and around type-I collagenin an overlapping manner17, as well as a small concentration of∼200 different types of non-collagenous protein (<10 wt% oftotal protein)1. It has become increasingly evident that the uniquenanoscale properties of bone play a key role in its macroscopicbiomechanical function17–22, as this is where inelastic deformationand fracture must first initiate. Furthermore, because osteocyticprocesses have dimensions that are of the nanometre length scale23,nanoscale heterogeneities in material properties of the surroundingextracellular matrix would be expected to modulate local stresses,thereby potentially influencing processes such as remodelling,migration and adhesion.
Nanoindentation using a spatially controlled AFM-basedinstrument was carried out with a sharp tetrahedral siliconprobe tip (end radius ∼ 15 nm, as estimated by high-resolutionscanning electron microscopy imaging and AFM imaging of a gold-nanoparticle calibration standard) in ambient conditions as shownin Fig. 1 (see the Methods section). This instrument has a fullythree-dimensional (3D) closed-loop piezoelectric displacementsystem that ensures positional accuracies in three dimensions of<1 nm. Grids of indentations over a 2 μm×2 μm area were carriedout on adult bovine tibial cortical bone (prepared with no alcohol
454 nature materials VOL 6 JUNE 2007 www.nature.com/naturematerials
Untitled-1 1 11/5/07, 4:33:48 pm

ARTICLES
dehydration, embedding or chemical fixation) both perpendicularand parallel to the long bone axis, where the separation distancebetween the indents was 100 nm. This value was chosen toavoid overlap of neighbouring inelastic strain/residual stress zonesestimated by appropriate finite-element analysis (FEA) simulationsas detailed in the Methods section. Inelastic deformation ispredicted by FEA simulations (data not shown) to take placealmost immediately after contact owing to the high local stressconcentrations due to the sharpness of the probe tip, which isconsistent with a finite residual depth observed experimentallyon unloading (as will be shown later on). Hence, this size ofthe inelastic strain/residual stress zones determines the ‘spatialresolution’ of the experiments or the interindent spacing, thatis, it is not limited by instrumental factors, only by the sampledeformation. The deformation of the probe tip is negligible,because the elastic modulus of silicon is approximately oneorder of magnitude greater than that of bone. The deformationof the instrument was negligible (compliance ∼ 3 × 10⁶ N m−1)compared to the deformation of the cantilever (spring constant∼56.2 N m−1). It was ensured that during indentation the laser spotwas maintained within the linear range of the position-sensitivephotodiode. The maximum indentation depth was <40 nm at a5 μN maximum load (for ∼90% of all of the experimental data),corresponding to an elastic-zone radius (containing the inelasticallydeformed region) of ∼70 nm (estimated by FEA simulations; seethe Supplementary Information). As type-I collagen fibrils in thesetypes of bone sample were measured to have a mean diameter of∼150 nm (ref. 24), the deformation induced by indentation was onthe length scale of an individual collagen fibril. At each positionin the grid, the unloading slope of the force-versus-displacementcurve was used to calculate an indentation modulus on the basis ofa widely used contact mechanics model25 (see the Methods section).Owing to the assumptions of this model and the hierarchicalstructure of bone, the extracted indentation-modulus values reflectrelative mechanical stiffness and are not absolute quantitativevalues. However, the relative spatial differences in stiffness can beaccurately compared. Two-dimensional (2D) contour maps of localstiffness were constructed, which enabled the direct visualization ofnanomechanical spatial heterogeneity. These maps were comparedwith high-resolution a.c. intermittent contact-mode topographicAFM images of the same area of the bone ultrastructure takenbefore indentation.
The ultrastructure of osteonal bone viewed perpendicularto the long bone axis showed a nanogranular morphology of adense array of mineralites (Fig. 2a) with an average maximumlateral dimension of 64.9 ± 26.4 nm, peak-to-valley heightof 11.5 ± 9.1 nm and r.m.s. surface roughness of 11.5 nmcalculated over the entire 2 μm × 2 μm scan (measured fromcorresponding height images). Distinct type-I collagen fibrils andtheir characteristic 67 nm periodicity were not observed owingto the dense array of mineralites present. However, as reportedpreviously24, AFM imaging after partial demineralization, usinga one-second etch in ethylenediaminetetraacetic acid, reveals asurface of type-I collagen fibrils with varying degrees of orientationwithin the sample plane, the expected 67 nm banding and a meandiameter of ∼151 ± 17 nm. The stiffness map for the loadingaxis perpendicular to the long bone (osteonal) axis (Fig. 2b)corresponding to the area imaged in Fig. 2a shows a distributionwith values ranging from 2 GPa (white) to 26 GPa (black) withan averaged indentation-modulus value of 8.55 ± 3.7 GPa andcoefficient of variation or COV (ratio of the standard deviationto the mean) of 0.43. Individual force versus depth curvescorresponding to a few of the positions shown in Fig. 2b are given inFig. 2c and show finite residual depth after unloading ranging from17 to 27 nm, indicating the presence of inelastic deformation. This
Probe-tip end radius<15 nm
Contact radius~70 nm
Nanomechanicallymapped region
33º 29º
120º
18º 18º
56º
~18 μm ~18 μm
2 μm
a
b c
33º
33º
29º
~9 μm
~9 μm
~10 μm
50 μm
Figure 1 Schematic diagram of experiment used to quantify nanomechanicalheterogeneity in bone. a, 3D schematic diagrams illustrating probe-tip geometryand dimensions from the side and back view (left), front view (middle) and bottomview (right) as determined by scanning electron microscopy. b, Optical microscopyimage of an individual osteon in adult bovine cortical bone showing the Haversiancanal, circumferential lamellae and the lacuno-canalicular porosity. c, Schematicdiagram of a 2μm×2μm region probed nanomechanically drawn to scale relativeto osteon size; the size of the indented region is also drawn to scale.
is due to the large stress concentrations imparted by the very smallprobe tip which initiates inelastic deformation almost immediatelyon contact (as verified both experimentally and computationally,data not shown). A curved region of lower stiffness appearsdiagonally across the mapped region (length ∼ 1.8 μm), whereashigher-stiffness regions appear horizontally across the top of themapped region (Fig. 2b). Smaller localized variations and gradientsoccur throughout the map as well.
Multiple mapping experiments were carried out on bones fromfive different animals and nanoscale heterogeneity was found toexist in all samples, with COV values ranging from 0.26 to 0.46(data not shown). The fine patterns of each stiffness map variedamong different animals (data not shown), as well as the meanstiffness values (ranging from 8.5 ± 3.7 to 14.6 ± 5.0 GPa), asexpected. We also investigated the effect of surface roughnessby carrying out >3,000 indentation experiments over a rangeof maximum depth, hmax/r.m.s. surface roughness (where ther.m.s. surface roughness was measured directly at every positionusing a.c. intermittent contact-mode AFM height images). It wasfound that the COV stayed within 0.3–0.4 for the entire rangeof hmax/r.m.s. surface roughness ∼2−16 and was statisticallyindependent of hmax/r.m.s. surface roughness as assessed by ananalysis of variance test using the O’Brien method to test forhomogeneity of variances between the different COV groupsrelative to one another. Using this analysis, it was shown that theassumption for homoscedasticity was met (F = 1.0113, p > 0.05),that is, that there was no overall statistically significant trend for thedependence of the COV on hmax/r.m.s. surface roughness (see theSupplementary Information).
Assuming a helicoidal collagen fibril arrangement26 andtransversely isotropic properties of individual collagen fibrils27,variations in collagen fibril orientation are not expected toplay a major role in the observed heterogeneity, becausethe loading axis is perpendicular to the collagen fibril axis.Other possible sources of observed heterogeneity include
nature materials VOL 6 JUNE 2007 www.nature.com/naturematerials 455
Untitled-1 2 11/5/07, 4:33:51 pm

ARTICLES
24–2622–2420–2218–2016–1814–1612–1410–128–106–84–62–40–2
26+
GPaModulus 100 nm
0
1
2
3
4
5
24–2622–2420–2218–2016–1814–1612–1410–128–106–84–62–40–2
26+
00
0 10 20 30 40
15 30 45 60
1
2
3
4
5
GPaTopography 100 nm Modulus 100 nm
0
1
2
3
4
5
0
1
2
3
4
5
200 nm200 nm
Indentation depth (nm)
Indentation depth (nm)
Long bone axis
Long bone axis Long bone
axis
Long bone axis
100 nmTopography
a c
g
fd e
b
Forc
e (μ
N)Fo
rce
(μN)
Figure 2 The ultrastructure and nanomechanical spatial heterogeneity of bone stiffness. a, An a.c. intermittent contact-mode AFM amplitude image viewedperpendicular to the long bone axis. b, 2D contour map of modulus reduced from nanoindentation data25 for the area shown in a with loading axis perpendicular to the longbone axis. c, Individual nanoindentation curves at different locations within the modulus map b; moduli (GPa) blue diamonds 12.5, green circles 10.5, purple triangles 5.4,brown squares 4.2. d, An a.c. intermittent contact-mode AFM amplitude image parallel to the long bone axis. The average maximum lateral dimension measured fromcorresponding AFM height images was determined to be 64.9±26.4 nm, which is consistent with the known dimensions of mineral particles in bone and other calcifiedtissues, as measured by scanning electron microscopy50, transmission electron microscopy51 and small-angle X-ray scattering52. These values are somewhat smaller thanthose previously observed on similar samples20 owing to optimization of the experimental imaging protocol to achieve higher resolutions. e, 2D contour map of modulus forthe area shown in d with loading axis parallel to the long bone axis. f, Individual nanoindentation curves at different locations within the modulus map e; moduli (GPa) bluediamonds 24.2, green circles 18.1, purple triangles 15.8, brown squares 5.7. g, 3D graphic illustrations of the modulus maps shown in b (left), where loading was carried outperpendicular to the long bone axis, and e (right), where loading carried out parallel to the long bone axis. The vertical axis corresponds to stiffness, where the highest verticaltopography corresponds to the maximum value and the lowest topography corresponds to the minimum value. For b and e, in the 26+ bin 1.5% of the data points showedmoduli > 28 GPa.
nano- to microscale organic–inorganic compositional or structuralvariations (for example, different sizes, shapes and/or spacingbetween nanoscale constituents). Compositional fluctuationsare known to exist down to ∼1 μm, as revealed by micro-Raman spectroscopy28.
Indentation-modulus data taken with the loading axis parallelto the long bone axis on the same sample show less heterogeneity(coefficient of variation of 0.37), with values ranging from 5 (lightyellow) to 31 (black) GPa and increased mean stiffness (∼12.9 ±4.8 GPa) (Fig. 2d–f) compared with the perpendicular orientation
(by a factor of ∼1.5). This trend is consistent with macroscopictissue-level data5 and collagen fibril anisotropy (increased stiffnessalong the fibril axis compared with transverse directions)27. Alarge curved region is observed with increased stiffness (thickness∼250 nm) in the upper left hand side of the map, as well asthe lower right hand side (distance between high stiffness regions∼1.5 μm). Similar experiments were carried out on five differentosteonal regions of the same bone sample. Nanoscale mechanicalheterogeneity was observed in all of these maps and showed COVvalues ranging from 0.37 to 0.43 (data not shown). Again, the fine
456 nature materials VOL 6 JUNE 2007 www.nature.com/naturematerials
Untitled-1 3 11/5/07, 4:34:07 pm

ARTICLES
GPa
Long bone axis Long bone axis
26+
14
0
GPa5
0
–5
a
c d
b
Figure 3 Quantitative analysis of nanomechanical-property maps using discrete wavelet transform. a, Level-1 approximation for modulus map given in Fig. 2b (loadingaxis perpendicular to the long bone axis). b, Level-1 approximation for modulus map given in Fig. 2e (loading axis parallel to the long bone axis). c, First-level detailcorresponding to a. d, First-level detail corresponding to b.
patterns of each stiffness map varied among different regions andthe mean stiffness values ranged from 11.8±3.6 to 14.1±5.3 GPa.Figure 2g provides a 3D visualization of the nanoscale stiffnessdata, with the vertical direction corresponding to the stiffnessmagnitude, comparing the parallel and perpendicular orientationdirections. Although the COV for the contour map perpendicularto the long bone axis is greater, the differences in peak-to-valleymodulus values are more apparent for the map from indents takenparallel to the long bone axis in the 3D visualizations. Assumingthe spiral model for collagen fibril orientation29, this occurrencemay arise from off-axis loading of collagen fibrils, as opposed to in-plane loading in the perpendicular orientation. If the heterogeneityobserved (for loading parallel to the long bone axis) was solely dueto collagen fibril orientation, a more-or-less-continuous stiffnessgradient would be observed, which does not seem to be thecase here. Thick and thin lamellae have been measured to beapproximately ∼5−7 and 1 μm in width, respectively30, with thethin lamellae being ∼10% softer than the thick ones8. No distinctpatterns were observed that could be conclusively associated withsuch features. Hence, the fluctuations observed must partiallyoriginate from smaller-length-scale features.
The modulus maps were analysed quantitatively using thediscrete wavelet transform31, where decomposition of spatial
frequencies creates a coarser approximation of the image(see the Methods section). Details can be associated with a‘pseudofrequency’ that identifies the length scales of the patternsremoved at spatially specific regions. Figure 3a,b depicts thefirst-level approximations of the original images correspondingto indents perpendicular and parallel to the long bone axis,respectively. The details for these corresponding maps wereremoved to obtain the coarser image (Fig. 3c,d). The detail imagesshow largely random features that prevail at the high spatialfrequencies. However, they also capture specific patterns associatedwith the high-modulus areas. One can observe high-moduluspeaks that coincide with the larger high-modulus domains (moreapparent with the image parallel to the bone axis, Fig. 3d). Thefirst level of decomposition thus seems to remove the localhigh-modulus peaks, leaving broader regions of stiffness. Thecharacteristic length scale given by the pseudo(-spatial-)frequencyanalysis, identified as ∼156 ± 28 nm, corresponds closely tothe experimentally measured mean diameter of an individualcollagen fibril24.
The mechanical heterogeneity described above for the AFM-based nanoindentation is much more pronounced compared withdepth-sensing microindentation carried out on similar specimens(see the Supplementary Information). The COVs for microscale
nature materials VOL 6 JUNE 2007 www.nature.com/naturematerials 457
Untitled-1 4 11/5/07, 4:34:29 pm
ARTICLES
300 nm
0º rotation 90º rotation
180º rotation 270º rotation
300 nm
0.10
0.05
0
x2
x1
Homogeneousinelastic region
Homogeneousinelastic region
Heterogeneousinelastic region
Homogeneous elastic region
Inelasticequivalent
strain0.74 μm
displacement
1.19 μmdisplacement
1.64 μmdisplacement
2.09 μmdisplacement
2.50 μmdisplacement
Inel
astic
def
orm
ed a
rea
(μm
2 )
0 0
0.5
1.0
1.5
2.0
2.5
3.0
3.5
200 300 400 500 600 700
0.1
0.2
0.3
0.4
0.5
0.6
0.7
0.8
0.9
Norm
aliz
ed e
nerg
y di
ssip
atio
n
Long bone axis
Long bone axis
Long bone axisLong bone
axis
Hom. map ⊥ Het. map ⊥ Hom. map ||
Het. map ||
Hom. map ⊥ Het. map ⊥ Hom. map || Het. map ||
Force (μN)
Long bone axis
5 μm 2 μm 20 μma b
c
d e
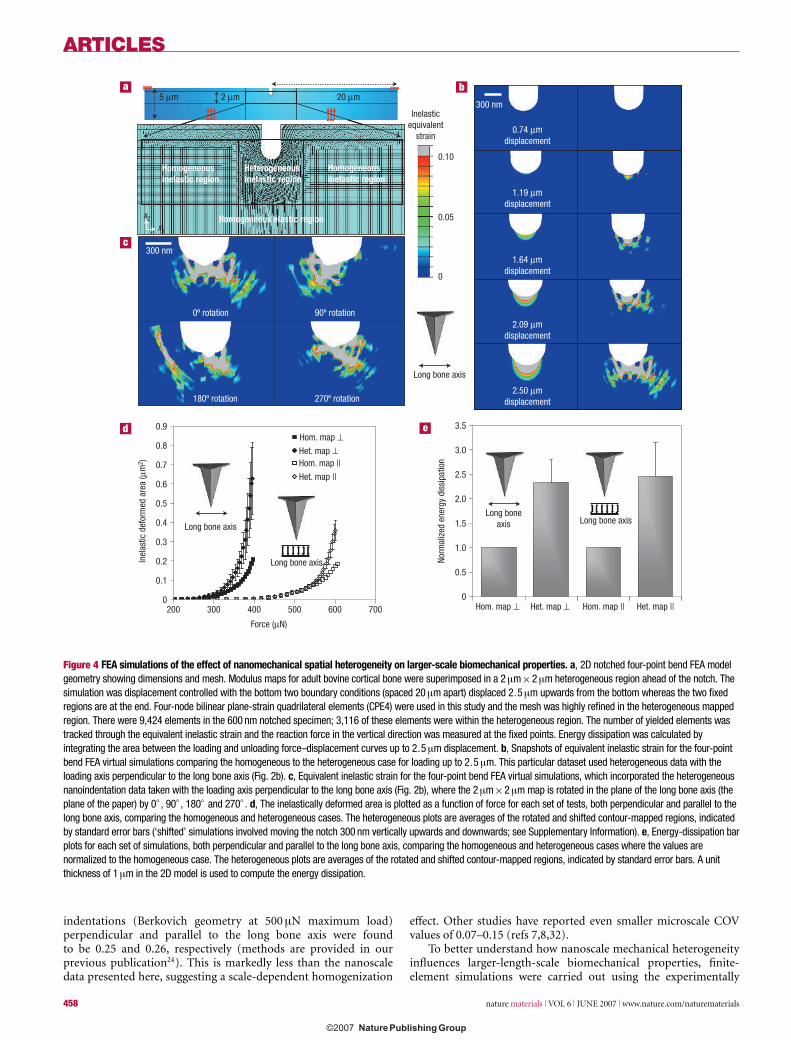
Figure 4 FEA simulations of the effect of nanomechanical spatial heterogeneity on larger-scale biomechanical properties. a, 2D notched four-point bend FEA modelgeometry showing dimensions and mesh. Modulus maps for adult bovine cortical bone were superimposed in a 2μm×2μm heterogeneous region ahead of the notch. Thesimulation was displacement controlled with the bottom two boundary conditions (spaced 20μm apart) displaced 2.5μm upwards from the bottom whereas the two fixedregions are at the end. Four-node bilinear plane-strain quadrilateral elements (CPE4) were used in this study and the mesh was highly refined in the heterogeneous mappedregion. There were 9,424 elements in the 600 nm notched specimen; 3,116 of these elements were within the heterogeneous region. The number of yielded elements wastracked through the equivalent inelastic strain and the reaction force in the vertical direction was measured at the fixed points. Energy dissipation was calculated byintegrating the area between the loading and unloading force–displacement curves up to 2.5μm displacement. b, Snapshots of equivalent inelastic strain for the four-pointbend FEA virtual simulations comparing the homogeneous to the heterogeneous case for loading up to 2.5μm. This particular dataset used heterogeneous data with theloading axis perpendicular to the long bone axis (Fig. 2b). c, Equivalent inelastic strain for the four-point bend FEA virtual simulations, which incorporated the heterogeneousnanoindentation data taken with the loading axis perpendicular to the long bone axis (Fig. 2b), where the 2μm×2μm map is rotated in the plane of the long bone axis (theplane of the paper) by 0◦ , 90◦ , 180◦ and 270◦ . d, The inelastically deformed area is plotted as a function of force for each set of tests, both perpendicular and parallel to thelong bone axis, comparing the homogeneous and heterogeneous cases. The heterogeneous plots are averages of the rotated and shifted contour-mapped regions, indicatedby standard error bars (‘shifted’ simulations involved moving the notch 300 nm vertically upwards and downwards; see Supplementary Information). e, Energy-dissipation barplots for each set of simulations, both perpendicular and parallel to the long bone axis, comparing the homogeneous and heterogeneous cases where the values arenormalized to the homogeneous case. The heterogeneous plots are averages of the rotated and shifted contour-mapped regions, indicated by standard error bars. A unitthickness of 1μm in the 2D model is used to compute the energy dissipation.
indentations (Berkovich geometry at 500 μN maximum load)perpendicular and parallel to the long bone axis were foundto be 0.25 and 0.26, respectively (methods are provided in ourprevious publication24). This is markedly less than the nanoscaledata presented here, suggesting a scale-dependent homogenization
effect. Other studies have reported even smaller microscale COVvalues of 0.07–0.15 (refs 7,8,32).
To better understand how nanoscale mechanical heterogeneityinfluences larger-length-scale biomechanical properties, finite-element simulations were carried out using the experimentally
458 nature materials VOL 6 JUNE 2007 www.nature.com/naturematerials
Untitled-1 5 11/5/07, 4:34:43 pm

ARTICLES
300 nm
1.00
0.50
0
Depth (nm)
Long bone axis
Inelasticequivalent
strain
00 100 200 300 400
200
400
600
800
1,000
Forc
e (μ
N)
Force (μN)
Heterogeneousmap (162 pJ)
Heterogeneous map
Homogeneousmap (114 pJ)
Homogeneous map
00 200 400 600 800
0.2
0.4
0.6
0.8
1.0
Inel
astic
def
orm
ed a
rea
(μm
2 )
a b
c
300 nm
Figure 5 FEA simulations of the effect of nanomechanical spatial heterogeneity on larger-scale compressive loading. a, 2D indentation FEA model showing snapshotsof equivalent inelastic strain for an indentation virtual simulation comparing the homogeneous (top) with the heterogeneous (bottom) case for loading up to ∼850μN. Thisparticular dataset used heterogeneous data with the loading axis perpendicular to the long bone axis (Fig. 2b). A unit thickness of 1μm in the 2D model is used to computethe energy dissipation. b, The force–depth curves for the homogeneous and heterogeneous cases. c, The inelastically deformed area as a function of force, comparing thehomogeneous and heterogeneous cases.
determined fine-scale heterogeneity and local mechanical-propertyvariations extracted from AFM-based indentation experiments.One previous study reported finite-element analysis of a perfectlyelastic heterogeneous microstructure on the basis of mean tissue-level experimental data. In that work, the indentation elasticmodulus decreased nonlinearly with increasing COV (artificiallyinduced in the simulation). In addition, a marked increase in thenumber of failed elements (determined by an elastic-limit-straincriterion) was observed with increasing heterogeneity16. Here, wedirectly incorporate the experimentally measured heterogeneousnanoscale-stiffness maps into a highly refined region of finiteelements just ahead of a notched four-point bend mesh (Fig. 4a),so as to capture the localization of strain in a region with nanoscalestructural non-uniformity. Inelasticity was also incorporated intothe four-point bend mesh as follows. Inelastic deformationwas first assessed during individual indentation experimentsby constructing an axisymmetric 2D FEA simulation with anequivalent tip apex angle of 23.5◦, that is, the same indentationvolume versus depth as for the AFM probe tip, that assumed aperfect von Mises inelastic constitutive law, as well as a modulusevaluated from the unloading slope25. For a number of force-versus-depth indentation curves, various trial yield-stress (σY)values were chosen to determine the optimal value at which thesimulated data fitted the experimental curve. Each individual best-fit value (with an average σY value of ∼395 MPa) was thenused to calculate the corresponding equivalent (elastic) limit strainat the yield point as given by εY = (2(1 + ν)σY)/3E, where νis Poisson’s ratio and E is the elastic modulus (ν was takento be 0.25). The εY values were found to be ∼0.04 ± 0.02 for
specimens tested parallel to the long bone axis and ∼0.044±0.02for specimens tested perpendicular to the long bone axis. Theseobservations suggest that a constant-elastic-limit-strain (inelastic-yield-strain) criterion is a reasonable first-order approximation.Therefore, taking the above average value of εY, the local yield-stress value at each position within the heterogeneous map, σY, canbe obtained conversely using σY = (3EεY)/2(1 + ν). The energy-dissipative inelastic deformation is incorporated here because afinite residual depth is observed after unloading of the indentationcurves (Fig. 2c,f).
Strain-controlled micro- and macro-scale failure of bone hasalso been studied experimentally using four-point bend specimenswith rounded notches33. Damage preceding failure was observed tooccur immediately at the notch tip (where maximum strain occurs)as opposed to further ahead of the notch tip (where maximumstress occurs), supporting the constant-failure-strain hypothesis.The tensile yield behaviour of bone has also been characterizedby critical strain34. As noted in earlier work33, the inelasticconstitutive response of bone is at present not fully understood. Incompression, nanogranular friction and intraorganic cohesion arethought to be major contributing factors to the inelastic resistanceof bone initially20. Other mechanisms probably come into playat higher strains owing to the effects of collagen fibril shear19
and denaturation24, crack initiation/propagation33 and sacrificialbond rupture17. Although bone is known to show significanttension–compression asymmetry, plasticity models involving thevon Mises yield criterion are typically used to capture, at leastapproximately, the stress/strain fields in bone undergoing inelasticdeformation. In the spirit of developing detailed quantitative trends
nature materials VOL 6 JUNE 2007 www.nature.com/naturematerials 459
Untitled-1 6 11/5/07, 4:34:58 pm

ARTICLES
f (x,y)
fH(x,y )
fL(x,y )
fLL(x,y )
fLH(x,y )
fHL(x,y )
fHH(x,y )
l (x )
l (y )
h (y )
l (y )
h (y )h (x )
→
2 x
→
2 y
→
2 y
→
2 y
→
2 y
→
2 x
Figure 6 Wavelet decomposition of a 2D image47. f(x, y ) is the 2D image, h(x )the high-pass filter in the x direction, l(x ) the low-pass filter in the x direction,fL (x, y ) the 2D image following the low-pass filter, fH (x, y ) the 2D image followingthe high-pass filter, fLL (x, y ) the 2D image following the low-pass/low-pass filtercombination, resulting in the smoothed approximation, fLH (x, y ) the 2D imagefollowing the low-pass/high-pass filter combination, resulting in the horizontaldetail, fHL (x, y ) the 2D image following the high-pass/low-pass filter combination,resulting in the vertical detail, fHH (x, y ) the 2D image following thehigh-pass/high-pass filter combination, resulting in the diagonal detail, and 2(↓)xthe downsampling in the x direction.
for relative assessments of the role of structural heterogeneity fromthe nano- to the microscale, we invoke, as in earlier studies33,plasticity analysis (described below) in our finite-element model,with the full realization that comprehensive constitutive modelsfor inelastic deformation of bone have not yet been developed.These simulations, however, are seen to capture key trends ofthe inelastic deformation of bone when compared with ourparallel computational studies that invoke anisotropy and pressuresensitivity of deformation (as noted below).
Figure 4b shows the progression of equivalent inelastic strain(defined as the time integral of
√2/3 multiplied by the magnitude
of the inelastic strain rate) during two virtual four-point bend FEAsimulations (displacement controlled). The first (right column)incorporated the heterogeneously mapped data from Fig. 2b(loading axis perpendicular to the long bone axis). The second(left column) was a control, which was an elastic–perfectlyplastic simulation with purely homogeneous mechanical properties(set to the volume-averaged mean value of modulus measuredexperimentally in Fig. 2b and the volume-averaged mean value ofyield stress obtained from the strain-based yield criterion). Themeasured inelastic strain in the vicinity of the notch is continuouslygreater for the heterogeneous case than the homogeneous from 1.5to 2.5 μm displacement. The inelastic strain develops irregularlyahead of the notch and extends about twice as far for theheterogeneous material compared with the homogeneous one at2.5 μm displacement. Non-uniform notch opening and bluntingtook place in the heterogeneous case, as compared with a moreuniform shape change for the homogeneous case. Figure 4cshows the inelastic equivalent strain for the four-point bend FEAsimulations at 2.5 μm displacement for the same nanoindentationdata (Fig. 2b), where the heterogeneous map ahead of the notchis rotated by 0◦, 90◦, 180◦ and 270◦ in the plane defined by thelong bone axis (in the plane of the paper). Although the fine detailsof the inelasticity pathways are different for different rotations, allsimulations show characteristic heterogeneous diffuse deformationover a much greater area compared with the homogeneousmaterial. There is less than 10% variation in the inelasticallydeformed area for a complete rotation over 360◦. The inelasticallydeformed area as a function of applied force is given (Fig. 4d) forcases both perpendicular and parallel to the long bone axis for bothheterogeneous and homogeneous cases. For tests perpendicularto the long bone axis, the inelastically deformed area was about
three times as great for the heterogeneous than the homogeneouscase at 390 μN maximum force. For tests parallel to the osteonalaxis, the inelastic deformation area was about twice as great forthe heterogeneous case at 610 μN maximum force. In general, fora 2.5 μm displacement, the inelastic strain region correspondedto an increased applied force for stiffer modulus values, onaverage. A comparison between maps taken with different loadingorientations showed similar energy dissipation, which was about2.4 times greater for the heterogeneous map compared with thehomogeneous case (Fig. 4e). Also, as the notch diameter was variedbetween 300 and 1200 nm, there was a slight increase (∼10%) inthe inelastic strain region for heterogeneous and homogeneouscases in both orientations (data not shown). However, the relativeratio of inelastically strained areas between heterogenous andhomogeneous cases remained similar.
Further FEA simulations were carried out incorporatinganisotropy (using elastic constants from ultrasonic velocitytests35) and, separately, pressure sensitivity20. These additionalsimulations (see the Supplementary Information) showed thesame overall trends as the foregoing elastoplastic simulations,of increased inelastically deformed area (about threefold) andenergy dissipation (about twofold) for the heterogeneous systemcompared with the homogeneous case. Therefore, although thespecific extent of damage evolution and energy dissipation couldbe somewhat influenced by the particular constitutive model,material anisotropy and pressure sensitivity, it is evident thatthe overall conclusions extracted from the present computationalsimulations hold irrespective of the particular choice of materialmodel. Another important issue pertains to the accuracy withwhich the 2D plane strain model captures the behaviour of the 3Dmicrostructure. Indeed, significant quantitative differences wouldbe expected in the inelastic strain distributions predicted by the 3Dmodel as compared with the 2D case36,37. Nevertheless, statistically,inelastic strain and stress (for example maximum principal stress)distributions from a plane-strain model are in general quite similarto those from a full 3D model, with the heterogeneity slightlyunderestimated by the plane-strain model36. These results36,37
suggest that the plane-strain model used here should be sufficientlyaccurate to distinguish statistically the relative difference betweenthe heterogeneous case and the homogeneous case.
An additional 2D FEA nanoindentation model was also builtwith compression as the chief loading mechanism (Fig. 5a). Here,similar to the bending case, the modulus map was superimposedonto a fine mesh with a 90◦ included-angle indentation geometryto demonstrate that the same trends are observed as with the four-point bend simulations. Figure 5b shows that the simulated force-versus-indentation-depth curves for the homogeneous stiffnessmap show a smaller deformation for a given load comparedwith the heterogeneous material (Fig. 2b) for loads larger than∼250 μN. The energy dissipations given by the curves were 114 and162 pJ for the homogeneous and heterogeneous cases, respectively(for 850 μN maximum load). The inelastically deformed area forthe heterogeneous case was markedly greater than that for thehomogeneous case (Fig. 5c), consistent with the results obtainedfrom the four-point bending simulations. This result furthersuggests that, even though heterogeneity at the micro- and macro-scale may have deleterious effects, leading to fracture and interfacialinstabilities38, inelastic heterogeneity at the nanoscale offers anadvantageous mechanism for ductile energy dissipation.
In summary, we propose a new energy dissipation mechanismfor bone arising from nanomechanical heterogeneity, by recourseto experimental results that provide high-resolution, spatiallyspecific nanomechanical tests in conjunction with detailedcomputational simulations of locally inelastic deformation. Theseresults provide compelling evidence for enhanced ductility and
460 nature materials VOL 6 JUNE 2007 www.nature.com/naturematerials
Untitled-1 7 11/5/07, 4:35:04 pm

ARTICLES
energy dissipation through nanoscale structural heterogeneity.This concept is generally applicable to a broad class of naturalmaterials because nanomechanical heterogeneity is expectedto be ubiquitously present. In addition, because osteocytesare continually sampling their mechanical environment39,deformation spread out over greater spatial areas owing tonanomechanical heterogeneity may facilitate damage detection inthe extracellular matrix and improved remodelling responses. Theheterogeneous nanomechanical patterns measured experimentallywould in turn cause corresponding local heterogeneous strainswhen loaded macroscopically. Such strains are expected tobe amplified by the softer surrounding pericellular matrix ofosteocytes40, further affecting cellular processes, possibly actingas ‘nanomechanical messages’. Lastly, heterogeneous local strainsare also expected to influence interstitial fluid flow, whichhas been shown to be critical to the proper maintenance ofmetabolic activity41.
METHODS
SAMPLE PREPARATION AND CHARACTERIZATIONSamples of adult bovine cortical bone from the proximal tibial metaphysis wereprepared as previously described24. Sample preparation did not involvechemical treatment, ethanol dehydration or embedding. The mineral contentmeasured by back-scattered electron microscopy was found to be ∼58 wt%.The a.c. intermittent contact-mode AFM imaging at ambient temperature andhumidity was used with a 3D molecular force probe (MFP-3D, AsylumResearch) on hydrated samples of osteonal bone using a silicon etchedOMCL-AC160TS (Olympus) rectangular cantilever with a tetrahedral probe tip(cantilever spring constant, k ∼ 56.2 N m−1, probe-tip end radius ∼15 nm,Fig. 1) in ambient conditions. The tip radius was measured by a.c.-modeimaging of a gold nanoparticle calibration standard42.
NANOINDENTATIONNanoindentation experiments were conducted in ambient conditions using theMFP-3D and the same probe tip as that used for a.c.-mode AFM imaging. Theinverse optical lever sensitivity and cantilever spring constant calibrations werecarried out as previously reported43. Displacement-controlled nanoindentationwas carried out by loading at a rate of 1 μm s−1 up to a trigger force of 5 μNfollowed by unloading at the same rate. The loading/unloading rate was variedfrom 0.05 to 10 μm s−1 and no statistically significant differences in calculatedmoduli were observed at loading rates between 0.5 and 5 μm s−1, indicatingthat viscoelastic effects were minimized. The tip contact-area function wascalibrated with a sample of glycol methacrylate using a 6 GPa modulus fromprevious indentation data taken on a Hysitron Triboindentor. Values for elasticmoduli were calculated from 95 to 20% of the initial unloading curve by fittingthese data to contact mechanical theory for an isotropic, elastic half-space25 foreach individual curve. Due to the assumptions of this model44,45 (for exampleisotropy) and the hierarchical nanostructure of bone, the extracted modulus ismore appropriately defined as an ‘indentation modulus’ in that it reflectsrelative mechanical stiffness and does not produce absolute quantitative values.However, the relative spatial differences in stiffness can be accurately compared.The 100 nm interindent spacing was chosen to be sufficiently large for minimalinterference with a neighbouring residual inelastically deformed zone as well asresidual stresses, as verified by 2D elastic–inelastic FEA simulations (describedin detail in the FEA methods section). Additionally, experimental histogramdistributions of the modulus taken at a much larger interindent spacing of 1 μmshowed statistically similar modulus distributions (p < 0.05). An epoxy controlsample (McMaster-Carr) was tested to ensure that the range of stiffness valuesobserved was outside the instrumental scatter and the averaged modulusmeasured was determined to be 2.9±0.7 with a COV of 0.23.
WAVELET DECOMPOSITION ANALYSISWavelet transform enables localization of both space and frequency, achieved bydilating and translating a finite wavelet function to capture different frequencyranges and their spatial locations46. The discrete wavelet transform representsone-dimensional sampled data with a limited number of decomposition levels(frequency scales). A set of low- and high-pass filters is used for decomposing
the data into a coarse approximation and a residual detail. Wavelets also enableparticular frequency sub-bands to be isolated within an image, which aretreated as 2D signals47. Figure 6 depicts a one-level decomposition of a 2Dimage. Filters are applied in the x-direction and the results are down-sampledby deleting every other column. This yields two images of approximately halfthe size of the original, one containing high-frequency components of the rowsand the other containing low-frequency components. These two images arethen each filtered down the columns using the corresponding filters anddown-sampling the results along the rows. This results in thesmoothed-approximation, the horizontal-detail, the vertical-detail and thediagonal-detail subimages. The process is repeated on thesmoothed-approximation subimage to obtain the next level of decomposition.
FINITE-ELEMENT ANALYSISThe elastic contact radius at maximum load (using a threshold of 0.01logarithmic strain) and the size of the residual inelastic strain zone (using athreshold of 0.01 inelastic equivalent strain) and residual stress zone (using athreshold of 0.1 σY) after unloading were approximated by an elastic–perfectlyinelastic 2D axisymmetric-indentation FEA model using the software packageABAQUS (Pawtucket, RI, USA) fitted to individual force–depth curves. Theprobe-tip geometry was incorporated from direct scanning electronmicroscopy visualization. The modulus value was fixed to the values obtainedfrom the Oliver–Pharr analysis on the basis of the initial unloading slope25. Theyield stress was kept as a free fitting parameter, from which the yield straincould be iteratively determined. More detailed discussions on thecomputational indentation modelling and mechanical property extraction canbe found elsewhere48,49.
A 2D plane-strain four-point bend model (40 μm wide and 5 μm high) wasbuilt (Fig. 4a). The experimentally measured modulus maps were incorporatedwithin this FEA model for both specimens with indents perpendicular andparallel to the long bone axis by assigning a specific material section towhichever elements spatially coincided with each particular material region. Anelastic-limit-strain-based von Mises plasticity constitutive law was used tomodel the energy-dissipating inelastic deformation and to obtain a localyield-stress value as described in the main text. The elements in the areaimmediately to the right and left of the 2 μm×2 μm heterogeneous region wereassigned the experimentally measured average homogeneous value of modulusand corresponding yield stress (on the basis of the criterion discussedpreviously). The elements in the bottom portion were assigned only the purelyelastic average homogeneous modulus value.
Received 25 September 2006; accepted 16 April 2007; published 21 May 2007.
References1. Weiner, S. & Wagner, H. D. The material bone: Structure–mechanical function relations. Annu. Rev.
Mater. Sci. 28, 271–298 (1998).2. Currey, J. Structural heterogeneity in bone: Good or bad? J. Musculoskelet. Neuronal Interact. 5,
317 (2005).3. Lakes, R. S. Materials with structural hierarchy. Nature 361, 511–515 (1993).4. Morgan, E. F., Bayraktar, H. H. & Keaveny, T. M. Trabecular bone modulus–density relationships
depend on anatomic site. J. Biomech. 36, 897–904 (2003).5. Pope, M. H. & Outwater, J. O. Mechanical properties of bone as a function of position and
orientation. J. Biomech. 7, 61–66 (1974).6. Skedros, J. G., Sorenson, S. M., Takano, Y. & Turner, C. H. Dissociation of mineral and collagen
orientations may differentially adapt compact bone for regional loading environments: Results fromacoustic velocity measurements in deer calcanei. Bone 39, 143–151 (2006).
7. Rho, J. Y., Roy, M. E., Tsui, T. Y. & Pharr, G. M. Elastic properties of microstructural components ofhuman bone tissue as measured by nanoindentation. J. Biomed. Mater. Res. 45, 48–54 (1999).
8. Gupta, H. S. et al. Mechanical modulation at the lamellar level in osteonal bone. J. Mater. Res. 21,1913–1921 (2006).
9. Martin, R. B. & Burr, D. B. Structure, Function and Adaptation of Compact Bone (Raven,New York, 1989).
10. Rho, J. Y., Zioupos, P., Currey, J. D. & Pharr, G. M. Microstructural elasticity and regionalheterogeneity in human femoral bone of various ages examined by nano-indentation. J. Biomech. 35,189–198 (2002).
11. Balooch, G. et al. TGF-beta regulates the mechanical properties and composition of bone matrix.Proc. Natl Acad. Sci. 102, 18813–18818 (2005).
12. Zysset, P. K., Guo, X. E., Hoffler, C. E., Moore, K. E. & Goldstein, S. A. Elastic modulus and hardnessof cortical and trabecular bone lamellae measured by nanoindentation in the human femur.J. Biomech. 32, 1005–1012 (1999).
13. Catanese, J. 3rd, Iverson, E. P., Ng, R. K. & Keaveny, T. M. Heterogeneity of the mechanical propertiesof demineralized bone. J. Biomech. 32, 1365–1369 (1999).
14. Peterlik, H., Roschger, P., Klaushofer, K. & Fratzl, P. From brittle to ductile fracture of bone. NatureMater. 5, 52–55 (2006).
15. Phelps, J. B., Hubbard, G. B., Wang, X. & Agrawal, C. M. Microstructural heterogeneity and thefracture toughness of bone. J. Biomed. Mater. Res. 51, 735–741 (2000).
16. Jaasma, M. J., Bayraktar, H. H., Niebur, G. L. & Keaveny, T. M. Biomechanical effects ofintraspecimen variations in tissue modulus for trabecular bone. J. Biomech. 35, 237–246 (2002).
17. Fantner, G. E. et al. Sacrificial bonds and hidden length dissipate energy as mineralized fibrilsseparate during bone fracture. Nature Mater. 4, 612–616 (2005).
nature materials VOL 6 JUNE 2007 www.nature.com/naturematerials 461
Untitled-1 8 11/5/07, 4:35:10 pm

ARTICLES
18. Gao, H., Ji, B., Jager, I. L., Arzt, E. & Fratzl, P. Materials become insensitive to flaws at nanoscale:Lessons from nature. Proc. Natl Acad. Sci. USA 100, 5597–5600 (2003).
19. Gupta, H. S. et al. Nanoscale deformation mechanisms in bone. Nano Lett. 5, 2108–2111 (2005).20. Tai, K., Ulm, F.-J. & Ortiz, C. Nanogranular origins of the strength of bone. Nano Lett. 6,
2520–2525 (2006).21. Currey, J. D. Effects of differences in mineralization on the mechanical properties of bone. Phil. Trans.
R. Soc. Long B 304, 509–518 (1984).22. Currey, J. D. The effect of porosity and mineral content on the Young’s modulus elasticity of compact
bone. J. Biomech. 21, 131–139 (1988).23. You, L. D., Weinbaum, S., Cowin, S. C. & Schaffler, M. B. Ultrastructure of the osteocyte process and
its pericellular matrix. Anat. Rec. A Discov. Mol. Cell Evol. Biol. 278, 505–513 (2004).24. Tai, K., Qi, H. J. & Ortiz, C. Effect of mineral content on the nanoindentation properties and
nanoscale deformation mechanisms of bovine tibial cortical bone. J. Mater. Sci.- Mater. Med. 16,947–959 (2005).
25. Oliver, W. C. & Pharr, G. M. An improved technique for determining hardness and elastic modulususing load and displacement sensing indentation experiments. J. Mater. Res. 7, 1564–1583 (1992).
26. Giraudguille, M. M. Twisted plywood architecture of collagen fibrils in human compact-boneosteons. Calcif. Tissue Int. 42, 167–180 (1988).
27. Hofmann, T., Heyroth, F., Meinhard, H., Franzel, W. & Raum, K. Assessment of composition andanisotropic elastic properties of secondary osteon lamellae. J. Biomech. 39, 2282–2294 (2006).
28. Kazanci, M., Roschger, P., Paschalis, E. P., Klaushofer, K. & Fratzl, P. Bone osteonal tissues by Ramanspectral mapping: Orientation-composition. J. Struct. Biol. 156, 489–496 (2006).
29. Wagermaier, W. et al. Spiral twisting of fiber orientation inside bone lamellae. Biointerphases 1,1–5 (2006).
30. Ardizzoni, A. Osteocyte lacunar size–lamellar thickness relationships in human secondary osteons.Bone 28, 215–219 (2001).
31. Mallat, S. A Wavelet Tour of Signal Processing (Academic, San Diego, 1998).32. Donnelly, E., Baker, S. P., Boskey, A. L. & van der Meulen, M. C. H. Effects of surface roughness and
maximum load on the mechanical properties of cancellous bone measured by nanoindentation.J. Biomed. Mater. Res. A 77, 426–435 (2006).
33. Nalla, R. K., Kinney, J. H. & Ritchie, R. O. Mechanistic fracture criteria for the failure of humancortical bone. Nature Mater. 2, 164–168 (2003).
34. Currey, J. D. Tensile yield in compact bone is determined by strain, post-yield behaviour by mineralcontent. J. Biomech. 37, 549–556 (2004).
35. Rho, J. Y. Ultrasonic method for measuring elastic properties of human tibial cortical and cancellousbone. Ultrasonics 34, 777–783 (1996).
36. Bohm, H. J. & Han, W. Comparisons between three-dimensional and two-dimensional multi-particleunit cell models for particle reinforced metal matrix composites. Modell. Simul. Mater. Sci. Eng. 9,47–65 (2001).
37. Shen, H. & Lissenden, C. J. 3D finite element analysis of particle-reinforced aluminum. Mater. Sci.Eng. A 338, 271–281 (2002).
38. Nakamura, T. & Suresh, S. Effects of thermal residual-stresses and fiber packing on deformation ofmetal-matrix composites. Acta. Metal. Mater. 41, 1665–1681 (1993).
39. Ehrlich, P. J. & Lanyon, L. E. Mechanical strain and bone cell function: A review. Osteoporos. Int. 13,688–700 (2002).
40. You, L., Cowin, S. C., Schaffler, M. B. & Weinbaum, S. A model for strain amplification in theactin cytoskeleton of osteocytes due to fluid drag on pericellular matrix. J. Biomech. 34,1375–1386 (2001).
41. Burger, E. H. & Klein-Nulend, J. Mechanotransduction in bone—role of the lacuno-canalicularnetwork. FASEB J. 13 (suppl), S101–S112 (1999).
42. Vesenka, J., Manne, S., Giberson, R., Marsh, T. & Henderson, E. Colloidal gold particles as anincompressible atomic force microscope imaging standard for assessing the compressibility ofbiomolecules. Biophys. J. 65, 992–997 (1993).
43. Seog, J. et al. Direct measurement of glycosamnoglycan intermolecular interactions viahigh-resolution force spectroscopy. Macromolecules 35, 5601–5615 (2002).
44. Oliver, W. C. & Pharr, G. M. Measurement of hardness and elastic modulus by instrumentedindentation: Advances in understanding and refinements to methodology. J. Mater. Res. 19,3–20 (2004).
45. Pharr, W. C. O. Indentation of an elastic planar substrate by solid. J. Mater. Res. 7, 1564 (1992).46. Strang, G. & Nguyen, T. Wavelets and Filter Banks (Wellesley-Cambridge, Wellesley, MA, 1996).47. Tsai, D. M. & Hsiao, B. Automatic surface inspection using wavelet reconstruction. Pattern
Recognition 34, 1285–1305 (2001).48. Dao, M., Chollacoop, N., Van Vliet, K. J., Venkatesh, T. A. & Suresh, S. Computational modeling of
the forward and reverse problems in instrumented sharp indentation. Acta Mater. 49,3899–3918 (2001).
49. Gouldstone, A. et al. Indentation across size scales and disciplines: Recent developments inexperimentation and modeling. Acta Mater. 55, (2007, doi:10.1016/j.actamat.2006.08.044).
50. Thurner, P. et al. High-speed photography of compressed human trabecular bone correlateswhitening to microscopic damage. Eng. Fracture Mech. 74, 1928–1941 (2007).
51. Landis, W. J. The strength of a calcified tissue depends in part on the molecular structure andorganization of its constituent mineral crystals in their organic matrix. Bone 16, 533–544 (1995).
52. Wachtel, E. & Weiner, S. Small-angle X-ray scattering study of dispersed crystals from bone andtendon. J. Bone Miner. Res. 9, 1651–1655 (1994).
AcknowledgementsThe authors thank the MIT Department of Materials Science and Engineering NanomechanicalTesting Facility, The Whitaker Foundation and the US Army through the MIT Institute for SoldierNanotechnologies (contract number DAAD-19-02-D0002), and the NIH grant 1-R01-GM076689-01on multiscale modelling for funding. M.D. and S.S. also acknowledge partial support from the UnitedStates Army Research Office and the Joint Improvised Explosive Devices Defeat Organization undercontract number W911NF-07-1-0035. The content does not necessarily reflect the position of thegovernment and no official endorsement should be inferred. The authors would also like to thankgraphic artist Beryl Simon for preparation of Fig. 2g.Correspondence and requests for materials should be addressed to C.O.Supplementary Information accompanies this paper on www.nature.com/naturematerials.
Competing financial interestsThe authors declare no competing financial interests.
Reprints and permission information is available online at http://npg.nature.com/reprintsandpermissions/
462 nature materials VOL 6 JUNE 2007 www.nature.com/naturematerials
Untitled-1 9 11/5/07, 4:35:14 pm