Embed Size (px)
Citation preview
Articles
www.thelancet.com Published online December 9, 2013 http://dx.doi.org/10.1016/S0140-6736(13)62158-3 1
Effects of long-term exposure to air pollution on natural-cause mortality: an analysis of 22 European cohorts within the multicentre ESCAPE projectRob Beelen, Ole Raaschou-Nielsen, Massimo Stafoggia, Zorana Jovanovic Andersen, Gudrun Weinmayr, Barbara Hoffmann, Kathrin Wolf, Evangelia Samoli, Paul Fischer, Mark Nieuwenhuijsen, Paolo Vineis, Wei W Xun, Klea Katsouyanni, Konstantina Dimakopoulou, Anna Oudin, Bertil Forsberg, Lars Modig, Aki S Havulinna, Timo Lanki, Anu Turunen, Bente Oftedal, Wenche Nystad, Per Nafstad, Ulf De Faire, Nancy L Pedersen, Claes-Göran Östenson, Laura Fratiglioni, Johanna Penell, Michal Korek, Göran Pershagen, Kirsten Thorup Eriksen, Kim Overvad, Thomas Ellermann, Marloes Eeftens, Petra H Peeters, Kees Meliefste, Meng Wang, Bas Bueno-de-Mesquita, Dorothea Sugiri, Ursula Krämer, Joachim Heinrich, Kees de Hoogh, Timothy Key, Annette Peters, Regina Hampel, Hans Concin, Gabriele Nagel, Alex Ineichen, Emmanuel Schaffner, Nicole Probst-Hensch, Nino Künzli, Christian Schindler, Tamara Schikowski, Martin Adam, Harish Phuleria, Alice Vilier, Françoise Clavel-Chapelon, Christophe Declercq, Sara Grioni, Vittorio Krogh, Ming-Yi Tsai, Fulvio Ricceri, Carlotta Sacerdote, Claudia Galassi, Enrica Migliore, Andrea Ranzi, Giulia Cesaroni, Chiara Badaloni, Francesco Forastiere, Ibon Tamayo, Pilar Amiano, Miren Dorronsoro, Michail Katsoulis, Antonia Trichopoulou, Bert Brunekreef, Gerard Hoek
SummaryBackground Few studies on long-term exposure to air pollution and mortality have been reported from Europe. Within the multicentre European Study of Cohorts for Air Pollution Effects (ESCAPE), we aimed to investigate the association between natural-cause mortality and long-term exposure to several air pollutants.
Methods We used data from 22 European cohort studies, which created a total study population of 367 251 participants. All cohorts were general population samples, although some were restricted to one sex only. With a strictly standardised protocol, we assessed residential exposure to air pollutants as annual average concentrations of particulate matter (PM) with diameters of less than 2·5 µm (PM2·5), less than 10 µm (PM10), and between 10 µm and 2·5 µm (PMcoarse), PM2.5 absorbance, and annual average concentrations of nitrogen oxides (NO2 and NOx), with land use regression models. We also investigated two traffic intensity variables—traffic intensity on the nearest road (vehicles per day) and total traffic load on all major roads within a 100 m buffer. We did cohort-specific statistical analyses using confounder models with increasing adjustment for confounder variables, and Cox proportional hazards models with a common protocol. We obtained pooled effect estimates through a random-effects meta-analysis.
Findings The total study population consisted of 367 251 participants who contributed 5 118 039 person-years at risk (average follow-up 13·9 years), of whom 29 076 died from a natural cause during follow-up. A significantly increased hazard ratio (HR) for PM2·5 of 1·07 (95% CI 1·02–1·13) per 5 µg/m³ was recorded. No heterogeneity was noted between individual cohort effect estimates (I² p value=0·95). HRs for PM2·5 remained significantly raised even when we included only participants exposed to pollutant concentrations lower than the European annual mean limit value of 25 µg/m³ (HR 1·06, 95% CI 1·00–1·12) or below 20 µg/m³ (1·07, 1·01–1·13).
Interpretation Long-term exposure to fine particulate air pollution was associated with natural-cause mortality, even within concentration ranges well below the present European annual mean limit value.
Funding European Community’s Seventh Framework Program (FP7/2007–2011).
IntroductionStudies have shown the effects of long-term exposure to air pollution on mortality,1,2 with most, especially those in the USA, reporting on the mass concentration of particulate matter (PM) smaller than 10 µm (PM10) or 2·5 µm (PM2·5) in diameter. Few European studies have investigated PM2·5, partly because of the low availability of routine monitoring data. However, some European studies have shown associations between mortality and nitrogen dioxide (NO2) or nitrogen oxides (NOx).3–8
In urban areas, NO2, NOx, and PM2·5 absorbance (a marker for black carbon or soot) have larger spatial concentration contrasts than PM because they are more
closely related to motorised traffic. Interest in the health effects of coarse particles (2·5–10 µm in diameter) has also increased.9 However, the comparability of previous studies is limited by the different exposure methods used.10
In the framework of the multicentre European Study of Cohorts for Air Pollution Effects (ESCAPE), we added standardised exposure assessment for PM, NO2, and NOx to health data from 22 ongoing cohort studies across Europe. The objective of ESCAPE was to investigate the association between long-term exposure to air pollution and mortality. In this Article, we report associations for natural-cause mortality. Cause-specific results will be published separately.
Published Online December 9, 2013 http://dx.doi.org/10.1016/S0140-6736(13)62158-3
See Online/Comment http://dx.doi.org/10.1016/S0140-6736(13)62570-2
Institute for Risk Assessment Sciences, Utrecht University, Utrecht, Netherlands (R Beelen PhD, M Eeftens MSc, K Meliefste BSc, M Wang MSc, Prof B Brunekreef PhD, G Hoek PhD); Danish Cancer Society Research Center, Copenhagen, Denmark (O Raaschou-Nielsen PhD, Z J Andersen PhD, K T Eriksen PhD); Department of Epidemiology, Lazio Regional Health Service, Rome, Italy (M Stafoggia MSc, G Cesaroni MSc, C Badaloni MSc, F Forastiere MD); Center for Epidemiology and Screening, Department of Public Health, University of Copenhagen, Copenhagen, Denmark (Z J Andersen); Institute of Epidemiology and Medical Biometry, Ulm University, Ulm, Germany (G Weinmayr PhD, Prof G Nagel PhD); IUF – Leibniz Research Institute for Environmental Medicine, Germany and Medical Faculty, University of Düsseldorf, Düsseldorf, Germany (G Weinmayr, Prof B Hoffman MD, D Sugiri MSc, Prof U Krämer PhD); Institute of Epidemiology II, Helmholtz Zentrum München, German Research Center for Environmental Health, Neuherberg, Germany (K Wolf PhD, Prof A Peters PhD, R Hampel PhD); Department of Hygiene, Epidemiology and Medical
Articles
2 www.thelancet.com Published online December 9, 2013 http://dx.doi.org/10.1016/S0140-6736(13)62158-3
Statistics, Medical School, University of Athens, Athens,
Greece (E Samoli PhD, Prof K Katsouyanni PhD,
K Dimakopoulou MSc); National Institute for Public Health and
the Environment, Bilthoven, Netherlands (P Fischer MSc,
Prof B Bueno-de-Mesquita PhD); Centre for Research in
Environmental Epidemiology (CREAL), Parc de Recerca Biomèdica de Barcelona,
Barcelona, Spain (M Nieuwenhuijsen PhD);
Consortium for Biomedical Research in Epidemiology and
Public Health (CIBER en Epidemiología y Salud Pública-
CIBERESP), Madrid, Spain (M Nieuwenhuijsen,
I Tamayo MSc, P Amiano MSc, M Dorronsoro MD); MRC-HPA Centre for Environment and
Health, Department of
MethodsProceduresWe analysed the association between natural-cause mortality and air pollution in each cohort separately with a common statistical protocol and STATA script, which was explained in a training workshop for all local analysts. We sent cohort-specific results to the co-ordinating institute (Institute for Risk Assessment Sciences, Utrecht University, Netherlands) for central assessment (see appendix pp 1–9 for more details). We combined cohort-specific effect estimates by random-effects meta-analysis. Pooling of the cohort data was not possible because of data transfer and privacy issues.
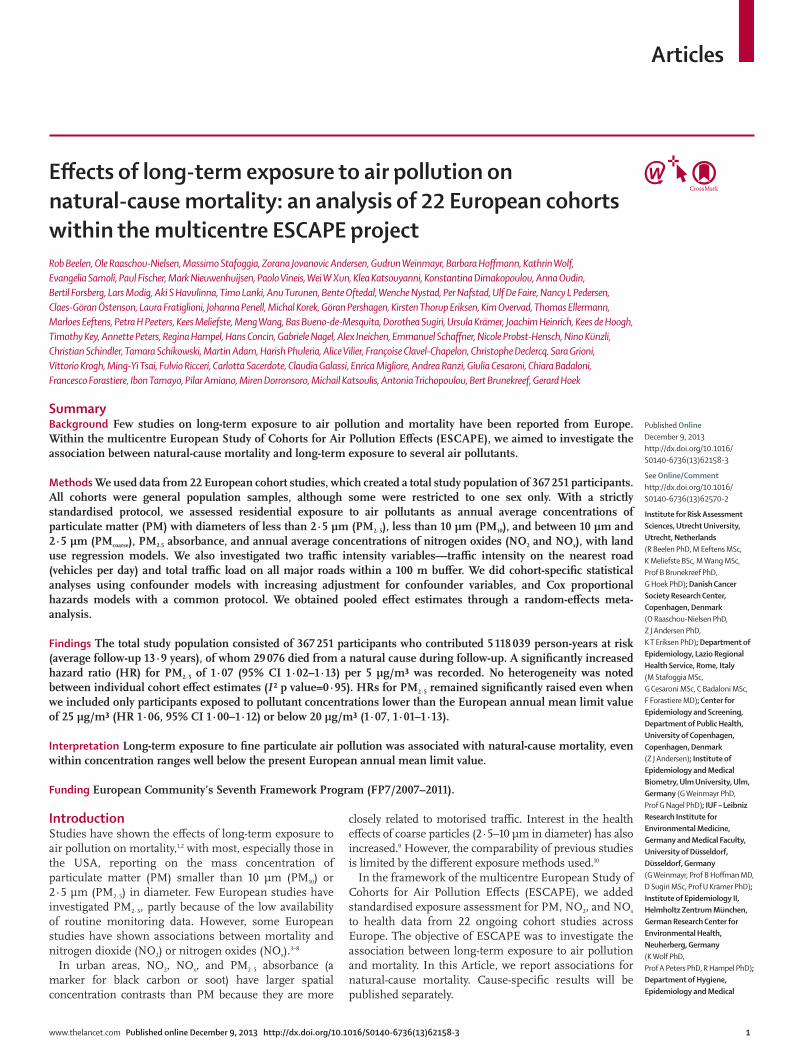
Study populationsWe selected 22 cohorts from 13 countries across Europe (table 1 and appendix pp 1–9). All cohorts were samples from the general population. The study areas of most cohorts were a large city with surrounding smaller rural communities. Some cohorts included large regions of the
country, such as EPIC-MORGEN in the Netherlands, EPIC-Oxford (which covered much of the UK), the VHM&PP cohort in Austria, and SAPALDIA in three cities in Switzerland. All included cohort studies were approved by the institutional medical ethics committees and undertaken in accordance with the Declaration of Helsinki. Each cohort study followed the rules for ethics and data protection set up in the country in which they were based.
Mortality outcome definitionIn all cohorts, follow-up was based on linkage to mortality registries. Natural-cause mortality was defined on the basis of the underlying cause of death recorded on death certificates as International Classification of Diseases (ICD)-9 codes 001–779 and ICD-10 codes A00–R99. We excluded causes of death not conceivably related to air pollution exposure, such as injury, accidents, and suicide, which account for roughly 5% of total deaths in general.
Total n* Deaths from natural mortality
Mean age at baseline, years (SD)
Baseline period
Total follow-up time in person-years (mean per observation)
Study area description
EPIC-Umeå, Sweden 22 136 912 46·0 (10·2) 1992–96 281 711 (12·7) City of Umeå and surrounding rural areas
FINRISK, Finland 10 224 602 47·9 (13·2) 1992, 1997, 2002, 2007
108 434 (10·6) Greater Helsinki area and Turku city and its rural surroundings
HUBRO, Norway 18 102 1182 48·3 (15·2) 2000–01 173 798 (9·6) City of Oslo
SNAC-K, Sweden 2401 395 70·3 (8·1) 2001–04 15 568 (6·5) City of Stockholm
SALT/Twin gene, Sweden 5473 581 58·0 (9·9) 1998–2002 47 767 (8·7) Stockholm County
60-y/IMPROVE, Sweden 3612 303 60·4 (0·1) 1997–99 40 612 (11·2) Stockholm County
SDPP, Sweden 7408 248 47·1 (5·0) 1992–98 102 831 (13·9) Stockholm County
DCH, Denmark 35 458 3770 56·7 (4·4) 1993–97 469 571 (13·2) City of Copenhagen and surrounding areas
EPIC-MORGEN, Netherlands 16 446 795 43·9 (10·9) 1993–97 217 722 (13·2) Cities of Amsterdam, Maastricht, and Doetinchem, and surrounding rural areas
EPIC-PROSPECT, Netherlands 15 670 1269 57·7 (6·0) 1993–97 202 809 (12·9) City of Utrecht and surrounding rural areas
SALIA, Germany 4352 618 54·5 (0·6) 1985–87, 1990–94
81 093 (18·6) Areas in the cities of Dortmund, Duisburg, Essen, Gelsenkirchen, and Herne situated in the Ruhr area, and the adjacent towns of Borken and Dülmen
EPIC-Oxford, UK 38 941 2185 45·8 (13·7) 1993–2001 491 542 (12·6) Urban and rural areas in a buffer of 400 km around London/ Oxford area
KORA, Germany 8399 673 49·5 (13·8) 1994–95, 1999–2001
88 592 (10·5) City of Augsburg and two adjacent rural counties
VHM&PP, Austria 117 824 13 081 41·9 (14·9) 1985–2005 2 039 328 (17·3) State of Vorarlberg, excluding high mountain areas (>600 m above sea level) and areas within 300 m of the state border
SAPALDIA, Switzerland† 3473 (1250) 201 (65) 41·1 (11·8) 1991 55 935 (16·1)(20 294 [16·2])
Cities of Geneva, Lugano, and Basel
E3N, France† 14 313 (10 915)
661 (516) 53·0 (6·7) 1993–96 192 761 (13·5)(147 021 [13·5])
Cities of Paris, Grenoble, Lyon, and Marseille and surrounding rural areas
EPIC-Varese, Italy 9871 323 51·7 (8·3) 1993–97 111 415 (11·3) City of Varese and surrounding rural areas
EPIC-Turin, Italy 7261 302 50·4 (7·5) 1993–98 97 549 (13·4) City of Turin
SIDRIA-Turin, Italy 5054 129 44·2 (6·2) 1999 55 667 (11·0) City of Turin
SIDRIA-Rome, Italy 9177 239 44·3 (6·0) 1999 102 856 (11·2) City of Rome
EPIC-San Sebastian, Spain 7464 352 49·4 (7·7) 1992–95 93 626 (12·5) City of San Sebastian and surrounding area in Basque Country
EPIC-Athens, Greece 4192 255 49·4 (11·7) 1994–99 46 852 (11·2) Greater Athens area
The order of studies in the table follows a north to south gradient. *Number of observations without missing value in any confounder variable of model 3 (main model). †Italicised numbers in brackets in these rows represent observations for which particulate matter data were available.
Table 1: Description of the included cohort studies
Articles
www.thelancet.com Published online December 9, 2013 http://dx.doi.org/10.1016/S0140-6736(13)62158-3 3
Epidemiology and Biostatistics, Imperial College London, St Mary’s Campus, London, UK (Prof P Vineis MD, W W Xun MSc, K de Hoogh PhD); CeLSIUS, University College London, London, UK (W W Xun); Division of Occupational and Environmental Medicine, Department of Public Health and Clinical Medicine, Umeå University, Umeå, Sweden (A Oudin PhD, Prof B Forsberg PhD, L Modig PhD); Department of Chronic Disease Prevention, National Institute for Health and Welfare, Helsinki, Finland (A S Havulinna DSc [tech]); Department of Environmental Health, National Institute for Health and Welfare, Kuopio, Finland (T Lanki PhD, A Turunen PhD); Division of Environmental Medicine, Norwegian Institute of Public Health, Oslo, Norway (B Oftedal PhD, Prof W Nystad PhD, Prof P Nafstad MD); Institute of
Exposure assessmentWe estimated air pollutant concentrations at the baseline residential addresses of study participants with land use regression models and a standardised procedure, which is described elsewhere.11,12 Briefly, air pollution was monitored between October, 2008, and May, 2011 in all study areas to obtain annual average concentrations of NO2, NOx, PM2·5, and PM10, and PM2·5 absorbance.13,14 The concentration of PMcoarse was calculated as the concentration of PM10 minus that of PM2·5. PM measurements were restricted to 19 of the 22 study areas for budgetary reasons (appendix pp 10–12). Land use regression models were developed to explain the spatial variation of measured annual average air pollution concentrations within each area. Depending on cohort, the models explained 57–89% of the variability in the annual average concentrations of PM2·5, 67–90% of that for PM10, 44–81% of that for PMcoarse, 56–97% of that for PM2·5 absorbance, 58–90% of that for NO2, and 49–91% of that for NOX (appendix pp 10–12). We then used the results of the land use regression models to estimate ambient air pollution concentration at the participants’ baseline addresses. In addition to pollutant concentrations, we also used traffic intensity on the nearest road (vehicles per day) and total traffic load (intensity multiplied by length) on all
major roads within a 100 m buffer as indicators of exposure to pollution. We analysed these traffic variables separately to identify the effects of living near busy roads for comparison with previous studies.3 Appendix pp 10–12 shows a detailed description of exposure assessment procedures, including back-extrapolation of concentrations to the baseline year and fit of land use regression models.
Statistical analysesCohort-specific analysesWe used Cox proportional hazards models for the cohort-specific analyses. We used age as the timescale because of evidence of better adjustment for potential con-founding by age.15 Censoring was done at the time of death for non-natural causes, emigration, loss to follow-up for other reasons, or at end of follow-up, whichever came first. We analysed air pollution exposure as a linear variable. Potential confounders were available from questionnaires at baseline. We specified three confounder models a priori, with an increasing amount of adjustment from model 1 to model 3. These models were decided on the basis of previous cohort studies of air pollution and mortality and the availability of data for most of the cohorts. Model 1 included only age (time axis), sex, and
% women % never smokers
Mean number of cigarettes per day (SD)
Mean years of smoking, mean (SD)
Mean BMI, kg/m² (SD)
Fruit intake* Alcohol intake†
% married or living with partner
% low educational level
% employed or self-employed
EPIC-Umeå, Sweden 52·2% 62·0% 2·4 (5·6) 8·8 (13·0) 25·0 (4·0) 163·0 (132·6) 3·2 (4·0) 82·3% 28·0% 85·4%
FINRISK, Finland 53·8% 45·4% 3·8 (7·8) 8·6 (12·2) 26·4 (4·6) 66·3% 0·9 (1·3) 70·1% 31·0% 69·2%
HUBRO, Norway 56·1% 45·9% 6·8 (8·4) 11·6 (14·4) 25·7 (4·1) 39·9% 50·8% 49·8% 17·6% 73·4%
SNAC-K, Sweden 60·0% 44·3% 7·1 (9·5) 9·8 (15·2) 26·0 (4·1) NA 21·8% 54·2% 21·2% 28·6%
SALT/Twin gene, Sweden 55·7% 38·7% 8·5 (9·7) 16·7 (17·3) 28·6 (4·1) NA NA 68·0% 21·5% NA
60-y/IMPROVE, Sweden 52·5% 41·0% 8·0 (9·1) 15·2 (16·4) 26·8 (4·2) 64·2% 8·9 (9·7) 71·6% 27·5% 51·4%
SDPP, Sweden 61·7% 37·4% 8·5 (8·8) 12·3 (12·4) 25·6 (4·0) 92·4% 1·3 (1·9) 83·6% 25·5% 91·8%
DCH, Denmark 54·1% 36·3% 6·3 (10·4) 18·7 (17·1) 26·0 (4·1) 183·2 (151·2) 21·7 (22·8) 69·2% 29·6% 80·1%
EPIC-MORGEN, Netherlands 54·4% 35·0% 10·4 (11·1) 14·3 (13·7) 25·2 (4·0) 171·9 (129·2) 12·7 (18·0) 67·7% 11·9% NA
EPIC-PROSPECT, Netherlands 100% 45·0% 5·7 (7·4) 15·2 (16·5) 25·5 (4·1) 231·6 (139·2) 9·0 (12·4) 76·9% 22·2% NA
SALIA, Germany 100% 74·5% 2·6 (6·6) 4·4 (10·5) NA NA NA NA 28·8% NA
EPIC-Oxford, UK 77·5% 63·3% 5·0 (8·3) 6·7 (11·2) 24·0 (3·9) 259·9 (204·5) 9·1 (11·7) 70·8% 36·5% 72·5%
KORA, Germany 50·8% 43·7% 9·2 (13·3) 12·0 (14·2) 27·2 (4·6) 59·5% 16·3 (22·3) 75·7% 12·6% 58·3%
VHM&PP, Austria 56·1% 69·9% NA NA 24·8 (4·3) NA NA 68·4% NA 69·3%
SAPALDIA, Switzerland 52·0% 42·4% 11·5 (14·5) 10·7 (12·4) 23·7 (4·0) NA NA 54·3% 15·0% 84·4%
E3N, France 100% 49·3% NA NA 22·8 (3·2) 242·0 (164·7) 12·0 (15·1) NA 5·0% NA
EPIC-Varese, Italy 86·0% 59·7% 4·0 (6·4) 9·4 (13·3) 25·7 (4·2) 303·8 (172·2) 11·4 (15·7) 86·9% 61·1% NA
EPIC-Turin, Italy 47·7% 42·6% 7·2 (8·2) 17·6 (16·3) 25·3 (3·8) 318·2 (182·2) 18·1 (20·3) 85·6% 43·6% NA
SIDRIA-Turin, Italy 51·8% 37·5% 9·3 (10·2) 11·3 (10·6) NA NA NA 95·4% 17·5% 72·2%
SIDRIA-Rome, Italy 52·8% 34·6% 10·1 (10·5) 11·7 (10·4) NA NA NA 100% 44·9% NA
EPIC-San Sebastian, Spain 53·6% 53·9% 6·9 (10·0) 11·4 (14·3) 27·3 (3·9) 330·2 (258·5) 18·3 (24·0) 87·5% 70·6% NA
EPIC-Athens, Greece 55·0% 39·5% 1·7 (15·0) 10·8 (13·1) 27·5 (4·5) 402·6 (258·2) 9·2 (14·5) 78·0% 23·6% 66·9%
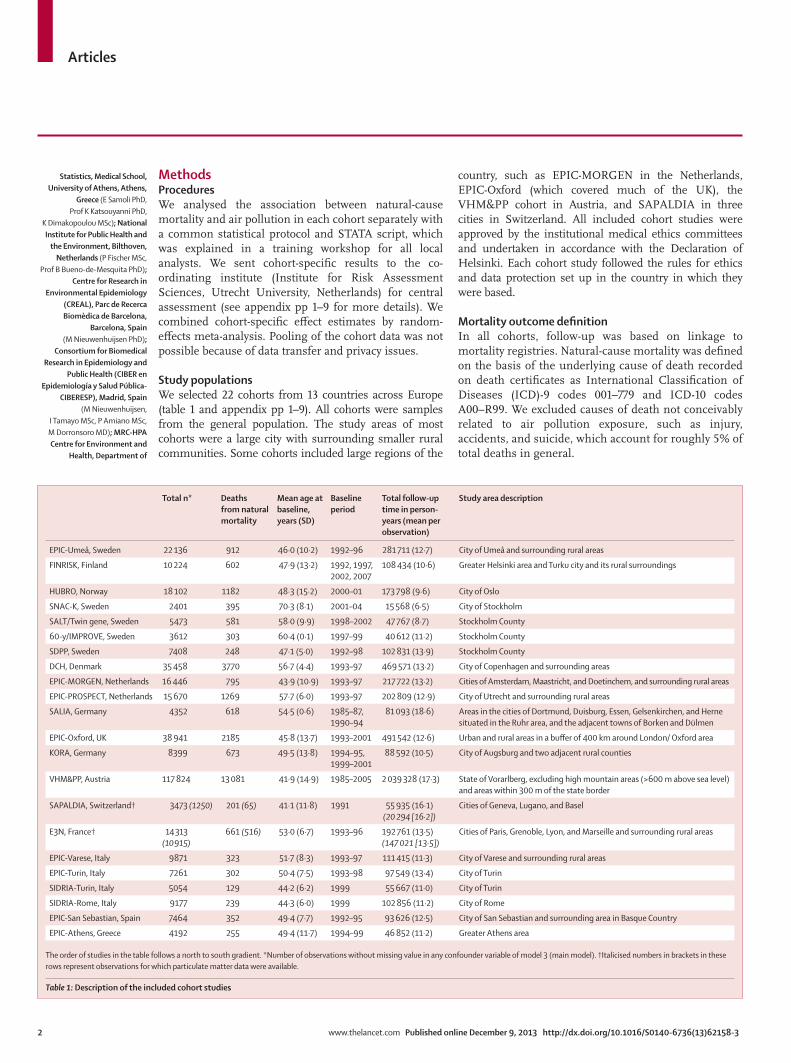
The order of studies in the table follows a north to south gradient. A detailed description of each cohort is in appendix pp 13–34. BMI=body-mass index. *Mean (SD) grams per day, or percentage of people with daily fruit consumption. For the SDPP cohort, the value is the percentage of people with daily or weekly fruit consumption. †Mean (SD) grams per day, or percentage of people with daily alcohol consumption. For the FINRISK cohort, the value is the number of glasses of alcoholic drink in the past week. For the SDPP cohort, the value is the number of glasses of alcoholic drink per day. For the HUBRO cohort, the value is the percentage of participants with weekly alcohol consumption. NA=not available or available with a large amount of missing data (eg, BMI in SALIA and smoking variables in E3N).
Table 2: Population characteristics at baseline of the included cohort studies (based on number of observations in main confounder model 3)

Articles
4 www.thelancet.com Published online December 9, 2013 http://dx.doi.org/10.1016/S0140-6736(13)62158-3
calendar time (year[s] of enrolment). Model 2 added individual level variables: smoking status (never, former, or current), smoking intensity, smoking duration, environmental tobacco smoke, intake of fruit and vegetables, alcohol consumption (linear and squared term), body-mass index (BMI; linear and squared term), educational level (low, medium, or high), occupational class (white or blue collar classification), employment status, and marital status. Model 3 added area-level socio-economic status variables (mostly mean income of the neighbourhood or municipality).
We chose model 3 as the main confounder model. Only participants with complete information for this model’s variables were included in the main analyses.
Threshold analyses were done by consecutively including participants who had exposure estimates below prespecified thresholds in the analyses (eg, starting at 25 µg/m³ [the European annual mean limit value], 20 µg/m³, 15 µg/m³, and 10 µg/m³ for PM2·5). Con centrations based on the ESCAPE measurement period were used for these threshold analyses. We studied the shape of the association between each pollutant and mortality within each cohort by inputting the exposure term as a natural cubic spline with three
N* PM2·5, µg/m³, mean (SD)
PM2·5 absorbance, 10–5 m–1 , mean (SD)
PM10, µg/m³, mean (SD)
PMcoarse, µg/m³, mean (SD)
NO2, µg/m³, mean (SD)
NOx, µg/m³, mean (SD)
Traffic intensity on nearest road, motor vehicles per day, mean (SD)
Traffic intensity on major roads within 100 m buffer, motor vehicles* km/day, mean (SD)
EPIC-Umeå, Sweden 22 136 NA NA NA NA 5·2 (2·5) 8·7 (5·7) 845 (1523) 102 (418)
FINRISK, Finland 10 224 7·7 (1·1) 0·9 (0·2) 14·0 (3·1) 6·6 (2·3) 15·3 (4·8) 24·2 (8·8) 1663 (4393) 630 (1517)
HUBRO, Norway 18 102 8·9 (1·3) 1·2 (0·3) 13·5 (3·1) 4·0 (2·0) 20·9 (8·0) 38·2 (15·4) 2494 (5069) 822 (1844)
SNAC-K, Sweden 2401 7·9 (1·3) 0·8 (0·2) 16·3 (6·0) 8·5 (4·7) 17·3 (4·8) 33·2 (12·3) 3597 (8847) 2260 (3593)
SALT/Twin gene, Sweden 5473 7·3 (1·3) 0·6 (0·2) 15·0 (3·9) 7·3 (3·0) 10·9 (4·2) 18·9 (9·3) 1471 (3400) 576 (1596)
60-y/IMPROVE, Sweden 3612 7·2 (1·3) 0·6 (0·2) 15·0 (3·8) 7·3 (2·9) 10·7 (4·2) 18·6 (9·4) 1459 (3519) 509 (1449)
SDPP, Sweden 7408 6·6 (1·2) 0·5 (0·1) 13·7 (3·2) 6·3 (2·4) 8·4 (1·7) 14·4 (3·2) 857 (1591) 109 (421)
DCH, Denmark 35 458 11·3 (0·9) 1·2 (0·2) 17·1 (1·9) 5·7 (1·0) 16·3 (7·0) 26·6 (18·3) 2977 (7207) 1266 (1908)
EPIC-MORGEN, Netherlands 16 446 16·9 (0·6) 1·4 (0·2) 25·4 (1·7) 8·6 (1·1) 23·8 (7·0) 36·5 (11·8) 1543 (4092) 920 (1983)
EPIC-PROSPECT, Netherlands 15 670 16·8 (0·5) 1·4 (0·2) 25·3 (1·2) 8·5 (0·7) 26·7 (4·6) 39·6 (10·5) 1029 (3458) 686 (1532)
SALIA, Germany 4352 18·0 (1·4) 1·5 (0·4) 27·3 (2·2) 9·8 (1·7) 30·0 (7·8) 50·7 (20·4) 2110 (5005) 846 (1981)
EPIC-Oxford, UK 38 941 9·8 (1·1) 1·1 (0·3) 16·1 (2·0) 6·4 (0·9) 24·4 (7·9) 40·8 (15·6) 1386 (4324) 374 (1289)
KORA, Germany 8399 13·6 (0·9) 1·7 (0·2) 20·3 (2·4) 6·2 (1·1) 18·7 (3·9) 32·6 (7·4) 1645 (3607) 450 (1133)
VHM&PP, Austria 117 824 13·6 (1·2) 1·7 (0·2) 20·6 (2·4) 6·7 (0·9) 19·9 (5·5) 40·0 (9·6) 1694 (3616) 297 (1000)
SAPALDIA, Switzerland 3473 (1250) 17·3 (1·6) 2·0 (0·4) 24·0 (2·3) 6·8 (1·2) 28·8 (6·1) 48·7 (13·6) 3478 (5438) 1099 (2095)
E3N, France 14 313 (10 915) 15·0 (1·9) 1·8 (0·7) 25·3 (4·2) 8·5 (2·6) 30·5 (12·7) 55·6 (28·2) 6529 (8271) 1228 (2758)
EPIC-Varese, Italy 9871 NA NA NA NA 43·7 (17·3) 86·6 (41·9) NA NA
EPIC-Turin, Italy 7261 30·1 (1·7) 3·1 (0·4) 46·4 (4·2) 16·4 (2·7) 53·1 (10·8) 96·1 (21·0) 3905 (9195) 466 (914)
SIDRIA-Turin, Italy 5054 31·0 (1·7) 3·2 (0·4) 48·1 (4·1) 17·0 (2·5) 59·8 (10·5) 107·3 (24·1) 4271 (10 184) 805 (1372)
SIDRIA-Rome, Italy 9177 19·4 (1·8) 2·7 (0·5) 36·5 (5·0) 16·7 (3·4) 39·1 (9·1) 82·1 (23·9) 2965 (6758) 1414 (2847)
EPIC-San Sebastian, Spain 7464 NA NA NA NA 23·8 (6·6) 47·1 (12·5) NA 673 (2614)
EPIC-Athens, Greece 4192 20·4 (2·6) 2·3 (0·5) 45·2 (13·7) 20·7 (2·6) 37·9 (13·7) 75·2 (40·8) 9034 (12 466) 11 000 (15 000)
NA=not available. *Number of observations without missing values in any confounder variable of model 3 (main model). Numbers in brackets in this column represent observations for which particulate matter data were available.
Table 3: Descriptions of the different pollutants and two traffic intensity indicators at participant addresses in each cohort
Figure 1: Description of exposure to PM2·5 concentration (µg/m³) at participant addresses in each cohortPM concentrations not available for the EPIC-Umeå, EPIC-Varese, or EPIC-San Sebastian cohorts. The boundary of the box closest to 0 indicates the 25th percentile, the line within the box marks the median, and the boundary of the box furthest from 0 indicates the 75th percentile. Whiskers (error bars) above and below the box indicate the 90th and 10th percentiles. The blue circles are individual points between the minimum and 10th percentile and between the 90th percentile and the maximum. PM=particulate matter.
0 5 10 15 20 25 30 35 40
FINRISKHUBROSNAC-K
SALT/Twin gene60-yr/IMPROVE
SDPPDCH
EPIC-MORGENEPIC-PROSPECT
SALIAEPIC-Oxford
KORAVHM&PP
SAPALDIAE3N
EPIC-TurinSIDRIA-Turin
SIDRIA-RomeEPIC-Athens
Coho
rt
PM2·5 concentration (μg/m3)

Articles
www.thelancet.com Published online December 9, 2013 http://dx.doi.org/10.1016/S0140-6736(13)62158-3 5
Health and Society, University of Oslo, Oslo, Norway (P Nafstad); Institute of Environmental Medicine (Prof U De Faire PhD, J Penell PhD, M Korek MSc, Prof G Pershagen MD), Department of Medical Epidemiology and Biostatistics (Prof N L Pedersen PhD), Department of Molecular Medicine and Surgery (Prof C-G Östenson PhD), and Ageing Research Center, Department of Neurobiology, Care Sciences and Society (L Fratiglioni PhD), Karolinska Institutet, Stockholm, Sweden; Section for Epidemiology, Department of Public Health, Aarhus University, Aarhus C, Aarhus, Denmark (K Overvad PhD); Department of Environmental Science, Aarhus University, Roskilde, Denmark (T Ellermann PhD); Department of Epidemiology, Julius Centre for Health Sciences and Primary Care, University Medical Centre Utrecht, Utrecht, Netherlands (Prof P H Peeters PhD, B Brunekreef); Department of Epidemiology and Biostatistics, School of Public Health, Faculty of Medicine, Imperial College, London, UK (P H Peeters); Institute of Epidemiology I, Helmholtz Zentrum München, German Research Centre of Environmental Health, Neuherberg, Germany (J Heinrich PhD); Cancer Epidemiology Unit, Nuffield Department of Clinical Medicine, University of Oxford, Oxford, UK (Prof T Key DPhil); Agency for Preventive and Social Medicine, Bregenz, Austria (H Concin MD, G Nagel); Swiss Tropical and Public Health Institute, Basel, Switzerland (A Ineichen BSc, E Schaffner MSc, Prof N Probst-Hensch PhD, Prof N Künzli PhD, C Schindler PhD, T Schikowski PhD, M Adam PhD, H Phuleria PhD, M-Y Tsai PhD); University of Basel, Basel, Switzerland (A Ineichen, E Schaffner, N Probst-Hensch, N Künzli, C Schindler, T Schikowski, M Adam, H Phuleria, M-Y Tsai); Inserm, Centre for Research in Epidemiology and Population Health, U1018, Nutrition, Hormones and Women’s Health Team, Villejuif, France
equally spaced inner knots, and by comparing the model fit of the linear and the spline models through a likelihood-ratio test.
To disentangle the effects of different pollutants, we included two pollutants simultaneously in an analysis. We did these two-pollutant models for PM2·5, PMcoarse, and NO2, and limited them to cohort study areas for which the estimated correlation between two pollutants at the participant addresses was less than 0·7.
In sensitivity analyses, we added prevalent hyper ten-sion, physical activity, and two additional classical cardio-vascular risk factors—prevalent diabetes and cholesterol concentration—to model 3. We used extended confounder models in sensitivity analyses because some potential effects of air pollution might be mediated by these factors.
We used stratified analyses to investigate effect modification by prespecified variables: age during follow-up (<60, 60–75, or ≥75 years), sex, smoking status, educational level, fruit intake (<150, 150–300, or ≥300 g per day), and BMI (<25, 25–30, or ≥30 kg/m²).
We tested whether back-extrapolation of the con cen-trations to the baseline year had any effect on the results. We did sensitivity analyses restricted to participants who did not move during follow-up. We used random effects of the spatial area units in each cohort to check for spatial clustering of residuals of the models.
All cohort-specific analyses were done in STATA versions 10–12, except for models with random effects, for which we used R software, version 2.11–2.15.
Meta-analysisWe did meta-analyses of cohort-specific effect estimates with the DerSimonian-Laird method with random effects.16 We calculated hazard ratios (HRs) and 95% CIs for fixed increments that were chosen to cover the range
in concentrations within the different cohorts and to keep increments broadly comparable between pollutants. We analysed the two traffic indicator variables in com-bination with background NO2 concentration.
We quantified heterogeneity between cohorts by the I² statistic and tested it with the χ² test from Cochran’s Q statistic.17
We tested effect modification with a meta-analysis of the pooled estimates from the different strata and by computing the χ² test of heterogeneity. We investigated whether effect estimates differed for cohorts for which the amount of variance explained by the land use regression model cross-validation was smaller or larger than 60% (since 60% was assumed to be an acceptable amount of explained variance, and the median explained variance by cross-validation was 62%).
All tests were two-sided and p values less than 0·05 were judged to be significant. We used STATA version 12.1 for all meta-analyses.
Role of the funding sourceThe sponsor of the study had no role in study design, data collection, data analysis, data interpretation, or writing of the report. The authors had full access to all the data in the study and had final responsibility for the decision to submit for publication.
ResultsThe total study population consisted of 367 251 par-ticipants contributing 5 118 039 person-years at risk (average follow-up 13·9 years [range 6·5–18·6 years]), of whom 29 076 died from natural causes during follow-up (table 1). Cohorts were mainly recruited in the 1990s, and differed in the number of participants, the mean base line age, availability of confounders, and percentage
Number of cohorts
Model 1* Model 2* Model 3* p value for model 3
I² (p value)†
PM2·5 19‡ 1·18 (1·08–1·30) 1·09 (1·03–1·14) 1·07 (1·02–1·13) 0·02 0 (0·95)
PM2·5 absorbance 19‡ 1·11 (1·04–1·18) 1·04 (0·99–1·09) 1·02 (0·97–1·07) 0·38 0 (0·99)
PM10 19‡ 1·12 (1·03–1·21) 1·05 (1·01–1·10) 1·04 (1·00–1·09) 0·08 0 (0·61)
PMcoarse 19‡ 1·14 (1·03–1·26) 1·05 (0·99–1·12) 1·04 (0·98–1·10) 0·22 32·3 (0·09)
NO2 22 1·06 (1·02–1·10) 1·02 (0·99–1·04) 1·01 (0·99–1·03) 0·18 0·7 (0·45)
NOx 22 1·06 (1·03–1·09) 1·03 (1·00–1·05) 1·02 (1·00–1·04) 0·08 22·1 (0·17)
Traffic intensity on the nearest road 20§ 1·02 (1·00–1·03) 1·01 (0·99–1·02) 1·01 (1·00–1·03) 0·19 20·4 (0·20)
Traffic intensity on major roads within 100 m buffer 21|| 1·03 (1·00–1·07) 1·02 (0·98–1·05) 1·01 (0·98–1·05) 0·49 28·4 (0·11)
Data are HR (95% CI), unless indicated otherwise. HRs are presented for the following increments: 5 µg/m³ for PM2·5, 10⁻⁵ m⁻¹ for PM2·5 absorbance, 10 µg/m³ for PM10, 5 µg/m³ for PMcoarse, 10 µg/m³ for NO2, 20 µg/m³ for NOx, 5000 motor vehicles per day for the traffic intensity on the nearest road, and 4 000 000 motor vehicles*m per day for the total traffic load on all major roads within a 100 m buffer. Only observations with complete information for model 3 variables were included in the analyses. The number of observations in particulate matter and NO2 or NOx analyses were the same for the different confounder models: 322 159 and 367 251, respectively. HR=hazard ratio. *Model 1 was adjusted for sex and calendar time; model 2 was adjusted as in model 1, but also adjusted for smoking status, smoking intensity, smoking duration, environmental tobacco smoke, fruit intake, vegetables intake, alcohol consumption, body-mass index (BMI), educational level, occupational class, employment status, and marital status; and model 3 was adjusted as in model 2 but also adjusted for area-level socioeconomic status. †I² and Cochran’s test for heterogeneity for model 3 of effect estimates between cohorts. ‡Particulate matter not available for EPIC-Umeå, EPIC-Varese, and EPIC-San Sebastian. For E3N and SAPALDIA, particulate matter was available for part of the cohort (see table 3). §Not available for EPIC-Varese and EPIC-San Sebastian. ||Not available for EPIC-Varese.
Table 4: Results of random-effects meta-analyses for the association between natural cause mortality and exposure to air pollution and traffic intensity indicators (using main confounder models 1, 2, and 3)

Articles
6 www.thelancet.com Published online December 9, 2013 http://dx.doi.org/10.1016/S0140-6736(13)62158-3
(A Vilier MSc, F Clavel-Chapelon PhD);
University Paris Sud, UMRS 1018, F-94805, Villejuif, France
(A Vilier, F Clavel-Chapelon); Institut Gustave Roussy,
F-94805, Villejuif, France (A Vilier, F Clavel-Chapelon); French Institute for Public
Health Surveillance (InVS), Saint-Maurice, France
(C Declercq MD); Epidemiology and Prevention Unit,
Fondazione IRCCS Istituto Nazionale dei Tumori, Milan,
Italy (S Grioni BSc, V Krogh MD); Department of Environmental
and Occupational Health Sciences, University of
Washington, Seattle, WA, USA (M-Y Tsai); Human Genetics Foundation – HuGeF, Turin, Italy (F Ricceri PhD); Unit of
Cancer Epidemiology, AO Citta’ della Salute e della
Scienza-University of Turin and Centre for Cancer Prevention,
Turin, Italy (C Sacerdote PhD, C Galassi MD, E Migliore MSc);
Environmental Health Reference Centre—Regional
Agency for Environmental Prevention of Emilia-Romagna,
Modena, Italy (A Ranzi PhD); Public Health Division of
Gipuzkoa, Basque Government, Gipuzkoa, Spain (I Tamayo,
P Amiano, M Dorronsoro); and Hellenic Health Foundation,
Athens, Greece (M Katsoulis MSc,
Prof A Trichopoulou PhD)
Correspondence to: Dr Rob Beelen, Institute for Risk
Assessment Sciences, Utrecht University, PO Box 80178,
3508 TD Utrecht, Netherlands [email protected]
See Online for appendix
Figure 2: Adjusted association between natural cause mortality and exposure to PM2·5 and NO2 (with main model 3)—results from cohort-specific analyses and random-effects meta-analyses(A) Exposure to PM2·5. (B) Exposure to NO2. HR=hazard ratio. HRs are presented per 5 µg/m³ for PM2·5 and per 10 µg/m³ for NO2. The number of observations was 322 159 in the PM2·5 analysis and 367 251 in the NO2 analysis. Particulate matter concentrations were not available for the EPIC-Umeå, EPIC-Varese, or EPIC-San Sebastian cohorts. For E3N and SAPALDIA, particulate matter concentrations were available for part of the cohort.
FINRISK
HUBRO
SNAC-K
SALT/Twin gene
60-yr/IMPROVE
SDPP
DCH
EPIC-MORGEN
EPIC-PROSPECT
SALIA
EPIC-Oxford
KORA
VHM&PP
SAPALDIA
E3N
EPIC-Turin
SIDRIA-Turin
SIDRIA-Rome
EPIC-Athens
Random-effects meta-analysis
2·20
5·44
1·77
2·04
1·30
0·75
5·14
0·86
1·04
2·75
4·93
1·53
54·34
0·42
5·32
2·21
1·02
1·91
5·04
1·07 (95% CI 1·02–1·13)
Cohort
HR (95% CI) Weight (%)
1·00 2·0 2·5 3·0 3·51·50·5
Higher mortality with higher air pollutionLess mortality with higher air pollution
APM2·5
EPIC-Umeå
FINRISK
HUBRO
SNAC-K
SALT/Twin gene
60-y/IMPROVE
SDPP
DCH
EPIC-MORGEN
EPIC-PROSPECT
SALIA
EPIC-Oxford
KORA
VHM&PP
SAPALDIA
E3N
EPIC-Varese
EPIC-Turin
SIDRIA-Turin
SIDRIA-Rome
EPIC-San Sebastian
EPIC-Athens
Random-effects meta-analysis
0·42
1·14
5·06
0·65
0·64
0·48
0·06
12·62
2·69
2·15
2·79
8·65
0·66
32·88
0·74
9·30
8·18
2·95
1·26
1·77
1·17
3·74
1·01 (95% CI 0·99–1·03)
Cohort
HR (95% CI) Weight (%)
0·60·2 1·2 1·6 2·01·0 1·4 1·8 2·20·80·4
Higher mortality with higher air pollutionLess mortality with higher air pollution
BNO2

Articles
www.thelancet.com Published online December 9, 2013 http://dx.doi.org/10.1016/S0140-6736(13)62158-3 7
of non-movers during follow-up (table 2 and appen-dix pp 13–34). Age, sex, smoking status, and socio-economic status (at an area level) were available for all cohorts. Smoking intensity and duration were avail able as continuous variables for all cohorts, except for VHM&PP and E3N. VHM&PP had data for occupation and employment status, but not for education. On average, we had complete confounder information for 90·3% of the participants.
Concentrations of air pollutants varied between and within study areas (table 3, figure 1, and appendix pp 35–38) and increased from northern to southern Europe cohorts. The average NO2 concentration ranged from 5·2 µg/m³ (EPIC-Umeå) to 59·8 µg/m³ (SIDRIA-Turin), and the average PM2·5 concentration from 6·6 µg/m³ (SDPP) to 31·0 µg/m³ (SIDRIA-Turin; table 3). Median differences between area-specific 10th and 90th percentiles were 17·6 µg/m³ for NO2 concentrations and 3·3 µg/m³ for PM2·5 concentrations (figure 1). Correlations between exposure measures were generally greater than 0·5 (appendix pp 39–44).
We recorded raised risks for all exposures to air pollutants, with a statistically significant increased pooled risk for PM2·5 per 5 µg/m³ (1·07, 95% CI 1·02–1·13, p=0·02; table 4, figure 2, and appendix pp 45–50). HRs for confounder model 1 (adjusted only for calendar year and sex) were highest for all pollution indicators, and decreased after adjustment for individual level confounders (table 4). Sensitivity analyses showed that smoking variables were especially responsible for this decrease. Inclusion of area-level socioeconomic status variables (in model 3) led to only a small further decrease in HRs (table 4).
No heterogeneity between individual cohort effect estimates was recorded since the I² statistic was 0 or small (table 4).
In threshold analyses, for PM2·5, pooled HRs remained statistically significantly raised when only participants with concentrations below 25 µg/m³ and 20 µg/m³ were included. Below 15 µg/m³, the HR was raised but not significantly so (table 5). This finding is complemented by the results of the spline models, which showed that the association did not deviate significantly from a linear association (appendix pp 51).
Pooled effect estimates for PM2·5 in two-pollutant models adjusted for NO2 (14 cohorts) and PMcoarse (16 cohorts) did not differ from the single-pollutant models (table 6). PMcoarse effects adjusted for PM2·5 (11 cohorts) were reduced to unity. NO2 effect estimates were not affected by PM2·5 (14 cohorts), but were reduced by PMcoarse (11 cohorts), in two-pollutant analyses (table 6).
The pooled HR for PM2·5 without the influential VHM&PP cohort, which was defined as having a weight greater than 50% in meta-analysis (figure 2), was similar (1·07, 95% CI 0·99–1·15) to the pooled HR for PM2·5 in the main analysis (1·07, 1·02–1·13). A sensitivity analysis restricting the VHM&PP study population to the partici-pants included after 1990 (similar to other cohorts)
resulted in a slightly higher pooled HR for PM2·5 of 1·08 (95% CI 1·01–1·15).
Additional adjustment for hypertension, physical activity, diabetes, and cholesterol did not change pooled HRs compared with those for the main model (appendix pp 52).
Back-extrapolation for NO2 was possible in most cohorts, whereas for seven cohorts spread over Europe back-extrapolation for PM10 was possible. PM2·5 monitoring in Europe was not available for the baseline periods. Cohort size-weighted average PM10 con cen trations decreased for the seven cohorts with historical PM10 data and were 34·8 µg/m³ at baseline and 22·2 µg/m³ in 2008–11. HRs did not differ between the back-extrapolated concentrations at baseline in the year of recruitment and the concentrations based on 2008–11 measurements. The pooled HR for back-extrapolated PM10 concentrations based on the difference method was 1·07 (95% CI 0·94–1·21), whereas the pooled HR for back-extrapolated PM10 concentrations based on
One-pollutant model Two-pollutant model Number of cohorts
PM2·5
Adjusted for NO2* 1·07 (1·01–1·13) 1·06 (0·98–1·15) 14
Adjusted for PMcoarse† 1·08 (1·02–1·14) 1·07 (1·01–1·14) 16
PMcoarse
Adjusted for NO2‡ 1·06 (0·96–1·18) 1·07 (0·94–1·21) 11
Adjusted for PM2·5† 1·04 (0·97–1·12) 1·01 (0·92–1·11) 16
NO2
Adjusted for PM2.5* 1·01 (0·99–1·04) 1·01 (0·97–1·05) 14
Adjusted for PMcoarse‡ 1·01 (0·97–1·05) 0·98 (0·93–1·03) 11
Data are HR (95% CI), unless otherwise indicated. HR=hazard ratio. HRs are presented for the following increments: 5 µg/m³ for PM2·5 and PMcoarse, and 10 µg/m³ for NO2. The analyses were limited to studies for which correlation between two pollutants was less than 0·7. *Included studies: FINRISK, HUBRO, SALT/Twin gene, 60-yr/IMPROVE, SDPP, DCH, EPIC-MORGEN, EPIC-PROSPECT, KORA, VHM&PP, E3N, SIDRIA-Turin, SIDRIA-Rome, and EPIC-Athens. †Included studies: FINRISK, HUBRO, SALT/Twin gene, 60-yr/IMPROVE, SDPP, DCH, EPIC-MORGEN, EPIC-PROSPECT, EPIC-Oxford, KORA, VHM&PP, SAPALDIA, E3N, EPIC-Turin, SIDRIA-Turin, and EPIC-Athens. ‡Included studies: FINRISK, HUBRO, SNAC-K, SALT/Twin gene, 60-yr/IMPROVE, SDPP, EPIC-PROSPECT, EPIC-Oxford, EPIC-Turin, SIDRIA-Turin, and EPIC-Athens.
Table 6: Results from random-effects meta-analyses from one-pollutant and two-pollutant models for adjusted association between natural-cause mortality and various pollutants
Number of cohorts
Number of observations
HR (95% CI) HR (95% CI) based on all participants (no threshold) in the same cohorts*
10 µg/m³ 9 68 527 1·02 (0·87–1·19) 1·06 (1·00–1·13)
15 µg/m³ 11 241 293 1·04 (0·98–1·11) 1·07 (1·01–1·13)
20 µg/m³ 17 304 759 1·07 (1·01–1·13) 1·06 (1·01–1·12)
25 µg/m³ 17 309 310 1·06 (1·00–1·12) 1·06 (1·01–1·12)
No threshold 19 (all) 322 159 1·07 (1·02–1·13) 1·07 (1·02–1·13)
At the threshold of 10 µg/m³, FINRISK, HUBRO, SNAC-K, SALT/Twin gene, 60-y/IMPROVE, SDPP, DCH, EPIC-Oxford, and VHM&PP were included. At the 15 µg/m³ threshold, the same studies were included, with the addition of KORA and E3N. At the 20 and 25 µg/m³ thresholds, all the aforementioned studies were included, with the addition of EPIC-MORGEN, EPIC-PROSPECT, SALIA, SAPALDIA, SIDRIA-Rome, and EPIC-Athens. HRs are presented per 5 µg/m³ for PM2·5. HR=hazard ratio. *Example of reading the table: nine cohorts contributed to the 10 µg/m³ threshold analysis, providing an HR of 1·02. When the same nine cohorts were used for a standard analysis (disregarding thresholds— ie, including all participants), the HR was 1·06.
Table 5: Results from random-effects meta-analyses for the adjusted association between natural cause mortality and exposure to PM2·5 below various threshold values
Articles
8 www.thelancet.com Published online December 9, 2013 http://dx.doi.org/10.1016/S0140-6736(13)62158-3
the ratio method was 1·04 (0·96–1·13)—essentially the same as the 1·04 (0·93–1·16) for the main ESCAPE exposure for these seven cohorts (p=0·93). Analyses restricted to participants who did not move during follow-up in the 14 cohorts with moving information available (on average 66·4% of the participants did not move during follow-up) resulted in a slightly higher pooled HR for PM2·5 of 1·10 (95% CI 1·02–1·20) than the HR from the main analysis for the same 14 cohorts including all participants (1·06, 1·00–1·12). HRs for PM2·5 with and without random effects were similar: 1·08 (95% CI 1·00–1·16) with random effects, and 1·07 (0·98–1·15) without random effects (available for 15 cohorts).
Pooled HRs for PM2·5 differed significantly between men and women in the cohorts that included both sexes. HRs were raised in men (1·14, 95% CI 1·04–1·24) but not in women (0·99, 0·92–1·07; p=0·02), with no hetero-geneity between individual cohort effect estimates within each sex stratum (p value for women=0·77; p value for men=0·38). Most of the cohorts contained roughly the same percentage of men and women (table 2) and the results did not change when the analysis was restricted to these cohorts. No statistically significant effect modifi-cation occurred for the other assessed characteristics (appendix pp 53). PM2·5 effect estimates were similar for the six cohorts for which the amount of variance explained by land use regression model cross-validation was smaller than 60% (1·07, 95% CI 1·01–1·14) and for the 13 cohorts for which it was larger than 60% (1·07, 0·97–1·17; p=0·92).
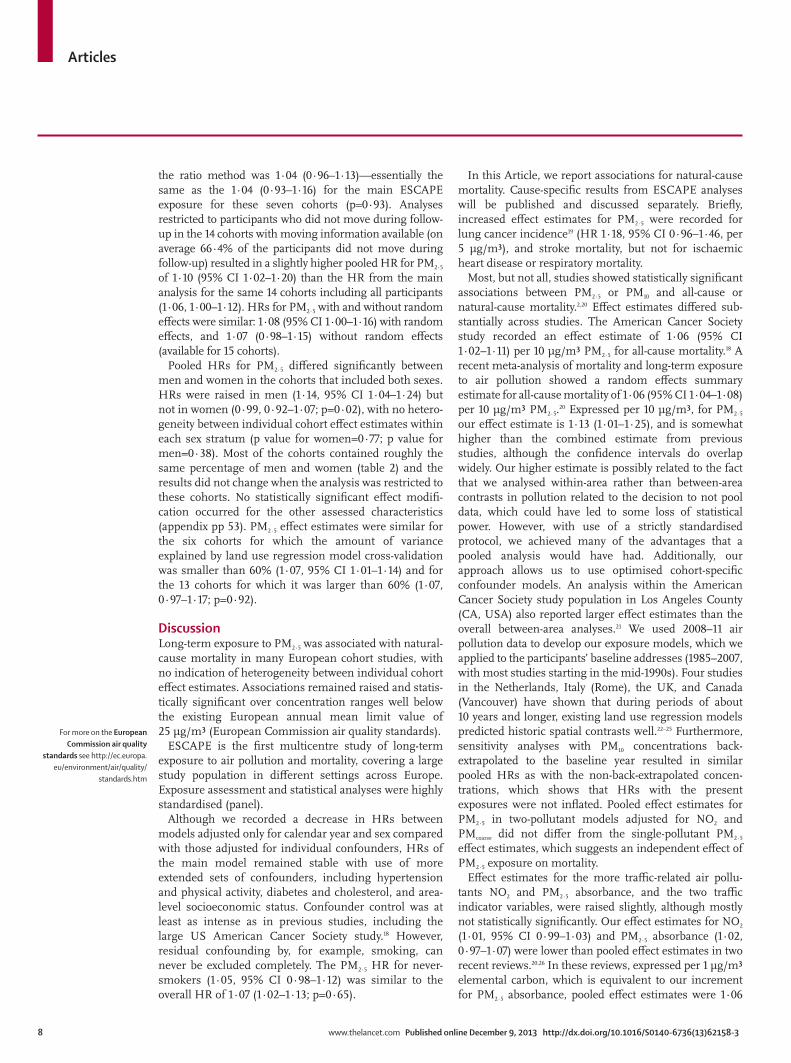
DiscussionLong-term exposure to PM2·5 was associated with natural-cause mortality in many European cohort studies, with no indication of heterogeneity between individual cohort effect estimates. Associations remained raised and statis-tically significant over concentration ranges well below the existing European annual mean limit value of 25 µg/m³ (European Commission air quality standards).
ESCAPE is the first multicentre study of long-term exposure to air pollution and mortality, covering a large study population in different settings across Europe. Exposure assessment and statistical analyses were highly standardised (panel).
Although we recorded a decrease in HRs between models adjusted only for calendar year and sex compared with those adjusted for individual confounders, HRs of the main model remained stable with use of more extended sets of confounders, including hypertension and physical activity, diabetes and cholesterol, and area-level socioeconomic status. Confounder control was at least as intense as in previous studies, including the large US American Cancer Society study.18 However, residual confounding by, for example, smoking, can never be excluded completely. The PM2·5 HR for never-smokers (1·05, 95% CI 0·98–1·12) was similar to the overall HR of 1·07 (1·02–1·13; p=0·65).
In this Article, we report associations for natural-cause mortality. Cause-specific results from ESCAPE analyses will be published and discussed separately. Briefly, increased effect estimates for PM2·5 were recorded for lung cancer incidence19 (HR 1·18, 95% CI 0·96–1·46, per 5 µg/m³), and stroke mortality, but not for ischaemic heart disease or respiratory mortality.
Most, but not all, studies showed statistically significant associations between PM2·5 or PM10 and all-cause or natural-cause mortality.2,20 Effect estimates differed sub-stantially across studies. The American Cancer Society study recorded an effect estimate of 1·06 (95% CI 1·02–1·11) per 10 µg/m³ PM2·5 for all-cause mortality.18 A recent meta-analysis of mortality and long-term exposure to air pollution showed a random effects summary estimate for all-cause mortality of 1·06 (95% CI 1·04–1·08) per 10 µg/m³ PM2·5.20 Expressed per 10 µg/m³, for PM2·5 our effect estimate is 1·13 (1·01–1·25), and is somewhat higher than the combined estimate from previous studies, although the confidence intervals do overlap widely. Our higher estimate is possibly related to the fact that we analysed within-area rather than between-area contrasts in pollution related to the decision to not pool data, which could have led to some loss of statistical power. However, with use of a strictly standardised protocol, we achieved many of the advantages that a pooled analysis would have had. Additionally, our approach allows us to use optimised cohort-specific confounder models. An analysis within the American Cancer Society study population in Los Angeles County (CA, USA) also reported larger effect estimates than the overall between-area analyses.21 We used 2008–11 air pollution data to develop our exposure models, which we applied to the participants’ baseline addresses (1985–2007, with most studies starting in the mid-1990s). Four studies in the Netherlands, Italy (Rome), the UK, and Canada (Vancouver) have shown that during periods of about 10 years and longer, existing land use regression models predicted historic spatial contrasts well.22–25 Furthermore, sensitivity analyses with PM10 concentrations back-extrapolated to the baseline year resulted in similar pooled HRs as with the non-back-extrapolated concen-trations, which shows that HRs with the present exposures were not inflated. Pooled effect estimates for PM2·5 in two-pollutant models adjusted for NO2 and PMcoarse did not differ from the single-pollutant PM2·5 effect estimates, which suggests an independent effect of PM2·5 exposure on mortality.
Effect estimates for the more traffic-related air pollu-tants NO2 and PM2·5 absorbance, and the two traffic indicator variables, were raised slightly, although mostly not statistically significantly. Our effect estimates for NO2 (1·01, 95% CI 0·99–1·03) and PM2·5 absorbance (1·02, 0·97–1·07) were lower than pooled effect estimates in two recent reviews.20,26 In these reviews, expressed per 1 µg/m³ elemental carbon, which is equivalent to our increment for PM2·5 absorbance, pooled effect estimates were 1·06
For more on the European Commission air quality
standards see http://ec.europa.eu/environment/air/quality/
standards.htm

Articles
www.thelancet.com Published online December 9, 2013 http://dx.doi.org/10.1016/S0140-6736(13)62158-3 9
(95% CI 1·05–1·07) and 1·06 (1·04–1·09).20,26 For NO2, the pooled estimate per 10 µg/m³ was 1·06 (1·03–1·08).20
The health effects of coarse particles have attracted renewed attention because tailpipe emissions have been reduced, and therefore non-tailpipe emissions, such as tyre or brake wear, are becoming more important. Little evidence exists for an association between mortality and long-term exposure to coarse particles.9 However, only a few studies have been done, which did not take into account small-scale spatial variation. We noted very scarce evidence for an increased risk of mortality in relation to PMcoarse. The small effect estimate for PMcoarse was reduced to essentially unity after adjustment for PM2·5, which is consistent with findings from the Nurses’ Health study.27
PM2·5 was the pollutant that was most consistently associated with natural-cause mortality in our study. A range of predictor variables explained the spatial variation of PM2·5 in ESCAPE study areas, including not only traffic variables but also population density, industrial sources, urban green space, and elevation (the latter two variables were negatively associated with air pollution concentrations).11 This finding suggests that the effect of PM2·5 in our study is caused not only by traffic emissions but also by other factors. By contrast, the spatial variation in PM2·5 absorbance was explained more exclusively by traffic variables.11
The absence of statistically significant heterogeneity across cohorts supports the use of one risk estimate for health effect assessment across Europe. Our effect estimate was two-times bigger than the relative risk used in the recent Aphekom project to estimate years of life lost in a series of European cities.28 Although this result could be interpreted to mean that such published impact assessments are seriously underestimating the risk, we would like to point out that a recent meta-analysis supported the use of the relative risk estimate used in Aphekom,20 and our results should be interpreted in the light of the wider published literature.
Several plausible biological pathways whereby air pollutants could affect mortality have been investigated. The main pathway is probably that fine particles can lead to systemic inflammatory and oxidative stress responses.2 One recent study has shown an association between black carbon and telomere length—a measure of bio-logical ageing.29
We found no effect modification by smoking status, education level, fruit intake, or BMI, as reported in some previous studies.2 We did find that pooled HRs for PM2·5 were raised in men but not in women. Sex-stratified results in previous studies have varied, although risks do tend to be higher for men, as we noted in our study.8,18 No explanation for such sex differences has yet been proposed. We studied effect modification by various factors that might be associated with sex, such as smoking status, educational level, fruit intake, and BMI, but no effect modification was recorded that could
potentially explain the sex differences that we recorded in our study.
For PM2·5, HRs remained statistically significantly raised when only participants with concentrations below 20 µg/m³ were included. The current European annual mean limit value for PM2·5 is 25 µg/m³. Our findings suggest that significant adverse health effects occur at concentrations well below accepted limits. The WHO air quality guideline for annual mean PM2·5 is 10 µg/m³ and our findings support the idea that significant health benefits can be achieved by moving towards that guideline. The PM2·5 threshold analysis focused on the concentration distributions in 2008–11 and not on cumulative exposures during the follow-up periods because no historical PM2·5 records are available in the study areas. Therefore, the thresholds in the analyses might represent slightly higher thresholds over the follow-up periods. In the seven cohorts for which we had data, PM10 concentrations had decreased from baseline to the ESCAPE measurement period by 12 µg/m³. If the ratio of PM2·5 to PM10 has not changed, this figure translates into a roughly 8 µg/m³ decrease in PM2·5 concentration.30 Previous analyses suggested a monotonic (eg, linear or log-linear) concentration response asso-ciation between long-term exposure to PM2·5 and mortality risk, without an apparent threshold below which there is no risk.2
In conclusion, our findings show that long-term expo-sure to fine particulate air pollution is associated with natural-cause mortality, even at concentration ranges well below the present European annual mean limit value.
Panel: Research in context
Systematic reviewWe reviewed the published scientific literature up to May, 2007, when we submitted our grant proposal to the European Union. We searched PubMed for articles and reviews published in English with search terms “air pollution and mortality” and “ambient air and mortality”. A brief description of the findings of our scientific literature review was part of the study proposal. Additionally, four coauthors of this Article, including RB and GH, did a new systematic review that has recently been published.20 For this review, we did a search in the Medline and Scopus databases with the search terms “air pollution”, “cohort”, and “mortality” until January, 2013 . The results of this review were also used to place our findings in context with previous studies. At the time of inception of our study, some studies had already shown associations between long-term exposure to air pollution and mortality, but they had limitations, including small size of some cohort studies, poor retrospective exposure assessment, and no or scarce information about potential confounders.
InterpretationOur study supports the association between long-term exposure to ambient particulate matter air pollution and mortality, even at concentrations below the existing European Union limit values. Our study overcomes several limitations of previous studies, since it has a large sample size, broad European coverage, retrospective exposure assessment, and contains adjustment for a wide range of potential confounder variables. Particulate matter air pollution is ubiquitous and, on the basis of our results, further reductions in particulate matter air pollution can be expected to reduce the mortality risk.

Articles
10 www.thelancet.com Published online December 9, 2013 http://dx.doi.org/10.1016/S0140-6736(13)62158-3
ContributorsRB contributed to the study design, exposure assessment, statistical script, and data analyses, and drafted the report. OR-N and KK contributed to the study design. MS and GW contributed to the statistical script and data analyses. ZJA contributed to the study design, statistical script, and data analyses. BH contributed to the statistical script and provided local cohort data. ESa, CSc, TS, and MA contributed to the statistical script. PF, MN, LM, MKo, KTE, TE, ME, KM, MW, KdH, AI, HP, CdQ, M-YT, and AR contributed to exposure assessment. PV contributed to the design and provided local cohort data. WWX contributed to the design and data analyses. KD contributed to the design, exposure assessment, statistical script, and data analyses. AO, ATu, BO, JP, ESc, AV, SG, FR, EM, IT, and MKa contributed to the data analyses. BF, ASH, WN, PN, UDF, NLP, C-GO, LF, GP, KO, PHP, BB-d-M, UK, JH, TK, AP, HC, NP-H, NK, FCC, VK, CSa, FF, PA, MD, and ATr provided local cohort data. TL contributed to exposure assessment and provided local cohort data. DS, RH, CG, GC, and CB contributed to exposure assessment and data analyses. KW contributed to exposure assessment, statistical script, and data analyses. GN contributed to data analyses and provided local cohort data. BB contributed to the design and drafted the report. GH contributed to the design, statistical script, and drafted the report. All authors contributed to critical reading of, and commented on, the report, helped to interpret the data, and approved the final draft.
Conflicts of interestWe declare that we have no conflicts of interest.
AcknowledgmentsThe research leading to these results has received funding from the European Community’s Seventh Framework Program (FP7/2007-2011) under grant agreement number 211250. For the Finnish part, additional funding came from the Academy of Finland (project number 129317). Mortality, area-level socioeconomic status, and building data were provided by Statistics Finland. For HUBRO, the data collection was done as part of the Oslo Health Study 2000–2001 and financed by the Norwegian Institute of Public Health, the University of Oslo, and the Municipality of Oslo. Financial support for the combined work with the Stockholm studies was provided by the Swedish Environmental Protection Agency, the Swedish Heart-Lung Foundation, and the Swedish Council for Working Life and Social Research. The Swedish Ministry for Higher Education financially supports the Swedish Twin Register. SALT was supported by the Swedish Council for Working Life and Social Research and a grant from the National Institutes of Health (AG-08724). TwinGene was supported by the Swedish Research Council (M-2005-1112), GenomEUtwin (EU/QLRT-2001-01254; QLG2-CT-2002-01254), NIH DK U01-066134, The Swedish Foundation for Strategic Research, and the Heart and Lung Foundation (grant no. 20070481). The EPIC-MORGEN and EPIC-PROSPECT cohorts were supported by the Dutch Ministry of Public Health, Welfare and Sports, Dutch Prevention Funds, Dutch ZON (Zorg Onderzoek Nederland), and Statistics Netherlands. The baseline study and the mortality follow-up of SALIA were funded by the Ministry of the Environment of North-Rhine-Westfalia (Germany). The KORA research platform and the MONICA Augsburg studies were initiated and financed by the Helmholtz Zentrum München, German Research Centre for Environmental Health, which is funded by the German Federal Ministry of Education and Research and by the State of Bavaria. The VHM&PP is supported by the State of Vorarlberg, Austria. We thank Christian Bernhard, Elmar Bechter, Andrea Kaufmann, and Gabriela Dür from the Vorarlberg State Government. SAPALDIA received funds from The Swiss National Science Foundation (grant numbers 33CSCO-134276/1, 33CSCO-108796, 3247BO-104283, 3247BO-104288, 3247BO-104284, 3247-065896, 3100-059302, 3200-052720, 3200-042532, and 4026-028099), the Federal Office for Forest, Environment and Landscape, and several federal and cantonal authorities. The SIDRIA cohort studies were cofunded by the Italian Ministry of Health. We thank Marjan Tewis, Marieke Oldenwening, Marta Cirach Pradas, Audrey de Nazelle, Bernhard Anwander, Paolo Crosignani, Jon Wickmann, Daniela Raffaele, Marco Gilardetti, Thomas Kuhlbusch, Ulrich Quass, Mohammad Vossoughi, Simone Bucci, L-J Sally Liu, Tarja Yli-Tuomi, Pekka Taimisto, and
Arto Pennanen for their help with exposure assessment and data management within ESCAPE, and Giuseppe Costa (Turin Longitudinal Study) for his collaboration to the SIDRIA-Turin follow-up.
References1 Brunekreef B, Holgate ST. Air pollution and health. Lancet 2002;
360: 1233–42.2 Brook RD, Rajagopalan S, Pope CA, et al. Particulate matter air
pollution and cardiovascular disease: an update to the scientific statement from the American Heart Association. Circulation 2010; 121: 2331–78.
3 Beelen R, Hoek G, van den Brandt PA, et al. Long-term effects of traffic-related air pollution on mortality in a Dutch cohort. Environ Health Perspect 2008; 116: 196–202.
4 Nafstad P, Haheim LL, Wisloff T, et al. Urban air pollution and mortality in a cohort of Norwegian men. Environ Health Perspect 2004; 112: 610–15.
5 Filleul L, Rondeau V, Vandentorren S, et al. Twenty five year mortality and air pollution: results from the French PAARC survey. Occup Environ Med 2005; 62: 453–60.
6 Raaschou-Nielsen O, Andersen ZJ, Jensen SS, et al. Traffic air pollution and mortality from cardiovascular disease and all causes: a Danish cohort study. Environ Health 2012; 11: 60.
7 Heinrich J, Thiering E, Rzehak P, et al. Long-term exposure to NO2 and PM10 and all-cause and cause-specific mortality in a prospective cohort of women. Occup Environ Med 2012; 70: 179–86.
8 Cesaroni G, Badaloni C, Gariazzo C, et al. Long-term exposure to urban air pollution and mortality in a cohort of more than a million adults in Rome. Environ Health Perspect 2013; 121: 324–31.
9 Brunekreef B, Forsberg B. Epidemiological evidence of effects of coarse airborne particles on health. Eur Respir J 2005; 26: 309–18.
10 Jerrett M, Arain A, Kanaroglou P, et al. A review and evaluation of intraurban air pollution exposure models. J Expo Anal Environ Epidemiol 2005; 15: 185–204.
11 Eeftens M, Beelen R, De Hoogh K, et al. Development of land use regression models for PM2.5, PM2.5 absorbance, PM10 and PMcoarse in 20 European study areas; results of the ESCAPE project. Environ Sci Technol 2012; 46: 11195–205.
12 Beelen R, Hoek G, Vienneau D, et al. Development of NO2 and NOx land use regression models for estimating air pollution exposure in 36 study areas in Europe – the ESCAPE project. Atmos Environ 2013; 72: 10–23.
13 Cyrys J, Eeftens M, Heinrich J, et al. Variation of NO2 and NOx concentrations between and within 36 European study areas: results from the ESCAPE study. Atmos Environ 2012; 62: 374–90.
14 Eeftens M, Tsai M, Ampe C, et al. Spatial variation of PM2.5, PM10, PM2.5 absorbance and PMcoarse concentrations between and within 20 European study areas and the relationship with NO2—results of the ESCAPE project. Atmos Environ 2012; 62: 303–17.
15 Thiébaut ACM, Bénichou J. Choice of time-scale in Cox’s model analysis of epidemiologic cohort data: a simulation study. Stat Med 2004; 23: 3803–20.
16 DerSimonian R, Laird N. Meta-analysis in clinical trials. Control Clin Trials 1986; 7: 177–88.
17 Higgins JPT, Thompson SG. Quantifying heterogeneity in a meta-analysis. Stat Med 2002; 21: 1539–58.
18 Pope 3rd CA, Burnett RT, Thun MJ, et al. Lung cancer, cardiopulmonary mortality, and long-term exposure to fine particulate air pollution. JAMA 2002; 287: 1132–41.
19 Raaschou-Nielsen O, Andersen ZJ, Beelen R, et al. Air pollution and lung cancer incidence in 17 European cohorts: prospective analyses from the European Study of Cohorts for Air Pollution Effects (ESCAPE). Lancet Oncol 2013; 14: 813–22.
20 Hoek G, Krishnan MK, Beelen R, et al. Long-term air pollution exposure and cardio-respiratory mortality. Environ Health 2013; 12: 43.
21 Jerrett M, Burnett RT, Ma R, et al. Spatial analysis of air pollution and mortality in Los Angeles. Epidemiology 2005; 16: 727–36.
22 Eeftens M, Beelen R, Fischer P, Brunekreef B, Meliefste K, Hoek G. Stability of measured and modelled spatial contrasts in NO2 over time. Occup Environ Med 2011; 68: 765–70.
23 Cesaroni G, Porta D, Badaloni C, et al. Nitrogen dioxide levels estimated from land use regression models several years apart and association with mortality in a large cohort study. Environ Health 2012; 11: 48.

Articles
www.thelancet.com Published online December 9, 2013 http://dx.doi.org/10.1016/S0140-6736(13)62158-3 11
24 Gulliver J, de Hoogh K, Hansell A, Vienneau D. Development and back-extrapolation of NO2 land use regression models for historic exposure assessment in Great Britain. Environ Sci Technol 2013; 47: 7804–11.
25 Wang R, Henderson SB, Sbihi H, Allen RW, Brauer M. Temporal stability of land use regression models for traffic-related air pollution. Atmos Environ 2013; 64: 312–19.
26 Janssen NAH, Hoek G, Simic-Lawson M, et al. Black carbon as an additional indicator of the adverse health effects of airborne particles compared with PM10 and PM2.5. Environ Health Perspect 2011; 119: 1691–99.
27 Puett RC, Hart JE, Yanosky JD, et al. Chronic fine and coarse particulate exposure, mortality, and coronary heart disease in the Nurses’ Health Study. Environ Health Perspect 2009; 117: 1697–701.
28 Pascal M, Corso M, Chanel O, et al. Assessing the public health impacts of urban air pollution in 25 European cities: results of the Aphekom project. Sci Total Environ 2013; 449: 390–400.
29 McCracken J, Baccarelli A, Hoxha M, et al. Annual ambient black carbon associated with shorter telomeres in elderly men: Veterans Affairs Normative Aging Study. Environ Health Perspect 2010; 118: 1564–70.
30 Beelen R, Hoek G, Fischer P, van den Brandt PA, Brunekreef B. Estimated long-term outdoor air pollution concentrations in a cohort study. Atmos Environ 2007; 41: 1343–58.
Comment
www.thelancet.com Published online December 9, 2013 http://dx.doi.org/10.1016/S0140-6736(13)62570-2 1
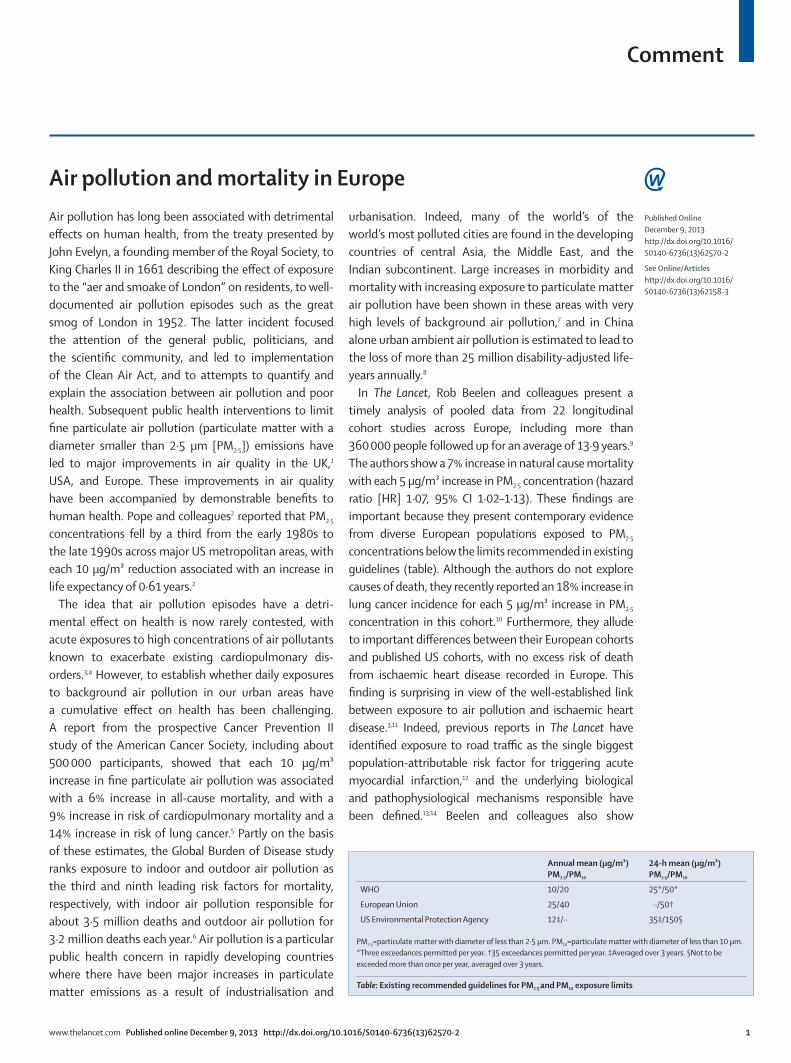
Air pollution and mortality in EuropeAir pollution has long been associated with detrimental effects on human health, from the treaty presented by John Evelyn, a founding member of the Royal Society, to King Charles II in 1661 describing the effect of exposure to the “aer and smoake of London” on residents, to well-documented air pollution episodes such as the great smog of London in 1952. The latter incident focused the attention of the general public, politicians, and the scientific community, and led to implementation of the Clean Air Act, and to attempts to quantify and explain the association between air pollution and poor health. Subsequent public health interventions to limit fine particulate air pollution (particulate matter with a diameter smaller than 2·5 µm [PM2·5]) emissions have led to major improvements in air quality in the UK,1 USA, and Europe. These improvements in air quality have been accompanied by demonstrable benefits to human health. Pope and colleagues2 reported that PM2·5 concentrations fell by a third from the early 1980s to the late 1990s across major US metropolitan areas, with each 10 µg/m³ reduction associated with an increase in life expectancy of 0·61 years.2
The idea that air pollution episodes have a detri-mental effect on health is now rarely contested, with acute exposures to high concentrations of air pollutants known to exacerbate existing cardiopulmonary dis-orders.3,4 How ever, to establish whether daily expo sures to back ground air pollution in our urban areas have a cumulative effect on health has been challenging. A report from the prospective Cancer Prevention II study of the American Cancer Society, including about 500 000 participants, showed that each 10 µg/m³ increase in fine particulate air pollution was associated with a 6% increase in all-cause mortality, and with a 9% increase in risk of cardiopulmonary mortality and a 14% increase in risk of lung cancer.5 Partly on the basis of these estimates, the Global Burden of Disease study ranks exposure to indoor and outdoor air pollution as the third and ninth leading risk factors for mortality, respectively, with indoor air pollution responsible for about 3·5 million deaths and outdoor air pollution for 3·2 million deaths each year.6 Air pollution is a particular public health concern in rapidly developing countries where there have been major increases in particulate matter emissions as a result of industrialisation and
urbanisation. Indeed, many of the world’s of the world’s most polluted cities are found in the developing countries of central Asia, the Middle East, and the Indian subcontinent. Large increases in morbidity and mortality with increasing exposure to particulate matter air pollution have been shown in these areas with very high levels of background air pollution,7 and in China alone urban ambient air pollution is estimated to lead to the loss of more than 25 million disability-adjusted life-years annually.8
In The Lancet, Rob Beelen and colleagues present a timely analysis of pooled data from 22 longitudinal cohort studies across Europe, including more than 360 000 people followed up for an average of 13·9 years.9 The authors show a 7% increase in natural cause mortality with each 5 µg/m³ increase in PM2·5 concentration (hazard ratio [HR] 1·07, 95% CI 1·02–1·13). These findings are important because they present contemporary evidence from diverse European populations exposed to PM2·5 concentrations below the limits recommended in existing guidelines (table). Although the authors do not explore causes of death, they recently reported an 18% increase in lung cancer incidence for each 5 µg/m³ increase in PM2·5 concentration in this cohort.10 Furthermore, they allude to important differences between their European cohorts and published US cohorts, with no excess risk of death from ischaemic heart disease recorded in Europe. This finding is surprising in view of the well-established link between exposure to air pollution and ischaemic heart disease.3,11 Indeed, previous reports in The Lancet have identified exposure to road traffic as the single biggest population-attributable risk factor for triggering acute myocardial infarction,12 and the underlying biological and pathophysiological mechanisms responsible have been defined.13,14 Beelen and colleagues also show
Annual mean (µg/m³) PM2·5/PM10
24-h mean (µg/m³) PM2·5/PM10
WHO 10/20 25*/50*
European Union 25/40 ··/50†
US Environmental Protection Agency 12‡/·· 35‡/150§
PM2·5=particulate matter with diameter of less than 2·5 µm. PM10=particulate matter with diameter of less than 10 µm. *Three exceedances permitted per year. †35 exceedances permitted per year. ‡Averaged over 3 years. §Not to be exceeded more than once per year, averaged over 3 years.
Table: Existing recommended guidelines for PM2·5 and PM10 exposure limits
Published Online December 9, 2013 http://dx.doi.org/10.1016/S0140-6736(13)62570-2
See Online/Articles http://dx.doi.org/10.1016/S0140-6736(13)62158-3

Comment
2 www.thelancet.com Published online December 9, 2013 http://dx.doi.org/10.1016/S0140-6736(13)62570-2
that air pollution is associated with excess mortality in men (HR 1·14, 95% CI 1·04–1·24) and not women (0·99, 0·92–1·07), which differs from previous studies in which the difference between sexes was less notable. These differences are intriguing and certainly warrant further investigation.
Beelen and colleagues’ study has some important limitations that should be acknowledged. Although the data collection for some of these large European cohorts began in 1985 before air pollution monitoring networks were widely established, air pollution was measured between 2008 and 2011, and after follow-up was complete for all cohorts. The authors extrapolated exposures for each cohort back to the start of the study period, and therefore exposure misclassification might have occurred. Furthermore, the authors partly restrict their analyses to those participants with annual exposures below the EU guideline limit of 25 µg/m³ and a lower threshold of 20 µg/m³, and the validity of stratifying populations based on exposures estimated by extrapolation could be questioned. Finally, pooled individual patient data were not available in this analysis, which limited the power of the study to assess heterogeneity and susceptibility across different risk groups and regions.
Despite major improvements in air quality in the past 50 years, the data from Beelen and colleagues’ report draw attention to the continuing effects of air pollution on health. These data, along with the findings from other large cohort studies, suggest that further public and environmental health policy interventions are necessary and have the potential to reduce morbidity and mortality across Europe. Movement towards more stringent guidelines, as recommended by WHO, should be an urgent priority.
Jeremy P Langrish, *Nicholas L MillsUniversity of Edinburgh/British Heart Foundation Centre for Cardiovascular Science, University of Edinburgh, Edinburgh, EH16 4SB, UK [email protected]
We declare that we have no conflicts of interest.
1 Committee on the Medical Effects of Air Pollution. Long-term exposure to air pollution: effect on mortality. London: Health Protection Agency, 2009.
2 Pope CA 3rd, Ezzati M, Dockery DW. Fine-particulate air pollution and life expectancy in the United States. N Engl J Med 2009; 360: 376–86.
3 Brook RD, Rajagopalan S, Pope CA 3rd, et al. Particulate matter air pollution and cardiovascular disease. An update to the scientific statement from the American Heart Association. Circulation 2010; 121: 2331–78.
4 Shah AS, Langrish JP, Nair H, et al. Global association of air pollution and heart failure: a systematic review and meta-analysis. Lancet 2013; 382: 1039–48.
5 Pope C, Burnett R, Thun M, et al. Lung cancer, cardiopulmonary mortality, and long-term exposure to fine particulate air pollution. JAMA 2002; 287: 1132–41.
6 Lim SS, Vos T, Flaxman AD, et al. A comparative risk assessment of burden of disease and injury attributable to 67 risk factors and risk factor clusters in 21 regions, 1990–2010: a systematic analysis for the Global Burden of Disease Study 2010. Lancet 2012; 380: 2224–60.
7 Zhang LW, Chen X, Xue XD, et al. Long-term exposure to high particulate matter pollution and cardiovascular mortality: a 12-year cohort study in four cities in northern China. Environ Int 2014; 62: 41–47.
8 Yang G, Wang Y, Zeng Y, et al. Rapid health transition in China, 1990–2010: findings from the Global Burden of Disease Study 2010. Lancet 2013; 381: 1987–2015.
9 Beelen R, Raaschou-Nielsen O, Stafoggia M, et al. Effects of long-term exposure to air pollution on natural-cause mortality: an analysis of 22 European cohorts within the multicentre ESCAPE project. Lancet 2013; published online Dec 9. http://dx.doi.org/10.1016/S0140-6736(13)62158-3.
10 Raaschou-Nielsen O, Andersen ZJ, Beelen R, et al. Air pollution and lung cancer incidence in 17 European cohorts: prospective analyses from the European Study of Cohorts for Air Pollution Effects (ESCAPE). Lancet Oncol 2013; 14: 813–22.
11 Hoek G, Krishnan RM, Beelen R, et al. Long-term air pollution exposure and cardio- respiratory mortality: a review. Environ Health 2013; 12: 43.
12 Nawrot TS, Perez L, Kunzli N, Munters E, Nemery B. Public health importance of triggers of myocardial infarction: a comparative risk assessment. Lancet 2011; 377: 732–40.
13 Langrish JP, Bosson J, Unosson J, et al. Cardiovascular effects of particulate air pollution exposure: time course and underlying mechanisms. J Intern Med 2012; 272: 224–39.
14 Mills NL, Donaldson K, Hadoke PW, et al. Adverse cardiovascular effects of air pollution. Nat Clin Pract Cardiovasc Med 2009; 6: 36–44.