Embed Size (px)
Citation preview

AIMA Journal of Management & Research, November 2016, Volume 10 Issue 4/4, ISSN 0974 –
497 Copy right© 2016 AJMR-AIMA Page 1
Article No.7
MODELLING FACTORS OF DISTRIBUTION
STRATEGY OF MOBILE DEVICES IN INDIA –
AN AHP APPROACH
Abdul Jalil Khan Research Scholar, Dept. of Business Admin., AMU, Aligarh
Asif Akhtar Assistant Professor, Dept. of Business Admin., AMU, Aligarh
Abstract:
Introduction
Distribution of products constitutes an important element of marketing mix of a firm.
After development of the product, the company has to decide channels or routes
through which the product will flow from the factory to the potential customers.
Objectives
This paper aims to highlight the factors of distribution strategy of Mobile devices in
India as identified from literature. The role of these actors is analysed and categorised
using a Multi Criteria Decision Model (MCDM) technique known as Analytic
Hierarchy Process (AHP).
Methodology
The AHP method applied in this paper is a structured technique for organizing and
analysing complex decisions. This method has proven to be effective in various group
decision-making applications. It thus finds application in the present study to create a
hierarchy among the identified study variables by assigning weights.
Study Variables
The factors of distribution strategy in the Indian context i.e. Customer service,
Marketing Capability, Supplier Integration, Customer Satisfaction, Channel
Management Practices are identified by reviewing the relevant literature sources.
Managerial Implications
The study would be relevant for Marketers in designing the distribution strategy of
Mobile devices. These key variables that would need to be emphasized for the
effective distribution channel are modelled.
Keywords: Distribution Strategy, MCDM, Analytic Hierarchy Process,

AIMA Journal of Management & Research, November 2016, Volume 10 Issue 4/4, ISSN 0974 –
497 Copy right© 2016 AJMR-AIMA Page 2
Introduction
Fierce competition in today’s global markets, the introduction of products with shorter
life cycles, and the heightened expectations of customers have forced business
enterprises to invest in, and focus attention on, their supply chains. This, together with
continuing advances in communications and transportation technologies (e.g., mobile
communication, Internet, and overnight delivery), has motivated the continuous
evolution of the distribution channel and of the techniques to manage it effectively.
Channel performance is a key marketing and organizational issue, given the potential
and actual impact in the accomplishment of organizational goals. A recent trend in
distribution strategy has been the increasing utilization of multiple channels across
sectors. Because of the newness of these channel systems, it is important to
understand how they influence key channel performance indicators.
Lilien and Kotler (1983) propose several dimensions to the channel design decision.
Issues concerning the choice of distribution channels have always been considered
important by marketing thinkers and practitioners. Traditionally, this has stemmed, in
part, from the marketing concept having the exchange process at its core, with the
exchange being facilitated by distribution channels. A reason for the importance of
the channel decision is its long-term nature. Choice of channel represents an enduring
commitment: heavy investments are required and are not easily redeployed, and the
social and political character of distribution channels (Stern and Reve, 1980) means
that change can be difficult and painful. For the above reasons, the channel decision
process must be the subject of a systematic channel decision process from start to
finish.
Heide and John (1988) found that intermediaries who bonded more closely with their
customers became less dependent on their suppliers and improved their financial
performance. They view an agent’s offsetting specific investments in key customers
as a device for strengthening customer bonds and increasing their switching costs,
thereby safeguarding the agent’s specific assets in its exchange relationships with
manufacturers.
Furthermore, distribution is now increasingly seen as one of the key marketing
variables (Devlin, 1995 ;), capable of providing significant competitive advantage,
particularly perhaps in service sectors where consumer, technological, and regulatory
trends have increased competitive pressures markedly. Unsurprisingly, there is an
increased range of distribution possibilities, which has intensified another concern,
that being how to build a logical distribution structure (Moriarty and Moran, 1990).
This is of particular interest in the retail financial services sector, where multiple
channels are being used extensively (see, for example, Beckett, 2000).
For most firms, distribution system is a key decision for building a successful
business. Many companies have built lasting competitive advantages through their
choices of distribution systems, which are integrated into coherent and well-executed

AIMA Journal of Management & Research, November 2016, Volume 10 Issue 4/4, ISSN 0974 –
497 Copy right© 2016 AJMR-AIMA Page 3
business models. An excellent distribution system is critical to a company’s efficient
and profitable performance.
One of the main decisions related to distribution systems is choosing a distribution
channel. The use of multiple distribution channels has increased steadily (Dutta et al.,
1995; Easingwood and Storey, 1996; Frazier, 1999; Coelho, 2003). Some advantages
of using multiple channels according to the literature are sales growth (Thornton and
White, 2001) and cost reduction through low-cost channels (Sathye, 1999; Thornton
and White, 2001; Wright, 2002). On the other hand, multiple channels lead to
disadvantages, such as customer resentment due to different prices associated with
different channels and conflicts among channels resulting from the competition
among different channels. Multiple channels can also lead to intermediary turnover
and result costs to suppliers, as well as the additional costs of establishing a new
channel and operating it. Whether the strategy of multiple channels has a positive or
negative impact on firm performance is, thus, an important empirical as well as
theoretical question/issue.
More and more companies become multi-channel operators (Ganesh, 2004; Coelho et
al., 2003). Therefore, managers need metrics that help them assess the performance of
each individual sales channel, as well as the interrelationships among the different
sales channels in their portfolio. Preferably, these metrics should be grounded in
marketing theory and should be objective, based on readily available data, easy to
quantify, intuitively appealing, and should have diagnostic value (Ailawadi et al.,
2003).
Strategic Channel Choices
An important consideration when formulating channel policy is the degree of market
exposure sought by the company. Choices available include:
Intensive distribution: where products are placed in as many outlets as
possible. This is most common when customers purchase goods frequently,
e.g. household goods such as detergents or toothpaste. Wide exposure gives
customers many opportunities to buy and the image of the outlet is not
important. The aim is to achieve maximum coverage.
Selective distribution: where products are placed in a more limited number of
outlets in defined geographic areas. Instead of widespread exposure, selective
distribution seeks to show products in the most promising or profitable outlets,
e.g. high-end ‘designer’ clothes.
Exclusive distribution: where products are placed in one outlet in a specific
area. This brings about a stronger partnership between seller and re-seller and
results in strong bonds of loyalty. Part of the agreement usually requires the
dealer not to carry competing lines, and the result is a more aggressive selling
effort by the distributor of the company’s products, e.g. an exclusive franchise
to sell a vehicle brand in a specific geographical area, in return for which the
franchisee agrees to supply an appropriate after sales service back-up.

AIMA Journal of Management & Research, November 2016, Volume 10 Issue 4/4, ISSN 0974 –
497 Copy right© 2016 AJMR-AIMA Page 4
Indian Mobile Devices Industry
Year 2015, has seen some tectonic shifts for Indian mobile devices industry. We
continued to see entry of new brands and the expansion of portfolio of existing ones.
From a breakthrough point of view, there wasn’t anything remarkable except that
Samsung came out with the curved design (Edge series) and Apple launched iPhone
6S and 6S+ with 3D functionality. Both the developments happened for the premium
segment (> ₹50,000), Which in india is just 0.6% of the market (CMR’s India
Monthly Mobile Handset Market Review)
So, while it has been time and again proved India is a low to medium priced handsets
market, 2015, has not added some great feature sets to enrich user experience.
However, the industry has been able to offer more to a user for same or even less.
Anecdotally, the ASP (Average Selling Price) for a Smartphone in 2013 was ₹13,000
(volume: 41 mn units), which has come down to ₹10,700 (volume: 95 mn units) by
the end of 2015. At the same time, the specifications of a Smartphone have improved
substantially. In 2013, just 0.07% of Smartphones shipped had 4GB RAM for
instance, which in 2015, was a little over 0.6%. Similarly, other major specifications
that trigger the buyer’s decision to purchase a Smartphone have improved while ASPs
exhibited a receding trend.
An examination of the present scenario, coupled with an analysis of historical trends
tells us that the market for India mobile handsets will settle around 250 mn units in
2016, a 4% growth compared to 2015. The outlook seems suggest that this trend will
continue for a few more years, as we move towards a ‘Smartphones only’ market; this

AIMA Journal of Management & Research, November 2016, Volume 10 Issue 4/4, ISSN 0974 –
497 Copy right© 2016 AJMR-AIMA Page 5
is because the predicted demise of Feature phones does not seem likely anytime very
soon.
Variables for the study
1. Customer Service
The first process is customer service, defined as deeds, processes and
performances (Zeithaml and Bitner, 1996) which are largely intangible tasks that
satisfy buyer or user needs. A growing number of researchers suggest that
superior customer service leads to competitive advantage (e.g. Easing wood and
Mahajan, 1989; Morris and Westbrook, 1996).
2. Marketing Capabilities:
According to Day (1994), marketing capability is defined as integrative processes
designed to apply the collective knowledge, skills, and resources of the firm to the
market-related needs of the business, enabling the business to add value to its
goods and services and meet competitive demands. The importance of learning
processes in the marketing capability development process has been stressed in
recent research (Vorhies and Harker, 2000). Marketing capabilities are developed
via learning processes when the firm's employees repeatedly apply their
knowledge to solving the firm's marketing problems (Day, 1994; Grant, 1991,
1996).
3. Supplier Integration
Integrated Suppliers is a concept for improving the part of the supply chain
between manufacturers and their tiers of suppliers of ingredients, raw materials
and packaging. By sharing information both parties are able to exercise judgment
on costs, quantities and timing of deliveries and production in order to streamline
the product flow and to move to a collaborative relationship.
In the distribution channel, suppliers have to relate to channel intermediaries as
customers, employees, competitors, and partners. Thus, there is the opportunity
for incongruent role specification, role expectation, and role performance.
Suppliers have to determine how they will relate to intermediaries in order to
promote collaborative channel activity which strengthens its (channel) long-term
competitiveness. (Morris Perry,`1989).
4. Customer Satisfaction
Satisfaction is typically defined as a positive affective state resulting from the
appraisal of all aspects of a firm’s working relationship with another. Satisfaction
plays an important role in relationships and has been found to be instrumental in
increasing cooperation between channel partners, and leading to fewer
terminations of relationships.
5. Channel Conflicts
Channel conflict is usually referred that one member in channel see another
channel member as competitor who prevent and hinder his goals. Channel conflict
AIMA Journal of Management & Research, November 2016, Volume 10 Issue 4/4, ISSN 0974 –
497 Copy right© 2016 AJMR-AIMA Page 6
is kind of a hostile or discordant status among customers and dynamic process
from potential conflict state to significant conflict state (Porter, 2001)
When channel member’ behavior is contrary to the behavior of members in other
channel, channel conflict arises. The increased affordability of mobile phones
along with increasing network coverage, make cell phones a vital means of
increasing financial access.
Channel conflict includes the following states: channel member is aware that the
other channel member is preventing him achieve their goals or effective operation.
Or channel members are aware that another channel member is engaged in
activities that threaten its interests to obtain the scarcity of resources. (Kotler,
2000).
There are many reasons causing channel conflicts, which can mainly be attributed
to inconsistence of the target of the members, undefined tasks and rights, different
feeling and high dependency. (Xiunjun, 2002)
Objectives of the Study: 1. To identify the key factors of Distribution Strategies of Mobile Devices.
2. To develop AHP based model of Distribution strategies for Mobile devices in
India.
Research Methodology:
In this study the researcher has tried to identify some key variables which affect the
distribution channel strategies of the Mobile Devices. The variables identified are
subjected to AHP analysis wherein the priority based factors have been established.
Key variables of the study include five major factors of distribution strategies viz.
Customer Service, Marketing Capability, Suppliers Integration, Customer Satisfaction
and Channel conflicts. The research design is descriptive in nature and type of data
used is both primary and secondary. The nature of the study is qualitative and
Analytical Hierarchy Process (AHP), a Multi Criteria Decision Model (MCDM)
Technique is used.
Analytical Hierarchy Process(AHP) Methodology
The Analytic Hierarchy Process (AHP) was developed at the Wharton School of
Business by Thomas Saaty in the 1970s. The method has found application for
making complex policy decisions in areas involving multiple criteria. AHPhelps in
capturing subjective and objective information (Manning et al., 2011) by identifying
and weighting the criteria considered essential to these decisions. The method also
incorporates a check for consistency of the various weights employed to overcome
bias in the overall decision-making process (Saaty, 1994). While other MultiCriteria
Decision Making (MCDM) methods could have been selected for application to our
problem, these methods do not have ready provisions for testing of key parameters
using sensitivity analysis, or checking for inconsistency to enable correction of results
should the selected participants in the study generate inconsistent rankings of
alternatives. One of the other main benefits of the AHP is that it gives coherence to,
and allows the ranking of experts’ knowledge about competing alternatives with
multiple attributes. It is less useful in areas where knowledge is limited.
AIMA Journal of Management & Research, November 2016, Volume 10 Issue 4/4, ISSN 0974 –
497 Copy right© 2016 AJMR-AIMA Page 7
Since its formulation, AHP has been applied for a vast number of areas, but its
application for the problem that has been taken up in this paper is unprecedented. The
method has previously been applied in wide ranging disciplines such as the health
sector (Saaty, 1994), as well as the education sector (Alexander &Saaty, 1977). It
has also witnessed applications in the areas of finance (Saaty, 1990) and engineering
(Triantaphyllou& Mann, 1995).
The AHP procedure involves six essential steps (Lee et al., 2008),
1. Definition of the unstructured problem
2. Development of the AHP hierarchy
3. Pair-wise comparisons
4. Estimation of the relative weights
5. Check for consistency
6. Establishment of overall rating
These steps are briefly explained as follows:
Step 1: Define the unstructured problem
In this step the unstructured problem and its determinants should be recognized and
the objectives and outcomes stated clearly.
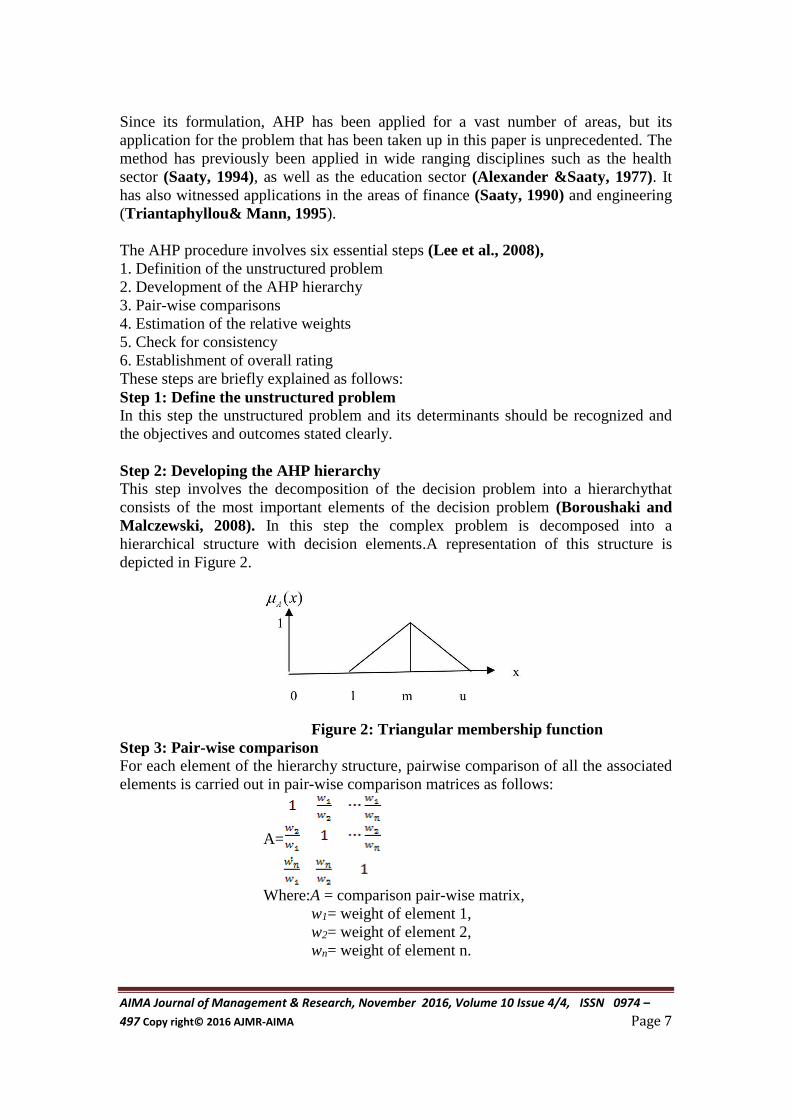
Step 2: Developing the AHP hierarchy
This step involves the decomposition of the decision problem into a hierarchythat
consists of the most important elements of the decision problem (Boroushaki and
Malczewski, 2008). In this step the complex problem is decomposed into a
hierarchical structure with decision elements.A representation of this structure is
depicted in Figure 2.
Figure 2: Triangular membership function
Step 3: Pair-wise comparison
For each element of the hierarchy structure, pairwise comparison of all the associated
elements is carried out in pair-wise comparison matrices as follows:
A=
Where:A = comparison pair-wise matrix,
w1= weight of element 1,
w2= weight of element 2,
wn= weight of element n.

AIMA Journal of Management & Research, November 2016, Volume 10 Issue 4/4, ISSN 0974 –
497 Copy right© 2016 AJMR-AIMA Page 8
In order to determine the relative preferences for two elements of the hierarchy in
matrix A, an underlying semantic scale is employed with values ranging from 1 to 9
to rate relative importance (Table 1).
Preferences expressed in
linguistic variables
Preferences expressed in
numeric variables
Reciprocal (decimal)
Extreme Importance 9 1/9 (0.111)
Very strong to extremely 8 1/8 (0.125)
Very strong Importance 7 1/7 (0.143)
Strongly to to very strong 6 1/6(0.167)
Strong Importance 5 1/5(0.200)
Moderately to Strong 4 1/4(0.250)
Moderate Importance 3 1/3(0.333)
Equally to Moderately 2 1/2(0.500)
Equal Importance 1 1 (1.000)
Table1. Scales for pair-wise comparison (Saaty, 1980)
Step 4: Estimate the relative weights
Some methods like eigenvalue method are used to calculate the relative weights of
elements in each pair-wise comparison matrix. The relative weights (W) of matrix A is
calculated from following equation:
Where λmax = the biggest eigenvalue of matrix A, I = unit matrix.
Step 5: Check the consistency
In this step the consistency property of matrices is checked to ensure that the
judgments of decision makers are consistent. For this end some pre-parameter is
needed. Consistency Index (CI) is calculated as:
The consistency index of a randomly generated reciprocal matrix shall be called to the
random index (RI), with reciprocals forced. An average RI for the matrices of order 1–
15 was generated by using a sample size of 100 (Nobre et al., 1999). The table of
random indexes of the matrices of order 1–15 can be seen in Saaty (1980). The last
ratio that has to be calculated is CR (Consistency Ratio). Generally, if CR is less than
0.1, the judgments are consistent, so the derived weights can be used. The formulation
of CR is:
Step 6: Obtain the overall rating
In last step the relative weights of decision elements are aggregated to obtain an
overall rating for the alternatives as follows:

AIMA Journal of Management & Research, November 2016, Volume 10 Issue 4/4, ISSN 0974 –
497 Copy right© 2016 AJMR-AIMA Page 9
,i=1,2…..n
Where s
= total weight of alternative i,
= weight of alternative i associated to attribute j,
= weight of attribute j,
m = number of attributes,
n= number of alternatives
Results and Discussion
STEP 1: Criteria Comparison Matrix, C
The table is constructed between the factors which are affecting the decision of
distribution channels. The point is given according to the priority which we consider
will be affecting the channel more. Having identified the various factors of
distribution strategies, the next step in the AHP method is formulation of Criteria
Comparison Matrix.
CUSTOMER
SERVICE
MARKETING
CAPABILITY
SUPPLIERS
INTEGRATION
CUSTOMER
SATISFACTION
CHANNEL
CONFLICTS
CUSTOMER
SERVICE 1 3 3 5 5
MARKETING
CAPABILITY 0.33 1 3 3 3
SUPPLIERS
INTEGRATION 0.33 0.33 1 3 3
CUSTOMER
SATISFACTION 0.2 0.33 0.33 1 3
CHANNEL
CONFLICTS 0.2 0.33 0.33 0.33 1
SUM 2.06 4.99 7.66 12.33 15
STEP 2: Normalization of Comparison Matrix
Normalization of matrix is done by dividing each with sum of their respective
column.
CUSTOM
ER
SERVICE
MARKET
ING
CAPABIL
ITY
SUPPLIERS
INTEGRAT
ION
CUSTOME
R
SATISFAC
TION
CHANNEL
CONFLICTS
CUSTOMER
SERVICE 0.485 0.601 0.392 0.406 0.333
MARKETING
CAPABILITY 0.160 0.200 0.392 0.243 0.200
SUPPLIERS
INTEGRATIO
N
0.160 0.066 0.131 0.243 0.200
CUSTOMER 0.097 0.066 0.043 0.081 0.2

AIMA Journal of Management & Research, November 2016, Volume 10 Issue 4/4, ISSN 0974 –
497 Copy right© 2016 AJMR-AIMA Page 10
The next step is normalization of Criteria Comparison Matrix.
Normalization of Comparison Matrix: Normalization of matrix is made by dividing
each criteria with sum of the respective column.
After arriving at Normalized matrix, a Criteria Weight matrix is to be calculated
Criteria Weight {W}: It can be found out by taking average of each row
which is shown as follows:
W =
Now we check for the consistency of the criteria matrix. As we don’t want to check
again and again by assigning the ranking to the matrix we would now check
consistency which is a feasible solution. For this we would find the consistency ratio
If the consistency ratio < 0.1 then the ranking are consistent and practically feasible.
If the consistency ratio > 0.1 then the comparison should be recalculated.
Checking for Consistency
The procedure in checking for consistency is:
1) Determine the weight sum vector , Ws
{Ws} = [C]{W}
1 3 3 5 5 0.44
0.33 1 3 3 3 0.24
0.33 0.33 1 3 3 * 0.16
0.2 0.33 0.33 1 3 0.10
0.2 0.33 0.33 0.33 1 0.06
{Ws} =
2) Find the consistency vector = {Ws}.
{1/W)
SATISFACTIO
N
CHANNEL
CONFLICTS 0.097 0.066 0.043 0.027 0.067
SUM 1.000 1.000 1.000 1.000 1.000
0.44
0.24
0.16
0.10
0.06
2.44
1.3452
0.8644
0.5
0.313
AIMA Journal of Management & Research, November 2016, Volume 10 Issue 4/4, ISSN 0974 –
497 Copy right© 2016 AJMR-AIMA Page 11
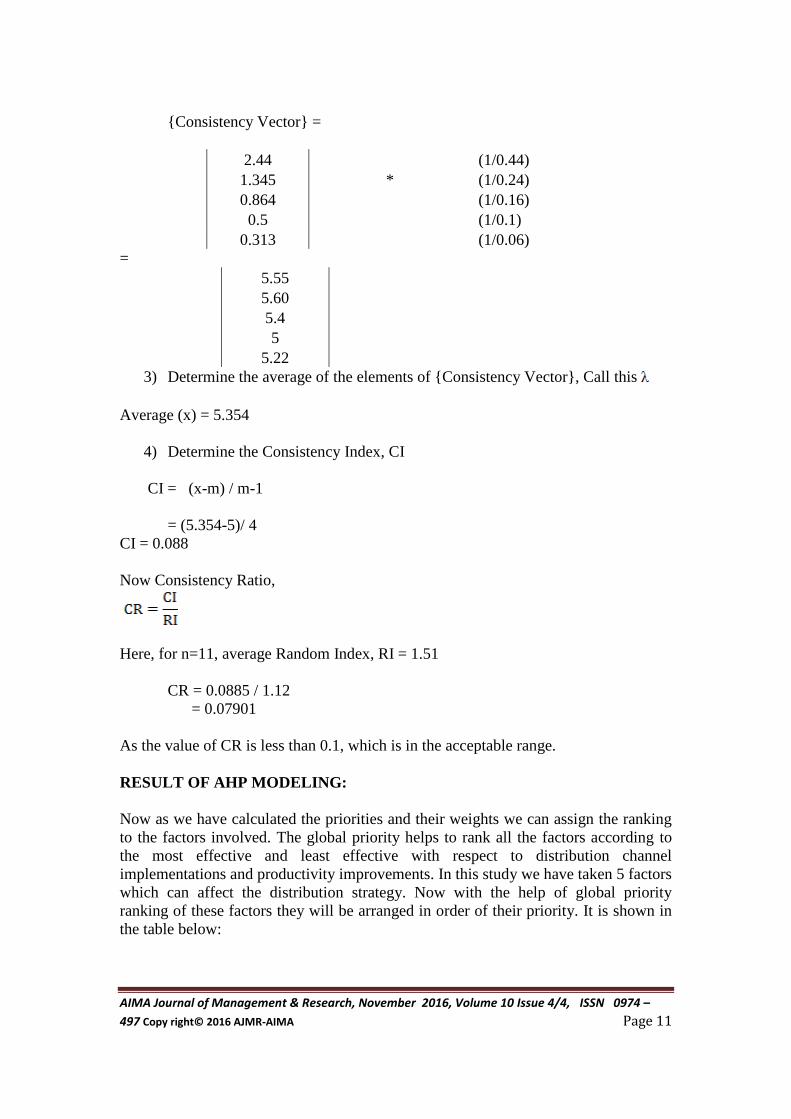
{Consistency Vector} =
2.44 (1/0.44)
1.345 * (1/0.24)
0.864 (1/0.16)
0.5 (1/0.1)
0.313 (1/0.06)
=
5.55
5.60
5.4
5
5.22
3) Determine the average of the elements of {Consistency Vector}, Call this
Average (x) = 5.354
4) Determine the Consistency Index, CI
CI = (x-m) / m-1
= (5.354-5)/ 4
CI = 0.088
Now Consistency Ratio,
Here, for n=11, average Random Index, RI = 1.51
CR = 0.0885 / 1.12
= 0.07901
As the value of CR is less than 0.1, which is in the acceptable range.
RESULT OF AHP MODELING:
Now as we have calculated the priorities and their weights we can assign the ranking
to the factors involved. The global priority helps to rank all the factors according to
the most effective and least effective with respect to distribution channel
implementations and productivity improvements. In this study we have taken 5 factors
which can affect the distribution strategy. Now with the help of global priority
ranking of these factors they will be arranged in order of their priority. It is shown in
the table below:

AIMA Journal of Management & Research, November 2016, Volume 10 Issue 4/4, ISSN 0974 –
497 Copy right© 2016 AJMR-AIMA Page 12
CRITERIA CRITERIA WEIGHT
(W)
RANK
CUSTOMER SERVICE 0.44 1
MARKETING
CAPABILITY 0.24
2
SUPPLIERS
INTEGRATION 0.16
3
CUSTOMER
SATISFACTION 0.10
4
CHANNEL CONFLICTS 0.06 5
Table: Ranking of Factors
Conclusions:
1. Among the factors of distribution strategy considered for the study, it emerges
from the developed AHP model that the Customer Service is primarily
important for distribution strategy of mobile devices in India. This can be due
to reason that in customer service various factors play an important role like
expertise, dependability, empathy, timeliness, ownership, keeping promises
etc.
2. Second most important factor in the distribution strategy is the Marketing
Capability with criteria weight of 0.24. The major sub factors which influence
the marketing capability are the marketing research, pricing, product
development, channel management, promotion and customer acquisition etc.
3. Third critical factor for the distribution of mobile devices is Suppliers
Integration. This factor is related to the mobile devices as an important aspect
because how the suppliers are connected to each other and whether the
handsets if not available with one distributor can be made available from other
distributor. The suppliers should be connected with each other effectively.
4. Customer Satisfaction is the fourth factor according to the ranking with 0.10
as its critical weight. The sub factors included in the Customer Satisfaction are
Quality, Separation anxiety, accessibility, face value, nice atmosphere, waiting
game, responsibility, retaining old customers, technology advancement etc.
5. Interestingly, Channel conflicts stood at the last rank of the hierarchy. This
may be due the fact that conflict in the channel is a common phenomenon. In a
diverse mixed level structure, the conflict among the members is inevitable.
References
Alexander, J. M., & Saaty, T. L. (1977). The forward and backward processes of
conflict analysis. Behavioral Science, 22(2), 87-98.
Boroushaki, S., & Malczewski, J. (2008). Implementing an extension of the analytical
hierarchy process using ordered weighted averaging operators with fuzzy quantifiers
in ArcGIS. Computers & Geosciences, 34(4), 399-410.
Day, G.S. (1994), “The Capabilities of the Market – Driven Organization”, Journal of
Marketing 58, 37-51.

AIMA Journal of Management & Research, November 2016, Volume 10 Issue 4/4, ISSN 0974 –
497 Copy right© 2016 AJMR-AIMA Page 13
Dutta, S., Bergen, M., Heide, J.B. and John, G. (1995), “Understanding dual
distribution: the case of reps and house accounts”, Journal of Law, Economics, and
Organisation, Vol. 11 No. 1, pp. 189-205.
Easingwood, C. and Storey, C. (1996), “The value of multi- channel distribution
systems in the financial services sector”, The Service Industries Journal, Vol. 16 No.
2, pp. 223-41.
Easingwood, C. and Coelho, F. (2003), “Single versus multiple channel strategies:
typologies and drivers”, The Service Industries Journal, Vol. 23 No. 2,
pp. 31-46.
Frazier, G.L. (1999), “Organizing and managing channels of distribution”, Journal of
the Academy of Marketing Science, Vol. 27 No. 2, pp. 226-40.
Ganesh, J., 2004. Managing customer preferences in a multi-channel environment
using web services. International Journal of Retail and Distribution Management 32,
140–146.
Grant, R. M. (1991), “The Resource-Based Theory of Competitive Advantage:
Implications for Strategy Formulation”, California Management Review 33, no.3,
114-135.
Heide, Jan B. and George John (1988), "The Role of Dependence Balancing in
SafeguardingTransaction-SpecificAssets in Conventional Channels,"Journalof
Marketing,52 (January),20-35.
Kotler P. Marketing Management[M]. London: Prentice Hall Inc, 2000:167-198.
Lee, A. H., Chen, W. C., & Chang, C. J. (2008). A fuzzy AHP and BSC approach for
evaluating performance of IT department in the manufacturing industry in
Taiwan. Expert systems with applications, 34(1), 96-107.
Lilien, G.L. and P. Kotler, 1983. Marketing decision-making. New York: Harper &
Row
Manning, M., Homel, R., & Smith, C. (2011). An economic method for formulating
better policies for positive child development. Australian Review of Public
Affairs, 10(1), 61-77.
Moriarty, Rowland T. and Ursula Moran (1990), “Managing Hybrid Marketing
Systems,” Harvard Business Review, 68 (November–December), 146–57.
Nobre, F. F., Trotta, L. T. F., & Gomes, L. F. A. M. (1999). Multi‐criteria decision
making–an approach to setting priorities in health care. Statistics in medicine, 18(23),
3345-3354.

AIMA Journal of Management & Research, November 2016, Volume 10 Issue 4/4, ISSN 0974 –
497 Copy right© 2016 AJMR-AIMA Page 14
Porter M.E. Strategy and the Internet[J]. Harvard Business Review, 2001, Vol.79,
No.3:63-78.
Rajan, R., & Zingales, L. (2003). Saving capitalism from the capitalists (Vol. 2121).
New York: Crown Business.
Saaty, T.L., (1980). “The Analytic Hierarchy Process.” McGraw-Hill, New York.
Saaty, T. L. (1990). Multicriteria decision making: The Analytical Hierarchy Process.
Pittsburgh, USA: RWS Publications.
Saaty, T. L. (1994). How to make a decision: the analytic hierarchy
process.Interfaces, 24(6), 19-43.
Sathye, M. (1999), “Adoption of Internet banking by Australian consumers: an
empirical investigation”, The International Journal of Bank Marketing, Vol. 17 No. 7,
pp. 324-34.
Stem, Louis W. and Torger Reve (1980), "Distribution Channels as Political
Economies: A Framework for Comparative Analysis," Journal of Marketing, 44
(Summer), 52-64.
Thornton, J. and White, L. (2001), “Customer orientations and usage of financial
distribution channels”, Journal of Services Marketing, Vol. 15 No. 3, pp. 168-85.
Triantaphyllou, E., & Mann, S. H. (1995). Using the analytic hierarchy process for
decision making in engineering applications: some challenges.International Journal
of Industrial Engineering: Applications and Practice,2(1), 35-44.
Vorhies, D.W. and M. Harker (2000), “The Capabilities and Performance Advantages
of Market-Driven Firms: an Empirical Investigation”, Australian Journal of
Management 25(September), no.2.
Wright, A. (2002), “Technology as an enabler of the global branding of retail
financial services”, Journal of International Marketing, Vol. 10 No. 2, pp. 83-98.
Xiujun Zhu, Ze Qi.Conflicts and Cooperation of Marketing Channel in Game Theory
[J].Business Economics and administration,2002,(4):14-17.
Yang, Y. Y., & Yi, M. H. (2008). Does financial development cause economic
growth? Implication for policy in Korea. Journal of Policy Modeling, 30(5), 827-840.
Zeithaml, V.A. and M.J. Bitner (1996), Services Marketing, Sydney: McGraw-Hill