Embed Size (px)
Citation preview

Neil de Grasse Tyson, director of the HaydenPlanetarium, and I were wandering around
Central London. He spotted an antique penshop, and wanted to stop in. It was 1998, and wewere in town to meet with some folks helping tobuild the digital dome system for the Rose Cen-ter for Earth and Space at the American Museumof Natural History, to open in 2000.
It turns out that Tyson is an antique pen buff.He’s also a lateral thinker, and looking at the oldfountain pens and pencils got him going. Thereisn’t much difference, he said, between these oldwriting implements and the state-of-the-art starprojector for the planetarium; the dome is thepaper, and the projector is no different than themodified quill pen that Leonardo da Vinci usedto render the astronomical phenomena heobserved. Like da Vinci, we had to have the eyesof an artist as well as a scientist to communicateour ideas most effectively.
One of my goals in designing interactivemuseum exhibits has been to do just that—bringing art to the service of science, to make artthat informs. Before my postgraduate work ininteractive media, I studied traditional art, usingmy own share of pens and paper; and journalism,in which the TV camera is called the “400-poundpencil.” I also studied anthropology, whichdevotes itself to observation and description.What storytellers in all media share is the needto make the complex understandable whilereducing, compressing, and editing to fit spaceand time restrictions.
Computers and artComputers were, of course, created by the sci-
entific establishment, and the continued infusionof scientific knowledge—most recently from biol-ogy—now enable the nearly complete simulationof nature. Genetic algorithms let software andhardware evolve, self-modifying and selectingversions with desired traits (see for examplehttp://www.cogs.susx.ac.uk/users/adrianth/).
Flocking and swarming behaviors in animalsshow animators how to make crowds move. Cel-lular automata based on simple rules can recreatethe intricate, complex patterns found in nature.1
A hundred years ago, art was at a similar stage,with photography and film having attained apretty accurate representation of reality. Inresponse, artists such as Pablo Picasso, Paul Klee,and Vasily Kandinsky began to experiment withdifferent sorts of visualizations—of the world, ofthe mind, of subjects not grounded in reality.Some sought a vague spiritual aspect while oth-ers wanted merely to make the invisible visible,instead of merely reproducing reality.
Coincidentally, the concepts of relativity andcultural relativism arose at around the same time.It could be, as Kandinsky argued, that contem-plating the abstract enabled us to see “therhythm in-between.”2 Just as in the physicalworld, emergent properties arise from the inter-actions between things; just as music is what’sbetween the notes (as postulated by Kandinsky’scontemporary, Claude Debussy); just as you can’tbreak down a chocolate cake back into its origi-nal ingredients—a completed artwork has under-gone a change of state.
Does abstract art convey information? All ofthese artists would certainly say so. So too wouldcontemporary artists such as Gerhard Richter.Just as a work of realism is a model of reality, hesaid, an abstract work is a fictive model, a sort ofmodel of an invisible reality. What better way todescribe something incomprehensible?3
Digital mediaGiven their limitless possibilities, perhaps dig-
ital media could do an even better job. It seemstoo soon to tell, but I believe that it holdspromise. Although I haven’t seen any digitalwork with the invisible, emotional power of aBach sonata or a Picasso painting, the media arebeginning to break out of the early stages ofexperimentation.
4 1070-986X/03/$17.00 © 2003 IEEE Published by the IEEE Computer Society
Artful Media Editor: Dorée Duncan SeligmanAvaya Labs
Kevin WalkerExhibit Research
Interactive and Informative Art

One problem is that, with the computerscreen (as with the canvas), everything is reducedto a 2D plane, no matter how accurate the 3Drendering or how sophisticated the display tech-nology. That’s why, in my opinion, the mostinteresting things are happening in the ever-expanding periphery as computers gain sensesand are becoming inserted, component by com-ponent, into the world. This is the world of ubiq-uitous computing in which computers areeverywhere and nowhere, and smart walls, sur-faces, and objects interact with us or do theirwork autonomously.
When I completed graduate school in 1995,hype about our interactive future was runninghigh, the Internet was beginning to take off, andthere was a mad rush into the uncharted virtualworld. Unlimited bandwidth and completelyphotorealistic graphics would soon make possi-ble a world much cleaner than the real one,where anything was possible.
At the Interactive Telecommunications Pro-gram at New York University, we were taught tomaintain a skeptical view of all this and toremain grounded in the real world with some-thing called physical computing—using comput-ers to augment real environments and facilitatehuman interactions. It’s essentially art with elec-tronics, and considering the tools available toartists today, Buckminster Fuller was right in hisbelief that as technology advances, art begins toresemble science.4
Digital media mirror how we understand theworld, breaking it down into small parts that canbe reordered. Audio, video, text, and images areall equally reduced to bits, and as an artisticmedium, computers have mostly been used usedto process other media.
I began, however, exploring the computer asa medium in itself, emphasizing the computer’soriginal (scientific) purpose—computation. Inmy master’s thesis (see an example in Figure 1), Idisregarded high-resolution graphics, insteadusing simple color and sound to try and createemergent, improvisational sorts of experiences,giving up some control over composition to thecomputer, and some to the user. It was inspiredby Piet Mondrian,5 jazz, the pioneering work ofMyron Kreuger,6 and Jaron Lanier’s idea thatcomputers should be more like musical instru-ments (one of Lanier’s talks is transcribed athttp://www.nilescanyon.net/nyc/jaron).
I was fortunate to escape the Internet hype in1996, at the American Museum of Natural History,
where I was the senior software designer for Exhi-bitions until 2000. There, I was able to apply someof my ideas and experience with art to science.
Relating art and scienceUnderstanding science is different than
understanding art, but perhaps not as differentas it would seem. Today, we can see deep into theuniverse and down to a molecular level. We canpreserve images of people long dead, and we cancontrol time using recording and playback tech-nologies. We can simulate the motions of galax-ies over billions of years. The world is awash indata, coming at us from every direction, and sci-entists, like poets, attempt to reduce chaos downto digestible bites.7
However, where the scientist sees only theobserved in the material world, the artist sees thespiritual.2 While the scientist describes and pre-dicts, the artist distills and presents. Interpretingscience for the public means balancing the desireof scientists to spew data with the artistic urge tocreate a transcendent experience. Content andpresentation are everything: form and functionmust be fused.
Leonardo’s Codex LeicesterOne of the first exhibitions I worked on at the
museum was “Leonardo’s Codex Leicester: A Mas-terpiece of Science.” Bill Gates had just purchasedthe manuscript and the exhibition would launchits first US tour. Being in the gallery with the doc-ument was an eerie experience—each page in itsown darkened, climate-controlled case, each case
5
January–M
arch 2003
Figure 1. Screen shot
from random abstract
by Kevin Walker, 1996
(http://www.
nilescanyon.net/
random).

brightening slightly at staggered intervals. It wasprimarily an art exhibition and an odd way toexplore the ideas in the codex. But Gates’ com-pany, Corbis, created some excellent magnifying-glass software, which not only translated fromthe 15th-century Italian, but also flipped Leonar-do’s mirror-image writing back into readable ori-entation. The exhibition had this softwareinstalled in some adjacent computer desks andCorbis included it in a CD-ROM released concur-rently in 1996 (called Leonardo da Vinci).
My own task was to try and bring the docu-ment to life in a video theater. In trying to distill72 pages into 8 minutes, we recreated some ofLeonardo’s experiments, using new digital simu-lations from the planetarium, as well as real water(the manuscript’s primary subject). I also pickedup the (digital) pen, to trace and animate hisoriginal drawings. I tried adding a third andfourth dimension to the manuscript by using itas a surface upon which additional layers ofinformation float, illuminating the words andpictures on the page.
It hardly needed it—the manuscript is quiteanimated already, filled with drawings showingmotion and process, and da Vinci’s argumentswith an imaginary adversary. At the heart of it,da Vinci shows that the birth of both science andart is observation.
Exploring a World at RiskWith current technology, our powers of
observation are magnified many times, but sci-
ence still contains a great deal of art. Not only isthis evident in the mathematical beauty of equa-tions, but in visual presentation as well. Forexample, images from high-powered micro-scopes and telescopes are typically monochromeand are colorized for informational and aesthet-ic reasons.
We took advantage of the use of false color inour 1999 exhibition, “Epidemic! Exploring aWorld at Risk” (see Figure 2). To help visitorsmake sense of the intricate complexities of infec-tious viruses, bacteria, and protozoa, we gaveeach organism its own identity, not only in dis-tinctive shape and color, but with sound as well.In a series of simple touchscreen kiosks, eachorganism carried its own abstract sound, and thesounds were designed to “infect” the space indi-vidually and work together harmonically, creat-ing a subtle ambient soundtrack to theexhibition instead of a cacophony.
The simplified use of color and sound drewupon my previous experience with abstract art,combining it with scientific content. The infor-mation was rich, but was edited and simplifiedenough to facilitate understanding. What’s more,it transcended the screen and employed the spaceand visitors in the knowledge-creation process.
To complete the sense of immersion, realmodels were designed to match the virtual mod-els of the microbes and to merge seamlessly withlarge projections of the organisms. Barrett Klein(an entomologist and model-maker) and JamesStoop (trained as a 3D character animator) col-laboratively created the microbe models. Farfrom cartoon characters, the microbes are prob-ably the most scientifically accurate microbemodels yet created.
Merging the real and virtual in a “microbeforest” was just one attempt to integrate digitalmedia into the gallery’s physical form. Toaccomplish the opposite—making the space thecomputer—I tapped Joseph Stein, a New YorkUniversity colleague I had just hired to usephysical computing techniques, and he usedfloor sensors to create an interactive shadow(see Figure 3), as a way of letting visitors peekinto the body. The overall goal was to breakdown the barriers between information andarchitecture.
Scaling the universeExhibition designer Ralph Appelbaum is adept
at merging information and architecture, and thefollowing year, he used the giant sphere in the
6
IEEE
Mul
tiM
edia
Artful Media
Figure 2. Part of the
“microbe forest” in the
exhibition—“Epidemic!
Exploring a World at
Risk” (http://
research.amnh.org/
exhibitions/epidemic/
microbes.html).
Phot
o by
Kev
in W
alke
r

Rose Center (see Figure 4) todemonstrate the vast differences insize scales in the universe—postu-lating that if the sun was the giantsphere, the earth is shown as ball-sized; similarly with molecules andatoms. He also succeeds in trans-forming space into time, makingplaces into timelines of billions ofyears, entire halls into ideas to beexplored. As information spacesthey approach the virtual world.This is a broader notion of architec-ture that encompasses the electron-ic as well as the physical.8
No amount of information orexhibitry could capture the cre-ation and evolution of the uni-verse, so to show this in the RoseCenter’s Hall of the Universe, weturned to the skilled animators atFunny Garbage. They created asimplified, not-quite-cartoonishanimation that’s scientificallyaccurate (at least as far as scientists currentlyunderstand it) and visually minimal such thata child can comprehend it. We projected thisonto three satellite-dish-shaped screens (seeFigure 5), with an interactive version in atouchscreen kiosk below each.
Astrophysicist Frank Summers is anotherLeonardo-esque individual who brings an artisticbackground to science—in his case, dance. Hechoreographed what can only be called a dance oftwo galaxies interacting, in another projected visu-alization in the Hall of the Universe (Figure 6).
7
January–M
arch 2003
Figure 3. Interactive shadow for the
“Epidemic” exhibition (http://
research.amnh.org/users/jstein/
shadowman/shadowupdate.html).
Phot
o co
urte
sy o
f Am
eric
an M
useu
m o
f Nat
ural
His
tory
Figure 4. Size scales at the Rose Center for Earth and Space, American Museum of Natural
History.
Figure 5. Formation and Evolution of the Universe, an
animation by Funny Garbage (http://www.funnygarbage.com/
client/case_study.php3?proj=17).
©20
02 A
mer
ican
Mus
eum
of N
atur
al H
isto
ryPh
oto
cour
tesy
of S
teve
God
un
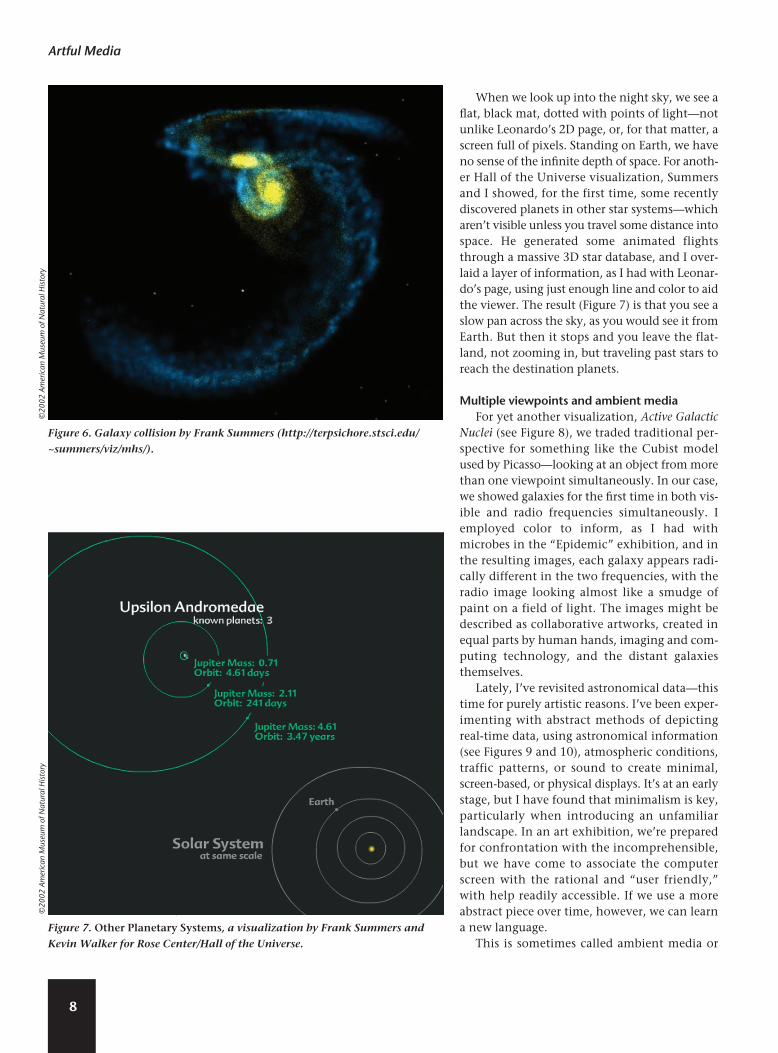
When we look up into the night sky, we see aflat, black mat, dotted with points of light—notunlike Leonardo’s 2D page, or, for that matter, ascreen full of pixels. Standing on Earth, we haveno sense of the infinite depth of space. For anoth-er Hall of the Universe visualization, Summersand I showed, for the first time, some recentlydiscovered planets in other star systems—whicharen’t visible unless you travel some distance intospace. He generated some animated flightsthrough a massive 3D star database, and I over-laid a layer of information, as I had with Leonar-do’s page, using just enough line and color to aidthe viewer. The result (Figure 7) is that you see aslow pan across the sky, as you would see it fromEarth. But then it stops and you leave the flat-land, not zooming in, but traveling past stars toreach the destination planets.
Multiple viewpoints and ambient mediaFor yet another visualization, Active Galactic
Nuclei (see Figure 8), we traded traditional per-spective for something like the Cubist modelused by Picasso—looking at an object from morethan one viewpoint simultaneously. In our case,we showed galaxies for the first time in both vis-ible and radio frequencies simultaneously. Iemployed color to inform, as I had withmicrobes in the “Epidemic” exhibition, and inthe resulting images, each galaxy appears radi-cally different in the two frequencies, with theradio image looking almost like a smudge ofpaint on a field of light. The images might bedescribed as collaborative artworks, created inequal parts by human hands, imaging and com-puting technology, and the distant galaxiesthemselves.
Lately, I’ve revisited astronomical data—thistime for purely artistic reasons. I’ve been exper-imenting with abstract methods of depictingreal-time data, using astronomical information(see Figures 9 and 10), atmospheric conditions,traffic patterns, or sound to create minimal,screen-based, or physical displays. It’s at an earlystage, but I have found that minimalism is key,particularly when introducing an unfamiliarlandscape. In an art exhibition, we’re preparedfor confrontation with the incomprehensible,but we have come to associate the computerscreen with the rational and “user friendly,”with help readily accessible. If we use a moreabstract piece over time, however, we can learna new language.
This is sometimes called ambient media or
8
Artful Media
Figure 6. Galaxy collision by Frank Summers (http://terpsichore.stsci.edu/
~summers/viz/mhs/).
Figure 7. Other Planetary Systems, a visualization by Frank Summers and
Kevin Walker for Rose Center/Hall of the Universe.
©20
02 A
mer
ican
Mus
eum
of N
atur
al H
isto
ry©
2002
Am
eric
an M
useu
m o
f Nat
ural
His
tory

informative art, and Hiroshi Ishii’s group at theMassachusetts Institute of Technology is doingsome interesting projects (see http://tangible.media.mit.edu/), as is Tobias Skög ofSweden’s Play Interactive Institute (http://www.viktoria.se/play/publications/2000/ainfoart.html). These are akin to what UmbertoEco calls “visual icebergs”—minimal points ofinformation on the surface, hinting at a wealthof data below.9
In installations such as these, the goal isn’tcomplete accuracy, because the outcome is oftena behavior, not a number (for more on this con-cept, see Carver Mead’s work at http://www.pcmp.caltech.edu/). Besides, our unmediatedrepresentations of reality are always false anywaybecause our brains aren’t perfect; thus we’realways in a sort of virtual reality, as DavidDeutsch argues.10 In physics, we define informa-tion as a measure of order of a physical system,and work such as this is merely a way of describ-ing physical phenomenon using different phys-ical means.
Linking technology to the real worldI’m not interested in using technology to sub-
stitute for the real world. Instead, I’d rather link itto the natural world, to mediate between real-time, real-world data and physical objects or
9
Figure 8. Active Galactic Nuclei, a composite image combining
visible and radio wavelengths.
©20
02 A
mer
ican
Mus
eum
of N
atur
al H
isto
ry
Figure 10. Real-time visualization of the sun’s position, a prototype for
installation by Kevin Walker.
Figure 9. Music of the Spheres, a prototype for installation using
real-time planetary data by Kevin Walker.

spaces. (After all, computing—whether in biologyor in silicon—is a physical process.) Most of theseinstallations aren’t interactive, but autonomous—computers interacting with other computers, andwith the physical world. Hardware prices andpower requirements are falling sufficiently enoughthat using a computer, monitor, or projector for asingle-purpose artwork is becoming more feasible.
Even the humble, ancient technology of paperhas more fidelity than the most advanced displayhardware. In museums and on the screen, we’reused to seeing science and information visualizedin pixel-accurate, simulated 3D. However, I thinkthat deeper emotional power is held by a fewpiano notes, or in a tiny da Vinci drawing. That’swhy the most interesting frontier of digital visu-alization is in the minimal and the physical.Whether on a planetarium dome or piece ofpaper, art can move raw scientific data to a newlevel of knowledge and experience. MM
References1 S. Wolfram, A New Kind of Science, Wolfram Media,
2002.
2. V. Kandinsky, Point and Line to Plane, Dover Publica-
tions, 1979, p. 11.
3. G. Richter and H.-U. Obrist, The Daily Practice of
Painting: Writings 1960–1993, MIT Press, 1995.
4. V. Vesna, “Bucky Beat: Buckminster Fuller, the
Anticipatory Design Scientist, Foreshadows the
Complex Persona of a Contemporary Media Artist,”
ArtByte, vol. 1, no. 3, Aug./Sept. 1998.
5. P. Mondrian, The New Art—The New Life: The Col-
lected Writings of Piet Mondrian, DaCapo Press,
1993.
6. M. Kreuger, Artificial Life II, Addison-Wesley, 1990.
7. I. Calvino, Six Memos for the Next Millennium, Vin-
tage Books, 1993.
8. T. Horan, “The Paradox of Place,” Comm. ACM, vol.
44, no. 3, Mar. 2001, p. 60.
9. U. Eco, Travels in Hyperreality, Harcourt Brace
Jovanovich, 1990, p. 199.
10. D. Deutsch, The Fabric of Reality, Pengiun USA,
1998.
Readers may contact Kevin Walker at kevin@
nilescanyon.net.
Contact Artful Media editor Dorée Duncan Seligmann at
Avaya Labs, 666 Fifth Ave., 11th Floor, New York, NY
10103, email [email protected].
10
IEEE
Mul
tiM
edia
Artful MediaO
ctob
er–Decem
ber 2002
January/FebruaryWeb Graphics
With the popularity of the Internet, we’re seeing a migration of tradition-al applications to run on the Web environment and a growing demandfor more powerful Web-based applications. Fused by the increasingavailability and dramatic reduction in the cost of 3D graphics accelera-tors, a new direction of research, called Web Graphics, is emerging. Thisincludes developing graphics applications as well as tools to supportthese applications in the Web environment.
March/AprilGraphics Applications for Grid Computing
Grid computing allows access to distributed computing resources withthe same ease as electrical power. In recent years, graphics applicationtools that take advantage of distributed computing, or grid environ-ments, have emerged. New methodologies and techniques that harnessresources for graphics applications are critical for the success of gridenvironments.
May/JuneAdvances in Computer Graphics
This issue covers an array of advances in computer graphics such asorganic textures, lighting, and approximation of surfaces. Also, you’llfind out about new developments in virtual reality, novel approaches invisualization, and innovative CG applications. The range of topicshighlights the usefulness of computer graphics for everyone.
July/AugustNonphotorealistic Rendering
Nonphotorealistic rendering (NPR) investigates alternatives that lever-age techniques developed over centuries by artists and illustrators todepict the world. One goal of this research is to broaden the achievablerange of image styles and thereby embrace new applications. Additional-ly, NPR has the potential to open a new line of attack on one of thecentral problems of 3D computer graphics today: content creation.
September/OctoberPerceptual Multimodal Interfaces
This issue focuses on recent advances in methods, techniques, applica-tions, and evaluations of multimodal interaction. Learn how researchers’cross-disciplinary approaches helped develop multimodal interfacesfrom interaction-centered prototypes to user-oriented and application-tailored solutions. This issue also explores the notion of moving towardtransparent user interfaces.
November/December3D Reconstruction and Visualization
Models based on 3D data will ultimately include everything associatedwith the environment, such as trees, shrubs, lampposts, sidewalks,streets, and so on. The main mode of exploration for this massive collec-tion will be through interactive visualization. Ultimately, you should beable to fly continuously from overviews of a large city to centimeter-sizedetails on the side of any building. Smoothly joining these differentscales may require integrating rendering techniques in new ways.
2003Editorial Calendar
http://computer.org/cga