Embed Size (px)
Citation preview

Å R S R A P P O R T 2 0 0 6
Contents
Introduction Mission Statement 3
Profile 4
Organisational Chart/Photo of Management 5
East is East... – Odfjell in Asia 6
Highlights 2006 8
Key Figures/Financial Ratios 9
AnnualAccounts The Directors’ Report 10
Group Profit and Loss Statement 22
Group Balance Sheet 23
Group Cash Flow Statement 24
Notes to the Group Financial Statement 26
Parent Company Profit and Loss Statement 60
Parent Company Balance Sheet 61
Parent Company Cash Flow Statement 62
Notes to the Parent Company Financial Statement 63
Auditor's Report 73
Analysis Financial Risk Management and Sensitivities 74
Corporate Governance 76
Shareholder Information 78
Business Map - Worldwide Activities 82
Chemical Transportation and Storage 84
Parcel Tankers 86
Tank Terminals 90
Ship Management 94
Health, Safety and Environmental Protection 96
General Fleet Overview 98
Glossary 100
Offices and Addresses 101
FINANCIALCALENDAR
3 May 2007 Annual General Meeting
3 May 2007 Report First Quarter 2007
23 August 2007 Report Second Quarter 2007
7 November 2007 Report Third Quarter 2007
5 February 2008 Preliminary Result 2007
Supplementary information on Odfjell
may be found on the Internet at:
www.odfjell.com
Front page photo taken at Szczecin yard, Poland.
Mission Statement
Odfjell shall be a leading, preferred and profitable global provider of transportation and storage of bulk liquid chemicals,
acids, edible oils and other special products. We shall be capable of combining different modes of transportation and storage.
We shall provide our customers with reliable and efficient services. We shall conduct our business to high quality, safety and
environmental standards.
ODFJELL ANNUAL REPORT 2006 MISSION STATEMENT 5

Profile
Odfjell is a leading company in the
global market for transportation and
storage of chemicals and other specia
lity bulk liquids. Originally set up
in 1916, the company pioneered the
development of the parcel tanker trades
in the middle of the 1950s and the tank
storage business in the late 1960s.
Odfjell owns and operates parcel
tankers in global and regional trade as
well as a network of tank terminals.
Odfjell’s strategy is to continue develop-
ing our position as a leading logistics
service provider with customers
worldwide. We are aiming at maintain-
ing this position through efficient and
safe operation of deep-sea and regional
parcel tankers and tank terminals. Our
long-term newbuilding program con-
sists of altogether 27 new ships with de-
liveries through 2013. Scale is needed
to offer an efficient trading pattern in a
global transportation context, thereby
maximizing fleet utilization. Our size
also allows us to obtain significant
purchasing benefits.
PARCELTANkERsThe deep-sea transportation of
chemicals and other liquids is our core
business. Odfjell has unprecedented
experience in this complex field of
transportation. Our operations are fully
integrated, with in-house functions for
chartering, operation and ship manage-
ment. The major trade lanes are from
the US and Europe to Asia, India, the
Middle East and South America. In ad-
dition there is a considerable bilateral
trade between the US and Europe. Sea-
going transport from the Arabian Gulf
to destinations both in the East and in
the West is increasing as new produc-
tion capacity is being developed in this
area. Over the last years there has also
been a large production increase in the
Far East, and a considerable share of
this volume goes to overseas markets.
Volumes shipped regionally are
steadily increasing, particularly in
the Asia Pacific region. As end-users
of petrochemicals require products
delivered on shorter notice and with
less lead-time, the major petrochemi-
cal producers are building production
complexes closer to their markets.
Our largest regional operation is in
Asia, where twelve ships are operated
out of Singapore. Furthermore we
have nine ships employed in the inter-
European trade and six ships along the
coasts of South America. In September
2006 we took delivery of our first ship to
be operated within China.
Odfjell’s specialized fleet consists of 91
ships and 27 newbuildings with a total
capacity of about 3.3 million dwt.
A turnover of USD 939 million was gen-
erated in 2006.
TANkTERmINALsOur terminal operations yield synergies
with our transportation activities and
improve quality and efficiency control
throughout the transportation chain.
Our tank terminal operations also offer
opportunities to develop new markets
where the infrastructure for specialised
bulk liquids has been limited to date.
Odfjell has direct investments in fully
owned tank terminals in Rotterdam and
Houston as well as in partially owned
terminals in Singapore, Onsan in Korea,
and two in China. We also work closely
with eight terminals in South America
through associated companies. We are
currently expanding our tank terminal
activities with new facilities under
construction in China, Iran and Oman.
The terminal business generated a
turnover of USD 152 million in 2006.
Odfjell Management
BOArd Of dIrEcTOrS
PrESIdENT/cEO
PArcEL TANKErS & TErMINALS SHIP MANAGEMENT
ASIA cOrPOrATE INvESTMENTS – fINANcE/IcT/cOMMuNIcATION – HuMAN rESOurcES – QuALITy MANAGEMENT
JAN A. HAMMEr President, Parcel Tankers and TerminalsBorn 1957. Mr. Hammer has been with the company since 1985. He has previously held various management positions with-in Odfjell, both in chartering and terminal activities. No shares and no options.
ATLE KNuTSEN Senior vice President, AsiaBorn 1950. Mr. Knutsen has been with the company since 1972. He has held various management positions within Odfjell and has been in his current position since April 2003. 14 048 shares. No options.
HAAKON rINGdAL Senior vice President/cfOBorn 1954. Mr. Ringdal joined Odfjell in 2001. He has previous experience from the finance/accounts area within ship-ping, banking, property and insurance. No shares and no options.
JAN dIdrIK LOrENTZ Senior vice President, Quality Management Born 1947. Mr. Lorentz joined Odfjell in 1996 and has held his current position since April 2005. He previously held the position as SVP Ship Management. No shares and no options.
6 ODFJELL ANNUAL REPORT 2006 PROFILE ODFJELL ANNUAL REPORT 2006 OdfJELL MANAGEMENT 7
TErJE STOrENG President/cEO Born 1949. President/CEO since 2003. Previously Managing Director of AS Rederiet Odfjell. 72 672 shares. No options.
HELGE OLSENSenior vice President, Ship Management. Born 1958. Mr. Olsen joined Odfjell in 2000 and has held various management positions. He has been in his current position since August 2006. No shares and no options.
TOrE JAKOBSEN Senior vice President, corporate InvestmentsBorn 1951. Mr. Jakobsen joined Odfjell in October 2005. Previous position as Presi-dent/CEO of Westfal-Larsen & Co A/S in Bergen. No shares and no options.
BrIT A. BENNETTvice President, Human resources. Born 1951. Ms. Bennett joined the company in 2000. She has previously held the position as Personnel Manager in the bank and oil industry, and Executive Manager in Bergen Municipality. No shares and no options.

East is East… - Odfjell in Asia
8 ODFJELL ANNUAL REPORT 2006 EAST IS EAST... OdfJELL IN ASIA ODFJELL ANNUAL REPORT 2006 EAST IS EAST... OdfJELL IN ASIA 9
‘Oh, East is East and West is West, and
never the twain shall meet’, rudyard
Kipling wrote almost 120 years ago.
Today, happily we can say that he was
wrong. Modern technology, both in terms
of transport and information, has made
the world more integrated and dimin
ished cultural differences and language
barriers. Although Asia still is “different”
and fascinating to westerners, we share
many of the same characteristics of
modern society, both the benefits as well
as the less favourable aspects of it.
Asia has made tremendous develop
ment leaps since the end of World War II;
Japan in the 1950s and 60s, South Korea
and Taiwan in the 1970s and 80s, the
Asian newly industrialised “Tiger econo
mies” in the 1980s and 90s, and in the
last decade china has emerged as a new
economic superpower. Today, Asia not
including the Middle East accounts for
22% of world GdP, 56% of world popula
tion and 26% of world economic growth.
With its superior pool of manpower and
considerable resources, Asia is likely to
maintain its position as a powerhouse
for growth also in the short and medium
term.
china is perhaps the most striking
example of Asian progress, and in the
three decades since the death of Mao
Zedong and the final end to the cultural
revolution the country has made huge
advances. The large and industrious
workforce is striving to improve the
standard of living, and the authorities
are paving the way for further growth
through massive infrastructure improve
ments and relatively businessfriendly
legislation. After several years of double
digit growth, china has now surpassed
Great Britain as the world’s fourth largest
economy. With the current trend it is
expected in a few years’ time to overtake
Germany as the third largest economy,
and Japan is not very far ahead.
Although still mostly affecting the
eastern coastal regions and the Beijing
area, the rapid changes to the chinese
society are apparent to anyone visiting
china these days. Early November
2006 Odfjell’s Board of directors held
a board meeting in Shanghai, giving the
participants a firsthand impression of
the chinese development. What strikes
you when coming to Shanghai, in addition
to the large number of people and the
dense traffic, is the incredible construc
tion activity. There are building cranes
virtually everywhere, and skyscrapers
and similar projects are popping up very
rapidly. Having come to china several
times over the last years, it is also easy
to see the vast improvements that are
being made on infrastructure, with better
roads and rail services to accommodate
the growing population and not least the
rapidly expanding car pool. To take the
Maglev train from the airport to the city
centre, reaching a speed of more than
430 km per hour, is an experience in
itself.
for Odfjell it is important to be a part of
the rapidly growing Asian market. Our
deepsea vessels have for decades been
taking cargo in and out of Asian ports,
and over the years we have set up mar
keting offices in many countries in the re
gion; Japan, India, Singapore, china and
Korea. Already ten years ago we firmed
our Asian presence when we established
Odfjell Asia and started our regional
interAsia tanker service out of Singa
pore. from a modest start with only a few
ships, the Singapore office now operates
a fleet of 1215 ships and Odfjell has
jiangyinA new Odfjell terminal is under construc-
tion in Jiangyin on the Yangtze River. Here
the T-jetty under construction.
become a major player in the Asia Pacific
regional trade. To further strengthen our
market position, Odfjell has also acquired
part ownership of storage terminals in
several major Asian ports: Singapore,
Onsan (South Korea), dalian and Ningbo
(china). currently we are building a
brand new terminal in Jiangyin on the
yangtze river, and quite recently we
struck a deal to set up yet another one on
the Hainan Island in Southern china. Last
November we officially inaugurated the
joint venture company Odfjell dongzhan,
which holds a licence for doing chinese
domestic coastal trade.
Odfjell’s efforts in the Asian markets are
based on expectations of a positive long
term development, and I am confident
that our presence in the region will be
beneficial to the company. I am equally
certain that Odfjell will continue to make
a positive contribution to Asian progress,
through our skilled and determined
organisation, our highquality ships
and terminals, our quality systems and
costefficient solutions. As an interna
tional company we have the benefit of
employing many Asians, who contribute
to our achievements in the region.
Terje STorengPresident/CEO, Odfjell ASA
yet, we have to be humble, be respectful
to Asian ways and culture, and realise
that we still have things to learn and
improve in our approach to conducting
business in these markets. Joining east
and west is advantageous to us all, and
at Odfjell we are doing our share to facili
tate this process.

Highlights 2006
FINANCIALPERFoRmANCE• Gross revenue of uSd 1 088.
• EBITdA of uSd 260 million.
• EBIT of uSd 156 million.
• Net result of uSd 116 million.
• cash flow of uSd 235 million.
mACRovARIABLEsAsia, and particularly china, remained
the world’s main growth engine also in
2006. World GdP growth is forecasted
strong also the next few years, although
probably not quite at 2006 levels.
A reasonably good year for shipping,
although average earnings were not quite
as high as during the previous two years.
record high bunker prices.
AssETDEvELoPmENTdelivery of M/T Bow Sea and M/T Bow
Sirius , the sixth and seventh ships in a
series of eight 40 000 dwt newbuildings
from Stocznia Szczecinska Nowa in
Szczecin, Poland.
M/T Bow Engineer 30 000 dwt, M/T Bow
Plata 19 800 dwt and M/T Bow fuji 19 800
dwt, delivered on long term timecharter
from Japanese owners.
M/T Bow Orania 19 900 dwt and M/T Bow
Ophelia 19 900 dwt delivered to Odfjell
by Ahrenkiel, Switzerland into a pool with
similar Odfjell ships.
M/T Bao Hai Tun 3 800 dwt delivered
to joint venture company in china,
49% owned by Odfjell ASA.
four secondhand chemical tankers
were acquired; M/T “Giada d” (10 115
dwt./built 1996) was renamed “Bow Que
rida”. M/T “Euro Azzurra” (13 843/1997)
renamed M/T “flumar Aratu”. This ship
was acquired by a Norwegian 50/50 joint
venture company. finally, M/T “Brage
Atlantic” (17 460 /1995) and M/T “Brage
Pacific” (17 460/1997) were acquired with
delivery during first and second quarter
2007.
New long term timecharter agreement
with Japanese owners for a 33 000 dwt
newbuilding with delivery in 2009.
five singleskin coated tankers were
upgraded with double sides to comply
with new MArPOL regulations.
Sale of M/T Bow Gorgonilla 8 192 dwt
(1989) and M/T Bow Antisana 8 192 dwt
(1989) with bareboat charter back.
Bow Andes (50% owned) 28 060 dwt sold
for demolition in July.
M/T Bow Heron 35 289 dwt (1979) sold to
new owners.
shAREhoLDERIssuEsThe Odfjell share price fell by about 16%
expressed in Norwegian kroner, and the
yearend market capitalisation came to
about NOK 9.2 billion (uSd 1.5 billion).
In 2006 Odfjell acquired treasury shares.
1 500 000 Ashares and 1 811 255
Bshares were acquired, representing
about 3.8% of the shares of the company.
during 2006 an ordinary dividend of NOK
3.25 per share was paid out in May and
an extra dividend of NOK 2.25 per share
was paid out in October.
rESuLT BEfOrE EXTrAOrdINAry ITEMS
cASH fLOW
OrdINAry dIvIdENd
EXTrA 2Nd HALf dIvIdENd
DIvIDENDPAID
97 98 99 00 01 02 03 04 05 06
70
60
50
40
30
20
10
0
uSd million
shAREhoLDERs’EQuITYuSd million
97 98 99 00 01 02 03 04 05 06
700
600
500
400
300
200
100
0
REsuLTANDCAshFLoW
97 98 99 00 01 02 03 04 05 06
200
150
100
50
0
50
uSd million
oPERATINGREsuLT(EBIT)
97 98 99 00 01 02 03 04 05 06
250
200
150
100
50
0
uSd million
10 ODFJELL ANNUAL REPORT 2006 HIGHLIGHTS
1. Operating result before depreciation and capital gain (loss) on noncurrent assets. 2. Operating result. 3. Net result allocated to shareholders’ equity before extraordinary items divided by the average number of shares. 4. Net result allocated to shareholders’ equity divided by the average number of shares. 5. Net result allocated to shareholders’ equity plus depreciation and extraordinary items divided by the average number of shares. 6. Net result plus interest expenses and extraordinary items divided by average total assets. 7. Net result plus interest expenses divided by average total assets. 8. Net result plus extraordinary items divided by average total equity.
9. Net result divided by average total equity. 10. Operating result divided by average total equity plus net interestbearing debt. 11. Shareholders’ equity divided by number of shares per 31.12. 12. Net result allocated to shareholders’ equity plus depreciation and extraordinary items. 13. Bank deposits and securities includes cash and cash equivalents and availableforsale investments.14. Interestbearing debt less bank deposits and securities, divided by cash flow (12) before capital gain (loss) on noncurrent assets. 15. current assets divided by current liabilities. 16. Total equity as percentage of total assets.
ODFJELL GROUP Figures in 2006 2005 2004 2003 2002 2001 2000 1999 1998 1997
From Profit and Loss StatementGross revenue uSd mill. 1 088 1 045 943 907 850 852 696 551 533 547 EBITdA (1) uSd mill. 260 264 207 170 159 203 112 86 94 113 depreciation uSd mill. (119) (107) (100) (92) (87) (83) (69) (56) (48) (39) capital gain (loss) on noncurrent assets uSd mill. 15 14 7 (0) 1 4 16 12 32 EBIT (2) uSd mill. 156 170 114 78 72 124 44 46 58 106 Net financial items uSd mill. (41) (28) (9) 7 (12) (55) (54) (30) (26) (24) Net result allocated to shareholders’ equity before extraordinary items uSd mill. 116 127 94 77 45 60 (12) 16 30 82 Net result allocated to shareholders’ equity uSd mill. 116 127 94 22 45 60 (12) 16 30 82 Net result uSd mill. 116 128 95 22 46 60 (12) 16 30 82 dividend paid uSd mill. 72 60 53 24 22 11 10 11 12 9 From Balance Sheet Total noncurrent assets uSd mill. 1 815 1 656 1 568 1 482 1 314 1 301 1 292 990 892 712 current assets uSd mill. 374 300 260 233 315 299 321 281 274 272 Shareholders’ equity uSd mill. 702 692 639 578 535 526 530 451 447 373 Minority interests uSd mill. 6 4 4 4 4 5 Total noncurrent liabilities uSd mill. 1 225 1 008 951 949 981 968 961 749 648 543 current liabilities uSd mill. 256 255 244 184 110 103 117 71 70 69 Total assets uSd mill. 2 189 1 956 1 872 1 715 1 630 1 601 1 613 1 271 1 166 985 Profitability Earnings per share basic/diluted before extraordinary items (3) uSd 1.4 1.5 1.1 0.9 0.5 0.6 (0.1) 0.2 0.3 0.9Earnings per share basic/diluted (4) uSd 1.4 1.5 1.1 0.3 0.5 0.6 (0.1) 0.2 0.3 0.9cash flow per share (5) uSd 2.8 2.7 2.2 2.0 1.5 1.4 0.6 0.8 0.9 1.4return on total assets before extraordinary items (6) % 8.2 8.6 6.9 6.3 5.0 7.0 3.3 4.8 6.2 12.4 return on total assets (7) % 8.2 8.6 6.9 3.0 5.0 7.0 3.3 4.8 6.2 12.4 return on equity before extraordinary items (8) % 16.6 19.2 15.4 13.8 8.6 11.4 (2.4) 3.6 7.4 22.7 return on equity (9) % 16.6 19.2 15.4 4.0 8.6 11.4 (2.4) 3.6 7.4 22.7 return on capital employed (10) % 9.5 11.6 8.4 6.0 5.7 9.8 3.8 4.9 7.4 16.5 Financial Ratios Average number of shares mill. 84.23 86.77 86.77 86.77 89.73 98.75 95.02 87.39 87.39 87.39Basic/diluted equity per share (11) uSd 8.41 7.98 7.36 6.66 6.17 5.75 5.13 5.16 5.11 4.27Share price per Ashare uSd 18.34 20.26 17.54 5.54 3.95 3.74 3.79 3.11 1.91 4.41cash flow (12) uSd mill. 235 235 194 170 132 143 57 72 78 121 Interestbearing debt uSd mill. 1 293 1 037 1 000 943 957 960 954 749 647 542 Bank deposits and securities (13) uSd mill. 242 190 233 203 230 213 232 218 213 219 debt repayment capability (14) years 4.8 3.8 4.1 4.4 5.5 5.4 12.7 9.4 6.5 3.6current ratio (15) 1.5 1.2 1.1 1.3 2.9 2.9 2.7 4.0 3.9 3.9Equity ratio (16) % 32 35 34 34 33 33 33 35 38 38 Other uSd/NOK rate at yearend 6.27 6.76 6.04 6.68 6.96 9.01 8.90 8.04 7.60 7.32 Employees at yearend 3 487 3 296 3 416 3 316 3 201 3 088 2 755 1 743 1 667 1 667
figures from profit and loss statement are according to International financial reporting Standards (IfrS) as from 2004 and for balance sheet as from 2003. As from financial year 2000, the reporting currency was changed from NOK to uSd. uSdfigures for 19982006 reflect “true” uSdaccounting as presented in the official accounts. The conversion from NOK to uSd for the year 1997 has been simplified by using the average rate per year for the profit and loss statement and the yearend rate for the balance sheet. Net financial items for this year do not include unrealised currency items. As a result of the conversion from NOK to uSd, the various ratios have been recalculated. Historical figures per share have been adjusted for past bonus share issues and the sharesplits in 2004 and 2005.
Key Figures/Financial Ratios
ODFJELL ANNUAL REPORT 2006 KEy fIGurES/fINANcIAL rATIOS 11

Odfjell’s consolidated net result for 2006
was a profit of uSd 116 million compared
with uSd 128 million in 2005. Gross
revenue increased by uSd 43 million to
uSd 1 088 million.
The parcel tanker market was somewhat
weaker than in 2005, especially during
the second and third quarter where
volumes were slow. In the fourth quarter
activity and results improved again. Our
tank terminal business turned in a better
result in 2006 than the previous year.
2006 saw continued renewal of our
fleet through deliveries of newbuild-
ings, investments in modern ships and
outphasing of older tonnage. Odfjell took
delivery of two 40 000 dwt newbuildings
from Poland and one sistervessel will be
delivered medio 2007. Odfjell has options
for further two such ships to be delivered
in 2010. We took delivery of three new
ships on long-term charters from Japa-
nese interests, two of 19 800 dwt. and one
of 30 000 dwt., and we entered into a new
long-term time-charter for one 33 000
dwt. fully stainless steel parcel tanker for
delivery in 2009. In addition, our partner
Ahrenkiel, Switzerland, delivered the
first two of in total six 19 900 dwt. parcel
tankers into a pool with the same number
of similar ships controlled by Odfjell. We
also acquired four modern stainless steel
chemical tankers, of which two were
delivered in 2006 and two will be delivered
in 2007. The first chemical tanker built
for Odfjell in China for domestic trading
was delivered in 2006. One 50% owned
ship was sold for demolition, two were
sold with bare-boat charter back and one
older coated ship was sold to a third party
for further trading. The sales yielded a
capital gain of USD 2.8 million.
Our new tank terminal projects in China,
Iran and Oman are progressing. In con-
nection with the relocation and expansion
of the tank terminal in Dalian, China, we
received compensation from the Chinese
government resulting in a capital gain of
USD 12 million.
The Annual General Meeting (AGM) held
4 May 2006 re-elected Peter G. Livanos,
Stein Pettersen and Laurence W. Odfjell
as Board Members for a two year period.
Terje Storeng renounced being re-elected
due to his position as President/CEO.
During 2006 the Odfjell share price fell
by about 16% expressed in Norwegian
kroner, and the year-end market
capitalisation came to about NOK
9.2 billion (USD 1.5 billion).
BusINEsssummARYWe remain committed to a long-term
strategy of enhancing our position as a
leading specialty bulk liquids logistics
provider. Through a substantial newbuild-
ing program and the safe and efficient
operation of global and regional parcel
tankers, we continue to consolidate
our position; one which should further
benefit from our expanding tank terminal
activities. The fleet operates with complex
and extensive trading patterns and our
customers expect and demand the high-
est standards in our transportation and
storage services, either on a stand-alone
basis or as a combined logistical pack-
age. Critical mass enables us to maintain
efficient trading patterns, optimise fleet
utilisation and maximise purchasing
benefits.
ParcelTankersGross revenue from our parcel tanker
activities was USD 939 million. Earnings
before interest, tax, depreciation and
amortisation (EBITDA) came to USD 202
The Directors´ Report
million. The operating result (EBIT) was
USD 106 million. Total assets at year-end
amounted to USD 1.7 billion. Time-char-
ter income expressed in USD per day
declined by about 2% compared to last
year. This reduction is explained primarily
by higher bunker prices. The parcel/
chemical market remained stable during
most of the year. The CPP market on the
other hand, was subject to much stronger
fluctuations with a relatively good start,
a slowdown during the second and third
quarter, but with a solid increase in
demand and higher earnings towards the
end of the year.
The average cost of bunkers in 2006 was
USD 288 per ton (including compensation
related to bunker escalation clauses),
compared to USD 227 per ton the preced-
ing year. Operating expenses on a compa-
rable fleet basis were 1% higher in 2006
than in 2005. We expect that operating
expenses will continue at a relatively high
level, reflecting general price increases
and the increasing costs of maintaining
and continually upgrading parcel tankers
to the standard that is required for our
complex and demanding trade.
At year-end 2006 our parcel tanker
fleet consisted of 68 ships over 12 000
dwt., of which 46 were owned - and 25
smaller ships, of which 13 were owned.
Our current most significant newbuild-
ing program is with the Russian shipyard
CEBMAW Sevmash Production Associa-
tion at Severodvinsk near Archangelsk
where we are building a series of eight to
twelve large, advanced product/chemical
carriers, for delivery 2007 onwards. These
will be IMO type II fully coated vessels
of about 45 000 dwt. and are intended to
replace some of our older parcel tankers.
We expect a good commercial demand
for this type of ships due to recently
enacted, stricter MARPOL rules requiring
double-hulled tankers for the shipping
of vegetable oils and certain other bulk
liquid products. During 2006 the build-
ing contracts were amended to include
buyer’s termination rights for the ninth,
tenth, eleventh and twelfth vessel in the
series, and a price of USD 50 mill per
unit. This amendment has modified the
original agreement with market related
prices for the same vessels. The average
contract price for the first eight vessels
has been increased from USD 41 million
to USD 43 million per unit. The first vessel
is expected to be delivered fourth quarter
2007.
In April 2006 we took delivery of the
40 048 dwt. M/T Bow Sea from Stocznia
Szczecinska Nowa in Poland. She is the
sixth ship in a series of eight fully stain-
less steel newbuildings with very high
technical and equipment specifications
from the Polish yard. In December 2006
we took delivery of the seventh ship in the
series, the M/T Bow Sirius of 40 005 dwt.
The remaining ship will be delivered in the
second quarter 2007. We have options of
two further ships with deliveries in 2010.
During 2006 we entered into a long-
term time-charter agreement with a
Japanese owner for one further stain-
less steel tanker newbuilding of 33 000
dwt. In total, Odfjell now has contracts for
sixteen long-term time-charter newbuild-
ings from Japan ranging in size from
19 000 dwt. to 33 000 dwt. Eight ships are
already in operation, of which three were
delivered during 2006. The remaining
eight will be delivered between 2007 and
2009. We have agreed purchase options
on most of these ships.
In 2006 Odfjell acquired four second-hand
chemical tankers with stainless steel
ASIA EXcL. cHINA ANd JAPAN
OEcd ArEA
GDPGRoWTh
89 90 91 92 93 94 95 96 97 98 99 00 01 02 03 04 05 06
9%
8%
7%
6%
5%
4%
3%
2%
1%
0%
1%
2%
3%
4%
5%
6%
7%
(75%) OdfJELL OWNEd SHIPS
(15%) SHIPS ON fIXEd rATE
TIMEcHArTEr
(10%) SHIPS ON fLOATING rATE
TIMEcHArTEr
FLEETDIsTRIBuTIoNParcel Tankers
source: DnBNOR
12 ODFJELL ANNUAL REPORT 2006 THE dIrEcTOrS´ rEPOrT ODFJELL ANNUAL REPORT 2006 THE dIrEcTOrS´ rEPOrT 13
HOuSTON/rOTTErdAM
HOuSTON/fAr EAST
FREIGhTRATEs
2005 2006
150
125
100
75
50
25
0
1 000 mts stainless steel grade chemicalsuSd/Mt
Source: Quincannon Associates, Inc.
HOuSTON/rOTTErdAM
HOuSTON/fAr EAST
FREIGhTRATEs
2005 2006
125
100
75
50
25
0
3 000 mts easy grade chemicalsuSd/Mt
Source: Quincannon Associates, Inc.

cargo tanks, built between 1995 and 1997.
M/T “Giada D” (10 115 dwt./built 1996) was
built in Italy and was renamed “Bow Que-
rida”. M/T “Euro Azzurra” (13 843/1997)
was built in Italy and renamed M/T
“Flumar Aratu”. This ship was acquired by
a Norwegian 50/50 joint venture company
owned by Odfjell ASA and Kristian Ger-
hard Jebsens Skipsrederi AS for trading
in Brazil. Finally, M/T “Brage Pacific” (17
460/1997), now renamed “Bow Oceanic”,
and M/T “Brage Atlantic” (17 460 /1995)
were both built in Norway. Delivery of
these last two vessels will take place
during first and second quarter 2007.
Capital gain on assets includes USD 1.6
million as gains of the sale of M/T Bow
Heron (35 289 dwt./built 1979) and the two
sister ships M/T Bow Gorgonilla (8 192
dwt./built 1989) and M/T Bow Antisana
(8 192/1989). The latter two ships were
delivered to new owners in first quarter
2006, and were taken back on bare-boat
charter for an eighteen-month period.
During the bare-boat period the ships
continue in their present trade, and under
Odfjell ship management.
M/T Bow Andes (28 060 dwt./built 1977)
was sold for demolition in July. Our 50%
equity in this vessel brought us a gain of
about USD 1.2 million.
In accordance with new MARPOL
regulations, several products previously
transported by product tankers will be
reserved for IMO II type chemical tankers,
as from January 1st, 2007. In preparation
for the new regulations, we upgraded five
of our double bottom/single side coated
tankers to fully double hull, all completed
during 2006.
In combination with our worldwide
transoceanic services, our regional
business activities encompass four
different geographical areas. Our largest
regional operation is in Asia, where we
employ 13 ships on several trade lanes
within the Singapore – Japan/Korea
– Australia/New Zealand range.
Asia represents a growth area for our
business with significant new chemical
production expected to come on stream
within the near future. In September 2006
our 49% owned joint venture company
Odfjell Dong Zhan Shipping (Shanghai) Co
Ltd took delivery of “Bao Hai Tun”. This
chemical tanker of 3 850 dwt. with coated
cargo tanks is registered under Chinese
flag and the first ship that our joint ven-
ture in Chinese coastal trade operates.
Odfjell Ahrenkiel currently operates nine
parcel tankers in inter-European trades.
In South-America, four ships are em-
ployed by Flumar, a 50/50 joint venture
company transporting primarily chemi-
cals along the Brazilian coast, where
local flag is a requirement. Finally, we
have a 50/50 joint venture with CSAV in
Chile employing two vessels in the coastal
transportation of sulphuric acid.
TankTerminalsGross revenue from the tank terminal
activities increased to USD 152 million,
EBITDA was USD 58 million and EBIT was
USD 51 million. In connection with the re-
location of the terminal, Odfjell Terminals
(Dalian) received compensation of about
USD 42 million from the Chinese Govern-
ment. After impairment charges on parts
of the “old” terminal and other income/
expenses of USD 18 million related to the
relocation, our 50% share from the com-
pensation came to USD 12 million, which
is recognized as capital gain. At year-end
2006, our total tank terminal assets were
about USD 440 million.
Odfjell’s existing tank terminal activities
consist of owning and operating tank ter-
minals in Rotterdam, Houston, Singapore,
Onsan in Korea, and Dalian and Ningbo in
China. We also have a cooperation agree-
ment with a group of tank terminals in
South America owned by members of the
Odfjell family.
However, the expansion of our tank ter-
minal activities continues, with the relo-
cation and expansion in Dalian, China and
new projects in Jiangyin, China, Oman
and at Bandar Iman Khomeini, Iran. With
our partner in the Jiangyin terminal,
the Garson Group, and with the State
Yangpu Industrial Development Agency
on Hainan Island, South China, Odfjell
has jointly agreed to invest USD 50 million
in a greenfield tank terminalling “hub”
facility in the deepwater port and free
trade zone of Yangpu. The strategy of
Odfjell Terminals is to continue to grow
along Odfjell’s major shipping lanes and
at important petrochemical logistics junc-
tions around the world. Odfjell Terminals
is investing in emerging market coun-
tries and enhancing the development of
infrastructure for the safe and efficient
operations in these regions.
2006REsuLTGross revenue for 2006 for the Odfjell
Group was USD 1 088 million, up 4% from
the preceding year. Earnings before inter-
est, tax, depreciation and amortisation
(EBITDA) were USD 260 million compared
to USD 264 million in 2005. Operating
result (EBIT), including a USD 15 million
capital gain on assets, came to USD
156 million compared to USD 170 million
in 2005. EBITDA and EBIT in 2006 in-
cluded reduced revenue due to payments
and provisions in relation to the antitrust
case and related matters totalling USD
13 million.
The net result for 2006 came in some-
what disappointingly at USD 116 million
compared to a profit of USD 128 million
in 2005. The cash flow continued to be
strong at USD 235 million, same as the
year before.
Operating expenses as well as general
and administrative expenses were higher
in 2006 than in 2005, partly because our
favourable multi-year currency hedging
position came to an end in 2005. Positive
contributions from currency hedging
reduced operating expenses by USD
12 million and general and administrative
expenses by USD 9 million in 2005. Net
financial expenses for the full year 2006
were USD 42 million, compared to USD
28 million in 2005. The increase is caused
by higher interest rates and higher net
debt due to investments.
The average USD/NOK exchange rate
in 2006 was 6.41, compared to 6.45 last
year. The USD weakened against the NOK
from 6.76 at year-end 2005 to 6.27 at 31
December 2006. Taxes became a net in-
come of USD 1 million in 2006 compared
to a tax cost of USD 19 million in 2005.
The reduced tax cost was due to a USD
12 million write-off of deferred taxes in
2005 that was reversed in 2006 following
a corporate restructuring.
The parent company, Odfjell ASA, record-
ed a profit for the year of NOK 882 million.
The main part of the profit comes from
group contributions and dividends from
subsidiaries. The Board recommends
a dividend of NOK 3 per share for 2006,
14 ODFJELL ANNUAL REPORT 2006 THE dIrEcTOrS´ rEPOrT ODFJELL ANNUAL REPORT 2006 THE dIrEcTOrS´ rEPOrT 15
Five of our single skin coated tankers
were upgraded with double sides in 2006.

in total NOK 260 million. The dividend
will be covered by the 2006 profit, and
the Board recommends that the balance
of the profit, NOK 622 million, is trans-
ferred to Other Equity. Total distributable
reserves at 31 December 2006 were NOK
966 million.
The A-shares at the end of 2006 were
trading at NOK 115 (USD 18.34), down
16 % compared to NOK 137 (USD 20.26)
year-end 2005. The B-shares were
trading at NOK 95.25 (USD 15.19) at the
end of 2006, down 18.6% from NOK 117
(USD 17.3) year-end 2005. During 2006 a
dividend of NOK 3.25 per share was paid
out in May and another dividend of NOK
2.25 per share was paid out in October.
Adjusted for this dividend the A- and B-
shares had negative yields of 12% and
14 % respectively. By way of comparison,
the Oslo Stock Exchange benchmark
index rose by 32 %, the marine index
increased by 1.3% and the transportation
index improved by 2.6% during the year.
The market capitalisation of Odfjell was
NOK 9.2 billion (USD 1.5 billion) as per
31 December 2006.
The Annual General Meeting will be
held May 3 2007 at 16:00 hours at the
Company’s headquarters. The Board
recommends a dividend of NOK 3.00 per
share, equal to NOK 260.3 million (about
USD 0.48 per share, equal to USD 41.5
million). In line with the dividend policy
in place, the Board will consider another
dividend later this year. Based on the
average share price in 2005 the direct
yield, through dividend payments in 2006,
equals about 4.3%.
According to § 3.3 in the Norwegian
Accounting Act we confirm that the
accounts have been prepared on the
assumption of a going concern.
FINANCIALRIskANDsTRATEGYOur financial strategy is to be sufficiently
robust to withstand prolonged adverse
conditions, such as long term down-
cycles in the markets where we operate
or unfavourable conditions in the financial
markets. Odfjell has an active approach
in managing risk in the financial markets.
This is done through funding from diversi-
fied sources, maintaining high liquidity or
loan reserves, and through a systematic
monitoring and management of financial
risks related to currency, interest rates
and bunkers.
The single largest monetary cost com-
ponent affecting time charter earn-
ings is bunkers. In 2006 it amounted to
about 59% of voyage cost. A change in
the average bunker price of USD 10 per
ton equals about USD 5 million (or USD
290/day) change in time charter earn-
ings for the ships where we have a direct
economic interest. A certain portion of
our bunker exposure is hedged through
bunker adjustment clauses in the Con-
tracts of Affreightment. Additionally, we
have hedged about 15% of our total 2007
exposure through bunker swaps as per
31 December 2006.
All interest-bearing debt, except debt by
our tank terminals outside the US, is
denominated in USD. Bonds issued in
non-USD currencies are swapped to
USD. At the end of 2006 about 80 % of
our gross debt was floating, based on
USD LIBOR rates. An increasing share of
our debt is fixed either through fixed rate
loans or through long-term interest rate
swaps. In order to reduce the volatility in
net result and cash flow related to chang-
es in short term interest rates, interest
rate periods on floating rate debt and on
liquidity are managed to be concurrent.
The Group’s revenues are primarily in
US Dollars; only tank terminals out-
side the US and our European shipping
trade through Odfjell Ahrenkiel receive
revenues in non-USD currency. Our cur-
rency exposure related to the net result
and cash flow arises from voyage related
expenses, ship operating expenses and
general and administrative expenses
denominated in non-USD currencies,
primarily in NOK and EUR. We have
estimated that a 10% strengthening of
the USD versus the NOK and EUR will
improve the pre-tax result by roughly USD
12 million, then disregarding the result of
any currency hedging.
Our currency hedging as per 31 Decem-
ber 2006, whereby we have sold USD and
purchased NOK and EUR, covers about
33% of our 2007 exposure. The average
USD/NOK exchange rate for open
hedging positions as of 31 December
2006 was at 6.44. Future hedging periods
may vary depending on changes in
market conditions.
LIQuIDITYANDFINANCINGThe company’s cash reserves including
available-for-sale investments, which are
low risk and highly liquid bonds, continue
strong. Cash and cash equivalents and
available-for-sale investments as of 31
December 2006 was USD 242 million
compared to USD 190 million as of 31
December 2005. Additionally, undrawn
credit facilities equalled USD 15 million
as per 31 December 2006. Interest bear-
ing debt increased from USD 1 037 mil-
lion year-end 2005 to USD 1 291 million
per 31 December 2006. Net interest bear-
ing debt was USD 1 049 million as per
31 December 2006. Increased debt is due
to yard instalments towards newbuildings
and repurchase of treasury shares.
During 2006 the company acquired
1 500 000 A-shares and 1 811 255 B-
shares, representing about 3.8% of the
shares of the company, for a total amount
of USD 51.2 million. The equity ratio was
32% as per 31 December 2006 and the
current ratio was 1.4. Since our fleet
consists of speciality ships, in a market
with limited relevant sale and purchase
activity, we have not attempted to calcu-
late valueadjusted shareholders’ equity.
The company should be evaluated based
on earnings multiples rather than based
on asset valuations.
Long-term financing of six newbuildings
from the Szczecin yard in Poland was
established in 2004. This financing is at
attractive terms through Polish export
credit arrangements.
Since 2005 we have been more active
in tapping the bond market, in addition
to traditional bank and lease financing.
In February 2006 we launched a second
bond issue in the Norwegian market with
a maximum amount of NOK 600 million.
The first tranche issued was NOK 400
million (USD 61 million). DnBNOR Mar-
kets was the sole lead manager for this
bond, which has a tenor of five years and
a coupon based upon the 3 month NIBOR
+ 0.80%. The bonds are listed on the
Oslo Stock Exchange. In December 2006
Odfjell ASA’s wholly-owned subsidiary,
Odfjell Asia II Pte Ltd, issued Singapore
Dollar (SGD) 160 million in principal
amount of notes, comprising SGD 50
million 5-year fixed rate notes and SGD
110 million 5-year floating rate notes.
The notes are guaranteed by Odfjell ASA.
DBS Bank Ltd. was Sole Lead Manager
and Bookrunner for the offering. The
5-year fixed rate notes will pay a coupon
of 4.15% p.a. and the 5-year floating rate
notes will pay a coupon of 0.88% p.a.
over the 6-month SGD swap offer rate.
This issue is the first SGD debt securities
offering by Odfjell and the notes were
well-received by asset management
companies, banks, government agencies,
insurance companies and private banks.
The proceeds of the offering will be used
for financing newbuildings. Both NOK and
SGD-debt has been swapped into USD.
Furthermore, in 2006 we entered into two
long-term secured loan facilities in a total
amount of about USD 275 million, partly
to refinance unsecured debt and partly to
finance ship investments.
kEYFIGuREsReturn on equity was 16.6% and return on
total assets was 8.2%. Return on capital
employed (ROCE) was 9.5% in 2006.
Earnings per share amounted to USD 1.38
(NOK 8.82) in 2006, compared to USD 1.47
(NOK 9.47) in 2005. Cash flow per share
16 ODFJELL ANNUAL REPORT 2006 THE dIrEcTOrS´ rEPOrT ODFJELL ANNUAL REPORT 2006 THE dIrEcTOrS´ rEPOrT 17

was USD 2.79 (NOK 17.85) in 2006, com-
pared to USD 2.71 (NOK 17.46) in 2005.
As per 31 December 2006 the Price/Earn-
ings ratio (P/E) was 12.8 and the Price/
Cash flow ratio was 6.3. Based on book
value the Enterprise Value (EV)/EBITDA
multiple is 6.8 while, based upon market
value as per 31 December 2006, the EV/
EBITDA multiple was 9.7. Interest cover-
age ratio (EBITDA/Net interest expenses)
was 6.1, compared to 9.3 the correspond-
ing period last year.
TRANsFoRmATIoNToANsEComPANYThe Board of Directors has decided to
start the process of transforming Odfjell
ASA from a Norwegian Joint Stock Public
Company (ASA) to a European Joint Stock
Public Company (Societas Europea,
hereafter called “SE company”). By such
transformation the Board aims for flex-
ibility with regards to future localisation
of the holding company. This flexibility
will contribute to the development of the
company’s international business.
The Board of Directors has based the
proposal on the following facts:
- About 75% of the company’s sharehold-
ers are non-Norwegians
- Odfjell ASA is today a holding company
for the subsidiaries domiciled and operat-
ing in other countries
- Most of the group’s assets are owned
outside Norway.
The Board of Directors will present the
proposal to the Annual General Meeting
where the final decision as to this issue
will be made. The transformation will not
affect the creditors’ or employees’ position
in the company. Neither a transformation
to an SE company, nor a possible subse-
quent relocation of the holding company,
will affect the listing of the company’s
shares on the Oslo Stock Exchange.
LEGALmATTERsWe have previously reported about our
actions related to the antitrust situation
in the parcel tanker industry. At the end of
2006 we have settled antitrust issues with
our major US based customers. We are
continuing the dialog with other custom-
ers. At this point in time it is not possible
to estimate the total financial impact of
future settlements, but we believe that
such settlements will not have a mate-
rial impact upon future net result or
cash flow. These negotiations have not
prevented us from doing business with
our customers on market terms. In 2006
the total effect on the net result from
customer settlements was USD 13 mil-
lion, accounted for as reduced revenue as
compared with USD 37 million in 2005.
Odfjell has continued to cooperate with
the EU Commission with the objective of
resolving any antitrust issues in Europe.
Since the investigations began, Odfjell
ASA has strengthened its internal compe-
tition compliance program and has con-
ducted training of all relevant personnel.
hEALTh,sAFETY,sECuRITYANDENvIRoNmENT(hssE)Odfjell shall conduct its business to
high safety, quality and environmental
standards.
In March a “Corporate Quality Manage-
ment Manual” was introduced, outlining
requirements and guidance for compli-
ance with our policies. The manual forms
part of our continual effort to foster a
common proactive approach to HSSE
throughout the Group.
Stringent environmental and safety
requirements guide all our operations.
In order to ensure that we have the need-
ed competence, training of personnel
working onboard, at terminals and ashore
is an important and continuous activity. In
this context we arranged almost 10 000
training days for our mariners at Odfjell
Academy in Subic Bay, Philippines. These
courses cover Odfjell specific topics and
form part of mandatory training require-
ments.
We have maintained public licences and
approvals to ISM (ship management), ISO
9000 (quality) and ISO14000 (environment)
for all certified units. Odfjell Terminals
(Korea) was certified to ISO 9000 in 2006.
In 2006 Odfjell Terminals (Houston)
received the Benkert Award, a recognition
of environmental excellence in the marine
environment. Elements considered are
environmental policies, pollution preven-
tion, preparedness, emergency response
and safety management, environmental
outreach partnerships, performance
measurement and results.
Research and development are impor-
tant for improvement and for finding
and implementing better environmental
solutions. In 2006 we completed a project
of testing new technologies for Oily Water
Separators. Based on the result of the
study, we are now installing new equip-
ment that will improve protection of the
sea against oil pollution. Another project
for improvement has been the conver-
sion to electronic control of main engine
cylinder lubrication in order to save oil,
improve combustion and thereby reduce
emissions. We develop, based on own
fleet performance, operation modes for
energy conservation. Our research and
continuous monitoring show that our
ships’ propulsion engines are fine-tuned
already, but we can save energy for
auxiliary engines and boilers. To ensure
the successful implementation of change
to alternative operation modes, we are
continuously focusing on motivation and
training onboard.
The Board regrets that, despite our
efforts to achieve zero accident opera-
tions, there have been serious accidents
in 2006. In April there was a fatal accident
onboard “Bow Lancer” outside West
Africa. A steam line ruptured and one
crew member was exposed to hot live
steam under high pressure. Although
he was very quickly rescued by the ships
crew and given first aid, he passed away
in hospital three days later. In Octo-
ber there was fatal accident onboard
“Brage Pacific”, a ship on timecharter to
Odfjell Seachem with external manage-
ment. Furthermore two ships have been
involved in collisions last year, “Bow
Fortune” in Mississippi, in May, and
“NCC Riyad” at Port Said anchorage,
in September. These incidents caused
material damage, but there were no
injuries nor spill.
During the first part of 2006, three ship
detentions in the US gave reason for
concern. Odfjell is determined to have
full compliance at all times and has
already implemented corrective actions.
There have not been serious security
issues in 2006.
We are pleased to note that the Lost
Time Injury Frequency (LTIF) is improving
further. In 2005 it was down to 2.87, and in
2006 it decreased further to 2.53.
WoRkINGENvIRoNmENTANDJoBoPPoRTuNITIEsOdfjell strives to develop an inspiring
and interesting working environment at
sea and onshore. We carry out employee
satisfaction surveys at headquarters in
Bergen and other larger offices and do
ergonomics inquiries. We have recently
started a program for improved health
care for seafarers, with focus on exercise
and healthy diet. The working environ-
ment is considered to be good.
Odfjell wants to be an attractive place to
work for both women and men. Gender-
based discrimination is not permit-
ted in recruitment, promotion or wage
compensation. We maintain our policy
of providing employees with the same
opportunities to develop skills and find
new challenges within our company. Out
of about 250 employees at headquarters
in Bergen 70% are men and 30% women,
while the corresponding figures for about
800 employees in our onshore operations
globally are 78% and 22% respectively.
Recognizing that we employ relatively few
women, we endeavour to recruit women
to ship operations, chartering and ship
management and also to show that life at
sea can be attractive to them.
The recorded absence rate at Headquar-
ters was 3.8%, slightly up from 3.3%
last year. For the Filipino seafarers the
absence rate was 8.8 % and for the Euro-
peans 5.6%.
The Board takes this opportunity to thank
its employees for their contribution to our
progress in 2006; another challenging
year behind us.
WoRLDshIPPINGCoNTEXT2006 turned out to be a reasonably good
year for shipping as a whole, although
average earnings were not quite as high
as during the previous two years. This
was partially due to the record-high
bunker prices, which peaked at US$
18 ODFJELL ANNUAL REPORT 2006 THE dIrEcTOrS´ rEPOrT ODFJELL ANNUAL REPORT 2006 THE dIrEcTOrS´ rEPOrT 19

320-330 per tonne in April and May to drop
again to around US$ 260-270 towards the
end of the year. The spot bunker price on
average was approximately 25% higher
than in 2005 and almost 90% higher than
in 2004.
The dry bulk sector rebounded after last
year’s drop, with earnings almost doubling
during 2006. However, the bulk market
never fully recovered to the top levels of
early 2005. Tanker owners experienced
a rather fluctuating market. Rates and
earnings dropped significantly during the
first four months, but had a healthy revival
throughout the summer months. During
autumn the tanker earnings dropped again
significantly, until December brought
about another boost to the tanker market.
Average earnings in 2006 were down com-
pared to 2004 and 2005.
Prices for second-hand tonnage and new-
buildings remained at the highest levels
since the early 1970s. The cost for black
steel dropped somewhat towards the end
of the year, but this has so far not made
any impact on the prices for new ship or-
ders. Nor does it reflect, in our specialized
end of the market, on the price of stainless
steel, which remains record-high mainly
due to the very high prices for some of its
components, e.g. molybdenum and nickel.
Most competent yards have their order
books filled until mid 2010, and building
slots and ships under construction are still
being resold with considerable profit.
Asia, and particularly China, remained the
world’s main growth engine also in 2006.
China has now overtaken Great Britain as
the world’s fourth largest economy, and
emerging Asia, not including Korea, has
reached the same aggregate GDP as that
of Japan. China’s rapid and massive eco-
nomic development has made it one of the
most important shipping markets, as the
Chinese finance their huge import of raw
materials by providing low-cost manufac-
turing products to the rest of the world.
Today China consumes almost 50% of the
world’s cement output and about a quarter
of crude steel. The container throughput
in ports such as Shanghai has tripled
over the last five years. India, the other
billion-population country, is also rapidly
expanding its economy. Furthermore, GDP
growth continues favourable in Europe, US
and Latin America, and even Japan seems
to have overcome the last decade or so of
zero growth.
World GDP growth is forecasted strong
also the next few years, although probably
not quite at 2006 levels. However, while the
growth in advanced economies such as the
United States and EU seems to slow down
somewhat, the growth in many developing
countries is forecasted to continue steadily.
This is not least the case for Asian coun-
tries such as China, Indonesia, Malaysia
and Philippines, but also Russia and Africa
is expected to maintain and even increase
their growth. Drivers for world demand
continue to be the build-up in Develop-
ing Asia with a massive increase in the
Middle East of chemical production, and
the continued globalisation and advance-
ment of world trade. However, there are
also factors that potentially could curb the
growth. Higher general capacity utilisation
usually implies the risk of more inflation
that may trigger higher interest rates. Any
increased geopolitical instability, not least
through more terrorism and deteriorat-
ing conditions in the Middle East, could
negatively affect world trade and absorb
public and private spending. Further hikes
in oil and energy prices, and added restric-
tions to face the hazards of environmental
damages and global warming, may also
contribute to dampen economic growth.
(2102) SHIP crEW INTErNATIONAL
(386) SHIP crEW NOrWEGIAN
(576) TANK TErMINALS
(229) HEAd OffIcE
(194) BrANcH OffIcES ABrOAd
3487ToTAL
EmPLoYEEsper 31 december 2006
INDusTRIALmETALCommoDITIEsINDEX
EcONOMIST cOMMOdITy INduSTry/METALS
310
260
210
160
110
60 feb 01 feb 02 feb 03 feb 04 feb 05 feb 06 feb 07
Source: Datastream and DnBNOR
20 ODFJELL ANNUAL REPORT 2006 THE dIrEcTOrS´ rEPOrT ODFJELL ANNUAL REPORT 2006 THE dIrEcTOrS´ rEPOrT 21
ThEChEmICALmARkETThe world’s chemical industry continued
to prosper in 2006 despite record-high
prices of raw materials and energy, and
luckily without any of last year’s major
disruptions such as hurricanes Katrina
and Rita. Demand continued to be strong,
and most spot product prices went up
during the year as a whole. However, for
several products the prices weakened
again during autumn. New capacity kept
on being added, mainly in China and
in the Middle East. However, several
scheduled projects have been delayed,
postponed or even cancelled and thus,
the capacity increase was not as steep
as what had generally been predicted.
Throughout the year there was an in-
creased focus on the use of bio fuel and
similar more environment-friendly energy
sources, which boosted the demand for
vegetable oils and their input crops. This
development is likely to continue also the
next few years, in spite of pressures from
lower oil prices and higher raw materials.
The chemical seaborne transportation
market stayed relatively stable through-
out the year with a sharp upturn in
December. Chemical spot freight rates
increased in particular for cargoes from
the US Gulf to the Far East and to Europe,
whilst they dropped somewhat for car-
goes into the US, from Europe, Arabian
Gulf and from Asia, reflecting a rebound
of the US chemical industry. There was
increased demand for longer-period
freight contracts at improving rates,
showing the charterers’ concern for a
tighter market, and such a development
is likely to continue. The time-charter
market got firmer, for standard design
stainless steel 19 000 dwt. being reported
with daily rates exceeding 1 US$ per dwt.
During the year there was certain atten-
tion on the impact of the IMO MARPOL
Annex II revision, which came into effect
on January 1st, 2007. This revision
involves a re-categorisation of large num-
bers of chemicals, mostly requiring strict-
er regulations for safe product handling
and cargo hull protection. Most concern
and controversy was on the requirements
placed on the transportation of vegetable
oils and similar products, which now have
to be transported in IMO 2 type vessels
or in IMO 3 ships with double hull. Some
owners chose to upgrade single-hull
tonnage to meet these new requirements,
as did Odfjell with five ships built in 1986
and 1988. Many product carrier newbuild-
ings on order will also be equipped with
double hull or IMO 2 capacity, to accom-
modate transportation of vegoils.
The deep-sea chemical carrier fleet grew
by 6-7% during 2006. Although a siz-
able increase, this is still well below the
expansion of the two previous years. In
the deep-sea segment above 13 000 dwt,
altogether 58 chemical tankers totalling
approx. 1.4 million dwt. were delivered.
32 of these ships were stainless steel
tankers, of which two thirds were 19 900-
tonners delivered from Japanese yards.
Odfjell was the single largest receiver of
new tonnage, with seven units totalling
close to 190 000 dwt. Only seven deep-sea
chemical tankers were scrapped during
2006, of which five were stainless steel
type ships. Four of these left the Odfjell
fleet during the year.
At the turn of the year the chemical
tanker orderbook counts some 270-280
units of 13 000 dwt. or above, totalling
approximately 7.3 million dwt. This corre-
sponds to 36% of the current fleet. In the
short-sea segment below 13 000 dwt. the
orderbook is not as large, but neverthe-
less 26% of the current fleet. Such an
influx of new tonnage is likely to have an
impact on the supply/demand balance.
The market has so far shown a remark-
able ability to absorb new tonnage, and
the inflow of new tonnage will meet the
demand for more double-hull tonnage
following on the new IMO regulations.
It will also result in a considerable overall
fleet renewal, and thus, potentially lead
to even more safe and efficient sea-
borne transportation of chemicals and
similar bulk liquids. Although scrapping
remained low during 2006, it picked up
somewhat towards the end of the year,
as many owners had chosen to trade
their vessels in the relatively strong
market prior to the revised MARPOL
Annex II taking effect at the beginning
of 2007. Given the very high prices for
demolition tonnage, in particular for ships
with stainless steel tanks and piping, and
the increasing commercial and regulatory
market limitations for old tonnage, the
demolition rate will likely be fairly high.
There were no drastic changes to the
competitive balance in the chemical tank-
er market in 2006, although a few new
market constellations have appeared.
The ten largest operators control close
to 50% of the fleet. Considering only the
core deep-sea fleet, i.e. the vessels main-
ly involved in the parcel tanker industry,
the ten largest operators control 85%
of the tonnage. These same operators
also maintain a dominant position when
it comes to newbuildings, controlling
43% of the chemical tankers and 80% of
the core fleet on order. Odfjell is a major
player, both in terms of vessels currently
trading as well as ships on order.
We strive for operational excellence as
this is increasingly important in order to
maintain a competitive position. Not the
least is this the case with mariners’

Peter G. Livanos
Marianna Moschou
Terje Storeng
President/CEO
Laurence W. Odfjell
Reidar Lien
Stein Pettersen
Bergen, 6 March 2007
ThEBoARDoFDIRECToRsoFoDFJELLAsA
B.D. Odfjell
CHAIRMAN
competence, to further enhance the
safety and efficiency of seaborne opera-
tions. Odfjell is investing in this respect,
both through onboard traineeships and
our commitment at the Odfjell Academy
in the Philippines.
ComPANYsTRATEGYANDPRosPECTsWe shall, as a leading niche player, strive
to provide safe, efficient, and cost effec-
tive parcel tanker and tank terminalling
services to our customers worldwide.
We shall continue to expand tank ter-
minal operations along Odfjell’s major
shipping lanes and at important petro-
chemical logistics junctions around the
world. Besides clear operational and
commercial benefits from close coopera-
tion with our larger shipping business,
we consider terminals to be a stabilizing
factor in the overall financial performance
of the company, as their earnings are less
volatile than our larger shipping activi-
ties. Odfjell strives to stay competitive and
flexible through a modern, versatile and
safe fleet. We shall adjust to changing
trade patterns through organisational
competence.
The world economy continued strong
throughout 2006. The tanker market
firmed considerably towards the end of
the fourth quarter, after a somewhat slow
autumn. Forecasts for economic growth
continue to indicate favourable world
trade the next few years, in particular in
Asia, but also in most other parts of the
world. Demand for tanker transporta-
tion services as well as tank storage
is believed to remain firm in the short
and medium term. However, the world
order book for tanker tonnage is rapidly
growing. Despite new legislation and
increasingly strict customer require-
ments making older tonnage technically
and/or commercially obsolete, the net
tanker supply will be increasing also the
next years.
Contracts are being renewed at improv-
ing freight rates, reflecting the custom-
ers’ expectations for increased activity
and a tighter chemical tanker market,
not least following the implementation
of new MARPOL regulations, including
double-hull requirements for carriage
of vegetable oils and other products as
from January 1st, 2007. We believe this,
combined with lower bunker prices, will
contribute to improve our net chemical
tanker earnings. We also expect the tank
terminal business to remain strong. All
in all, we anticipate our 2007 operating
results to improve compared to 2006.
22 ODFJELL ANNUAL REPORT 2006 THE dIrEcTOrS´ rEPOrT ODFJELL ANNUAL REPORT 2006 THE dIrEcTOrS´ rEPOrT 23

ODFJELL GROUP
ODFJELL ANNUAL REPORT 2006 GrOuP AccOuNTS 25
PRoFITANDLosssTATEmENT
(uSd 1 000) Note 2006 2005 2004Gross revenue 1 088 478 1 044 847 943 481 Net income from associates 4 60 101 86 voyage expenses (360 890) (340 905) (296 595)Timecharter expenses 5 (144 782) (156 354) (158 105)Operating expenses 6,8 (238 061) (219 577) (190 273)Gross result 344 805 328 112 298 593 General and administrative expenses 7,8 (84 600) (64 449) (91 244) Operating result before depreciation and capital gain (loss)on non-current assets (EBITDA) 260 204 263 663 207 350 depreciation 9 (118 681) (107 449) ( 99 959)capital gain (loss) on noncurrent assets 9 14 644 14 210 6 645 Operating result (EBIT) 156 167 170 424 114 036 Interest income 10 568 7 892 4 056 Interest expenses (53 333) (36 206) (28 931)Other financial items 10 (631) (1 372) (888)currency gains (losses) 11 2 114 1 783 16 887 Net financial items (41 281) (27 903) (8 876) Result before taxes 114 885 142 521 105 160 Taxes 12 1 056 (18 628) (11 278)Net result from continuing operations 115 941 123 893 93 882 Net result discontinued operations 13 4 376 695 Net result 115 941 128 269 94 577 Allocated to: Minority interests 777 157 Shareholders 115 941 127 492 94 420 Earnings per share (uSd) basic/diluted continuing operations 14 1.38 1.42 1.09Earnings per share (uSd) basic/diluted discontinued operations 14 0.05 0.01
24 ODFJELL ANNUAL REPORT 2006 GrOuP AccOuNTS
BALANCEshEET
(uSd 1 000)
AssETsAsPER31.12. Note 2006 2005 2004NoN-CuRRENTAssETsGoodwill 15 10 327 9 470 10 251 real estate 9 27 856 27 368 21 509 Ships 9 1 362 028 1 218 923 1 110 295 Newbuilding contracts 9 61 792 102 329 36 024 Tank terminals 9 340 188 286 292 311 838 Office equipment and cars 9 9 392 8 642 9 756 Investments in associates 4 1 299 1 241 1 140 Availableforsaleinvestments 16 63 590 Noncurrent receivables 17 2 078 1 746 3 845
Total non-current assets 1 814 959 1 656 012 1 568 248
CuRRENTAssETscurrent receivables 18 113 670 94 019 79 171 Bunkers and other inventories 19 16 496 16 083 11 414 derivative financial instruments 25 1 675 Availableforsale investments 16 77 137 81 013 40 885 cash and cash equivalents 20 165 287 108 840 128 862
Total current assets 374 264 299 954 260 333 Assets of discontinued operations 13 43 145
Total assets 2 189 223 1 955 966 1 871 725
EQuITYANDLIABILITIEsAsPER31.12 Note 2006 2005 2004EQuITYShare capital 21 29 425 29 425 29 425 Own shares 21 (1 123) Share premium 21 53 504 109 955 109 955 Other equity 620 379 552 862 499 311 Minority interests 5 517 4 107
Total equity 707 702 692 241 642 798
NoN-CuRRENTLIABILITIEsdeferred tax liabilities 12 23 227 34 397 25 262 Pension liabilities 22 17 363 14 172 15 777 Noncurrent interest bearing debt 23 1 181 804 941 740 880 922 Other noncurrent liabilities 24 2 656 18 029 28 612
Total non-current liabilities 1 225 050 1 008 338 950 574
CuRRENTLIABILITIEscurrent portion of interest bearing debt 23 111 582 95 558 119 111 Taxes payable 12 3 158 5 468 3 202 Employee taxes payable 5 503 6 238 6 351 derivative financial instruments 25 1 696 1 311 Other current liabilities 26 134 533 146 811 114 969
Total current liabilities 256 472 255 387 243 633 Liabilities of discontinued operations 13 34 720
Total equity and liabilities 2 189 223 1 955 966 1 871 725
Bergen, 6 March 2007
ThEBoARDoFDIRECToRs
oFoDFJELLAsA
B.D. Odfjell
CHAIRMAN
Peter G. Livanos
Reidar Lien
Marianna Moschou
Stein Pettersen
Laurence W.Odfjell
Terje Storeng
President/CEO

ODFJELL GROUP
CAshFLoWsTATEmENT
(uSd 1 000) Note 2006 2005 2004CAshFLoWFRomoPERATINGACTIvITIEs Operating result 156 167 170 424 114 036 Net result discontinued operations 695 depreciation 118 682 107 449 99 959 capital (gain) loss on noncurrent assets (14 644) (14 210) (6 645)Inventory (increase) decrease (413) (4 669) (503)Trade debtors (increase) decrease (4 783) (6 353) (6 817)Trade creditors increase (decrease) (980) 9 204 2 989 difference in pension cost and pension premium paid 1 859 (242) (125)Other current accruals (38 241) (15 332) 34 959 Taxes paid (9 197) (5 999) (3 928)Net cash flow from operating activities 208 450 240 271 234 619 CAshFLoWFRomINvEsTINGACTIvITIEs Sale of noncurrent assets 22 224 34 724 26 935 Sale of discontinued operation 13 13 176 Investment in noncurrent assets 9 (271 123) (315 628) (228 204)Availableforsale investments 3 818 23 998 (19 485)changes in noncurrent receivables (332) 2 100 1 863 Interest received 10 568 7 890 4 056Net cash flow from investing activities (234 845) (233 739) (214 835)
CAshFLoWFRomFINANCINGACTIvITIEs New interest bearing debt 533 941 313 320 419 775 Payment of interest bearing debt (281 511) (240 350) (350 089)Purchase own shares (51 333) Minority interest 5 517 Other financial expenses (631) (1 372) 895 Interest paid (53 333) (36 028) (28 931)dividend (72 467) (59 896) (52 956)Net cash flow from financing activities 80 183 (24 325) (11 306)
Effect on cash balances from currency exchange rate fluctuations 2 659 (2 229) 2 184
Net change in cash balances 56 447 (20 022) 10 662 cash and cash equivalents as per 1.1 108 840 128 862 118 200 Cash and cash equivalents as per 31.12 165 287 108 840 128 862
Available credit facilities 15 000
sTATEmENToFChANGEsINEQuITY
(uSd 1 000)
equity interests equity Equity as at 1.1.2004 29 425 109 955 1 426 437 047 438 473 577 853 3 951 581 804 Net result 2004 94 420 94 420 94 420 157 94 576Comprehensive income for the year 2004 - - - - - 94 420 94 420 94 420 157 94 576 dividend (40 710) (40 710) (40 710) (40 710)Exchange rate differences on translating foreign operations 7 127 7 127 7 127 7 127 Equity as at 31.12.2004 29 425 - 109 955 8 553 - 490 757 499 311 638 691 4 107 642 798 Effect of implementing IAS 39 28 406 28 406 28 406 28 406Equity as at 1.1.2005 29 425 - 109 955 8 553 28 406 490 757 527 717 667 097 4 107 671 204
cash flow hedges changes in fair value 478 478 478 478 cash flow hedges transferred to profit and loss statement (27 975) (27 975) (27 975) (27 975)Net gain/(loss) on availableforsale investments (536) (536) (536) (536)Net result 2005 127 492 127 492 127 492 777 128 268 Comprehensive income for the year 2005 - - - - (28 033) 127 492 99 459 99 459 777 100 236 dividend (61 016) (61 016) (61 016) (61 016)deconsolidating minority interests¹ - - (4 884) (4 884)Exchange rate differences on translating foreign operations (13 298) (13 298) (13 298) (13 298) Equity as at 31.12.2005 29 425 - 109 955 (4 745) 373 557 233 552 862 692 241 - 692 241 cash flow hedges changes in fair value 3 843 3 843 3 843 3 843 cash flow hedges transferred to profit and loss statement (115) (115) (115) (115)Net gain/(loss) on availableforsale investments 162 162 162 162 Net result 2006 115 941 115 941 115 941 115 941 Comprehensive income for the year 2006 - - - - 3 890 115 941 119 831 119 831 - 119 831 Share repurchases (1 123) (50 210) (50 210) (51 333) (51 333)Transfer of share premium (56 451) 56 451 56 451 - - consolidating minority interests2 - - 5 517 5 517 dividend (72 467) (72 467) (72 467) (72 467)Exchange rate differences on translating foreign operations 14 007 (94) 13 913 13 913 13 913 Equity as at 31.12.2006 29 425 (1 123) 53 504 9 262 60 620 550 497 620 379 702 185 5 517 707 702
ODFJELL ANNUAL REPORT 2006 GrOuP AccOuNTS 2726 ODFJELL ANNUAL REPORT 2006 GrOuP AccOuNTS
Attributable to shareholders’ equity
Total Exchange Fair value Total share- Share Own Share rate and other Retained other holders’ Minority Total capital shares premium differences reserves earnings equity
¹Minority interests in the tankterminal in Dalian was deconsolidated as per 31.12.2005 as the ownership was reduced from 64% to 50% by the sale of 14% of the company’s share to our partner. 2Minority interests in the tankterminal in Jiangyin was consolidated as per 31.12.2006.
ODFJELL GROUP
Notes to the Group Financial Statement
1CoRPoRATEINFoRmATIoN
Odfjell ASA, Conrad Mohrsv. 29, 5072 Bergen, Norway, is the ultimate parent company of the Odfjell Group. Odfjell ASA is a public limited company incorporated in Norway and traded on the Oslo Stock Exchange. The consolidated financial statements of Odfjell for the year ended 31 December 2006 were authorised for issue in accordance with a resolution of the Board of Directors on 6 March 2007. The Odfjell Group includes Odfjell ASA, wholly owned or controlled subsidiaries incorporated in several countries (see note 30 for an overview of consolidated companies) and our share of investments in joint ventures (see note 31).
Odfjell is a leading company in the global market of transportation and storage of chemicals and other speciality bulk liquids as well as providing related logistical services. Through its various subsidiaries and joint ventures Odfjell owns and operates parcel tankers and tank terminals. The principal activities of the Group are described in note 3.
Unless otherwise specified the “Company”, “Group”, “Odfjell” and “we” refer to Odfjell ASA and its consolidated companies.
2summARYoFsIGNIFICANTACCouNTINGPRINCIPLEs2.1BasisforpreparationThe Odfjell Group prepared its accounts accord-ing to International Financial Reporting Stand-ards (IFRS) for the first time for the year-ended 31.12.2005 with comparable figures for 2004. All items in the financial statements have been reported, valued and accounted for in accord-ance with IFRS, which comprise of standards and interpretations adopted by the International Ac-counting Standards Board (IASB). These include International Financial Reporting Standards (IFRS), International Accounting Standards (IAS) and interpretations originated by the Internation-al Financial Reporting Interpretations Committee (IFRIC) formerly the Standing Interpretations Committee (SIC).
The consolidated statements have been pre-pared on a historical cost basis, except for the measurement at fair value of derivative financial instruments (see note 2.15) and financial invest-ments (see note 2.16).
2.2BasisofconsolidationThe same accounting principles are applied to all
companies in the Odfjell Group. All intra-group balances, transactions, income and expenses and profits and losses resulting from intra-group transactions are eliminated. InvestmentinsubsidiariesThe consolidated statements consist of Odfjell ASA and its subsidiaries as at 31 December each year (see note 30). Minority interests are included as a separate item in the equity, and are recorded as a separate allocation of the net result. The minority interests include the minority’s share of the equity of the subsidiary, including any share of identified excess value on the date when a subsidiary is acquired.
Subsidiaries are fully consolidated from the date of acquisition, being the date on which the Group obtains control and continue to be consolidated until the date that such control ceases. Identi-fied excess values have been allocated to those assets and liabilities to which the value relates. Any excess values arising on the acquisition of a foreign operation and any fair value adjust-ments to the carrying amounts of assets and liabilities arising on the acquisition are treated as assets and liabilities of the foreign operation and translated at the exchange rate at the balance sheet date. Excess values are depreciated over the estimated economic lives, except for goodwill that is tested for impairment annually or more frequently if events or changes in circumstances indicate that there may be impairment (see note 2.14).
2.3ApplicationofjudgmentandestimatesCertain of our accounting principles require the application of significant judgment by manage-ment in selecting the appropriate assumptions for calculating financial estimates that affect the reported amounts of assets, liabilities, revenues, expenses and information on potential liabilities. By their very nature, these judgments are subject to an inherent degree of uncertainty. These judg-ments and estimates are based on historical ex-perience, terms of existing contracts, observance of trends in the industry, information provided by customers and where appropriate, information available from other outside sources. Although these estimates are based on management’s interpretations of current events and actions, future events may lead to these estimates being changed and actual results may ultimately differ from those estimates. Such changes will be recognised when new estimates can be determined. Our significant judgment and estimates include:
RevenuerecognitionTotal revenues and voyage related expenses in a period are accounted for as the percentage of completed voyages. Voyage accounting consists of actual figures for completed voyages and estimates for voyages in progress. Historically the estimated revenues and voyage expenses have not been significantly different from actual voyage related revenues and expenses. Further details are given in note 2.6.
valuationofnon-currentassetsNon-current assets are depreciated over the ex-pected useful lives to an estimated residual value at the time of disposal. Expected useful lives are reviewed at each balance sheet date and where they differ significantly from previous estimates, depreciations are adjusted accordingly. We estimate residual value at the estimated time of disposal for assets, which is generally at the end of their useful life. To assess the residual value of ships we use the estimated demolition value. For terminals we use a best estimate for the value of the tank asset less dismantling expenses. The residual values are evaluated on a regular basis and any changes have an effect on future depre-ciations. Further details are given in note 2.11.
When impairment test is required and we esti-mate value in use the estimates are based upon our projections of anticipated future cash flows and a suitable discount rate in order to calculate the present value of those cash flows. While we believe that our estimates of future cash flows are reasonable, different assumptions regarding such cash flows could materially affect our eval-uations. The Company believes that there would have to be a sustained and material downturn in the markets before a material impairment of non-current assets occurs. Further details are given in note 2.14.
TaxesThe Group is subject to income tax in many jurisdictions. Considerable judgment must be exercised to determine income tax for all coun-tries taken together in the consolidated accounts. The final tax liability for many transactions and calculations will be uncertain. Deferred tax as-sets are recognised for all unused tax losses to the extent that it is probable that taxable profits will be available against which the losses can be utilised. Significant management judgment is required to determine the amount of deferred tax assets that can be recognised, based upon the likely timing and level of future taxable profits together with future tax planning strategies. Further details are given in note 2.7.
PensionThe cost of defined benefit pension plans is determined using actuarial valuations. The actuarial valuation involves making assumptions about discount rates, expected rates of return on assets, future salary increases, mortality rates and future pension increases. Due to the long term nature of these plans, such estimates are subject to significant uncertainty. Further details are given in note 2.25.
ProvisionsProvisions are based on best estimates. Provi-sions are reviewed each balance sheet date and the level shall reflect the best estimate of the liability. Further details are given in note 2.24.
2.4ChangesinaccountingprinciplesThe following changes in accounting principles have been implemented in 2006 as a result of requirements stipulated in the accounting standards:• IAS 19 (Amendment), Employee Benefits. This amendment introduced the option of an alternative recognition approach for actuarial gains and losses. It also added new disclo-sure requirements. The Group applied this amendment from 1 January 2006, which had an impact on the format and extent of disclosures presented in the accounts.• IFRIC 4, Determining whether an Arrange-ment contains a Lease. IFRIC 4 requires the determination of whether an arrangement is or contains a lease to be based on the substance of the arrangement. The Group applied IFRIC 4 from 1 January 2006.
2.5CurrencyFunctionalandpresentationcurrencyThe consolidated financial statements are presented in USD as the Group operates in an in-ternational market where the functional currency is mainly USD. Foreign subsidiaries’ functional currencies are normally the local currency, except for our major shipping companies.
TransactionsandbalancesTransactions in non-USD currency are recorded at the exchange rate on the date of the transac-tion. Receivables and liabilities in non-USD currencies are translated at the exchange rate on the balance sheet date. All exchange rate differ-ences are taken to the profit and loss statement. Non-monetary items that are measured in terms of historical cost in a non-USD currency are translated using the exchange rates at the dates of the initial transactions.
ForeignsubsidiariesThe balance sheet of foreign subsidiaries with functional currency other than USD is translated at the rate applicable on the balance sheet date, while the profit and loss statement is translated using the monthly average exchange rate for the accounting period. Exchange rate differ-ences that arise as a result of this are included as exchange rate differences in the equity. When a foreign subsidiary is sold, the accumulated translation adjustment related to that subsidiary is taken to the profit and loss statement.
2.6RevenuerecognitionRevenue is recognised when it is probable that a transaction will generate a future economic benefit that will accrue to the Company and the size of the amount can be reliably estimated. Sales revenues are presented net of value added tax and discounts. Total revenues and voyage related expenses in a period are accounted for as the percentage of completed voyages. Voyage accounting consists of actual figures for completed voyages and estimates for voyages in progress. Voyages are normally discharge-to-discharge. Except for any period a ship is declared off-hire due to technical or other owner’s matters, a ship is always allocated to a voyage. Revenues from the storage of products in tank terminals are recognised in the profit and loss statement when the products are in the tank, by reference to the stage of completion of the storage at the balance sheet date, the risk has been transferred and the Company has estab-lished a receivable.
2.7TaxesThe Group’s taxes include taxes of Group com-panies based on taxable profit for the financial period, together with tax adjustments for previ-ous periods and the change in deferred taxes. Tax credits arising from subsidiaries’ distribution of dividends are deducted from tax expenses. Deferred tax liabilities are provided in full, using the liability method, on temporary differences arising between the tax bases of assets and liabilities and their carrying amounts in the financial statements. Deferred tax assets are recognised to the extent that it is probable that future taxable profit will be available to offset the temporary differences. We recognise formerly unrecognised deferred tax assets to the extent that it has become
probable that we can utilise the deferred tax asset. Similarly, the Company will reduce its deferred tax assets to the extent that it can no longer utilise these. Deferred tax and deferred tax assets for the current and prior periods are measured at the amount expected to be paid to or recovered from the taxation authorities, using the tax rates and tax laws that have been enacted or substantively enacted at the balance sheet date. Deferred tax and deferred tax assets are recognised irrespec-tive of when the differences will be reversed. Deferred tax and deferred tax assets are recog-nised at their nominal value and are classified as non-current liabilities (non-current assets) in the balance sheet. Companies taxed under the Norwegian shipping tax regime will not be taxed on their net operat-ing profit prior to distribution of profits to their shareholders. A portion of net financial income is taxed at the ordinary applicable tax rate. Income tax rate for undistributed profits is, under cur-rent conditions, zero and hence deferred taxes are to be calculated based on this zero tax rate. The income tax consequences of dividends are recognised when a liability to pay the dividend is recognised. Taxation under the shipping tax regime requires compliance to certain require-ments, and voluntary or forced exit of the regime will result in taxation of undistributed profits. Tax payable and deferred taxes are recognised directly in equity to the extent that they relate to factors that are recognised directly in equity. 2.8GovernmentgrantsGovernment grants are recognised where there is reasonable assurance that the grant will be received and all attaching conditions will be complied with. When the grant relates to an expense (income) item, it is recognised as reduc-tion (increase) of the expense (income) over the period necessary to match the grant on a sys-tematic basis to the expense (income) that it is intended to compensate. When the grant relates to an asset, the fair value is reduced and the grant is released to the profit and loss statement over the expected useful life of the relevant asset on a straight-line basis.
2.9InvestmentinjointventuresJoint ventures are entities over which the Group has contractually agreed to share the power to govern the financial and operating policies of the entity with another venturer(s). Our share of activities under joint control (see note 31)
28 ODFJELL ANNUAL REPORT 2006 GrOuP AccOuNTS ODFJELL ANNUAL REPORT 2006 GrOuP AccOuNTS 29

ODFJELL GROUP
is included according to the gross method. Under this method the Group’s proportionate share of revenues, costs, assets and liabilities are recognised with similar items in the financial statements on a line-by-line basis. The financial statements of the joint venture are prepared for the same reporting year as Odfjell. Adjustments are made to bring into line any dissimilar accounting policies that may exist. A review of the carrying values in joint ventures is carried out when there are indications that there is a need to recognise impairment losses or when the need for previously recognised impairment losses is no longer present.
2.10InvestmentinassociatesAssociated companies are entities in which the Group has significant influence and which is nei-ther a subsidiary nor a joint venture. Associated companies (see note 4) are included according to the net method. Under this method the Group’s share of the associated company’s net result for the year is recognised in the profit and loss statement. The Group’s interest in an associated company is carried on the balance sheet at an amount that reflects its share of the net assets of the associated company. The carrying value of investment in an associate will never be negative, unless the Group has incurred or guaranteed obligations in respect of the associated company. Goodwill relating to an associate is included in the carrying amount of the investment and is not amortised. The reporting dates of the associate and the Group are identical. Adjustments are made to bring into line any dissimilar accounting policies that may exist.
2.11Non-currentassetsNon-current assets are stated at historical cost, which includes purchase price, capitalised inter-est and other expenses directly related to the in-vestment. The carrying value of the non-current assets on the balance sheet represents the cost less accumulated depreciation and any impair-ment charges. Newbuilding contracts include payments made under the contracts, capitalised interest and other costs directly associated with the newbuilding program and are not depreci-ated until the asset is available for use. We estimate residual value at the estimated time of disposal for assets, which is generally at the end of their useful life. To assess the residual value of ships we use the current estimated demolition value. For terminals we use a best estimate for the value of the tank asset less dismantling expenses. The residual values are evaluated at least on a yearly basis and any
changes have an effect on future depreciations. Each component of a non-current asset that is significant to the total cost of the item shall be depreciated separately. The Company allocates the amount initially recognised in respect of an item of non-current asset to its significant components and depreciates separately each such component over their useful lives. The book value of ships is split into two components, ships and periodic maintenance. Day-to-day repairs and maintenance costs are charged to the profit and loss statement during the financial period in which they are incurred. The cost of major renovations and periodic maintenance is included in the asset’s carrying amount when it is probable that the Group will derive future economic benefits in excess of the originally assessed standard of performance of the asset. At the time of investing in a ship a por-tion of the purchase price is defined as periodic maintenance. The investment is depreciated over the remaining useful life of the asset and for the periodic maintenance part over the period until the next periodic maintenance. Expected useful lives of non-current assets are reviewed at each balance sheet date and where they differ significantly from previous estimates, depreciations are adjusted accordingly. Depreciation of the above mentioned assets appear as depreciation in the profit and loss statement. Capital gains and losses on disposals are determined by comparing the disposal proceeds with the carrying amount and are included in operating result. When the carrying amount of a non-current asset will be recovered principally through a sale transaction rather than through continued use they are reported at the lower of the carrying amount and the fair value less selling costs.
2.12LeasesThe determination of whether an arrangement is, or contains a lease is based on the substance of the arrangement at inception date. An arrange-ment is a lease if the fulfilment of the arrange-ment is dependent on the use of a specific asset or assets or the arrangement conveys a right to use the asset. A reassessment is made after inception of the lease only if one of the following applies: 1. there is a change in contractual terms, other than a renewal or extension of the arrangement
2. a renewal option is exercised or extension granted, unless the term of the renewal or extension was initially included in the lease term 3. there is a change in the determination of whether fulfilment is dependent on a specified asset 4. there is a substantial change to the asset.Where a reassessment is made, lease account-ing shall commence or cease from the date when the change in circum stances gave rise to the reassessment for scenarios 1, 3 or 4 and at the date of renewal or extension period for scenario 2. Assets financed under finance leases are capitalised at the inception of the lease at the fair value of the leased asset, or if lower, at the net present value of the minimum lease payments. Lease payments consist of a capital element and finance cost, the capital element reduces the obligation to the lessor and the finance cost is expensed. Capitalised leased assets are depreci-ated over the estimated useful life in accordance with note 9. Leases where a significant portion of the risks and rewards of ownership are retained by the lessor are classified as operating leases. Pay-ments made under operating leases are charged to the profit and loss statement on a straight-line basis over the lease term, see note 5 and note 29.
2.13GoodwillExcess value on the purchase of an operation that cannot be allocated to fair value of assets or liabilities on the acquisition date is shown in the balance sheet as goodwill. In the case of invest-ments in associates, goodwill is included in the carrying amount of the investment. Goodwill is not amortised, but goodwill is allo-cated to the relevant cash generating unit and an assessment is made each year as to whether the carrying amount can be justified by future earn-ings, see note 2.14 impairment of assets.
2.14ImpairmentofassetsAt each reporting date the Group assesses whether there is an indication that an asset may be impaired. If any such indication exists, or when annual impairment testing for an asset is required, the Group makes an estimate of the asset’s recoverable amount. The recover-able amount is the highest of the fair market value of the asset, less cost to sell, and the net present value (NPV) of future estimated cash flow from the employment of the asset (“value in use”). The NPV is based on an interest rate
according to a weighted average cost of capital (“WACC”) reflecting the Company’s required rate of return. The WACC is calculated based on the Company’s long term borrowing rate and a risk free rate plus a risk premium for the equity. If the recoverable amount is lower than the book value, impairment has occurred and the asset shall be revalued. Impairment losses are recognised in the profit and loss statement. Assets are grouped at the lowest level where there are separately identifiable independent cash flows. We have made the following assumptions when calculat-ing the “value in use” for material tangible and intangible assets:
shipsFuture cash flow is based on an assessment of what is a normal timecharter earning and a normal level of operating expenses for each type of ship over the remaining useful life of the ship. All parcel tankers are interchangeable and are therefore seen together as a portfolio of ships.
TankterminalsFuture cash flow is based on a normalised result for each terminal. We have calculated the “value in use” based on five years’ EBITDA and a residual value after five years.
GoodwillGoodwill acquired through business combina-tions has been allocated to the relevant cash generating unit (CGU). An assessment is made as to whether the carrying amount of the goodwill can be justified by future earnings from the CGU to which the goodwill relates. Future earnings are based on next year’s expectations with a zero growth rate. If the ”value in use” of the CGU is less than the carrying amount of the CGU, including goodwill, goodwill will be written down first. Thereafter the carrying amount of the CGU will be written down. With the exception of goodwill, impairment losses recognised in the profit and loss state-ments for previous periods are reversed when there is information that the basis for the impair-ment loss no longer exists or is not as great as it was. This reversal is classified in revenue as an impairment reversal. The increased carrying amount of an asset attributable to a reversal of an impairment loss shall not exceed the carrying amount that would have been determined (net of depreciation) had no impairment loss been recognised for the asset in prior years.
2.15DerivativefinancialinstrumentsDerivative financial instruments are recognised
on the balance sheet at fair value. The method of recognising the gain or loss is dependent on the nature of the item being hedged. On the date a derivative contract is entered into, we designate certain derivatives as either a hedge of the fair value of a recognised asset or liability (fair value hedge), or a hedge of a forecasted transaction (cash flow hedge) or of a firm commitment (fair value hedge). Changes in the fair value of derivatives that qualify as fair value hedges and that are highly effective both prospectively and retrospectively are recorded in the profit and loss statement together with any changes in the fair value of the hedged asset, liability or firm commitment that is attributable to the hedged risk. Changes in the fair value of derivatives that qualify as cash flow hedges and that are highly effective both prospectively and retrospectively are recognised in equity. Amounts deferred in equity are transferred and classified in the profit and loss statement when the underlying hedged items impact net result in a manner consist-ent with the underlying nature of the hedged transaction. If a hedging instrument expires or is sold, or when a hedge no longer meets the criteria for hedge accounting under IAS 39, any cumula-tive gain or loss existing in equity at that time remains in equity and is recognised when the committed or forecasted transaction is ultimately recognised in the profit and loss statement. How-ever, if a committed or forecasted transaction is no longer expected to occur, the cumulative gain or loss that was reported in equity is immediately transferred to the profit and loss statement. Certain derivative transactions, while providing effective economic hedges under the Group risk management policy, do not qualify for hedge accounting under the specific rules in IAS 39. Changes in the fair value of derivative instru-ments that do not qualify for hedge accounting under IAS 39 are shown immediately in the profit and loss statement. This also applies to any inef-fective parts of a derivative financial instrument that qualifies as a hedge. At the inception of the transaction the relation-ship between the hedging instruments and the hedged items, as well as its risk management objective and strategy for undertaking the hedge transactions is documented. This process includes linking all derivatives designated as hedges to specific assets and liabilities or to
specific firm commitments or forecasted transactions. The Group also documents its assessment, both at the hedge inception and on an ongoing basis, as to whether the derivatives that are used in hedging transactions, are highly effective in offsetting changes in fair values or cash flows of the hedged items. The derivative instruments used by the Group are not lever-aged, and are not held for speculative arbitrage or investment purposes. The fair value of derivatives that are actively trad-ed in organised financial markets is determined by reference to quoted market bid prices at the close of business on the balance sheet date. For derivatives where there is no active market, fair value is determined using valuation tech-niques. Such techniques include using recent arm’s length market transactions, reference to the current market value of another substantially same instrument, discounted cash flow analysis or other valuation models.
2.16FinancialinvestmentsFinancial investments have been classified into investments at fair value through profit and loss and available-for-sale categories. The classifica-tion is dependent on the purpose for which the investments were acquired. Financial invest-ments with less than 12 months to maturity or if they are being regularly traded are classified as current assets, otherwise as non-current. The Group determines the classification of its financial investments after initial recognition and where allowed and appropriate this designation is re-evaluated at each financial year end. Purchases and sales of financial investments are recognised on the settlement date, which is the date that the asset is delivered to or by the Group. When financial investments are recognised initially, they are measured at fair value, plus, in the case of investments not at fair value through profit and loss, directly attributable transaction cost.
Fair value of investments that are actively traded in organised financial markets is determined by reference to quoted market bid prices at the close of business on the balance sheet date. For investments where there is no active market, fair value is determined using valuation techniques. Such techniques include using recent arm’s length market transactions, reference to the current market value of another substantially same instrument, discounted cash flow analysis or other valuation models.
30 ODFJELL ANNUAL REPORT 2006 GrOuP AccOuNTS ODFJELL ANNUAL REPORT 2006 GrOuP AccOuNTS 31

ODFJELL GROUP
FinancialinvestmentsatfairvaluethroughprofitandlossThis category includes financial assets held for trading. A financial investment is classified in this category if acquired principally for the purpose of regular trading or if so designated by the management. Derivatives are in this category unless they are designated as hedges. Assets in this category are classified as current assets if they are expected to be realised within 12 months of the balance sheet date.
Available-for-saleinvestmentsAvailable-for-sale investments are non-deriva-tives that are either designated in this category or not classified in any other category. They are included in non-current assets unless manage-ment intends to dispose of the investment within 12 months of the balance sheet date. After initial recognition, available-for-sale investments are measured at fair value with gains and losses being recognised as a separate component of equity until the investment is derecognised or until the investment is determined to be impaired at which time the cumulative loss previously reported in equity is included in the income statement.
2.17TradereceivablesTrade receivables are recognised at the original invoiced amount less provision for bad debts if there is any objective evidence of a fall in value.
2.18InventoriesBunkers and other inventories are accounted for at the lower of purchase price and net realisable value on a first-in, first-out basis.
2.19CashandcashequivalentsThe cash flow statement is prepared using the indirect method. Cash and cash equivalents include cash in hand and in bank, deposits held at call with banks and other short-term highly liquid investments with maturities of three months or less from the date of acquisition. The amount of cash and cash equivalent in the cash flow statement does not include available credit facilities.
2.20DiscontinuedoperationsA discontinued operation is a component of an entity that either has been disposed of, or is classified as held for sale, and represents a separate major line of business or geograp-hical area of operations or is a subsidiary ac-quired exclusively with a view to resale. Assets and liabilities of discontinued operations are
specified on the balance sheet from the period in which the decision is taken and the sale is highly probable until the divestment takes place. Net result from discontinued operations in the profit and loss statement is restated for previous periods. The post-tax gain or loss on disposal of discontinued operation is shown as a separate item on the consolidated profit and loss statement.
2.21EquityPaidinequity(i)sharecapitalThe portion of the paid-in-capital equalling number of shares at their nominal value.
(ii)ownsharesThe value of own shares’ portion of share capital.
(iii)sharepremiumThe excess value of the total paid-in-capital not reflected in the nominal value of the shares. Transaction costs of an equity transaction are accounted for as a deduction in share premium, net of any related income tax benefit.
otherequity(i)ExchangeratedifferencesExchange rate differences arise in connection with currency differences when foreign entities are consolidated. When a foreign operation is sold, the accumulated exchange differences linked to the entity are reversed and appear in the profit and loss statement in the same period as the gain or loss on the sale is recognised. (ii)FairvalueandotherreservesThe fair value and other reserves include the total net change in the fair value of the cash flow hedge and financial investment. When the hedged cash flow matures or is no longer expected to occur the net change in fair value is transferred to the profit and loss statement. When financial investments are sold or impaired, the accumulated fair value adjustments in equity are included in the profit and loss statement as gains and losses from financial investment. (iii)DividendsDividends are recorded as a deduction to other equity in the period in which they are approved by the shareholders.
(iv)RetainedearningsThe net result attributable and available for distribution to the shareholders.
2.22DismantlingliabilitiesIf there is legal or constructive obligation to dismantle a tank terminal at the end of its useful life, liabilities for future dismantling expenses are accrued at discounted values. The disman-tling liability is included in the asset value. The liabilities are regularly evaluated, and adjusted when there are material changes in interest rates, inflation or in other dismantling expenses. The adjustments are recognised as financial expenses.
2.23InterestbearingdebtInterest bearing debt is classified as non-current liabilities and appears initially as the amount of proceeds received, net of transaction costs incurred. In subsequent periods, transaction costs are deferred and charged to the profit and loss statement over the life of the underlying debt according to the effective interest method. Interest bearing debt are generally non-current liabilities, while instalments within the next 12 months are classified as current liabilities.
Interest expenses are recognised as an expense when incurred. Transactions costs are deferred and charged to the profit and loss statement over the life of the underlying debt using the effective interest rate method.
2.24ProvisionsProvisions are made when the Group has a present legal or constructive obligation as a result of past events, and it is probable that an outflow of resources will be required to settle the obligation. Provisions are based on best estimates. Provisions are reviewed on each balance sheet date and reflects the best estimate of the liability.
2.25PensioncostandliabilitiesThe Group operates a number of pension plans in accordance with the local conditions and practices in the countries in which it operates. Such pension plans are defined benefit plans or contribution plans according to the custom-ary pension plans prevailing in the country concerned. Defined benefit pension plans are pension plans with retirement, disability and termination in-come benefits. The retirement income benefits are generally a function of years of employment and final salary with the Company. Generally the schemes are funded through payments to insurance companies as determined by periodic actuarial calculations.
32 ODFJELL ANNUAL REPORT 2006 GrOuP AccOuNTS ODFJELL ANNUAL REPORT 2006 GrOuP AccOuNTS 33
The liability in respect of defined benefit pension plans is the present value of the defined benefit obligation at the balance sheet date less the fair value of plan assets, together with adjustments for actuarial gains/losses and past service cost. The net pension liability is calculated based on certain estimates with regards to interest rates, future salary adjustments etc. The estimates are based on historical experience and current market conditions. The cost of providing pen-sions is charged to the profit and loss statement so as to spread the regular cost over the vesting period of the employees. The effect of changes in estimates exceeding 10% of the highest of pension liabilities and plan assets is accounted for. Such changes are amortised over the remaining vesting period. For defined contribution plans, contributions are paid to pension insurance plans. Once the contributions have been paid, there are no further payment obligations. Contributions to defined contribution plans are charged to the profit and loss statement in the period to which the contributions relate.
The Group may at any time make alterationsto the terms and conditions of the pension scheme and undertake that they will inform the employees of any such changes.
2.26EarningspershareBasic earnings per share amounts are calculat-ed by dividing net profit for the year attributable to ordinary equity holders of the parent by the weighted average number of ordinary shares outstanding during the year.
Diluted earnings per share amounts are calculated by dividing the net profit attributable to ordinary equity holders of the parent (after deducting interest on any dilutive instruments) by the weighted average number of ordinary shares outstanding during the year plus the weighted average number of ordinary shares that would be issued on the conversion of all the dilutive potential ordinary shares into ordinary shares.
2.27ComparativesComparative figures have been reclassified to conform to changes in presentation in the current year when there are changes in accounting principles, corrections of errors or operations defined as discontinued.
2.28segmentsThe definition of main business segments, our
primary reporting format, is based on the com-pany’s internal reporting. A business segment provide services that are subject to risks and returns that are different from those of other business segments. The Group’s secondary reporting format, geographical segments, is provided for revenue, total assets and capital expenditure, as the reliability measurement criteria cannot be met for other items. Any sin-gle country contributing more than 10% of total revenue/asset/capital expenditure is reported separately. Our shipping revenue is allocated on the basis of the area in which the cargo is loaded. For the tank terminals the revenue is allocated to the area where the respective companies are located. Total assets and capital expenditure are allocated to the area where the respective assets are located while ships and newbuilding contracts are not allocated to a certain area as the ships sail on a worldwide basis. Financial information relating to segments is presented in note 3.
Transactions between the individual business areas are priced at market terms and are elimi-nated in the consolidated accounts. 2.29EventsafterthebalancesheetdateNew information on the Company’s positions at the balance sheet date is taken into account in the annual financial statements. Events after the balance sheet date that do not affect the Company’s position at the balance sheet date, but which will materially affect the Company’s position in the future are stated.
2.30IFRssandIFRICinterpretationsissuedbutnoteffectiveasper31.12.2006Odfjell expects following impact from new Standards or Interpretations that are not yet adopted by Odfjell.
IFRs7,FinancialInstrument:Disclosures.The new standard IFRS 7 introduces new disclo-sures to improve the information about financial instruments. The Group will apply IFRS 7 from annual period beginning 1 January 2007.
IFRs8,operatingsegmentsThe new standard IFRS 8 introduces changes in the identification of segments and measure-ment of segment information. The Group will apply IFRS 8 from annual period beginning 1 January 2009.
IFRIC10InterimFinancialReportingandImpairmentThe new interpretation in IFRIC 10 determines
that an entity shall not reverse an impairment loss recognised in a previous interim period in respect of goodwill or an investment in either an equity instrument or a financial asset carried at cost. The Group will apply the interpretation from annual period beginning 1 January 2007.
The Group expects that adoption of the pronouncements listed above will have no material impact on the Group’s financial state-ments in the period of initial application.
The following new Interpretations will have no impact for Odfjell as of today:- IFRIC 7 Applying the Restatement Approach under IAS 29 Financial Reporting in Hyper-inflationary Economies- IFRIC 8 Scope of IFRS 2- IFRIC 9 Reassessment of Embedded Derivatives- IFRIC 11 IFRS 2 – Group and Treasury Share Transactions- IFRIC 12 Service Concession Arrangements
Same also applies for the following amend-ments to: - IFRS 4 Revised Guidance on Implementing IFRS 4 Insurance Contracts- IAS 1 Amendments to IAS 1 Presentation of Financial Statements Capital Disclosures
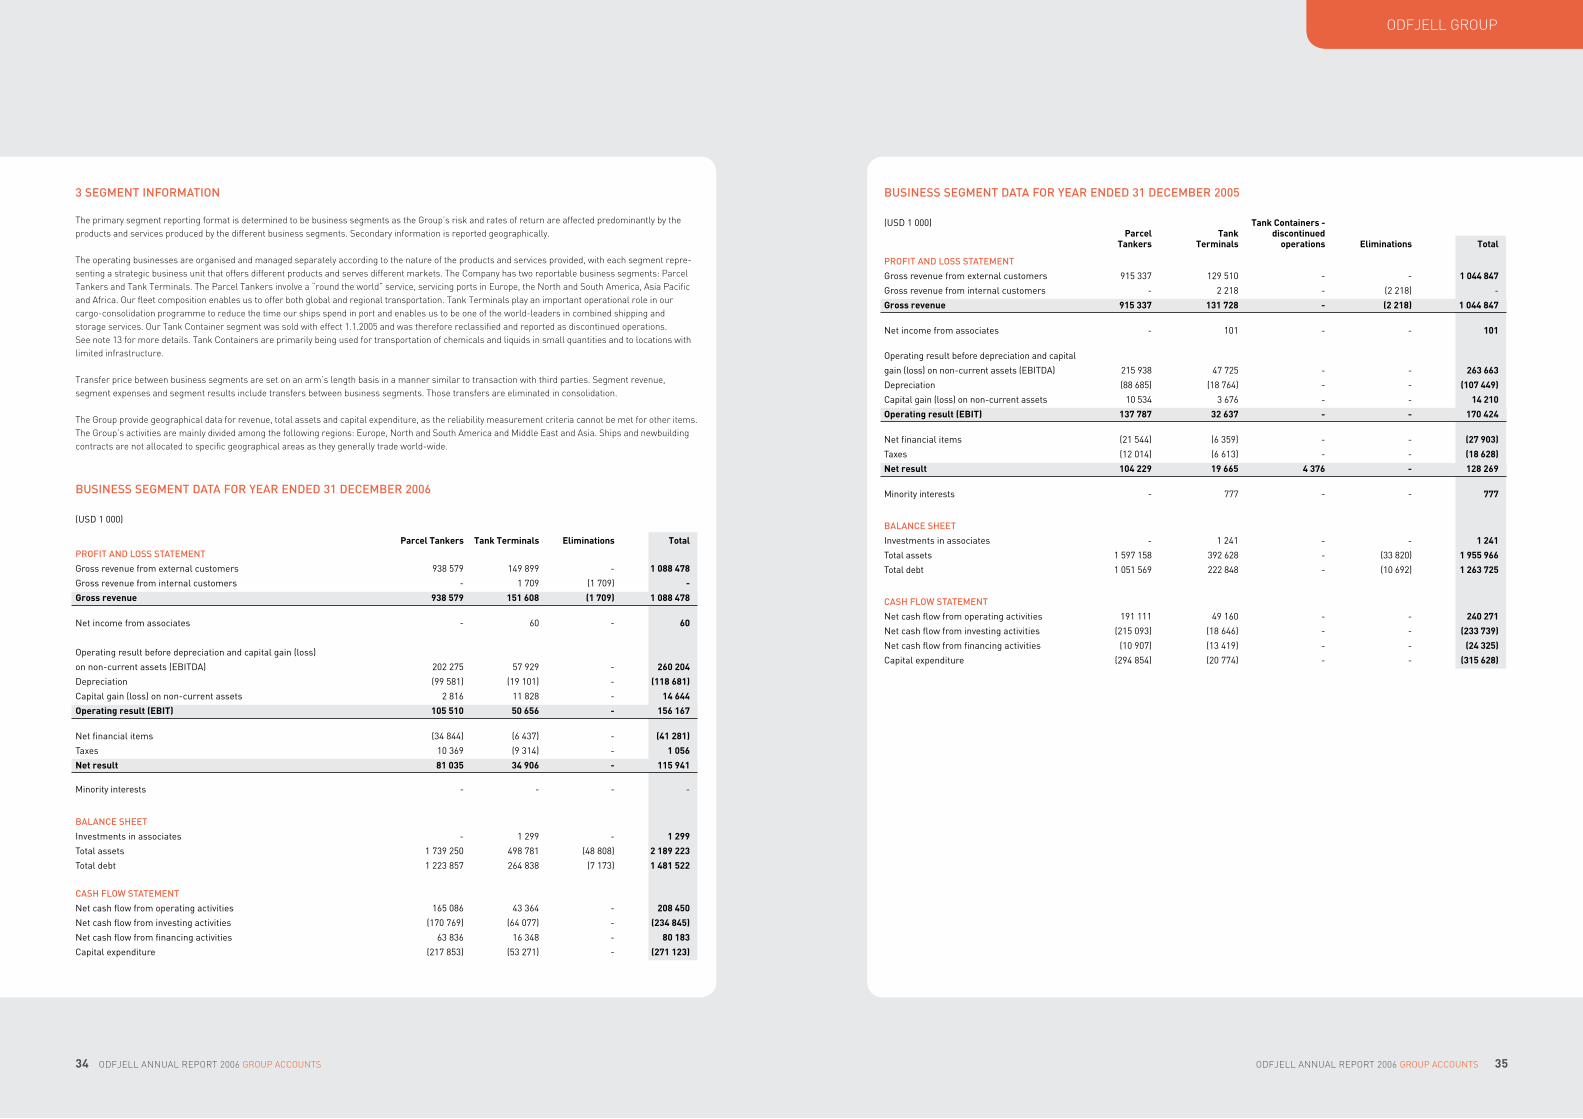
34 ODFJELL ANNUAL REPORT 2006 ODFJELL ANNUAL REPORT 2006 35
ODFJELL GROUP
BusINEsssEGmENTDATAFoRYEARENDED31DECEmBER2006
(uSd 1 000) Parcel Tankers Tank Terminals Eliminations TotalPRoFITANDLosssTATEmENT
Gross revenue from external customers 938 579 149 899 1 088 478
Gross revenue from internal customers 1 709 (1 709) -
Gross revenue 938 579 151 608 (1 709) 1 088 478
Net income from associates 60 60
Operating result before depreciation and capital gain (loss)
on noncurrent assets (EBITdA) 202 275 57 929 260 204
depreciation (99 581) (19 101) (118 681)
capital gain (loss) on noncurrent assets 2 816 11 828 14 644
Operating result (EBIT) 105 510 50 656 - 156 167
Net financial items (34 844) (6 437) (41 281)
Taxes 10 369 (9 314) 1 056
Net result 81 035 34 906 - 115 941
Minority interests
BALANCEshEET
Investments in associates 1 299 1 299
Total assets 1 739 250 498 781 (48 808) 2 189 223
Total debt 1 223 857 264 838 (7 173) 1 481 522
CAshFLoWsTATEmENT
Net cash flow from operating activities 165 086 43 364 208 450
Net cash flow from investing activities (170 769) (64 077) (234 845)
Net cash flow from financing activities 63 836 16 348 80 183
capital expenditure (217 853) (53 271) (271 123)
34 ODFJELL ANNUAL REPORT 2006 GrOuP AccOuNTS ODFJELL ANNUAL REPORT 2006 GrOuP AccOuNTS 35
3sEGmENTINFoRmATIoN
The primary segment reporting format is determined to be business segments as the Group’s risk and rates of return are affected predominantly by the products and services produced by the different business segments. Secondary information is reported geographically.
The operating businesses are organised and managed separately according to the nature of the products and services provided, with each segment repre-senting a strategic business unit that offers different products and serves different markets. The Company has two reportable business segments: Parcel Tankers and Tank Terminals. The Parcel Tankers involve a “round the world” service, servicing ports in Europe, the North and South America, Asia Pacific and Africa. Our fleet composition enables us to offer both global and regional transportation. Tank Terminals play an important operational role in our cargo-consolidation programme to reduce the time our ships spend in port and enables us to be one of the world-leaders in combined shipping and storage services. Our Tank Container segment was sold with effect 1.1.2005 and was therefore reclassified and reported as discontinued operations. See note 13 for more details. Tank Containers are primarily being used for transportation of chemicals and liquids in small quantities and to locations with limited infrastructure. Transfer price between business segments are set on an arm’s length basis in a manner similar to transaction with third parties. Segment revenue, segment expenses and segment results include transfers between business segments. Those transfers are eliminated in consolidation.
The Group provide geographical data for revenue, total assets and capital expenditure, as the reliability measurement criteria cannot be met for other items. The Group’s activities are mainly divided among the following regions: Europe, North and South America and Middle East and Asia. Ships and newbuilding contracts are not allocated to specific geographical areas as they generally trade world-wide.
BusINEsssEGmENTDATAFoRYEARENDED31DECEmBER2005
(uSd 1 000) Tank Containers - Parcel Tank discontinued Tankers Terminals operations Eliminations Total
PRoFITANDLosssTATEmENT
Gross revenue from external customers 915 337 129 510 1 044 847
Gross revenue from internal customers 2 218 (2 218)
Gross revenue 915 337 131 728 - (2 218) 1 044 847
Net income from associates 101 101
Operating result before depreciation and capital
gain (loss) on noncurrent assets (EBITdA) 215 938 47 725 263 663
depreciation (88 685) (18 764) (107 449)
capital gain (loss) on noncurrent assets 10 534 3 676 14 210
Operating result (EBIT) 137 787 32 637 - - 170 424
Net financial items (21 544) (6 359) (27 903)
Taxes (12 014) (6 613) (18 628)
Net result 104 229 19 665 4 376 - 128 269
Minority interests 777 777
BALANCEshEET
Investments in associates 1 241 1 241
Total assets 1 597 158 392 628 (33 820) 1 955 966
Total debt 1 051 569 222 848 (10 692) 1 263 725
CAshFLoWsTATEmENT
Net cash flow from operating activities 191 111 49 160 240 271
Net cash flow from investing activities (215 093) (18 646) (233 739)
Net cash flow from financing activities (10 907) (13 419) (24 325)
capital expenditure (294 854) (20 774) (315 628)

ODFJELL GROUP
36 ODFJELL ANNUAL REPORT 2006 GrOuP AccOuNTS ODFJELL ANNUAL REPORT 2006 GrOuP AccOuNTS 37
BusINEsssEGmENTDATAFoRYEARENDED31DECEmBER2004
(uSd 1 000) Tank Containers - Parcel Tank discontinued Tankers Terminals operations Eliminations Total
PRoFITANDLosssTATEmENT
Gross revenue from external customers 816 809 126 671 943 481
Gross revenue from internal customers 2 706 (2 706)
Gross revenue 816 809 129 377 - (2 706) 943 481
Net income from associates 86 86
Operating result before depreciation and capital
gain (loss) on noncurrent assets (EBITdA) 158 526 48 824 207 350
depreciation (80 079) (19 881) (99 959)
capital gain (loss) on noncurrent assets 6 645 6 645
Operating result (EBIT) 85 092 28 944 - - 114 036
Net financial items (3 018) (5 858) (8 876)
Taxes (3 215) (8 063) (11 278)
Net result 78 859 15 023 695 - 94 577
Minority interests 157 157
BALANCEshEET
Investments in associates 1 140 1 140
Total assets 1 466 916 397 273 43 145 (35 610) 1 871 725
Total debt 965 983 233 078 34 720 (4 855) 1 228 927
CAshFLoWsTATEmENT
Net cash flow from operating activities 187 602 46 009 1 008 234 619
Net cash flow from investing activities (195 233) (13 259) (6 343) (214 835)
Net cash flow from financing activities 12 695 (27 233) 3 233 (11 306)
capital expenditure (200 469) (22 339) (5 396) (228 204)
GRossREvENuEPERGEoGRAPhICALsEGmENT
(uSd 1 000) 2006 2005 2004
uSA 216 602 235 345 225 499
Other North America 2 176 4 994 8 001
Brazil 119 364 87 233 76 664
Other South America 88 020 82 349 68 920
Netherlands 157 807 153 136 151 724
Other Europe 94 211 85 504 69 773
Africa 101 327 88 550 76 021
Australasia 12 838 13 574 8 877
Middle East and Asia 296 134 294 163 258 001
Total gross revenue 1 088 478 1 044 847 943 481
ToTALAssETsPERGEoGRAPhICALsEGmENT
(uSd 1 000) 2006 2005 2004
North America 121 457 126 521 135 804
South America 23 467 12 247 10 746
Norway 239 648 174 673 212 210
Europe 217 610 196 148 247 943
Middle East and Asia 163 222 125 126 118 703
unallocated ships and newbuilding contracts 1 423 820 1 321 252 1 146 318
Total assets 2 189 223 1 955 966 1 871 725
CAPITALEXPENDITuREPERGEoGRAPhICALsEGmENT
(uSd 1 000) 2006 2005 2004
North America 1 417 1 162 1 425
South America 505 6 011 852
Norway 5 287 7 074 3 900
Europe 23 494 68 436 20 853
Middle East and Asia 35 328 869 375
unallocated ships and newbuilding contracts 205 093 232 076 200 799
Total capital expenditure 271 123 315 628 228 204
4INvEsTmENTsINAssoCIATEs
As Odfjell is involved in the management and has significant influence of this company, it is accounted for as an associated company. Since V.O. Tank Terminal Ningbo is an unlisted company, there are no quoted prices for a fair value consideration.
(uSd 1 000) Carrying Ownership
Entity Country Segment interest amount
v.O. Tank Terminal Ningbo china Tank Terminals 12.5%
Investment in associates 1.1.2004 1 054
Net income from associates 2004 86
Investment in associates 31.12.2004 1 140
Net income from associates 2005 101
Investment in associates 31.12.2005 1 241
Exchange rate differences on translation (2)
Net income from associates 2006 60
Investment in associates 31.12.2006 1 299
A summary of financial information for our share of the associate:
(uSd 1 000) 2006 2005 2004
Gross revenue 338 394 366
Net result 60 101 86
Assets 1 357 1 316 1 203
Liabilities 58 75 63Equity 1 299 1 241 1 140

ODFJELL GROUP
38 ODFJELL ANNUAL REPORT 2006 GrOuP AccOuNTS ODFJELL ANNUAL REPORT 2006 GrOuP AccOuNTS 39
5TImE-ChARTEREXPENsEs
Time-charter expenses consist of expenses for operating leases, see note 29 for future obligations.
(uSd 1 000) 2006 2005 2004
floating Tcexpenses 56 947 72 911 80 179
Other Tcexpenses 87 835 83 443 77 926
Total time-charter expenses 144 782 156 354 158 105
6oPERATINGEXPENsEs
Operating expenses consist of expenses for operating ships and terminals (for example wages and remunerations for crew and operational personnel and materials and equipment for ships and terminals).
(uSd 1 000) 2006 2005 2004
Salary expenses (note 8) 100 697 97 603 89 217
cost of operations terminals 38 187 32 261 30 788
cost of operations ships 99 523 101 465 69 799
Tonnage tax 90 350 469
currency hedging (435) (12 102)
Total operating expenses 238 061 219 577 190 273
7GENERALANDADmINIsTRATIvEEXPENsEs
General and administrative expenses consist of expenses for headquarter’s activity, activity outside Bergen for brokerage, agency and general administration in tank terminals.
(uSd 1 000) 2006 2005 2004
Salary expenses (note 8) 51 325 44 402 49 387
Other expenses 33 462 28 883 41 857
currency hedging (188) (8 835)
Total general and administrative expenses 84 600 64 449 91 244
Including in the above is auditor’s remuneration for:
(uSd 1 000 exclusive vAT) 2006 2005 2004
Statutory auditing 818 524 328
Other assurance services 13 11 3
Tax advisory services 283 154 112
Other nonaudit services 252 239 281
Total remuneration 1 366 928 725
8sALARYEXPENsEs,NumBERoFEmPLoYEEsANDBENEFITsToBoARDoFDIRECToRsANDmANAGEmENT
Salary expenses are included in operating and general and administrative expenses according to the activity.
(uSd 1 000) 2006 2005 2004
Salaries 121 212 114 113 113 559
Social expenses 20 681 19 704 17 359
Pension expenses defined benefit plans (note 22) 8 325 6 441 6 089
Pension expenses defined contribution plans (note 22) 1 047 918 791
Other benefits 758 828 807
Total salary expenses 152 024 142 004 138 604
The salary expenses include bonus payment to employees of USD 2.2 mill. (USD 4.7 mill. in 2005). Bonus expenses are included with USD 2.2 mill. in general and administrative expenses. In 2005 the comparable figure was USD 2.6 mill. and USD 2.1 mill. was included in operating expenses.
As from 2006 the Company introduced a performance-related and incentive pay scheme for all employees at Odfjell Headquarters, overseas offices, sea officers and Odfjell Terminals Houston. The purpose is to motivate, encourage and stimulate to focus on bottom line result. Total achievable bonus ranges depending on job category and market competition. The bonus is based on predefined targets on a combination of Odfjell Group annual result, key performance indicators and individual performance. No payments were made under this scheme for 2006. The Board reviews the application of the system from year to year and has approved the same scheme for 2007.
Average number of employees: 2006 2005 2004
Europe 918 900 872
North America 127 122 129
South East Asia 1 864 1 628 1 406
South America 356 332 293
Other 128 296 512
Total average number of employees 3 392 3 277 3 210
During 2006 the Board of Directors consisted of 6 members after the President/CEO renounced to be re-elected in May 2006 (in 2005 the Board of Directors consisted of 7 members). Compensation and benefits to the Board of Directors:
(uSd 1 000) 2006 2005 2004
Salary 359 315 279
Pension cost (note 22) 25 20
Other benefits 3 2 2
Compensation and benefits to the President/CEO and managers reporting directly to him:
(uSd 1 000) 2006 2005 2004
Salary 2 095 2 098 1 777
Bonus 398 1 012 139
Pension cost (note 22)* 381 394 336
Other benefits 237 250 259
Total compensation and benefits 3 111 3 754 2 511
Average number of managers included 8 9 9
*In 2005 and 2004 pension cost is the same as the pension contribution.

ODFJELL GROUP
40 ODFJELL ANNUAL REPORT 2006 GrOuP AccOuNTS ODFJELL ANNUAL REPORT 2006 GrOuP AccOuNTS 41
The President/CEO is entitled to two years salary if the Company terminates the employment prior to the age of 60. As from the age of 60 both the President/CEO and the Company have the right to terminate the employment with 12 months notice, however the President/CEO has the right to resign and enter into a fixed consultancy agreement, remunerated at 50% of the preceding year’s fixed salary.
The President/CEO and managers reporting directly to him is included in the Company’s defined benefit pension plan, see note 22. The Company also funded pension obligations related to senior management for salaries exceeding 12G (presently 12G equals USD 117 751), up to 66% of 18G. This arrangement was terminated as from 1.1.2007.
The Company does not have any stock option plans.
9NoN-CuRRENTAssETs
(uSd 1 000) Ships and Office
Real newbuilding Periodic Tank Tank equipment
estate contracts maintenance terminals containers and cars Total
Net carrying amount 1.1.2006 27 368 1 279 460 41 792 286 292 8 642 1 643 554Investment 999 173 788 38 493 53 271 4 572 271 123Sale at book value (18 114) (469) (474) (19 057)depreciation 2006 (1 602) (66 825) (29 517) (16 571) (4 167) (118 682)Exchange rate differences 1 090 5 141 72 17 196 819 24 318
Net carrying amount 31.12.2006 27 856 1 373 450 50 370 340 188 - 9 392 1 801 255 cost 34 576 1 636 319 41 792 416 625 30 082 2 159 394Accumulated depreciation (7 208) (356 859) (130 333) (21 440) (515 840)
Net carrying amount 1.1.2006 27 368 1 279 460 41 792 286 292 - 8 642 1 643 554 cost 36 665 1 797 134 50 370 487 092 34 999 2 406 260Accumulated depreciation (8 810) (423 684) (146 904) (25 607) (605 005)
Net carrying amount 31.12.2006 27 855 1 373 450 50 370 340 188 - 9 392 1 801 255
Net carrying amount 1.1.2005 21 509 1 116 073 30 246 311 838 9 756 1 489 422Investment 8 723 239 768 43 526 20 774 2 837 315 628Sale at book value (13 157) (9 194) (11 209) (131) (33 691)depreciation 2005 (1 489) (63 224) (22 786) (16 984) (2 966) (107 449)Exchange rate differences (1 375) (18 128) (854) (20 357)
Net carrying amount 31.12.2005 27 368 1 279 460 41 792 286 292 - 8 642 1 643 554
cost 27 547 1 475 982 30 246 425 188 28 230 1 987 193Accumulated depreciation (6 037) (359 909) (113 350) (18 474) (497 770)
Net carrying amount 1.1.2005 21 509 1 116 073 30 246 311 838 - 9 756 1 489 423 cost 34 576 1 636 319 41 792 416 625 30 082 2 159 394Accumulated depreciation (7 208) (356 859) (130 333) (21 440) (515 840)
Net carrying amount 31.12.2005 27 368 1 279 460 41 792 286 292 - 8 642 1 643 554
Net carrying amount 1.1.2004 20 913 1 030 682 20 320 300 906 21 277 9 847 1 403 944Investment 3 519 165 795 27 535 22 339 5 396 3 620 228 204Sale at book value (20 113) (177) (20 290)Assets classified as discontinued operations (2 634) (26 673) (674) (29 981)depreciation 2004 (982) (60 291) (17 609) (18 217) (2 860) (99 959)Exchange rate differences 693 6 810 7 504
Net carrying amount 31.12.2004 21 509 1 116 073 30 246 311 838 - 9 756 1 489 422
cost 26 789 1 403 962 20 320 402 898 27 712 27 070 1 908 751Accumulated depreciation (5 876) (373 280) (101 992) (6 435) (17 223) (504 806)
Net carrying amount 1.1.2004 20 913 1 030 682 20 320 300 906 21 277 9 847 1 403 945
cost 27 547 1 475 982 30 246 425 188 28 230 1 987 193Accumulated depreciation (6 037) (359 909) (113 350) (18 474) (497 770)
Net carrying amount 31.12.2004 21 509 1 116 073 30 246 311 838 - 9 756 1 489 423
Capitalgain(loss)onnon-currentassetsIn 2006 capital gain from sale of ships was USD 2.8 mill. and capital gain related to compensation for relocation of the Dalian tank terminal was USD 11.8 mill. In 2005 capital gain from sale of ships was USD 10.5 mill. and capital gain from sale of our 14% share in the tank terminal in Dalian was USD 3.7 mill.
DepreciationperiodsNon-current assets are depreciated straight-line over their estimated useful lives as follows (in years):
Real estate ........................................................... up to 50 Ships ..................................................................... 25 – 28Periodic maintenance .......................................... 2.5 – 5 Main components of tank terminal .................... 10 – 40 Office equipment and cars .................................. 3 – 15
Fullydepreciatednon-currentassetsAssets with a total cost price of USD 1.9 mill. have been fully depreciated as at 31 December 2006, but are still in use.
AssetsfinancedunderfinanceleasesThe carrying amount of ships financed under finance leases were USD 242.7 mill. and USD 254.3 mill. at 31 December 2006 and 31 December 2005 respectively.
CapitalisedinterestonnewbuildingcontractsNewbuilding contracts include capitalised interest in connection with the finance of the newbuilding program. The capitalised interest carried in the balance sheet equalled USD 6.3 mill. in 2006 and USD 2.6 mill. in 2005.
ImpairmentchargesThe management has evaluated the need for potential impairment losses in accordance with the accounting principles in note 2.14 and there were no indications that impairment was necessary in 2006 or 2005.
ChangeindepreciationperiodsThe management reviewed the depreciation periods for ships. This has led to 18 ships (2005; 6 ships) that was previously depreciated over 25 years now being depreciated on average over 28 years. This has been accounted for as a change in estimates, and has decreased depreciation expenses of USD 1.3 mill. in 2006 and USD 1.9 mill. in 2005.
ChangeinresidualvalueThe residual values are evaluated on a regular basis and any changes have an effect on future depreciations. During 2006 the market value for demolition of ships has been changed from USD 305 per ton at the beginning of the year to USD 410 per ton at the end of the year.
10oThERFINANCIALITEms
(uSd 1 000) 2006 2005 2004 Other financial income 427 223 188Other financial expenses (992) (1 502) (973)changes in the fair value of investments classified as financial assets at fair value through profit or loss (66) (93) (103)
Total other financial items (631) (1 372) (888)
11CuRRENCYGAINs(LossEs)
(uSd 1 000) 2006 2005 2004 currency hedging contracts 760 769 16 231Noncurrent receivables and liabilities (247) (478) (223)cash and cash equivalents 2 495 (2 229) 2 184Other current assets and current liabilities (894) 3 721 (1 305)
Total currency gains (losses) 2 114 1 783 16 887

ODFJELL GROUP
42 ODFJELL ANNUAL REPORT 2006 GrOuP AccOuNTS ODFJELL ANNUAL REPORT 2006 GrOuP AccOuNTS 43
12TAXEs
(uSd 1 000) 2006 2005 2004 Taxes payable, Norway (586) (2 008) Taxes payable, other jurisdictions (9 721) (3 798) (5 098)change in deferred tax, Norway – within shipping tax system 9 255 6 730 (8 291)change in deferred tax, Norway – ordinary tax 2 377 (15 987) 5 405change in deferred tax, other jurisdictions (269) (3 565) (3 294)
Total taxes 1 056 (18 628) (11 278)
A reconciliation of the effective rate of tax and the tax rate in Odfjell ASA’s country of registration:
(uSd 1 000) 2006 2005 2004 Pretax profit 114 885 142 521 105 160Tax assessed at the tax rate in Odfjell ASA’s country of registration (28% in 2006, 2005 and 2004) (32 168) (39 906) (29 445)difference between Norwegian and rates in other jurisdictions (1 104) (1 209) (1 511)Tax related to nondeductible expenses (520) (2 540) (2 882)Tax related to demerger of Norwegian shipping tax company 13 703 Tax related to nontaxable income 21 145 25 026 22 560
Tax expense 1 056 (18 628) (11 278)
Effective tax rate (0.9%) 13.1% 10.7%
The tax returns of the company and its subsidiaries’ are routinely examined by relevant tax authorities. From time to time, in the ordinary course of business, certain items in the tax returns are questioned or challenged. The Company believes that adequate tax provisions have been made for open years.
Specification of deferred taxes (deferred tax assets):
(uSd 1 000) 2006 2005 2004 current assets 1 929 Pensions 15 189 12 359 14 093Provisions 20 122 31 322 16 474Loss carried forward 33 782 110 646 93 136Temporary differences not accounted for (40 245) (97 477)
Total negative temporary differences 30 777 56 850 123 703
Property, plant and equipment 92 306 96 321 77 812deferred gains/losses 24 753 (2 261)Noncurrent receivables and liabilities 18 232 51 988 123 767Other 35 (1 883) 6 134
Total positive temporary differences 110 573 171 179 205 452
Total recognised deferred tax liabilities 23 227 34 397 25 262
The Group has a total loss carried forward of USD 33.8 mill. as at 31 December 2006 (2005: USD 110.6 mill.), that are available indefinitely to offset against future taxable profits of the companies in which the losses arose. Tax group contributions are also available within the same countries and within the same tax regime.
The distribution of dividend to the Odfjell ASA’s shareholders does not affect the Company’s payable or deferred tax.
The changes in temporary differences in 2006 are as follows:
(uSd 1 000) Changes in temporary 1.1.2006 differences 31.12.2006
current assets (1 929) (1 929)Pensions (12 359) (2 830) (15 189)Provisions (31 322) 11 200 (20 122)Loss carried forward (110 646) 76 864 (33 782)Temporary differences not accounted for 97 477 (57 232) 40 245Property, plant and equipment 96 321 (4 015) 92 306deferred gain/losses 24 753 (24 753) -Noncurrent receivables and liabilities 51 988 (33 756) 18 232Other (1 883) 1 918 35
Total 114 329 (34 533) 79 796Tax rate 1735%Tax booked through income statement 11 363
Accumulated non-taxed income within Norwegian shipping tax systems (uSd 1 000) 2006 2005 2004 Balance of untaxed income at entry into the shipping tax system 397 814 387 559 427 842Accumulated untaxed operating income 320 778 310 623 302 120
Accumulated untaxed income 718 592 698 181 729 962deferred tax liabilities
Companies taxed under the Norwegian shipping tax regime will not be taxed on their net operating profit prior to distribution of profits to their share holders. Income tax rate for undistributed profits is, under current conditions, zero and hence deferred taxes are to be calculated based on this zero tax rate. The income tax consequences of dividends are recognised when a liability to pay the dividend is recognised. Taxation under the shipping tax regime requires compliance to certain requirements, and voluntary or forced exit of the regime will result in taxation of undistributed profits.
13DIsCoNTINuEDoPERATIoNs
In December 2004 Odfjell agreed to sell its 50% shareholding in the tank container joint-venture company Hoyer-Odfjell BV, Rotterdam to our joint-venture partner Hoyer. Hoyer-Odfjell was the only entity in Odfjell’s Tank Container segment and its business was transportation of chemicals and other liquids in tank containers. We decided to sell our share of the business to our joint venture partner Hoyer due to different views on the strategic development of the company. The agreement was effective from January 2005 and shareholder loans were repaid and we were released of guarantees established for Hoyer-Odfjell`s financial commitments. Hoyer-Odfjell is not consolidated in 2005 as the disposal was executed in the beginning of the year. Based on the sales price of USD 13.2 mill. the gain on the sale equalled USD 4.4 mill. This gain is included in the profit and loss statement under net result discontinued operations.
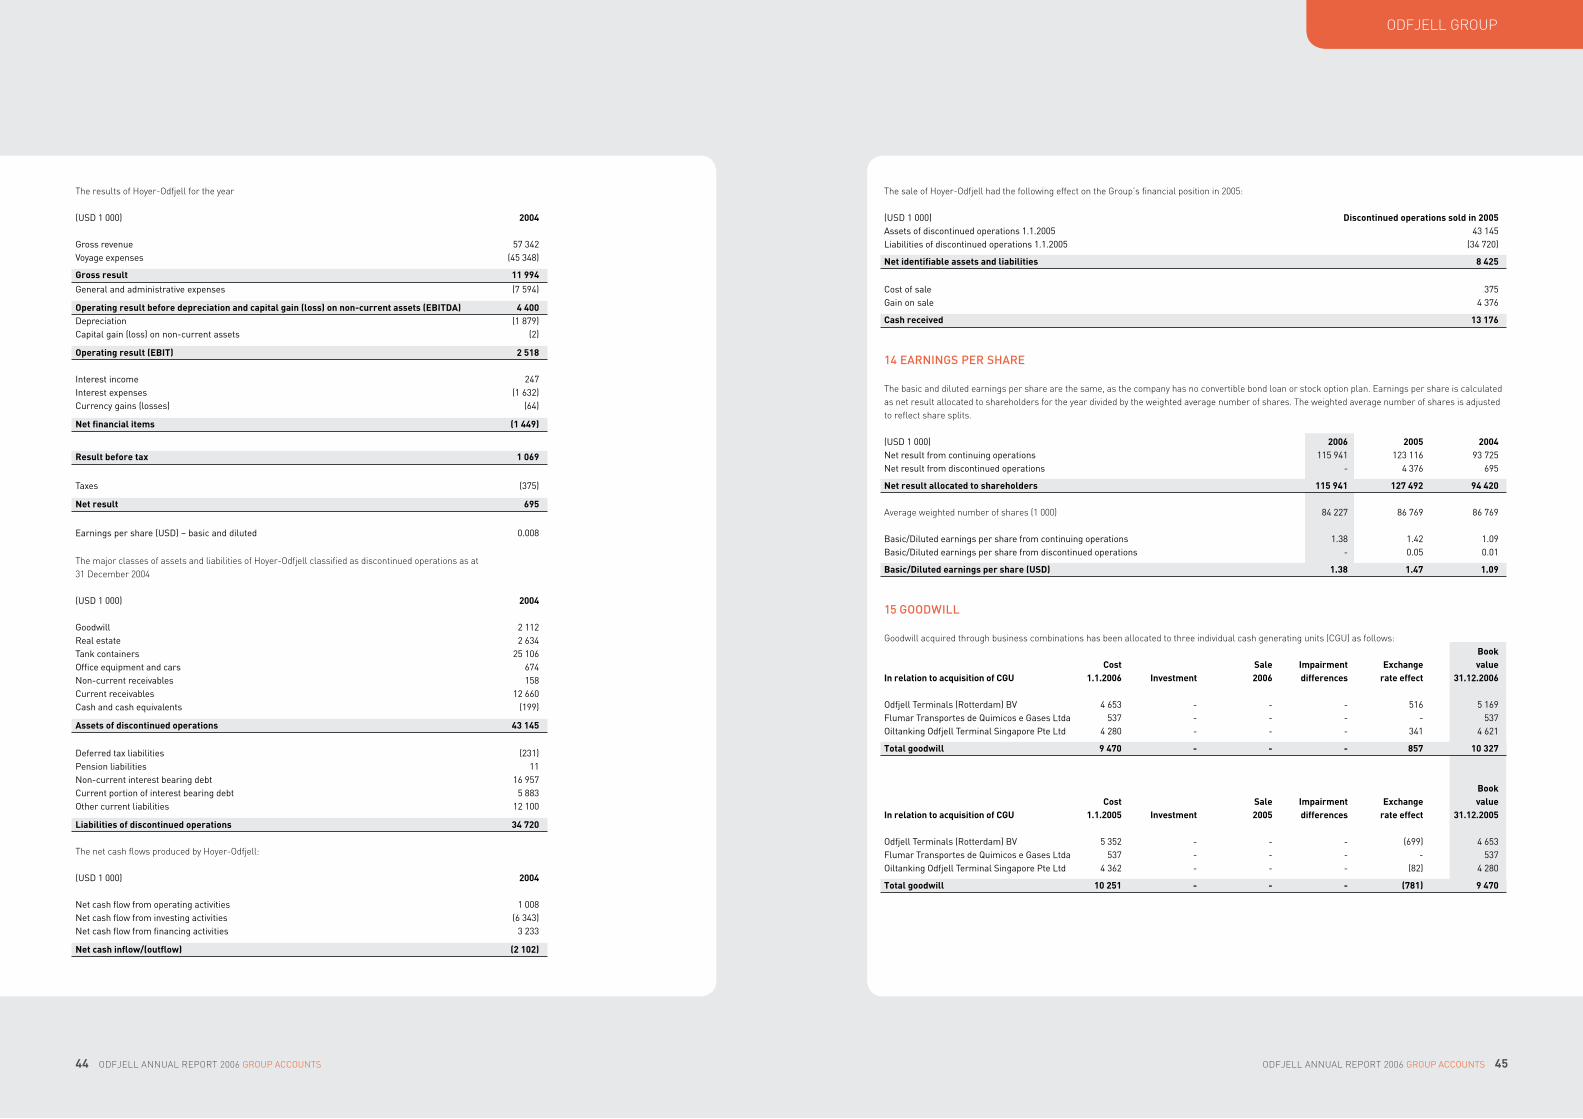
ODFJELL GROUP
44 ODFJELL ANNUAL REPORT 2006 GrOuP AccOuNTS ODFJELL ANNUAL REPORT 2006 GrOuP AccOuNTS 45
The results of Hoyer-Odfjell for the year (uSd 1 000) 2004 Gross revenue 57 342voyage expenses (45 348)
Gross result 11 994
General and administrative expenses (7 594)
Operating result before depreciation and capital gain (loss) on non-current assets (EBITDA) 4 400 depreciation (1 879) capital gain (loss) on noncurrent assets (2)
Operating result (EBIT) 2 518
Interest income 247Interest expenses (1 632)currency gains (losses) (64)
Net financial items (1 449)
Result before tax 1 069
Taxes (375)
Net result 695
Earnings per share (uSd) – basic and diluted 0.008
The major classes of assets and liabilities of Hoyer-Odfjell classified as discontinued operations as at 31 December 2004
(uSd 1 000) 2004 Goodwill 2 112real estate 2 634Tank containers 25 106Office equipment and cars 674Noncurrent receivables 158current receivables 12 660cash and cash equivalents (199)
Assets of discontinued operations 43 145
deferred tax liabilities (231)Pension liabilities 11Noncurrent interest bearing debt 16 957current portion of interest bearing debt 5 883Other current liabilities 12 100
Liabilities of discontinued operations 34 720 The net cash flows produced by Hoyer-Odfjell:
(uSd 1 000) 2004 Net cash flow from operating activities 1 008Net cash flow from investing activities (6 343)Net cash flow from financing activities 3 233
Net cash inflow/(outflow) (2 102)
The sale of Hoyer-Odfjell had the following effect on the Group’s financial position in 2005:
(uSd 1 000) Discontinued operations sold in 2005Assets of discontinued operations 1.1.2005 43 145Liabilities of discontinued operations 1.1.2005 (34 720)
Net identifiable assets and liabilities 8 425
cost of sale 375Gain on sale 4 376
Cash received 13 176
14EARNINGsPERshARE
The basic and diluted earnings per share are the same, as the company has no convertible bond loan or stock option plan. Earnings per share is calculated as net result allocated to shareholders for the year divided by the weighted average number of shares. The weighted average number of shares is adjusted to reflect share splits.
(uSd 1 000) 2006 2005 2004Net result from continuing operations 115 941 123 116 93 725Net result from discontinued operations 4 376 695
Net result allocated to shareholders 115 941 127 492 94 420 Average weighted number of shares (1 000) 84 227 86 769 86 769 Basic/diluted earnings per share from continuing operations 1.38 1.42 1.09Basic/diluted earnings per share from discontinued operations 0.05 0.01
Basic/Diluted earnings per share (USD) 1.38 1.47 1.09
15GooDWILL
Goodwill acquired through business combinations has been allocated to three individual cash generating units (CGU) as follows: Book Cost Sale Impairment Exchange valueIn relation to acquisition of CGU 1.1.2006 Investment 2006 differences rate effect 31.12.2006
Odfjell Terminals (rotterdam) Bv 4 653 516 5 169flumar Transportes de Quimicos e Gases Ltda 537 537Oiltanking Odfjell Terminal Singapore Pte Ltd 4 280 341 4 621
Total goodwill 9 470 - - - 857 10 327
Book Cost Sale Impairment Exchange valueIn relation to acquisition of CGU 1.1.2005 Investment 2005 differences rate effect 31.12.2005
Odfjell Terminals (rotterdam) Bv 5 352 (699) 4 653flumar Transportes de Quimicos e Gases Ltda 537 537Oiltanking Odfjell Terminal Singapore Pte Ltd 4 362 (82) 4 280
Total goodwill 10 251 - - - (781) 9 470

ODFJELL GROUP
46 ODFJELL ANNUAL REPORT 2006 GrOuP AccOuNTS ODFJELL ANNUAL REPORT 2006 GrOuP AccOuNTS 47
In Norway, employees are entitled to loans from the Company. Employee loans are generally secured by property mortgages. Loans to the President/CEO and managers reporting directly to him are either interest free or they carry an interest of 3.5%, while other employee loans are currently calculated at 3.5% interest per annum. Repayment periods vary between 5 and 15 years for loans to the President/CEO and managers reporting directly to him. Other employee loans are generally repayable over 5 years. The President/CEO and managers reporting directly to him have loans from the Company as follows: Terje Storeng (USD 0.2 mill.), Jan Hammer (USD 0.2 mill.), Helge Olsen (USD 0.1 mill.), Haakon Ringdal (USD 0.05 mill.), Jan Didrik Lorentz (USD 0.2 mill.), Brit Bennett (USD 0.05 mill.) and Atle Knutsen (USD 0.2 mill.).
17NoN-CuRRENTRECEIvABLEs
(uSd 1 000) 2006 2005 2004 Loans to employees 1 505 1 254 1 937Other noncurrent receivables 573 492 1 908
Total other non-current receivables 2 078 1 746 3 845
18CuRRENTRECEIvABLEs
(uSd 1 000) 2006 2005 2004 Trade receivables 94 020 80 157 76 012Other receivables 21 489 5 863 3 885Prepaid costs 4 185 13 216 3 205Provisions for bad debts (6 025) (5 216) (3 931)
Total current receivables 113 670 94 019 79 171
Book Cost Sale Impairment Exchange valueIn relation to acquisition of CGU 1.1.2004 Investment 2004 differences rate effect 31.12.2004
Odfjell Terminals (rotterdam) Bv 4 937 415 5 352flumar Transportes de Quimicos e Gases Ltda 537 537Oiltanking Odfjell Terminal Singapore Pte Ltd 4 186 176 4 362
Total goodwill 9 660 - - - 591 10 251
The management has evaluated the need for potential impairment losses in accordance with the accounting principles in note 2.14 and no impairment was necessary as recoverable amounts were higher than book values in both 2006, 2005 and 2004. Recoverable amount has been calculated for each CGU. For tank terminals it has been determined based on a normalised result for each terminal. We have calculated the “value in use” based on five years’ EBITDA and a residual value after five years. For shipping companies it has been determined based on a normal timecharter earning and a normal level of operating expenses for each ship over the remaining useful life of the ship. The net present value of future cash flows was based on a weighted average cost of capital (“WACC”) of 6.4 % in 2006 and 7.2 % in 2005.
16AvAILABLE-FoR-sALEINvEsTmENTs Average(uSd 1 000) interest rate Book value Book value Book value Currency 2006 2006 2005 2004
Bonds and certificates issued by financial institutions Eur 15 675Bonds and certificates issued by financial institutions uSd 5.6% 52 419 56 934 61 920Bonds and certificates issued by corporates Eur 11.0% 4 426 3 986 Bonds and certificates issued by corporates uSd 4.6% 20 291 20 093 26 880
Total available-for-sale investments 77 137 81 013 104 475
Book value equals market value. Market value of investments that are actively traded in organised financial markets is determined by reference to quoted market bid prices at the close of business on the balance sheet date. In 2006 unrealised gain of USD 0.2 million were recognised directly to equity (unrealised losses of USD 0.5 million in 2005). Bonds and certificates generally have interest rate adjustments every three months.
19BuNkERsANDoThERINvENToRIEs
(uSd 1 000) 2006 2005 2004 Bunkers 15 486 15 194 10 579Other inventories 1 009 888 835
Total bunkers and other inventories 16 496 16 083 11 414
20CAshANDCAshEQuIvALENTs
Cash at banks earn interest at floating rates based on bank time deposit rates. Short-term deposits and other liquid investments are made for varying periods of between one day and three months depending on the immediate cash requirements of the Group and earn interest at the respective short-term rates. Restricted cash of USD 2.1 mill. (USD 2.8 mill. in 2005) consist of funds for withholding taxes relating to employees in Odfjell ASA. The cash and cash equivalents do not include available credit facilities.
(uSd 1 000) 2006 2005 2004
cash at banks and in hand 68 339 50 616 104 018
Shortterm deposits 84 372 50 500 6 391
Other liquid investments 9 916 9 952 16 269
Effect from currency exchange rate fluctuations 2 659 (2 229) 2 184
Total cash and cash equivalents 165 287 108 840 128 862 Available credit facilities 15 000
21shARECAPITALANDPREmIum
Number of shares Share capital Share premium
(thousand) (uSd 1 000) (uSd 1 000)
2006 2005 2004 2006 2005 2004 2006 2005 2004
Ashares 65 690 65 690 65 690 22 277 22 277 22 277 40 507 83 244 83 244
Bshares 21 079 21 079 21 079 7 148 7 148 7 148 12 998 26 711 26 711
Total 86 769 86 769 86 769 29 425 29 425 29 425 53 504 109 955 109 955
Own shares
Ashares 1 500 509
Bshares 1 811 614
Total outstanding 83 458 86 769 86 769 28 302 29 425 29 425 53 504 109 955 109 955
The number of shares are all authorised, issued and fully paid. Nominal value is NOK 2.50, equivalent to USD 0.40 as at 31.12.2006. All shares have the same rights in the Company, except that B-shares have no voting rights.
In accordance with decision on the Annual General Meeting 4 May 2006 NOK 500 million (USD 56 million) was transferred from share premium to other equity.

ODFJELL GROUP
48 ODFJELL ANNUAL REPORT 2006 GrOuP AccOuNTS ODFJELL ANNUAL REPORT 2006 GrOuP AccOuNTS 49
Shares owned by members of the Board of Directors, President/CEO and managers reporting directly to him (including related parties): 2006 2005 2004 A-shares B-shares A-shares B-shares A-shares B-shares chairman of the Board of directors, B. d. Odfjell and Board MemberLaurence W. Odfjell 29 463 964 1 041 176 29 467 964 1 045 176 29 467 964 1 045 176Member of the Board of directors, Peter G. Livanos 16 503 396 20 500 16 484 396 20 500 16 077 696 5 916 692President/cEO, Terje Storeng 70 560 2 112 70 560 2 112 70 560 2 112Senior vice President, Asia, Atle Knutsen 11 712 2 336 11 712 2 336 11 712 2 336
dividend paid(uSd 1 000) 2006 2005 2004 Ashares 54 862 46 193 30 820Bshares 17 604 14 823 9 890
Total 72 467 61 016 40 710
Dividend paid per share was NOK 5.50 in 2006 and NOK 4.50 in 2005.
Based on the result for 2006, the Board has proposed a dividend of NOK 3 per share in 2007, a total of NOK 260 million equivalent to USD 41.5 mill. at current exchange rate. The proposed dividend has not been recognised since it has not yet been approved by the shareholders’ meeting.
20 largest shareholders as per 31 December 2006:
Name Percent of Percent A-shares B-shares Total votes of shares1 Norchem ApS 25 966 492 1 041 176 27 007 668 39.53 % 31.13 %2 chemLog Holdings Ltd 16 503 396 20 500 16 523 896 25.12 % 19.04 %3 Odinfondene 4 628 801 4 628 801 5.33 %4 SIS Segaintersettle 2 217 200 2 330 640 4 547 840 3.38 % 5.24 %5 folketrygdfondet 2 086 500 1 960 200 4 046 700 3.18 % 4.66 %6 AS rederiet Odfjell 3 497 472 3 497 472 5.32 % 4.03 %7 Odfjell chemical Tankers AS 1 500 000 1 811 255 3 311 255 2.28 % 3.82 %8 Paretofondene 1 189 820 1 531 000 2 720 820 1.81 % 3.14 %9 Odfjell Shipping (Bermuda) Ltd 1 259 200 1 215 760 2 474 960 1.92 % 2.85 %10 Svenska Handelsbanken 1 089 400 879 100 1 968 500 1.66 % 2.27 %11 JP Morgan chase 892 200 451 600 1 343 800 1.36 % 1.55 %12 State Street Bank & Trust 117 396 1 005 382 1 122 778 0.18 % 1.29 %13 Ingeborg Berger 725 480 330 880 1 056 360 1.10 % 1.22 %14 Mathilda A/S 600 000 150 000 750 000 0.91 % 0.86 %15 Pictet & cIE Banquiers 475 260 252 800 728 060 0.72 % 0.84 %16 AS Bemacs 314 000 198 000 512 000 0.48 % 0.59 %17 dfAInternational 407 296 407 296 0.62 % 0.47 %18 frank Mohn A/S 350 000 350 000 0.40 %19 Skagen fondene 349 700 349 700 0.53 % 0.40 %20 Storebrand Livsforsikring AS 291 382 20 000 311 382 0.44 % 0.36 %
Total 20 largest shareholders 59 482 194 18 177 094 77 659 288 90.55 % 89.50 %Other shareholders 6 208 050 2 901 610 9 109 660 9.45 % 10.50 %
Total 65 690 244 21 078 704 86 768 948 100.00 % 100.00 %International shareholders 50 553 186 8 107 869 58 661 055 76.96 % 67.61 % Own shares 1 500 000 1 811 255 3 311 255 2.28% 3.82%cost price own shares (uSd 1 000) 24 701 26 458 51 160
All own shares were acquired during 2006 and no own shares were sold during 2006. The company did not acquire or sell any own shares during 2005 or 2004.
The Annual General Meeting on 4 May 2006 authorised the Board of Directors to acquire up to 10 per cent of the Company’s share capital. This authorisation expires 4 November 2007. The purpose of purchasing own shares is to increase shareholders’ value. The Board of Directors regularly considers investments in own shares when it may be beneficial for the Company.
22PENsIoNsLIABILITIEs
The Group operates a number of defined benefit and contribution plans throughout the world. The most significant defined benefit pension plan is in Norway. The foreign plans include both defined contribution and defined benefit plans. The main benefit from the defined benefit pension plan in Norway is a pension of 66% of the final salary limited to 12G (G = indexation of the public national insurance base amount, presently G equals NOK 62 892) and a 30-year accrual period. The plan also includes survivor/dependants and disability pensions. As at 31 December 2006, the different plans had 764 members. The commitment is calculated using straight-line accrual.
The year’s pension costs: (uSd 1 000) Norway USA Netherlands 2006 Service costs 3 842 340 3 398 7 580Interest cost on accrued pension liabilities 1 794 328 1 063 3 185Estimated yield on pension assets (1 260) (355) (1 390) (3 005)Amortisation of past service cost (8) (8)Amortisation of actuarial gains/losses 517 56 573Social security tax 617 617
Total pension cost 5 510 362 3 071 8 942Actual yield on the pension assets 7.0% 12.2% 3.2%
(uSd 1 000) Norway USA Netherlands 2005 Service costs 2 973 270 2 913 6 157Interest cost on accrued pension liabilities 1 719 286 693 2 698Estimated yield on pension assets (1 298) (335) (801) (2 434)Amortisation of past service cost (4) (4)Amortisation of actuarial gains/losses 25 25Social security tax 479 479
Total pension cost 3 897 217 2 805 6 920Actual yield on the pension assets 6.5% 4.1% 3.5%
(uSd 1 000) Norway USA Netherlands 2004 Service costs 2 556 247 3 133 5 935Interest cost on accrued pension liabilities 1 583 240 788 2 611Estimated yield on pension assets (1 254) (288) (911) (2 455)Amortisation of past service cost (4) (4)Amortisation of actuarial gains/losses -Social security tax 753 753
Total pension cost 3 638 194 3 010 6 842Actual yield on the pension assets 6.2% 10.6% 4.0%
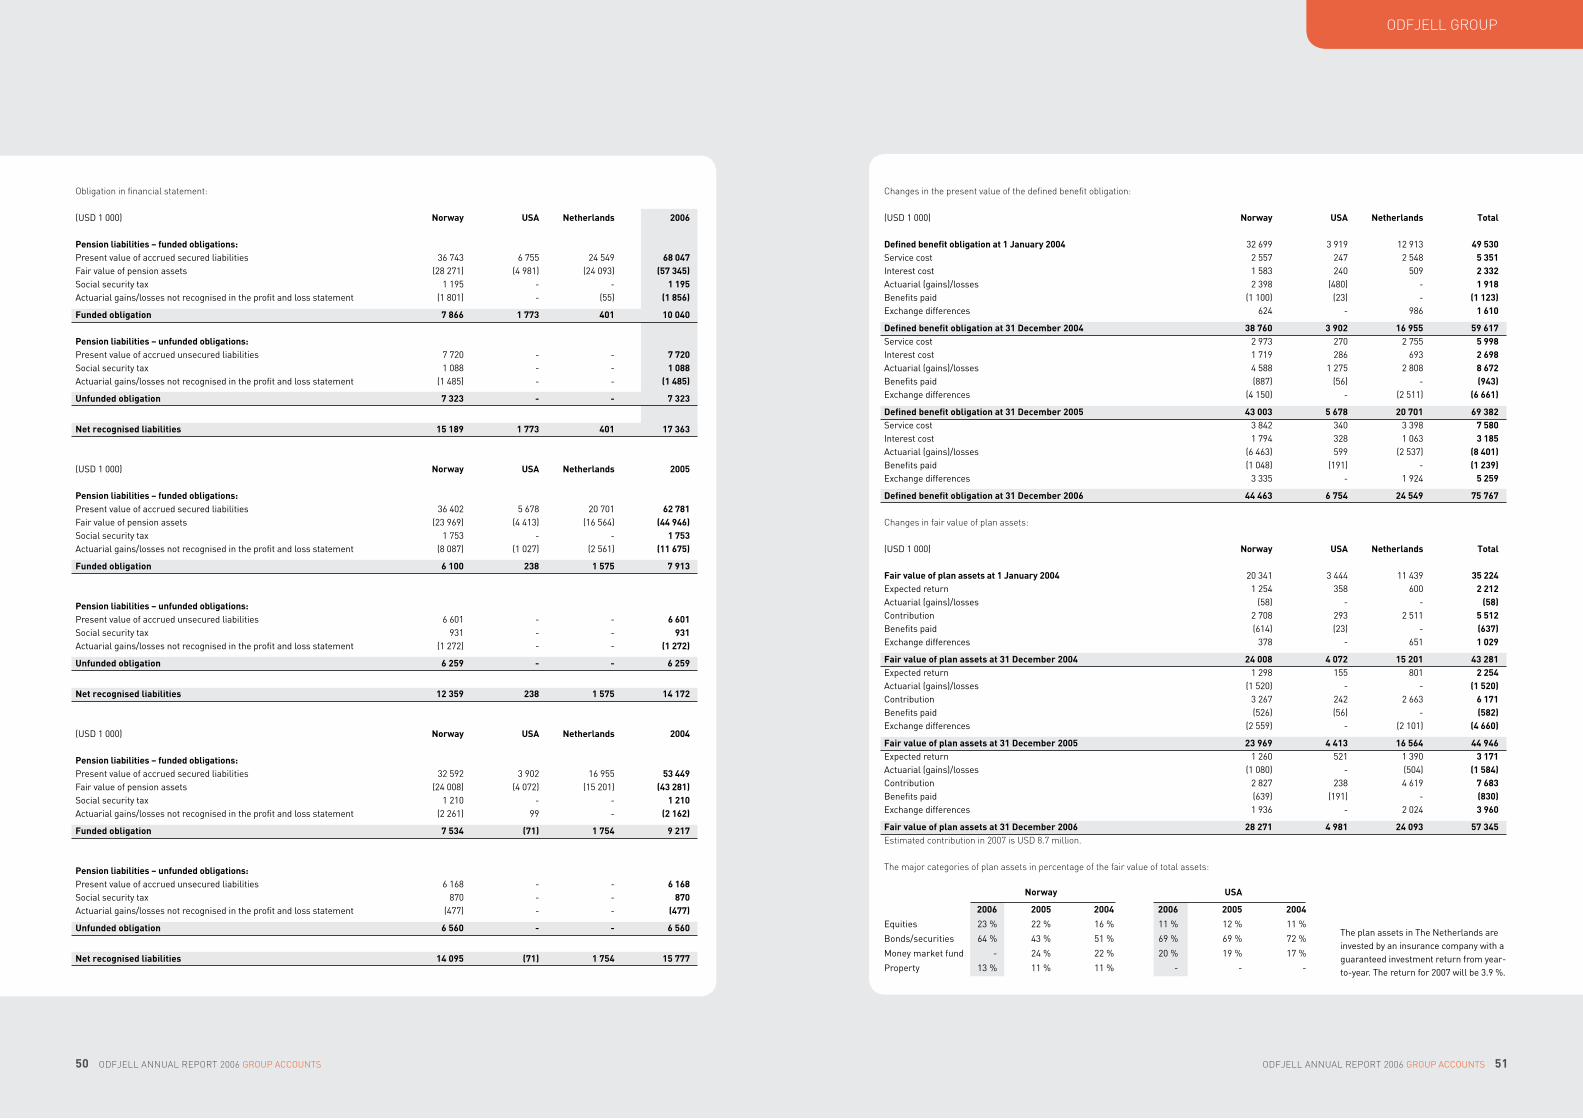
ODFJELL GROUP
50 ODFJELL ANNUAL REPORT 2006 GrOuP AccOuNTS ODFJELL ANNUAL REPORT 2006 GrOuP AccOuNTS 51
Obligation in financial statement: (uSd 1 000) Norway USA Netherlands 2006 Pension liabilities – funded obligations: Present value of accrued secured liabilities 36 743 6 755 24 549 68 047fair value of pension assets (28 271) (4 981) (24 093) (57 345)Social security tax 1 195 1 195Actuarial gains/losses not recognised in the profit and loss statement (1 801) (55) (1 856)
Funded obligation 7 866 1 773 401 10 040
Pension liabilities – unfunded obligations: Present value of accrued unsecured liabilities 7 720 7 720Social security tax 1 088 1 088Actuarial gains/losses not recognised in the profit and loss statement (1 485) (1 485)
Unfunded obligation 7 323 - - 7 323
Net recognised liabilities 15 189 1 773 401 17 363
(uSd 1 000) Norway USA Netherlands 2005 Pension liabilities – funded obligations: Present value of accrued secured liabilities 36 402 5 678 20 701 62 781fair value of pension assets (23 969) (4 413) (16 564) (44 946)Social security tax 1 753 1 753Actuarial gains/losses not recognised in the profit and loss statement (8 087) (1 027) (2 561) (11 675)
Funded obligation 6 100 238 1 575 7 913
Pension liabilities – unfunded obligations: Present value of accrued unsecured liabilities 6 601 6 601Social security tax 931 931Actuarial gains/losses not recognised in the profit and loss statement (1 272) (1 272)
Unfunded obligation 6 259 - - 6 259
Net recognised liabilities 12 359 238 1 575 14 172
(uSd 1 000) Norway USA Netherlands 2004
Pension liabilities – funded obligations: Present value of accrued secured liabilities 32 592 3 902 16 955 53 449fair value of pension assets (24 008) (4 072) (15 201) (43 281)Social security tax 1 210 1 210Actuarial gains/losses not recognised in the profit and loss statement (2 261) 99 (2 162)
Funded obligation 7 534 (71) 1 754 9 217
Pension liabilities – unfunded obligations: Present value of accrued unsecured liabilities 6 168 6 168Social security tax 870 870Actuarial gains/losses not recognised in the profit and loss statement (477) (477)
Unfunded obligation 6 560 - - 6 560
Net recognised liabilities 14 095 (71) 1 754 15 777
Changes in the present value of the defined benefit obligation: (uSd 1 000) Norway USA Netherlands Total Defined benefit obligation at 1 January 2004 32 699 3 919 12 913 49 530Service cost 2 557 247 2 548 5 351Interest cost 1 583 240 509 2 332Actuarial (gains)/losses 2 398 (480) 1 918Benefits paid (1 100) (23) (1 123)Exchange differences 624 986 1 610
Defined benefit obligation at 31 December 2004 38 760 3 902 16 955 59 617Service cost 2 973 270 2 755 5 998Interest cost 1 719 286 693 2 698Actuarial (gains)/losses 4 588 1 275 2 808 8 672Benefits paid (887) (56) (943)Exchange differences (4 150) (2 511) (6 661)
Defined benefit obligation at 31 December 2005 43 003 5 678 20 701 69 382Service cost 3 842 340 3 398 7 580Interest cost 1 794 328 1 063 3 185Actuarial (gains)/losses (6 463) 599 (2 537) (8 401)Benefits paid (1 048) (191) (1 239)Exchange differences 3 335 1 924 5 259
Defined benefit obligation at 31 December 2006 44 463 6 754 24 549 75 767
Changes in fair value of plan assets:
(uSd 1 000) Norway USA Netherlands Total Fair value of plan assets at 1 January 2004 20 341 3 444 11 439 35 224Expected return 1 254 358 600 2 212Actuarial (gains)/losses (58) (58)contribution 2 708 293 2 511 5 512Benefits paid (614) (23) (637)Exchange differences 378 651 1 029
Fair value of plan assets at 31 December 2004 24 008 4 072 15 201 43 281Expected return 1 298 155 801 2 254Actuarial (gains)/losses (1 520) (1 520)contribution 3 267 242 2 663 6 171Benefits paid (526) (56) (582)Exchange differences (2 559) (2 101) (4 660)
Fair value of plan assets at 31 December 2005 23 969 4 413 16 564 44 946Expected return 1 260 521 1 390 3 171Actuarial (gains)/losses (1 080) (504) (1 584)contribution 2 827 238 4 619 7 683Benefits paid (639) (191) (830)Exchange differences 1 936 2 024 3 960
Fair value of plan assets at 31 December 2006 28 271 4 981 24 093 57 345Estimated contribution in 2007 is USD 8.7 million.
The major categories of plan assets in percentage of the fair value of total assets:
Norway USA
2006 2005 2004 2006 2005 2004
Equities 23 % 22 % 16 % 11 % 12 % 11 %
Bonds/securities 64 % 43 % 51 % 69 % 69 % 72 %
Money market fund 24 % 22 % 20 % 19 % 17 %
Property 13 % 11 % 11 %
The plan assets in The Netherlands are invested by an insurance company with a guaranteed investment return from yeartoyear. The return for 2007 will be 3.9 %.

ODFJELL GROUP
52 ODFJELL ANNUAL REPORT 2006 GrOuP AccOuNTS ODFJELL ANNUAL REPORT 2006 GrOuP AccOuNTS 53
In calculating the net pension liabilities the following assumptions have been made:
Norway USA Netherlands
2006 2005 2004 2006 2005 2004 2006 2005 2004
discount rate 4.4% 4.0% 5.0% 6.0% 7.0% 7.0% 4.5% 4.0% 4.8%
Expected return
on assets 5.4% 5.0% 6.0% 8.0% 8.0% 7.5% 5.0% 5.0% 5.0%
Adjustment of
wages 4.5% 3.5% 3.5% 3.5% 3.5% 3.5% 2.0% 2.0% 2.0%
Pension
indexation 1.6% 3.0% 3.0% 3.5% 3.5% 3.5% 2.0% 1.5% 1.5%
GMB/v GMB/v GMB/v Mortality table K1963/Ku K1963/Ku K1963/Ku 1983 GAM 1983 GAM 1983 GAM 19952000 19952000 19952000
Expected return on assets is generally the discount rate adjusted for the effect of the allocation of plan assets. When calculating the pension liabilities in Norway mortality table K1963 has been used. We estimate that use of more updated mortality figures would increase the pension liabilities by less than 5 %.
DefinedcontributionplanSome of the Group’s foreign companies have defined contribution plans in accordance with local legislation. The defined contribution plans cover full-time employees. As at 31 December 2006, 310 members were covered by the plans. The contributions recognised as expenses equalled USD 1 047 000 and USD 918 000 in 2006 and 2005 respectively.
23INTEREsTBEARINGDEBT
The interest bearing debt is a combination of secured and unsecured debt and finance leases from major international shipping banks and bonds in the Norwegian and Singapore bond market. Interest rates are generally based on floating LIBOR-rates on less than 12 months. Fixed interest rates are for the whole loan period.
(uSd 1 000) Average interest rate 2006 2005 2004 Loans from financial institutions – floating interest rates 5.5% 612 486 620 377 710 582Loans from financial institutions – fixed interest rates 3.9% 244 754 136 833 45 874finance leases 5.4% 227 317 235 887 247 044Bonds 6.3% 213 821 49 100
Total interest bearing debt 5.3% 1 298 379 1 042 197 1 003 501Transaction cost (4 993) (4 898) (3 467)current portion of interest bearing debt (111 582) (95 558) (119 111)
Total non-current interest bearing debt 1 181 804 941 740 880 922
Average interest rate is the weighted average of interest rates, excluding hedges, as per end of 2006.
Transaction costs are deferred and charged to the profit and loss statement over the life of the underlying debt using the effective interest rate method. Dur-ing 2006 USD 0.7 mill. (USD 0.5 mill in 2005) have been charged to the profit and loss statement.
(uSd 1 000) 2006 2005 2004Book value of interest bearing debt secured by mortgages 728 934 596 600 438 182Book value of ships and terminals mortgaged 1 055 098 815 877 589 598
The interest bearing debt does not contain any restrictions on the Company’s dividend policy or financing opportunities. The interest bearing debt is gener-ally subject to certain covenants, the most restrictive of which requires that current assets, on a consolidated basis, shall at all times be equal to at least 100% of current liabilities. Other covenants include that book debt ratio (when excluding deferred taxes from the debt) shall at all times be less than 75% and that the liquidity shall always be minimum the highest of USD 50 million and 6% of interest bearing debt. The unsecured debt is subject to negative pledge on certain defined ships, but new investments may be mortgaged or leased.
Maturity of interest bearing debt as per 31.12.2006:
(uSd 1 000) 2007 2008 2009 2010 2011 2012+ Total
Loans from financial institutions
– floating interest rates 80 636 94 909 68 439 45 817 67 341 255 343 612 486
Loans from financial institutions
– fixed interest rates 22 187 22 878 23 446 21 845 21 845 132 553 244 754
finance leases 8 758 50 953 6 472 6 811 7 143 147 179 227 317
Bonds 49 100 164 721 213 821
Total interest bearing debt 111 582 217 839 98 358 74 473 261 051 535 076 1 298 379
Maturity of interest bearing debt as per 31.12.2005:
(uSd 1 000) 2006 2007 2008 2009 2010 2011+ Total
Loans from financial institutions
– floating interest rates 75 340 152 444 55 731 68 182 46 782 221 899 620 377
Loans from financial institutions
– fixed interest rates 12 041 12 041 12 018 13 951 11 627 75 156 136 833
finance leases 8 177 8 377 50 584 6 120 6 475 156 153 235 887
Bonds 49 100 49 100
Total interest bearing debt 95 558 172 861 167 432 88 253 64 884 453 208 1 042 197
Average maturity of the Group’s interest-bearing debt is about 5.9 years (4.9 years in 2005).
The net carrying amount of assets under finance leases are USD 242.7 mill. as per 31 December 2006 (USD 254.3 mill as per 31 December 2005). The lease periods vary from 10 years to 25 years from inception, and may involve a right of renewal. In addition to the rental payments, the Group has obligations relating to the maintenance of the assets and insurance as would be for a legal owner. At any time the company has the option to terminate the finance leases and become legal owner of the ship at defined termination payments. The finance leases generally do not contain provisions for payment of contingent rents. The future minimum lease payments are based on certain assumptions regarding the tax rules in the UK, including but not limited to tax rates and writing down allowances. Changes in these assumptions and the timing of them may impact the minimum lease payments. There were no such changes in 2006. Future minimum lease payments under finance leases together with the present value of the net minimum lease payments are as follows:
2006 2005
Minimum Present value Minimum Present value
lease of lease lease of lease
payments payments payments payments
Within one year 20 591 8 758 19 994 8 177
After one year but not more than five years 110 105 71 380 113 987 71 556
More than five years 233 315 147 179 250 906 156 153
Total minimum lease payments 364 011 384 888
Less amounts representing finance charges (136 694) (149 001)
Present value of minimum lease payments 227 317 227 317 235 887 235 887
NoTE24oThERNoN-CuRRENTLIABILITIEs
(uSd 1 000) 2006 2005 2004
Settlement with the uS department of Justice 16 700 25 300
Other 2 656 1 329 3 312
Total other non-current liabilities 2 656 18 029 28 612

ODFJELL GROUP
54 ODFJELL ANNUAL REPORT 2006 GrOuP AccOuNTS ODFJELL ANNUAL REPORT 2006 GrOuP AccOuNTS 55
NoTE25RIskmANAGEmENTANDhEDGINGACTIvITIEs
Odfjell’s results and cash flow are influenced by a number of variable factors. Our policy is to manage the risks we are exposed to, including, but not limited to market risk, credit risk, liquidity risk, currency risk and interest rate risk. Our strategy is to systematically monitor and understand the impact of changing market conditions on our results and cash flow and to initiate preventive actions where required. Risk management is carried out by a central treasury function. Various financial instruments are used to reduce fluctuations in results and cash flow caused by volatility in foreign exchange rates, interest rates and bunker prices.
Creditrisk The Group has no significant credit risk linked to any financial asset or individual contracting party or several other contracting parties that can be regarded as a group due to similarities in the credit risk. By using derivative financial instruments to hedge exposures to changes in exchange rates, interest rates, and fuel costs, the Company exposes itself to credit risk. Credit risk is the risk that the counterparty might fail to fulfil its performance obligations under the terms of the derivative contract. When the fair value of a derivative contract is positive, the counterparty owes the Company, which creates repayment risk for the Company. When the fair value of a deriva-tive contract is negative, the Company owes the counterparty and, therefore, does not assume repayment risk. However, to mitigate the repayment risk the Company contracts only with high quality counterparties. In addition, the Company’s hedging policy establishes maximum limits for each counterparty. The Group therefore regards its maximum risk exposure as being the carrying amount of trade receivables and other current assets (see note 18). The Group has not given any guarantees for third parties’ liabilities with the exception of guarantees as shown in note 29.
LiquidityriskThe Group’s strategy is to have sufficient liquid assets or available credit lines at any time to be sufficiently robust to withstand prolonged adverse conditions in significant risk factors, such as long term down-cycles in the markets where we operate or unfavourable conditions in financial markets. Surplus liquidity is mainly invested in listed certificates and bonds with low risk, which are actively traded.
CurrencyriskThe Group is subject to currency risk since it carries out international operations. The currency risk is calculated for each foreign currency and takes into account forecasted expenses and assets and liabilities in the currency in question. The Group enters into forward/futures contracts in order to reduce the currency risk in cash flows denominated in non-USD currencies. The Group enters into fair value hedges relating to financial assets and liabilities denominated in non-USD currencies. Investments in associated companies and subsidiaries with a non-USD currency as functional currency are generally not hedged.
operationalriskThe single largest monetary cost component affecting the time-charter earnings is bunkers. The Group enters into several types of bunker derivatives to hedge against fluctuations in the results due to changes in the bunker prices. InterestrateriskThe Group enters into several types of interest rate derivatives to hedge against fluctuations in the results due to changes in the interest level. Generally the Company enters into interest rate swaps as hedging of interest on loans and investments.
Cashflowhedges-currencyThe Group’s strategy is to estimate future expenses in non-USD currencies and to secure a net cash flow in the non-USD currency by using forward/futures contracts. All currency contracts designated as cash flow hedges are recognised at fair value. Changes in the fair value of effective hedging instruments are temporarily recognised in equity until the instruments expire and the effect is recognised in the profit and loss statement together with the transactions that the contracts are intended to hedge. Changes in the fair value of derivative instruments that do not qualify for hedge accounting are shown immediately in the profit and loss statement. This also applies to any ineffective parts of a derivative financial instrument that qualifies as a hedge.
At 31.12.2006 the Group had following currency cash flow hedges: Remaining term to maturity Currency Average Less than More than purchased exchange rate 1 year 1-5 years 5 years TotalForward/futures contracts (sale of USD) forward/futures contracts to hedge expected transactions NOK 1 000 6.44 276 806 276 806
The forecasted transactions that are hedged with forward/futures contracts are assumed to take place within the remaining term to maturity for the respective derivatives.
At 31.12.2005 the Group had following currency cash flow hedges: Remaining term to maturity Currency Average Less than More than Forward/futures contracts (sale of USD) purchased exchange rate 1 year 1-5 years 5 years Total forward/futures contracts to hedge expected transactions NOK 1 000 6.70 100 574 100 574 forward/futures contracts to hedge expected transactions Eur 1 000 1.18 3 000 3 000
The forecasted transactions that are hedged with forward/futures contracts are assumed to take place within the remaining term to maturity for the respective derivatives.
Cashflowhedges–bunkersThe Group’s strategy is to estimate future fuel oil consumption and to secure a fixed cash flow for fuel oil expenses by using forward/futures contracts. Based on the fleet employment plan and historical experience the Company can with a high degree of certainty forecast the consumption of fuel oil. Forecasted fuel oil expenses are assessed using current and historical market prices and volumes purchased in each market region. The forward purchases are based on daily quotations of prices (Platt’s index) in Rotterdam, Singapore, Houston and other relevant areas for the same quality of fuel as the Company actually buys for its ships. The Company has tested the correlation between monthly actual average purchase prices in various areas of the world and the monthly average prices used for settling the forward purchases. Maximum hedge effectiveness is ensured by hedging less than the anticipated consumption in each area. All bunker contracts are recognised at fair value.
As per 31.12.2006 the Company had purchased 90 000 tons (about 20% of estimated annual consumption) at an average price of USD 266.25 per ton. As per 31.12.2005 the Company had purchased 15 000 tons (about 4% of estimated annual consumption) at an average price of USD 263.50 per ton.
The Company’s contracts of affreightment (COAs) generally contain provisions, which partially protect the Company’s cash flow from fluctuations in bunker prices. The bunker clauses are clearly and closely related to the host contract and they are therefore not separated from the COAs and treated as an embed-ded derivative.
Cashflowhedges–interestratesThe Group has documented interest rate swaps as either cash flow hedging or non-hedging instruments. All interest rate swaps are recognised at fair value.
As of 31.12.2006 the Group held five interest rate derivatives documented as cash flow hedging. - The Company had sold one receiver swaption where the counterparty had the right to put a fixed rate of 5% on the Company and receiving floating USD 6 months LIBOR on a notional amount of USD 50 mill. Effective date was 5.2.2007 for a ten year period. - One interest swap exchange floating SGD interest rate to fixed SGD interest rate of 4.6% on a notional amount of SGD 36.4 mill, where SGD 6.4 mill. falls due within one year and SGD 30 mill. after one year but within five years.
In connection with bonds issued in Norway and Singapore the Group has three cross currency rate swaps with termination after one year but within 5 years. - Exchanging floating NOK 3 months NIBOR, currently at 3.8%, on NOK 700 mill. to floating USD 3 months LIBOR, currently at 5.4%, on USD 109.2 mill. - Exchanging floating SGD interest rate, currently at 3.5%, on SGD 110 mill. to floating USD interest rate, currently at 5.4%, on USD 71.5 mill. - Exchanging fixed SGD interest rate at 4.2% on SGD 50 mill. to floating USD interest rate, currently at 5.4%, on USD 32.5 mill.
As of 31.12.2005 the Group held three interest rate derivatives documented as cash flow hedging. - One interest swap for floating USD 6 months LIBOR to fixed rate at 5% on a notional amount of USD 80 mill. falling due after more than five years. - One interest swap for floating SGD interest rate to fixed SGD interest rate at 4.7% on a notional amount of SGD 42.8 mill, where SGD 6.4 mill. falls due within one year and SGD 31.2 mill. after one year but within five years and SGD 5.2 mill. after more than five years.
In connection with bonds issued in Norway the Group had one cross currency rate swaps with termination after one year but within 5 years. - Exchanging floating NOK 3 months NIBOR, currently at 2.5%, on NOK 300 mill. to floating USD 3 months LIBOR, currently at 4.5%, on USD 49.1 mill. with termination after one year and within 5 years.
Fairvaluehedges-currencyIn connection with bonds issued in Norway and Singapore the Group has entered into three cross currency rate swaps. At 31.12.2006 the Company was committed to deliver USD 109.2 mill. and receive NOK 700 mill. and deliver USD 104.1 mill. and receive SGD 160 mill. when the bonds expire after one year and within five years. At 31.12.2005 the Company was committed to deliver USD 49.1 mill. and receive NOK 300 mill. when the bond expires after one year and within five years. Fair value of fair value hedges are recorded in the balance sheet together with the underlying hedged items.

ODFJELL GROUP
56 ODFJELL ANNUAL REPORT 2006 GrOuP AccOuNTS ODFJELL ANNUAL REPORT 2006 GrOuP AccOuNTS 57
Fairvaluesofderivativefinancialinstruments:Derivative financial instruments are recorded on the balance at fair value. The fair value of the financial derivative instruments is the estimated amount, based upon quotations obtained from third party banks or brokers, that the Company would have received or would have had to pay if the financial instruments had been terminated or sold at the reporting date.
Fair value of interest forward rate agreements, futures contracts and interest swap agreements are based on quoted market rates at the balance sheet date. The financial institution with which the Company has entered into the contracts confirms the fair value. The fair value of derivatives stated to be hedging instruments is recognised like current assets/current liabilities.
The fair value of derivative financial instruments documented as cash flow hedges is as follows:
(USD 1 000) 31.12.2006 31.12.2005Contracts with a positive fair value currency exchange contracts 1 675
Assets on derivative financial instruments 1 675 - Contracts with a negative fair value Interest rate swaps (1 181) (1 169) currency exchange contracts (57) Bunker contracts (515) (85)
Liabilities on derivative financial instruments (1 696) (1 311)
hedgingreserverecordedinequityThe table below shows fluctuations in the hedging reserve in the equity from cash flow hedges (see Statement of changes in equity) divided between the different types of hedging contracts.
(uSd 1 000) Forward Interest interest Currency Total rate rate exchange Bunker hedging swaps agreement contracts contracts reserveIntroduction of IAS 39 on 1.1.2005: Gains/(losses) on the (new) measurement at fair value 754 2 442 25 210 28 406
Balance sheet as at 1.1.2005 754 2 442 25 210 - 28 406Fluctuations during the period: Gains/losses due to changes in fair value 563 (85) 478 Transfers to the profit and loss statement (266) (2 442) (25 267) (27 975)
Balance sheet as at 31.12.2005 1 051 - (57) (85) 909Fluctuations during the period: Gains/losses due to changes in fair value 2 922 1 436 (515) 3 843 Transfers to the profit and loss statement (257) 57 85 (115) Exchange rate differences on translating derivatives from nonuSd subsidiaries (94) (94)
Balance sheet as at 31.12.2006 3 623 - 1 436 (515) 4 544
NoTE26oThERCuRRENTLIABILITIEs
(uSd 1 000) 2006 2005 2004Trade payables 30 094 20 129 10 594Provisions 18 053 31 300 18 880Other current liabilities 86 387 95 382 85 494
Total other current liabilities 134 533 146 811 114 969
Provisions relate to customer settlements in the antitrust issue. The provisions include amounts relating to settlement agreements and offers made by the Company where an agreement has not yet been entered into. These provisions are expected to be used in 2007 and 2008. Additional provisions made during 2006 was USD 13 mill. and USD 26.3 mill. of the provisions was used. No unused amounts have been reversed during 2006.
NoTE27GovERNmENTGRANTs
Government grants from the Norwegian Maritime Directorate related to the reimbursement system for Norwegian seafarers of USD 0.9 million in 2006 (USD 1.1 mill. in 2005) is entered in the accounts as a reduction of operating expenses.
Gross revenue includes USD 1.5 million in 2006 (USD 1.3 mill. in 2005) from our Brazilian joint-venture, Flumar Transportes de Quimicos e Gases Ltda, in AFRMM (Additional Freight for the Merchant Marine Renewal), which is a freight contribution for cargoes shipped by Brazilian flag vessels on the Brazilian coast.
NoTE28TRANsACTIoNsWIThRELATEDPARTIEs
The Group has carried out various transactions with related parties. All the transactions have been carried out as part of the ordinary operations and on commercially reasonable market terms.
The Odfjell Group shares offices in Brazil with a terminalling company related to the Chairman of the Board, B. D. Odfjell. The Chairman’s family also has ownership interest in companies in South America, which acts as port agents for Odfjell as one among many customers. In addition to reimbursement of actual expenses and expenditures incurred Odfjell Seachem paid these companies USD 1.0 mill. in agency fees (USD 0.9 mill. in 2005), while Flumar Transportes de Quimicos e Gases Ltda and Odfjell Brasil – Representacoes Ltds paid USD 0.6 mill. for administrative services in 2006 (USD 0.5 mill. in 2005).
AS Rederiet Odfjell, beneficially owned by the Chairman of the Board, B. D. Odfjell, and his immediate family, rent office premises from Odfjell ASA in Bergen, for which Odfjell ASA received USD 0.1 mill. in 2006 (same as in 2005).
Transactions with related parties are settled on a regular basis and the balances as per 31.12.2006 were immaterial.
NoTE29CommITmENTs,GuARANTEEsANDCoNTINGENCIEs
operatingleasesThe Group has entered into several operating leases for ships. The leases have fixed timecharter commitment. The timecharter rate is the compensation to the ship owner covering his financial and ship operating expenses. In addition the Group has floating timecharter arrangements where payments equal the earnings generated by the ships. See note 5 for the timecharter/lease expenses.
The Group also has entered into operating leases for land, buildings and certain vehicles and items of machinery. Leases for land and buildings are generally non-cancellable and long term with remaining terms from 24 years to 33 years. Leases for certain vehicles and items of machinery have an average period of between 3 and 5 years with no renewal option in the contracts.
The operating leases do not contain any restrictions on the Company’s dividend policy or financing opportunities.
The nominal value of future rents related to the operating lease commitments fall due as follows:
(uSd 1 000) 2006 Within one year 74 692After one year but not more than five years 352 246After 5 years 404 686
Total 831 624
CapitalcommitmentsAs of 31 December 2006 the Company was committed to take delivery of one sophisticated stainless steel chemical tankers of 39 500 dwt and eight fully coated vessels of about 45 000 dwt each at a total outstanding commitment of USD 365.5 mill. These vessels are expected to be delivered from 2007 to 2011. Furthermore we have options for six more ships with deliveries from 2009 to 2013.
The Company also have capital commitments for investments in terminals in China and Korea, which will be completed in 2008 at a total outstanding amount of USD 34.8 million and in the Netherlands at a total outstanding amount of USD 36.5 million.
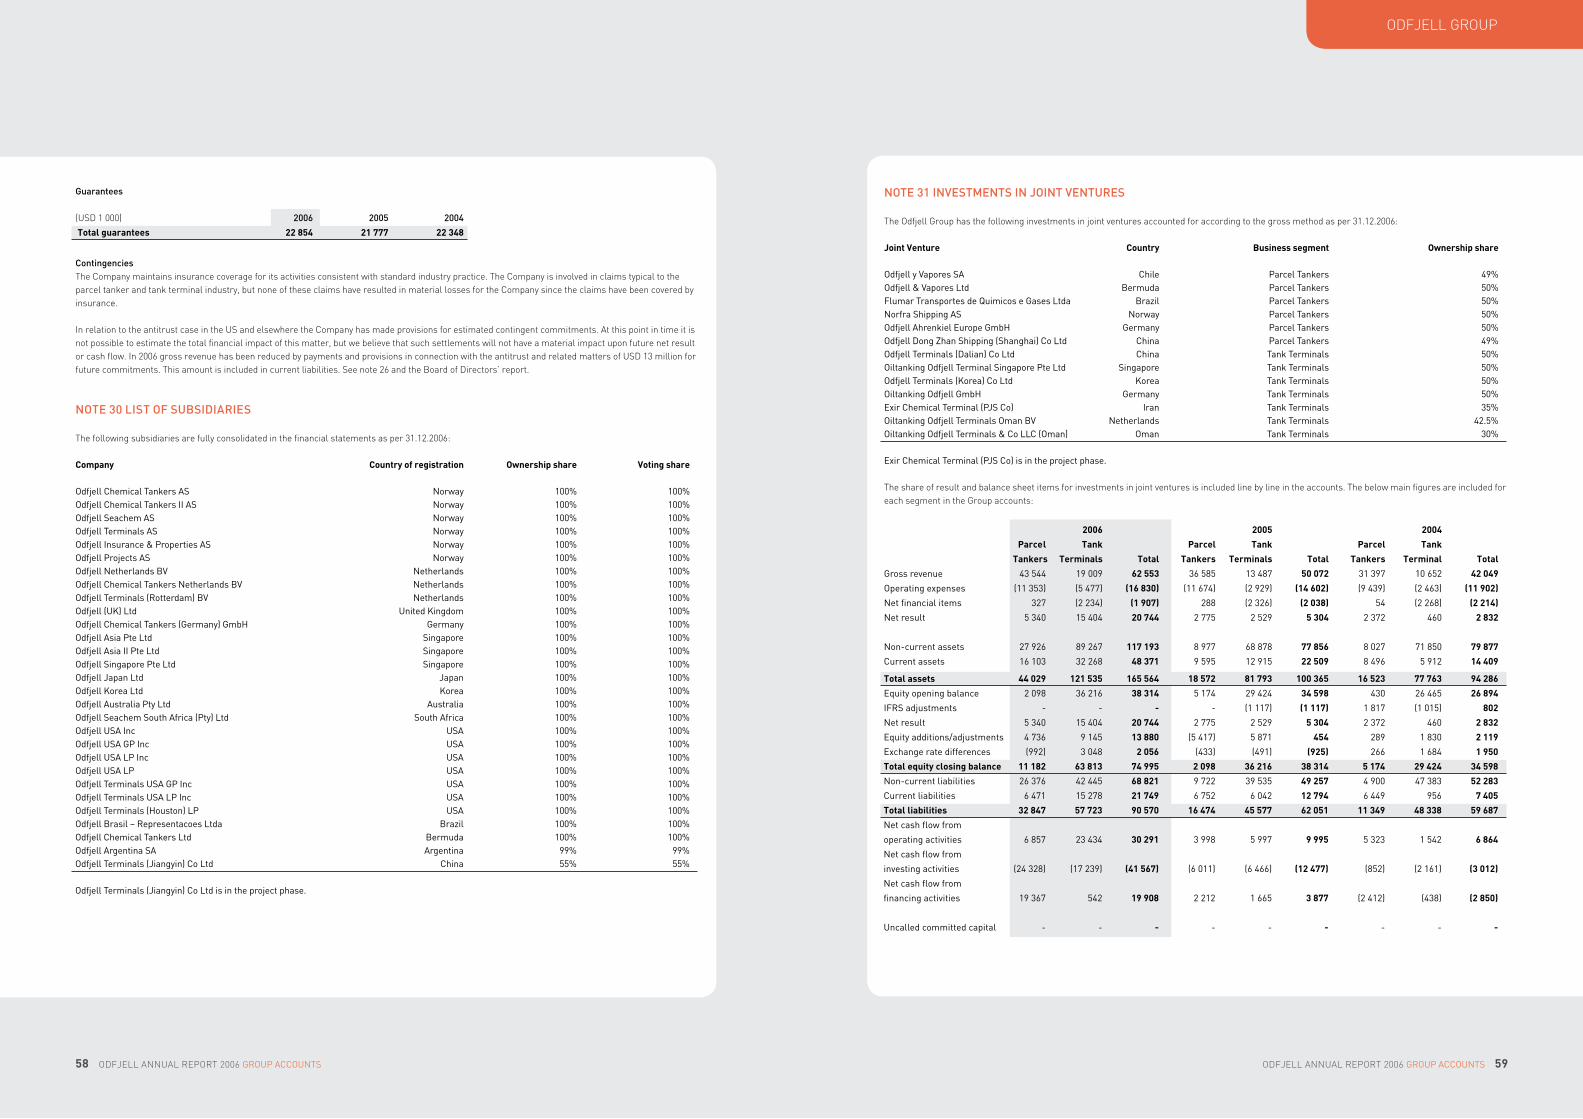
ODFJELL GROUP
58 ODFJELL ANNUAL REPORT 2006 GrOuP AccOuNTS ODFJELL ANNUAL REPORT 2006 GrOuP AccOuNTS 59
NoTE31INvEsTmENTsINJoINTvENTuREs
The Odfjell Group has the following investments in joint ventures accounted for according to the gross method as per 31.12.2006: Joint Venture Country Business segment Ownership share
Odfjell y vapores SA chile Parcel Tankers 49%Odfjell & vapores Ltd Bermuda Parcel Tankers 50%flumar Transportes de Quimicos e Gases Ltda Brazil Parcel Tankers 50%Norfra Shipping AS Norway Parcel Tankers 50%Odfjell Ahrenkiel Europe GmbH Germany Parcel Tankers 50%Odfjell dong Zhan Shipping (Shanghai) co Ltd china Parcel Tankers 49%Odfjell Terminals (dalian) co Ltd china Tank Terminals 50%Oiltanking Odfjell Terminal Singapore Pte Ltd Singapore Tank Terminals 50%Odfjell Terminals (Korea) co Ltd Korea Tank Terminals 50%Oiltanking Odfjell GmbH Germany Tank Terminals 50%Exir chemical Terminal (PJS co) Iran Tank Terminals 35%Oiltanking Odfjell Terminals Oman Bv Netherlands Tank Terminals 42.5%Oiltanking Odfjell Terminals & co LLc (Oman) Oman Tank Terminals 30%
Exir chemical Terminal (PJS co) is in the project phase. The share of result and balance sheet items for investments in joint ventures is included line by line in the accounts. The below main figures are included for each segment in the Group accounts:
2006 2005 2004
Parce l Tank Parcel Tank Parcel Tank
Tankers Terminals Total Tankers Terminals Total Tankers Terminal Total
Gross revenue 43 544 19 009 62 553 36 585 13 487 50 072 31 397 10 652 42 049
Operating expenses (11 353) (5 477) (16 830) (11 674) (2 929) (14 602) (9 439) (2 463) (11 902)
Net financial items 327 (2 234) (1 907) 288 (2 326) (2 038) 54 (2 268) (2 214)
Net result 5 340 15 404 20 744 2 775 2 529 5 304 2 372 460 2 832
Noncurrent assets 27 926 89 267 117 193 8 977 68 878 77 856 8 027 71 850 79 877
current assets 16 103 32 268 48 371 9 595 12 915 22 509 8 496 5 912 14 409
Total assets 44 029 121 535 165 564 18 572 81 793 100 365 16 523 77 763 94 286
Equity opening balance 2 098 36 216 38 314 5 174 29 424 34 598 430 26 465 26 894
IfrS adjustments - (1 117) (1 117) 1 817 (1 015) 802
Net result 5 340 15 404 20 744 2 775 2 529 5 304 2 372 460 2 832
Equity additions/adjustments 4 736 9 145 13 880 (5 417) 5 871 454 289 1 830 2 119
Exchange rate differences (992) 3 048 2 056 (433) (491) (925) 266 1 684 1 950
Total equity closing balance 11 182 63 813 74 995 2 098 36 216 38 314 5 174 29 424 34 598
Noncurrent liabilities 26 376 42 445 68 821 9 722 39 535 49 257 4 900 47 383 52 283
current liabilities 6 471 15 278 21 749 6 752 6 042 12 794 6 449 956 7 405
Total liabilities 32 847 57 723 90 570 16 474 45 577 62 051 11 349 48 338 59 687
Net cash flow from
operating activities 6 857 23 434 30 291 3 998 5 997 9 995 5 323 1 542 6 864
Net cash flow from
investing activities (24 328) (17 239) (41 567) (6 011) (6 466) (12 477) (852) (2 161) (3 012)
Net cash flow from
financing activities 19 367 542 19 908 2 212 1 665 3 877 (2 412) (438) (2 850)
uncalled committed capital - - -
Guarantees
(USD 1 000) 2006 2005 2004
Total guarantees 22 854 21 777 22 348
ContingenciesThe Company maintains insurance coverage for its activities consistent with standard industry practice. The Company is involved in claims typical to the parcel tanker and tank terminal industry, but none of these claims have resulted in material losses for the Company since the claims have been covered by insurance.
In relation to the antitrust case in the US and elsewhere the Company has made provisions for estimated contingent commitments. At this point in time it is not possible to estimate the total financial impact of this matter, but we believe that such settlements will not have a material impact upon future net result or cash flow. In 2006 gross revenue has been reduced by payments and provisions in connection with the antitrust and related matters of USD 13 million for future commitments. This amount is included in current liabilities. See note 26 and the Board of Directors’ report.
NoTE30LIsToFsuBsIDIARIEs
The following subsidiaries are fully consolidated in the financial statements as per 31.12.2006:
Company Country of registration Ownership share Voting share
Odfjell chemical Tankers AS Norway 100% 100%Odfjell chemical Tankers II AS Norway 100% 100%Odfjell Seachem AS Norway 100% 100%Odfjell Terminals AS Norway 100% 100%Odfjell Insurance & Properties AS Norway 100% 100%Odfjell Projects AS Norway 100% 100%Odfjell Netherlands Bv Netherlands 100% 100%Odfjell chemical Tankers Netherlands Bv Netherlands 100% 100%Odfjell Terminals (rotterdam) Bv Netherlands 100% 100%Odfjell (uK) Ltd united Kingdom 100% 100%Odfjell chemical Tankers (Germany) GmbH Germany 100% 100%Odfjell Asia Pte Ltd Singapore 100% 100%Odfjell Asia II Pte Ltd Singapore 100% 100%Odfjell Singapore Pte Ltd Singapore 100% 100%Odfjell Japan Ltd Japan 100% 100%Odfjell Korea Ltd Korea 100% 100%Odfjell Australia Pty Ltd Australia 100% 100%Odfjell Seachem South Africa (Pty) Ltd South Africa 100% 100%Odfjell uSA Inc uSA 100% 100%Odfjell uSA GP Inc uSA 100% 100%Odfjell uSA LP Inc uSA 100% 100%Odfjell uSA LP uSA 100% 100%Odfjell Terminals uSA GP Inc uSA 100% 100%Odfjell Terminals uSA LP Inc uSA 100% 100%Odfjell Terminals (Houston) LP uSA 100% 100%Odfjell Brasil – representacoes Ltda Brazil 100% 100%Odfjell chemical Tankers Ltd Bermuda 100% 100%Odfjell Argentina SA Argentina 99% 99%Odfjell Terminals (Jiangyin) co Ltd china 55% 55% Odfjell Terminals (Jiangyin) co Ltd is in the project phase.
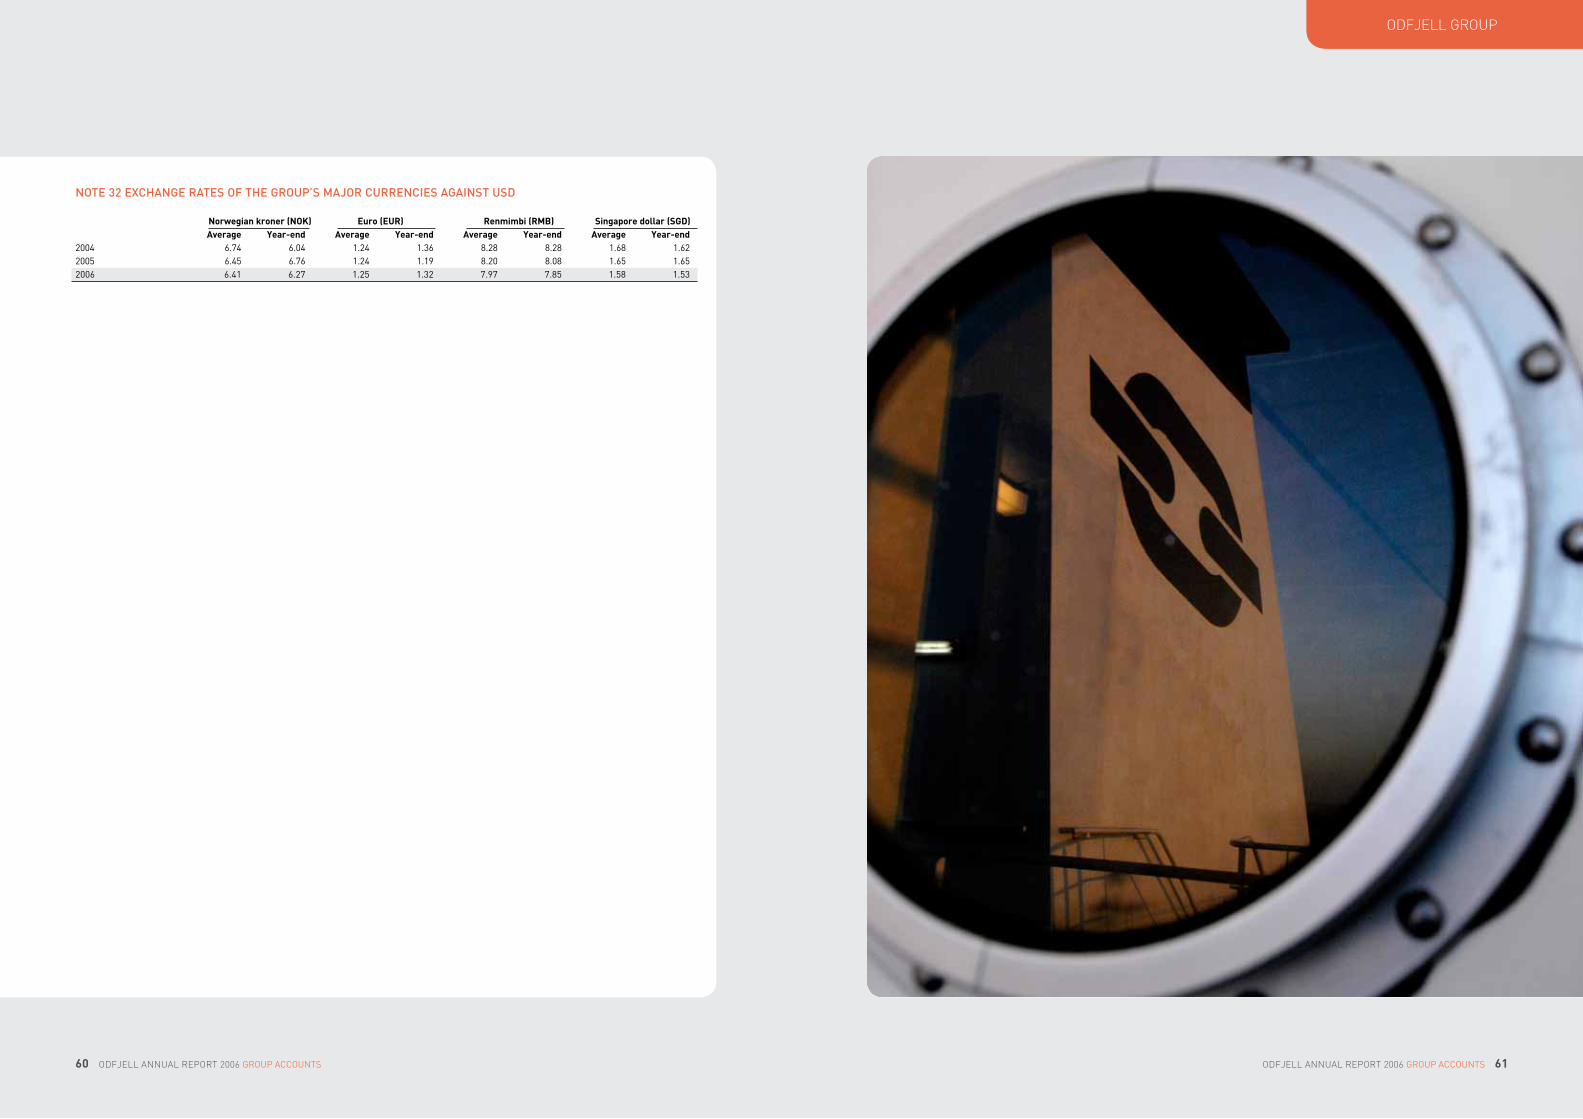
s
NoTE32EXChANGERATEsoFThEGRouP’smAJoRCuRRENCIEsAGAINsTusD
Norwegian kroner (NOK) Euro (EUR) Renmimbi (RMB) Singapore dollar (SGD) Average Year-end Average Year-end Average Year-end Average Year-end2004 6.74 6.04 1.24 1.36 8.28 8.28 1.68 1.622005 6.45 6.76 1.24 1.19 8.20 8.08 1.65 1.652006 6.41 6.27 1.25 1.32 7.97 7.85 1.58 1.53
ODFJELL GROUP
60 ODFJELL ANNUAL REPORT 2006 GrOuP AccOuNTS ODFJELL ANNUAL REPORT 2006 GrOuP AccOuNTS 61

62 ODFJELL ANNUAL REPORT 2006 ODFJELL ANNUAL REPORT 2006 63
s
ODFJELL ASA
62 ODFJELL ANNUAL REPORT 2006 PArENT cOMPANy AccOuNTS ODFJELL ANNUAL REPORT 2006 PArENT cOMPANy AccOuNTS 63
Bergen, 6 March 2007
ThEBoARDoFDIRECToRs
oFoDFJELLAsA
B.D. Odfjell
CHAIRMAN
Peter G. Livanos
Reidar Lien
Marianna Moschou
Stein Pettersen
Laurence W.Odfjell
Terje Storeng
President/CEO
AssETsAsPER31.12.
(NOK 1 000) Note 2006 2005 2004
FIXED ASSETSdeferred tax assets 9 80 682 real estate 4, 11 102 797 95 674 68 365 Newbuilding contracts 4, 11, 20 393 157 656 874 245 930 Office equipment and cars 4, 11 22 791 21 353 26 153 Shares in subsidiaries 7 2 413 203 2 413 203 2 161 319 Other shares 7 219 795 198 445 218 633 Loans to group companies 12,13 4 193 723 3 797 858 3 260 899 Other longterm receivables 13 9 455 8 222 12 572 Total fixed assets 7 354 921 7 191 630 6 074 552
CURRENT ASSETSShortterm receivables 107 768 42 447 16 096 Group receivables 805 904 565 044 124 570 Inventory 6 912 6 117 5 872 Availableforsale investments 14 108 275 151 329 Bonds and certificates 302 800 cash and bank deposits 15 211 429 43 695 242 589 Total current assets 1 240 288 808 633 691 928
Total assets 8 595 209 8 000 263 6 766 480
LIABILITIEsANDshAREhoLDERs’EQuITYAsPER31.12.
(NOK 1 000) Note 2006 2005 2004
PAID IN EQUITYShare capital 10, 16 216 922 216 922 216 922 Own shares 10, 16 (8 278) Share premium 10 473 905 973 905 973 905 Total paid in equity 682 550 1 190 828 1 190 828
RETAINED EARNINGSOther equity 10 965 674 646 303 703 354 Total retained earnings 965 674 646 303 703 354
Total shareholders’ equity 1 648 224 1 837 131 1 894 181
LONG-TERM LIABILITIESPension liabilities 17 95 217 83 560 85 189 Loans from subsidiaries 13 1 352 369 1 165 315 402 217 Longterm debt 13 4 293 748 4 194 267 3 239 228 Total long-term liabilities 5 741 335 5 443 141 3 726 634
CURRENT LIABILITIESTaxes payable 2 939 2 939 2 939 Employee taxes payable 27 045 36 626 33 397 dividend payable 260 307 173 538 Other shortterm liabilities 297 612 366 898 239 333 Loans from subsidiaries 617 749 313 528 696 458
Total current liabilities 1 205 651 719 991 1 145 664
Total liabilities 6 946 986 6 163 132 4 872 299
Total liabilities and shareholders’ equity 8 595 209 8 000 263 6 766 480
Guarantees 18 2 592 087 2 766 674 2 792 516
PRoFITANDLosssTATEmENT
(NOK 1 000) Note 2006 2005 2004
oPERATINGREvENuE(EXPENsEs)Gross revenue 2 321 089 211 810 240 126 Operating expenses (2 501) General and administrative expenses 3, 19 (300 234) (208 913) (248 116)Other income (expenses) 5 (24 091) (224 201) (139 473)depreciation 4 (19 043) (16 468) (15 210)Gain (loss) on sale of fixed assets 276 30 704 Operating result (EBIT) (22 003) (209 569) (162 673)
FINANCIALINComE(EXPENsEs)Income on investment in subsidiaries 6 841 604 524 182 55 263 Interest income 6 212 396 157 537 74 061 changes in the value of financial fixed assets 6,7 40 000 34 000 Interest expenses 6 (261 428) (167 788) (143 426)Other financial items 6 (2 739) (9 616) (3 857)currency gains (losses) 8 114 196 (91 568) 17 852 Net financial items 904 028 452 746 33 893
Result before taxes 882 026 243 177 (128 780)
Taxes 9 (83 306) 44 609 Net result 882 026 159 871 (84 171)
Proposed dividend 10 (260 306) (173 538)

ODFJELL ASA
CAshFLoWsTATEmENT
(NOK 1 000) 2006 2005 2004
CAshFLoWFRomoPERATINGACTIvITIEsNet result before taxes 882 026 243 177 (128 780)Taxes paid (2 624) capital (gain) loss on fixed assets ( 276) (30 704) 108 depreciation 19 043 16 468 15 210 changes in the value of financial fixed assets (40 000) (34 000)Inventory (increase) decrease ( 795) (245) (902)Trade creditors increase (decrease) (5 127) (12 759) 24 959 difference in pension cost and pension premium paid 11 657 (1 197) (13)Exchange rate fluctuations (183 215) (91 725) 314 737 dividends classified as investing activities (144 786) (524 182) (55 263)Other shortterm accruals (75 276) (161 103) 106 853
Net cash flow from operating activities 503 251 (604 893) 242 909
CAshFLoWFRomINvEsTINGACTIvITIEsSale of fixed assets 1 028 225 711 1 355 Investment in fixed assets (792 779) (450 633) (272 083)Investment in subsidiaries and other shares (21 350) (279 271) (67 150)Share capital repaid from subsidiaries 1 027 877 received dividend 144 786 524 182 55 263 Availableforsale investments 43 054 (151 329) Sale of shares in subsidiaries/joint ventures 118 540 changes in longterm receivables (1 233) 6 648 16 Loans to subsidiaries (390 216) 274 353 (211 573)
Net cash flow from investing activities 10 486 43 200 533 704
CAshFLoWFRomFINANCINGACTIvITIEsNew longterm debt 1 480 559 2 337 716 2 194 518 Payment of longterm debt (1 038 379) (1 900 321) (2 638 528) Share repurchases (343 419) dividend (467 208) (390 460) (347 076)
Net cash flow from financing activities (368 446) 46 934 (791 086)
Effect on cash balances from currency exchange rate fluctuations 22 444 13 065 (38 561)
Net change in cash balances 167 734 (501 694) (53 034)
cash balances as per 1.1 43 695 545 389 598 423
Cash balances as per 31.12 211 429 43 695 545 389
Available credit facilities 94 034
64 ODFJELL ANNUAL REPORT 2006 PArENT cOMPANy AccOuNTS ODFJELL ANNUAL REPORT 2006 PArENT cOMPANy AccOuNTS 65
1ACCouNTINGPRINCIPLEs
All items in the financial statements have been reported, valued and accounted for in accordance with the Accounting Act and generally accepted accounting principles in Norway.
A.ClassificationofbalancesheetitemsAssets and liabilities related to the operation of the company are classified as current assets and liabilities. Assets for long-term use are classified as fixed assets. First year instalment of debt is included in long-term debt.
B.PensionandaccruedpensionliabilitiesThe present value of the pension liabilities under defined benefit pension plans has been calculated based on actuarial principles. The present value of the pension liabilities and the pension plan assets is included under long-term liabilities and long-term assets. Pension liabilities are mainly insured with life insurance companies. Unfunded pension liabili-ties are calculated and included in the pension liabilities. The change in net pension liabilities is expensed in the profit and loss account. The effect of changes in estimates exceeding 10% of the highest of pension liabilities and plan assets is accounted for. Such changes are amortised over the remaining vesting period.
C.DebtissuanceexpensesDebt issuance expenses are amortised over the loan period.
D.TaxesanddeferredtaxliabilitiesTaxes are calculated based on the financial result and consist of taxes payable and deferred taxes. The basis for deferred taxes is the temporary difference between the financial result and the taxable result. Deferred taxes are estimated based on a nominal value calculation.
E.CurrentassetsCurrent assets are valued at the lower of historical cost and market value.
F.ForeigncurrencyCurrent assets, long-term receivables and liabilities in non-NOK currencies are valued at the year-end exchange rate.
G.FixedassetsFixed assets are stated at historical cost, which includes purchase price, capitalised interest and other costs directly
related to the investment, less accumulated depreciation and write-down. Fixed assets are depreciated straight-line over their estimated useful lives. The preliminary Norwegian accounting standard concerning impairment of fixed assets, equivalent to IAS 36, states that if the Recoverable Amount is lower than the book value, impairment has occurred and the asset shall be revaluated. The Recoverable Amount is the highest of the fair market value of the asset and the net present value (NPV) of future estimated cash flow from the employment of the asset (“value in use”). The NPV is based on an interest rate according to a weighted average cost of capital (WACC). The WACC reflects the company’s long term borrowing rate and a risk free rate plus a risk premium for the equity. We have made the following assumptions when calculating the “value in use” for material assets: sharesinsubsidiariesandothershares:An impairment occurs if the book value of shares is higher than the equity in the cor-responding company when the assets and liabilities have been adjusted to reflect the Recoverable Amount as defined above.
h.NewbuildingcontractsNewbuilding contracts include payments made under the contracts, capitalised interest and other costs directly associated with the newbuilding program.
I.CashflowstatementThe cash flow statement is prepared using the indirect method. Cash balances include cash and cash equivalents such as cash in hand and in bank, deposits held at call with banks and other short-term highly liquid investments with short maturities of three months or less from the date of acquisition. The cash and cash equivalents amount in the cash flow statement does not include available credit facilities.
J.FinancialinvestmentsFinancial investments have been classified into trading, held-to-maturity and available-for-sale categories. The classification is dependent on the purpose for which the investments were acquired. Financial investments with less than 12 months to maturity or if they are being regularly traded are classified as current assets, otherwise as fixed assets.
k.FinancialinstrumentsThe company uses various financial
instruments to reduce fluctuations in earnings and cash flow caused by volatility in foreign exchange rates and interest rates. The following accounting principles apply for such financial instruments: Foreigncurrencyinstruments:The result of currency hedging transactions is accounted for in the period when the hedged cash flow items are accounted for. The result of currency hedging transactions have been accounted for with the underlying hedged exposure in the profit and loss statement. Interestrateinstruments:The result of interest rate hedging transactions is accounted for as an increase or decrease of interest expenses in the period when the hedged cash flow items are accounted for.
L.ActivitiesunderjointcontrolOur share of activities under joint control is, in the accounts of Odfjell ASA, based on the Cost Method.
m.RelatedpartiesIn the normal course of the conduct of its business, Odfjell enters into a number of transactions with related parties. The company considers these arrangements to be on commercially reasonable market terms. See note 19 for information about related party transactions.
N.ContingentassetsandliabilitiesProvisions are made for contingent losses that are probable and quantifiable. Provisions are based on best estimates. Contingent gains are not accounted for.
Notes to the Parent Company Financial Statement

ODFJELL ASA
66 ODFJELL ANNUAL REPORT 2006 PArENT cOMPANy AccOuNTS ODFJELL ANNUAL REPORT 2006 PArENT cOMPANy AccOuNTS 67
2GRossREvENuE
Gross revenue is related to services performed for other Odfjell Group companies.
3sALARIEs,NumBERoFEmPLoYEEs,BENEFITsToBoARDoFDIRECToRs,PREsIDENT/CEoANDmANAGERsREPoRTINGDIRECTLYTohImANDAuDIToR’sREmuNERATIoN
(NOK 1 000)
Salaries and other employee expenses: 2006 2005 2004
Salaries 143 763 122 856 151 306 Social expenses 22 104 22 138 27 046 Pension cost 31 361 23 006 21 657 Other benefits 4 516 4 888 4 806 Total salary expenses 201 745 172 889 204 816
Average number of manlabour years 211 204 196
The salary expenses include bonus payment to employees of NOK 10.8 mill. in 2006 (NOK 8.7 mill. in 2005). Bonus paid in 2006 was decided by the Board in February 2006 relating to the 2005 results. Total salary expenses are included in General and administrative expenses.
In 2006 the company introduced a performance-related incentive pay scheme for all employees at Odfjell Headquarters, overseas offices and sea officers. The purpose is to motivate, encourage and stimulate to focus on bottom line result. Total achievable bonus ranges depending on job category and market competition. The bonus is based on predefined targets for a combination of the Odfjell Group result, key performance indicators and individual performance. No payments were made under this scheme for 2006. The Board reviews the application of the system from year to year and has approved the same scheme for 2007.
Compensation and benefit to Board of Directors in 2006: Compensation Other benefits TotalB.d. Odfjell 1 278 17 1 294 Laurence W. Odfjell 200 200 Peter G. Livanos - Marianna Moschou 200 200 Stein Pettersen 200 200 reidar Lien 225 225 Terje Storeng (until May 2006) 200 200
Total 2 303 17 2 319
Compensation and benefits to the President/CEO and managers reporting directly to him in 2006: Salary Bonus Pension cost Other benefits TotalPresident/cEO, Terje Storeng 2 789 604 432 162 3 986 President Parcel Tankers and Terminals, Jan A. Hammer 2 096 595 171 181 3 042 Senior vice President Tank Terminals, Svein Gustav Steimler (2 months) 404 31 435 President Ship Management, Trygve Arnesen (7 months) 1 030 485 116 74 1 705 President Ship Management, Helge Olsen (5 months) 478 158 59 694 Senior vice President/cfO, Haakon ringdal 1 383 290 200 128 2 002 Senior vice President corporate Investments, Tore Jakobsen 1 482 112 165 135 1 893 Senior vice President Quality Management, Jan didrik Lorentz 1 181 496 166 1 843 Senior vice President Asia, Atle Knutsen 1 558 390 390 469 2 808 vice President, Human resources, Brit A. Bennett 1 028 73 316 113 1 530
Total 13 428 2 548 2 445 1 518 19 939
The President/CEO is entitled to two years salary if the company terminates the employment prior to the age of 60. As from the age of 60 both the President/CEO and the company have the right to terminate the employment with 12 months notice, however the President/CEO has the right to resign and enter into a fixed consultancy agreement, remunerated at 50% of the preceding year’s fixed salary. The President/CEO and managers reporting directly to him is included in the company’s defined benefit pension plan, see note 17. The company also funded pension obligations related to the President/CEO and managers reporting directly to him for salaries exceeding 12G (presently 12G equals NOK 754 704), up to 66% of 18G. This arrangement was terminated as from 1.1.2007.
The company does not have any stock option plans.
Auditors remuneration for: (NOK 1 000 exclusive vAT) 2006 2005 2004Statutory auditing 1 365 974 833 Other assurance services 54 19 22 Tax advisory services 1 082 994 758 Nonaudit services 1 128 690 269
Total remuneration 3 629 2 678 1 881
4FIXEDAssETs
(NOK 1 000)
Accumulated Cost Sale depreciation Depreciation Book value 1.1.2006 Investment book value prior years this year 31.12.2006
real estate 128 022 13 907 (62) (32 348) (6 723) 102 797 Newbuilding contracts 656 874 761 898 (1 025 615) 393 157 Office equipment and cars 52 971 16 974 (3 216) (31 618) (12 320) 22 791 Total 837 867 792 779 (1 028 893) (63 966) (19 043) 518 745 Depreciationperiods:
real estate: 50 years; office equipment and cars: 315 years.
5oThERINComE(EXPENsEs)
Other income (expenses) include payments, provisions and reversal of unused provisions in connection with the antitrust case and related matters of NOK 24 million in 2006 and NOK 224 million in 2005.
6FINANCIALINComEANDEXPENsEs
(NOK 1 000) 2006 2005 2004
Income on investment in subsidiaries 841 604 524 182 55 263 Intercompany interest income 198 965 141 463 63 541 Other interest income 13 431 16 073 10 520 Other financial income 193 3 180 changes in the value of financial fixed assets 40 000 34 000
Total financial income 1 054 000 721 911 166 503
Intercompany interest expenses 65 818 40 275 35 118 Other interest expenses 195 610 127 513 108 308 Other financial expenses 2 739 9 808 7 037
Total financial expenses 264 167 177 596 150 463

ODFJELL ASA
68 ODFJELL ANNUAL REPORT 2006 PArENT cOMPANy AccOuNTS ODFJELL ANNUAL REPORT 2006 PArENT cOMPANy AccOuNTS 69
7shAREs
(NOK 1 000)
Subsidiaries and activities under joint control are included in the parent company accounts based on the Cost Method.
(NOK 1 000) Registered Share/ BookSubsidiaries office voting rights value
Odfjell chemical Tankers AS Norway 100 % 130 094 Odfjell chemical Tankers II AS Norway 100 % 353 164 Odfjell Seachem AS Norway 100 % 261 522 Odfjell Terminals AS Norway 100 % 175 000 Odfjell Insurance & Properties AS Norway 100 % 6 050 Odfjell Projects AS Norway 100 % 100 Odfjell Asia Pte Ltd Singapore 100 % 217 040 Odfjell Singapore Pte Ltd Singapore 100 % 83 Odfjell uSA Inc uSA 100 % 177 972 Odfjell Netherlands Bv Netherlands 100 % 6 581 Odfjell chemical Tankers Netherlands Bv Netherlands 100 % 731 Odfjell chemical Tankers (Germany) GmbH Germany 100 % 263 640 Odfjell Japan Ltd Japan 100 % Odfjell Korea Ltd Korea 100 % 306 Odfjell Seachem South Africa (Pty) Ltd South Africa 100 % Odfjell Brasil representacoes Ltda Brazil 100 % 10 702 Odfjell chemical Tankers Ltd Bermuda 100 % 810 089 Odfjell Argentina SA Argentina 99 % 129
Total 2 413 203
Wholly-owned companies held indirectly through subsidiaries: Odfjell Asia II Pte Ltd, Odfjell USA GP Inc, Odfjell USA LP Inc, Odfjell USA LP, Odfjell Terminals USA GP Inc, Odfjell Terminals USA LP Inc, Odfjell Terminals (Houston) LP, Odfjell Terminals (Rotterdam) BV, Odfjell (UK) Ltd and Odfjell Australia Pty Ltd. The company Odfjell Argentina SA is directly and indirectly 100% owned by Odfjell ASA.
Other shares
Norfra Shipping AS Norway 50 % 23 655 Odfjell Ahrenkiel Europe GmbH Germany 50 % 2 053 Oiltanking Odfjell Terminal Singapore Pte Ltd Singapore 50 % 105 903 Odfjell & vapores Ltd Bermuda 50 % 38 Odfjell y vapores S A chile 49 % 45 795 Odfjell Terminals (dalian) co Ltd china 50 % 3 792 Odfjell dong Zhan Shipping (Shanghai) co Ltd china 49 % 31 095 v.O.Tank Terminal Ningbo Ltd china 12.5 % 7 463
Total 219 795
The companies Flumar Transportes de Quimicos e Gases Ltda, Brazil and Odfjell Terminals (Korea) Co Ltd are indirectly 50% owned by Odfjell ASA. Odfjell Terminal (Jiangyin) Ltd and Exir Chemical Terminal (PJSC) are indirectly owned 55% and 35% respectively by Odfjell ASA. Oiltanking Odfjell TerminalsOman BV is indirectly owned 30% by Odfjell ASA. Part of impairment on shares in Odfjell Chemical Tankers II AS from 2003 was reversed in 2004 and 2005. Otherwise there was no impairment necessary as Recoverable Amounts were higher than book values.
8CuRRENCYGAINs(LossEs)
(NOK 1 000) 2006 2005 2004
currency hedging contracts 12 048 4 680 (60 521)Longterm receivables and debt 28 579 (201 455) 70 049 cash and cash equivalents 22 444 13 065 (38 561)Other current assets and current liabilities 51 125 92 141 46 885
Total currency gains (losses) 114 196 (91 568) 17 852
9TAXEs
(NOK 1 000)Taxes: 2006 2005 2004
change in deferred tax ordinary items (80 682) (44 609)foreign tax (2 624)
Total tax expenses - (83 306) (44 609)
Taxes payable: 2006 2005 2004
Net result before taxes 882 026 243 177 (128 780)Permanent differences (421 741) (512 837) 3 449 changes temporary differences (78 939) 35 312 (9 327)used taxloss carried forward (381 346)
Basis taxes payable - (234 348) (134 658)
Specification of deferred taxes (deferred tax assets): 2006 2005 2004
fixed assets (20 628) (14 720) (10 013)Pension fund (liabilities) (95 217) (83 560) (85 189)Provisions (115 195) (211 773) (99 572)Other longterm temporary differences 5 448 (21 633) 83 271 Taxloss carried forward (29 647) (410 993) (176 645)Adjustments related to earlier years 6 736 Temporary differences not accounted for 248 504 742 679
Net temporary differences - - (288 148)
Tax rate 28 % 28 % 28 %
Total deferred tax (deferred tax assets) - - (80 682)
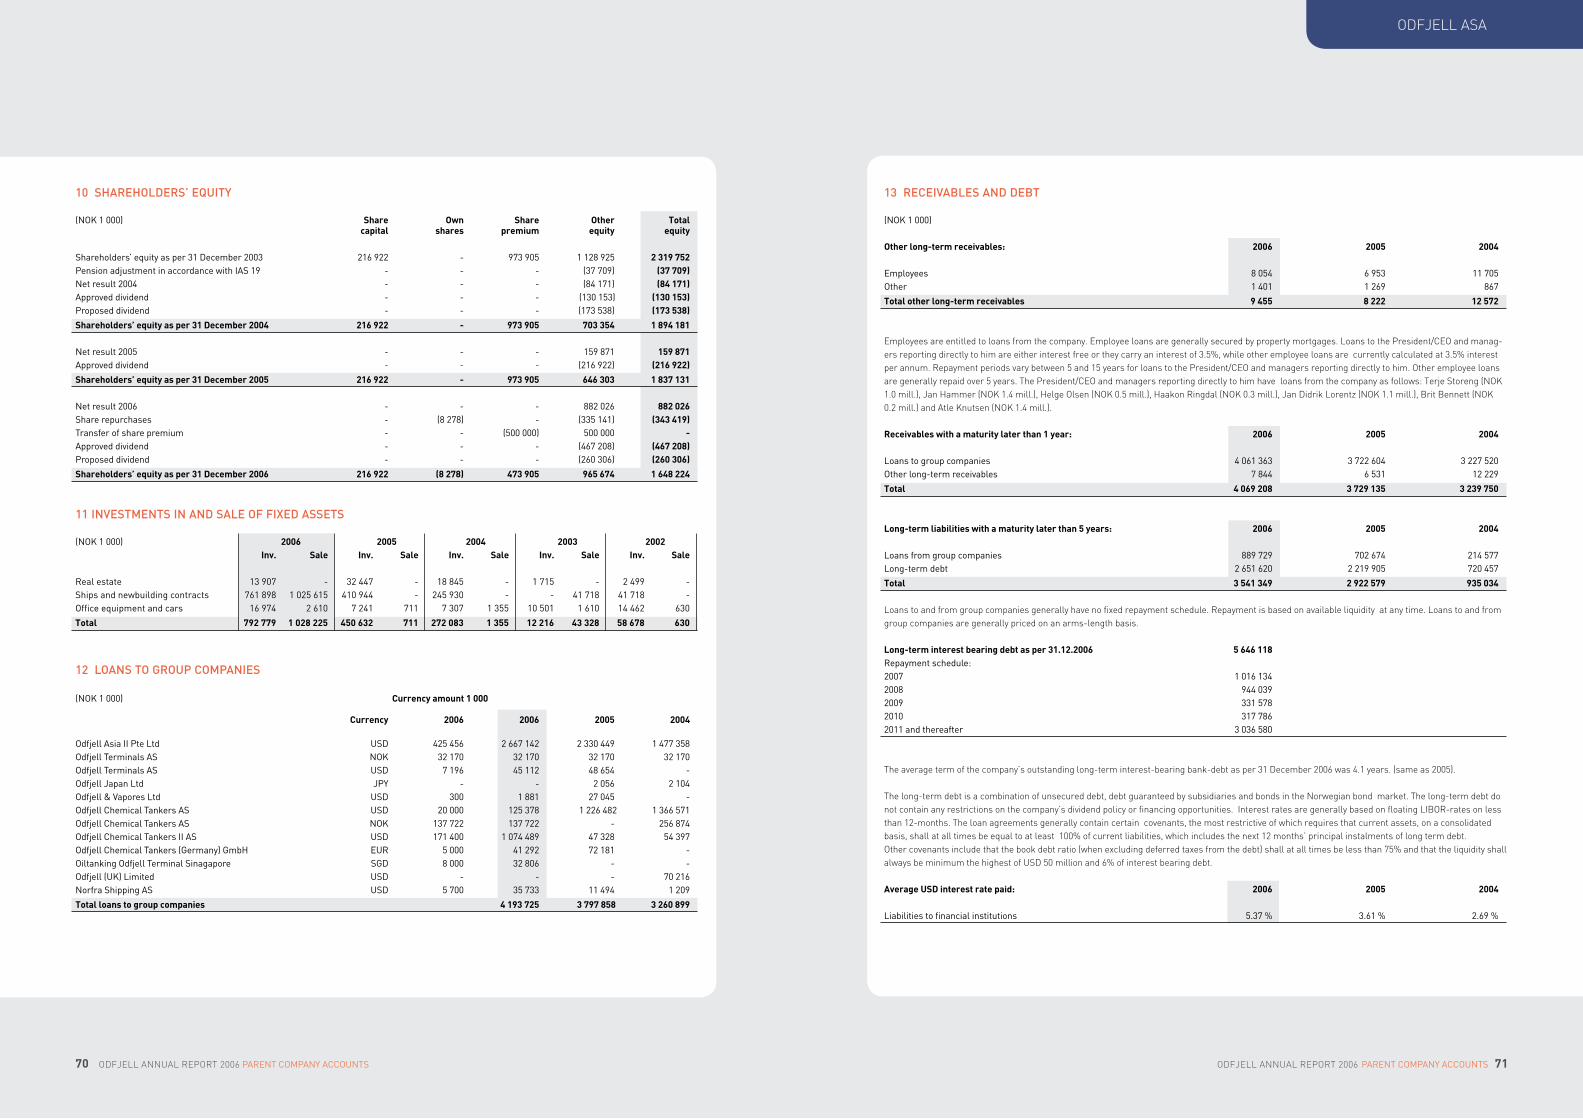
ODFJELL ASA
70 ODFJELL ANNUAL REPORT 2006 PArENT cOMPANy AccOuNTS ODFJELL ANNUAL REPORT 2006 PArENT cOMPANy AccOuNTS 71
13RECEIvABLEsANDDEBT
(NOK 1 000)
Other long-term receivables: 2006 2005 2004
Employees 8 054 6 953 11 705 Other 1 401 1 269 867
Total other long-term receivables 9 455 8 222 12 572
Employees are entitled to loans from the company. Employee loans are generally secured by property mortgages. Loans to the President/CEO and manag-ers reporting directly to him are either interest free or they carry an interest of 3.5%, while other employee loans are currently calculated at 3.5% interest per annum. Repayment periods vary between 5 and 15 years for loans to the President/CEO and managers reporting directly to him. Other employee loans are generally repaid over 5 years. The President/CEO and managers reporting directly to him have loans from the company as follows: Terje Storeng (NOK 1.0 mill.), Jan Hammer (NOK 1.4 mill.), Helge Olsen (NOK 0.5 mill.), Haakon Ringdal (NOK 0.3 mill.), Jan Didrik Lorentz (NOK 1.1 mill.), Brit Bennett (NOK 0.2 mill.) and Atle Knutsen (NOK 1.4 mill.).
Receivables with a maturity later than 1 year: 2006 2005 2004 Loans to group companies 4 061 363 3 722 604 3 227 520 Other longterm receivables 7 844 6 531 12 229
Total 4 069 208 3 729 135 3 239 750
Long-term liabilities with a maturity later than 5 years: 2006 2005 2004 Loans from group companies 889 729 702 674 214 577 Longterm debt 2 651 620 2 219 905 720 457
Total 3 541 349 2 922 579 935 034
Loans to and from group companies generally have no fixed repayment schedule. Repayment is based on available liquidity at any time. Loans to and from group companies are generally priced on an arms-length basis. Long-term interest bearing debt as per 31.12.2006 5 646 118 repayment schedule: 2007 1 016 134 2008 944 039 2009 331 578 2010 317 786 2011 and thereafter 3 036 580
The average term of the company’s outstanding long-term interest-bearing bank-debt as per 31 December 2006 was 4.1 years. (same as 2005). The long-term debt is a combination of unsecured debt, debt guaranteed by subsidiaries and bonds in the Norwegian bond market. The long-term debt do not contain any restrictions on the company’s dividend policy or financing opportunities. Interest rates are generally based on floating LIBOR-rates on less than 12-months. The loan agreements generally contain certain covenants, the most restrictive of which requires that current assets, on a consolidated basis, shall at all times be equal to at least 100% of current liabilities, which includes the next 12 months’ principal instalments of long term debt. Other covenants include that the book debt ratio (when excluding deferred taxes from the debt) shall at all times be less than 75% and that the liquidity shall always be minimum the highest of USD 50 million and 6% of interest bearing debt. Average USD interest rate paid: 2006 2005 2004
Liabilities to financial institutions 5.37 % 3.61 % 2.69 %
10shAREhoLDERs’EQuITY
(NOK 1 000) Share Own Share Other Total capital shares premium equity equity
Shareholders’ equity as per 31 december 2003 216 922 973 905 1 128 925 2 319 752 Pension adjustment in accordance with IAS 19 (37 709) (37 709)Net result 2004 (84 171) (84 171)Approved dividend (130 153) (130 153)Proposed dividend (173 538) (173 538)
Shareholders’ equity as per 31 December 2004 216 922 - 973 905 703 354 1 894 181
Net result 2005 159 871 159 871 Approved dividend (216 922) (216 922)
Shareholders’ equity as per 31 December 2005 216 922 - 973 905 646 303 1 837 131
Net result 2006 882 026 882 026 Share repurchases (8 278) (335 141) (343 419)Transfer of share premium (500 000) 500 000 - Approved dividend (467 208) (467 208)Proposed dividend (260 306) (260 306)
Shareholders’ equity as per 31 December 2006 216 922 (8 278) 473 905 965 674 1 648 224
12LoANsToGRouPComPANIEs
(NOK 1 000) Currency amount 1 000
Currency 2006 2006 2005 2004
Odfjell Asia II Pte Ltd uSd 425 456 2 667 142 2 330 449 1 477 358 Odfjell Terminals AS NOK 32 170 32 170 32 170 32 170 Odfjell Terminals AS uSd 7 196 45 112 48 654 Odfjell Japan Ltd JPy 2 056 2 104 Odfjell & vapores Ltd uSd 300 1 881 27 045 Odfjell chemical Tankers AS uSd 20 000 125 378 1 226 482 1 366 571 Odfjell chemical Tankers AS NOK 137 722 137 722 256 874 Odfjell chemical Tankers II AS uSd 171 400 1 074 489 47 328 54 397 Odfjell chemical Tankers (Germany) GmbH Eur 5 000 41 292 72 181 Oiltanking Odfjell Terminal Sinagapore SGd 8 000 32 806 Odfjell (uK) Limited uSd 70 216 Norfra Shipping AS uSd 5 700 35 733 11 494 1 209
Total loans to group companies 4 193 725 3 797 858 3 260 899
11INvEsTmENTsINANDsALEoFFIXEDAssETs
(NOK 1 000) 2006 2005 2004 2003 2002 Inv. Sale Inv. Sale Inv. Sale Inv. Sale Inv. Sale
real estate 13 907 32 447 18 845 1 715 2 499 Ships and newbuilding contracts 761 898 1 025 615 410 944 245 930 41 718 41 718 Office equipment and cars 16 974 2 610 7 241 711 7 307 1 355 10 501 1 610 14 462 630
Total 792 779 1 028 225 450 632 711 272 083 1 355 12 216 43 328 58 678 630

ODFJELL ASA
72 ODFJELL ANNUAL REPORT 2006 PArENT cOMPANy AccOuNTS ODFJELL ANNUAL REPORT 2006 PArENT cOMPANy AccOuNTS 73
All own shares were acquired by Odfjell ASA’s subsidiary Odfjell Chemical Tankers AS during 2006 and no own shares were sold during 2006. No own shares were acquired or sold during 2005 or 2004. The Annual General Meeting on 4 May 2006 authorised the Board of Directors to acquire up to 10 per cent of the company’s share capital. This authorisation expires 4 November 2007. The purpose of purchasing own shares is to increase shareholders’ value. The Board of Directors regularly considers investments in own shares when it may be beneficial for the company. Shares owned by members of the Board, President/CEO and managers reporting directly to him (including related parties): A-shares B-shares Totalchairman of the Board of directors, B. d. Odfjell and Board Member Laurence W. Odfjell 29 463 964 1 041 176 30 505 140 Member of the Board of directors, Peter G. Livanos 16 503 396 20 500 16 523 896 President/cEO, Terje Storeng 70 560 2 112 72 672 Senior vice President, Asia, Atle Knutsen 11 712 2 336 14 048
17PENsIoNCosTsANDLIABILITIEs (NOK 1 000) The company has set up a defined benefit scheme with a life insurance company to provide pension benefits for its employees. The scheme provides entitlement to benefits based on future service from the commencement date of the scheme. These benefits are principally dependent on an employee’s pension qualifying period, salary at retirement age and the size of benefits from the National Insurance Scheme. Full retirement pension will amount to approximately 66% of the scheme pension-qualifying income limited to 12G (G = Indexation of the public National Insurance base amount, presently G equals NOK 62 892). The scheme also includes entitlement to disability, spouses and children’s pensions. The retirement age under the scheme is aged 67 years. The company may at any time make alterations to the terms and conditions of the pension scheme and undertake that they will inform the employees of any such changes. The benefits accruing under the scheme are funded obligations. The company also has pension obligations for the Senior Management Group at Minde/Norway with salaries exceeding 12G, up to 66% of 18 G. These are funded obligations. This arrangement was terminated as from 1.1.2007. The company also has established a separate tariff rated pension scheme for mariners. The retirement pension from 60-67 years of age under this scheme amounts to 60% of the pension qualifying income, including the Pension Insurance for Seamen, in the event of a full pension period (360 months). These are funded obligations. The company also has an early retirement pension agreement with the employees, which will pay out 66% of the salary between the ages of 65-67 years of age. These are non-funded obligations. Additionally the company has pension obligations for some pensioners. These are also non-funded obligations. All pension schemes are calculated in accordance with the IFRS (IAS 19). Changes in the pension obligations as a result of changed actuarial assumptions and variations between actual and anticipated return on pension funds, will be accounted over the average remaining earnings period according to the “corridor” regulations. In the actuarial assumptions K1963 scale of rates has been used for mortality, and KU 2002 scale of rates for disability.
Net pension costs: 2006 2005 2004Present value current year service cost 24 627 20 008 17 227 Interest cost on accrued pension liabilities 11 496 11 565 10 666 return on pension plan assets (8 075) (8 734) (8 450)Amortised effect of changes in estimates and pension plans, and differences in actual and estimated return on pension plan assets 3 313 167 2 214 Social security tax 3 954 3 220 2 884
Net pension cost 35 315 26 226 24 541 Pension liabilities - funded obligations : Present value of accrued secured liabilities 230 340 246 122 196 991 fair value of pension assets (177 228) (162 059) (145 106)Social security tax 7 489 11 853 7 316 Actuarial gains/losses not recognised in the profit and loss statement (11 291) (54 675) (13 663)
Net pension liabilities (funded) 49 310 41 241 45 537 Pension liabilities - unfunded obligations : Present value of accrued unsecured liabilities 48 394 44 627 37 279 Actuarial gains/losses not recognised in the profit and loss statement (9 311) (8 601) (2 883)Social security tax 6 824 6 292 5 256
Net pension liabilities (unfunded) 45 907 42 319 39 652
Total net pension liabilities 95 217 83 560 85 189 underfunded pension scheme booked as long term liabilities 95 217 83 560 85 189
Total net pension liabilities 95 217 83 560 85 189
14AvAILABLE-FoR-sALEINvEsTmENTs
(NOK 1 000) Book Market Average Currency value value interest rateBonds and certificates issued by financial institutions uSd 46 530 46 530 5.4%Bonds and certificates issued by corporates Eur 27 748 27 748 11.0%Bonds and certificates issued by corporates uSd 33 997 33 997 5.4%
Total available-for-sale investments 108 275 108 275
Bonds and certificates generally have interest rate adjustments every three months.
15REsTRICTEDCAshANDBANkDEPosITs
(NOK 1 000) 2006 2005 2004
restricted cash and bank deposits 13 170 18 648 17 609
This item is withholding taxes relating to employees in Odfjell ASA.
16shARECAPITALANDINFoRmATIoNABouTshAREhoLDERs
(NOK 1 000) Number Nominal of shares value (NOK) 2006 2005 2004AShares 65 690 244 2.50 164 226 164 226 164 226 BShares 21 078 704 2.50 52 697 52 697 52 697
Total 86 768 948 216 922 216 922 216 922 All shares have the same rights in the Company, except that B-shares have no voting rights. 20 largest shareholders as per 31 December 2006: Percent PercentName A-shares B-shares Total of votes of shares 1 Norchem ApS 25 966 492 1 041 176 27 007 668 39.53 % 31.13 %2 chemLog Holdings Ltd 16 503 396 20 500 16 523 896 25.12 % 19.04 %3 Odinfondene 4 628 801 4 628 801 5.33 %4 SIS Segaintersettle 2 217 200 2 330 640 4 547 840 3.38 % 5.24 %5 folketrygdfondet 2 086 500 1 960 200 4 046 700 3.18 % 4.66 %6 AS rederiet Odfjell 3 497 472 3 497 472 5.32 % 4.03 %7 Odfjell chemical Tankers AS 1 500 000 1 811 255 3 311 255 2.28 % 3.82 %8 Paretofondene 1 189 820 1 531 000 2 720 820 1.81 % 3.14 %9 Odfjell Shipping (Bermuda) Ltd 1 259 200 1 215 760 2 474 960 1.92 % 2.85 %10 Svenska Handelsbanken 1 089 400 879 100 1 968 500 1.66 % 2.27 %11 JP Morgan chase 892 200 451 600 1 343 800 1.36 % 1.55 %12 State Street Bank & Trust 117 396 1 005 382 1 122 778 0.18 % 1.29 %13 Ingeborg Berger 725 480 330 880 1 056 360 1.10 % 1.22 %14 Mathilda A/S 600 000 150 000 750 000 0.91 % 0.86 %15 Pictet & cIE Banquiers 475 260 252 800 728 060 0.72 % 0.84 %16 AS Bemacs 314 000 198 000 512 000 0.48 % 0.59 %17 dfAInternational 407 296 407 296 0.62 % 0.47 %18 frank Mohn A/S 350 000 350 000 0.40 %19 Skagen fondene 349 700 349 700 0.53 % 0.40 %20 Storebrand Livsforsikring AS 291 382 20 000 311 382 0.44 % 0.36 %
Total 20 largest shareholders 59 482 194 18 177 094 77 659 288 90.55 % 89.50 % Other shareholders 6 208 050 2 901 610 9 109 660 9.45 % 10.50 %
Total 65 690 244 21 078 704 86 768 948 100.00 % 100.00 %International shareholders 50 553 186 8 107 869 58 661 055 76.96 % 67.61 %
Own shares 1 500 000 1 811 255 3 311 255 2.28 % 3.82 %cost price own shares (NOK 1000) 166 500 176 389 342 889
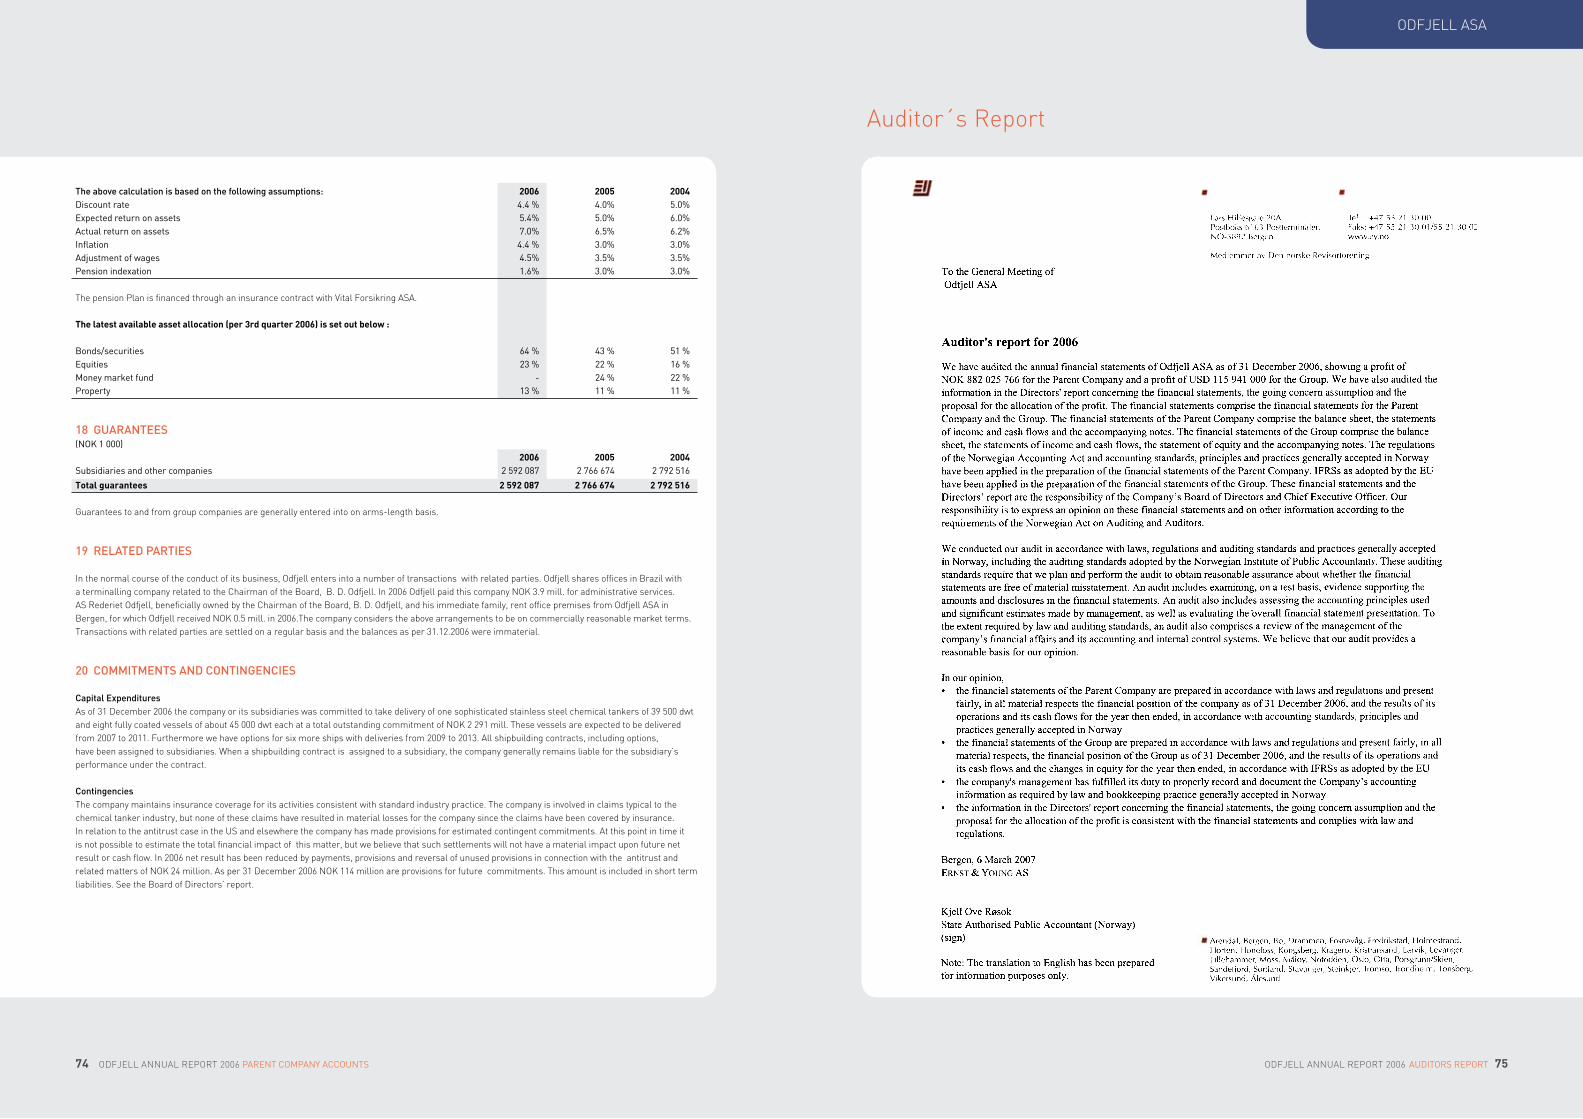
ODFJELL ASA
Auditor´s Report
74 ODFJELL ANNUAL REPORT 2006 PArENT cOMPANy AccOuNTS ODFJELL ANNUAL REPORT 2006 AudITOrS rEPOrT 75
Theabovecalculationisbasedonthefollowingassumptions: 2006 2005 2004discount rate 4.4 % 4.0% 5.0%Expected return on assets 5.4% 5.0% 6.0%Actual return on assets 7.0% 6.5% 6.2%Inflation 4.4 % 3.0% 3.0%Adjustment of wages 4.5% 3.5% 3.5%Pension indexation 1.6% 3.0% 3.0% The pension Plan is financed through an insurance contract with Vital Forsikring ASA.
The latest available asset allocation (per 3rd quarter 2006) is set out below : Bonds/securities 64 % 43 % 51 %Equities 23 % 22 % 16 %Money market fund 24 % 22 %Property 13 % 11 % 11 %
18GuARANTEEs (NOK 1 000) 2006 2005 2004Subsidiaries and other companies 2 592 087 2 766 674 2 792 516
Total guarantees 2 592 087 2 766 674 2 792 516 Guarantees to and from group companies are generally entered into on arms-length basis.
19RELATEDPARTIEs In the normal course of the conduct of its business, Odfjell enters into a number of transactions with related parties. Odfjell shares offices in Brazil with a terminalling company related to the Chairman of the Board, B. D. Odfjell. In 2006 Odfjell paid this company NOK 3.9 mill. for administrative services. AS Rederiet Odfjell, beneficially owned by the Chairman of the Board, B. D. Odfjell, and his immediate family, rent office premises from Odfjell ASA in Bergen, for which Odfjell received NOK 0.5 mill. in 2006. The company considers the above arrangements to be on commercially reasonable market terms. Transactions with related parties are settled on a regular basis and the balances as per 31.12.2006 were immaterial.
20CommITmENTsANDCoNTINGENCIEs CapitalExpendituresAs of 31 December 2006 the company or its subsidiaries was committed to take delivery of one sophisticated stainless steel chemical tankers of 39 500 dwt and eight fully coated vessels of about 45 000 dwt each at a total outstanding commitment of NOK 2 291 mill. These vessels are expected to be delivered from 2007 to 2011. Furthermore we have options for six more ships with deliveries from 2009 to 2013. All shipbuilding contracts, including options, have been assigned to subsidiaries. When a shipbuilding contract is assigned to a subsidiary, the company generally remains liable for the subsidiary’s performance under the contract.
ContingenciesThe company maintains insurance coverage for its activities consistent with standard industry practice. The company is involved in claims typical to the chemical tanker industry, but none of these claims have resulted in material losses for the company since the claims have been covered by insurance. In relation to the antitrust case in the US and elsewhere the company has made provisions for estimated contingent commitments. At this point in time it is not possible to estimate the total financial impact of this matter, but we believe that such settlements will not have a material impact upon future net result or cash flow. In 2006 net result has been reduced by payments, provisions and reversal of unused provisions in connection with the antitrust and related matters of NOK 24 million. As per 31 December 2006 NOK 114 million are provisions for future commitments. This amount is included in short term liabilities. See the Board of Directors’ report.

The global arena is Odfjell’s market
place. Therefore we are exposed to an
infinite number of risk factors. Our
financial strategy is to be sufficiently
robust to withstand prolonged adverse
conditions in significant risk factors,
such as long term downcycles in the
markets where we operate or unfavour
able conditions in financial markets.
Odfjell have an active approach in man
aging risk in the financial markets. This
is done through funding from diversified
sources, maintaining high liquidity or
loan reserves, and through a systematic
monitoring and management of financial
risks related to currency, interest rates
and bunkers. Odfjell’s net result and
cash flow are influenced by our success
at managing these risk factors.
EARNINGsThe time charter earnings within the
chemical tanker market are typically
less volatile than many other shipping
segments. The volatility is lower as we
operate in a niche-market with special-
ized tonnage. Our time charter earnings
are nonetheless influenced by external
factors like world economic growth, the
various ship-freight markets, bunker
prices and factors specifically related to
the chemical parcel trade, such as cargo
type and cargo volume, contract and spot
rates and operational efficiency. Time
is of essence, an optimal utilization of
the ships and an efficient composition of
cargoes, with minimal time in port, is of
vital importance in order to maximize the
time charter earnings.
The single largest monetary cost compo-
nent affecting the time charter earnings
is bunkers. It amounts to about 59% of
voyage cost. A change in the average
bunker price of USD 10 per ton gives
about USD 5 million (or USD 290/day)
change in time charter earnings for the
ships in which we have a direct economic
interest. A certain portion of our bunker
exposure is hedged through bunker
adjustment clauses in the CoA’s. In addi-
tion, we have hedged about 20% of 2007
exposure through bunker swaps as per
31 December 2006.
Sensitivity analysis show that a per-day
change in time charter earnings of USD
1 000 for our parcel tankers (about a 4%
change in freight rates) will impact the
pre-tax net result by approximately USD
24 million. We are currently not engaged
in the derivative market for Forward
Freight Agreements.
The tank terminal activities have histori-
cally shown more stable earnings than
the shipping activities. About 25% of
the operating result comes from tank
terminals. A substantial part of the costs
in a tank terminal is fixed costs, and the
main drivers for earnings within a tank
terminal are the occupancy rate, the
volume of cargoes handled through the
terminal and operational efficiency.
INTEREsTRATEsAll interest-bearing debt, except debt
in our tank terminals outside the US, is
denominated in USD. Bonds issued in
NOK are swapped to USD. At the end of
2006 about 80% of our debt was floating,
based on USD LIBOR rates. Our debt is
fixed either through fixed rate loans or
through long-term interest rate swaps.
In order to reduce the volatility in net
result and cash flow related to changes
in short term interest rates, interest rate
periods on floating rate debt and liquid-
ity are managed to be concurrent. Our
interest-bearing debt as per 31 Decem-
ber 2006 was 1 293 million, while liquid
assets were USD 242 million.
CuRRENCYThe Group’s revenues are primarily in
US Dollars; only tank terminals outside
the US and our intereuropean shipping
trades receive revenues in non-USD cur-
rency. Our currency exposure related to
the net result and cash flow arises from
voyage related expenses, ship operating
expenses and general and administra-
tive expenses denominated in non-USD
currency, primarily in NOK and EUR. We
have estimated that a 10% strengthening
of the USD versus the NOK and EUR will
improve the pre-tax result by roughly USD
12 million, before taking into account the
result of any currency hedging.
Our currency hedging as per 31 Decem-
ber 2006, whereby we have sold USD and
purchased NOK and EUR, covers about
33% of the 2007 exposure. The average
exchange rates for open hedging posi-
tions as of 31 December 2006 were at
6.44. Future hedging periods may vary de-
pending on changes in market conditions.
The hedging result is accounted for as
part of the hedged exposure, i.e. ship
operating expenses and general and
administrative expenses.
FINANCINGOdfjell has a stable debt structure
established with major international
shipping banks, with whom we enjoy
longstanding relationships. We have a
diversified debt portfolio and it is a combi-
nation of secured loans, unsecured loans,
finance leases and bonds. The average
maturity of the Group’s interest-bearing
debt is about 5.9 years.
LIQuIDITYOdfjell’s strategy is to maintain a high
level of readily available liquidity. Over the
past 10 years it has been around USD 200
million. The liquidity is invested in bank
deposits and high-grade certificates and
bonds with floating interest rate.
TAXThe Odfjell Group operates within a
number of jurisdictions and tax systems.
The shipping activities are operated in
several countries and under different tax
schemes, including the ordinary tax sys-
tem in Norway, the Norwegian shipping
tax system, the Approved International
Shipping system in Singapore and the
tonnage tax systems in the UK and Ger-
many. In addition we operate under local
tax systems in Chile, Brazil and China.
Our tank terminal activities are generally
subject to the ordinary corporate tax rates
within the country in which the activity is
located. The variation in tax systems and
rates may cause tax costs to vary signifi-
cantly depending on the country in which
profits are accumulated and taxed.
Financial Risk Management and Sensitivities
sENsITIvITIEs
Bunkers, $10 per
ton lower
freight rates, 4% increase
Interest rates, 1%
higher
currency, uSd 10% stronger
25
20
15
10
5
0
5
10
usDmILL.change in net result before tax
usD/Nok
97 98 99 00 01 02 03 04 05 06
10
9
8
7
6
5
4
3
2
1
0
INTEREsTRATEs
uSd 6 MONTH LIBOr IN %
98 99 00 01 02 03 04 05 06
8
7
6
5
4
3
2
1
0
BuNkERs
300
250
200
150
100
50
0
97 98 99 00 01 02 03 04 05 06 07
uSd/ton 3.5% BArGES rOTTErdAM
76 ODFJELL ANNUAL REPORT 2006 fINANcIAL rISK MANAGEMENT ANd SENSITIvITIES ODFJELL ANNUAL REPORT 2006 fINANcIAL rISK MANAGEMENT ANd SENSITIvITIES 77
(20%) BuNKErS
(15%) OTHEr vOyAGE EXPENSES
(30%) OPErATING ANd AdM. EXPENSES
(35%) cAPITAL EXPENSES
CosTANALYsIsThe major cost components of a typical large Odfjell parcel tanker.

Corporate Governance
78 ODFJELL ANNUAL REPORT 2006 cOrPOrATE GOvErNANcE ODFJELL ANNUAL REPORT 2006 cOrPOrATE GOvErNANcE 79
Odfjell ASA is a Norwegian company
organised according to the Norwegian
Public Limited companies’ Act. The
Odfjell Group is an international group
of companies with Odfjell ASA as the
parent company. Subsidiaries have their
own management bodies that act in
accordance with the prevailing legislation
in their respective countries.
There are two classes of shares in Odfjell.
The A-shares each carry one vote at the
company’s general meetings. The B-
shares have no voting rights. In all other
respects, the two classes of shares have
equal rights and are freely tradable. The
shares are registered with the Norwegian
Registry of Securities.
As a company with global operations
the Board of Directors and the
Management of Odfjell experience
demands and expectations from many
parties. In addition to compliance with
laws and regulations, Odfjell also has
responsibilities towards its shareholders,
employees and lenders. Furthermore the
general public opinion of the company is
an important part of the context for the
furtherance of the company. A profile of
the company can be found on page 4 in
this Annual report, and Odfjell’s Articles
of Association can be found on our
website.
Odfjell is committed to ethical business
practices, honesty, fair dealing and full
compliance with all laws affecting its
business. This includes a commitment to
high standards of corporate governance
throughout the Group.
The Board is ultimately responsible
for the Company’s objectives and the
means of achieving them. Thus, the
Board of Directors determines the
strategic direction of the company and
decides on matters, which in relation
to the company’s activities are of
significant nature. Such matters include
confirmation of the strategic guidelines,
approval of the budgets and decisions
on major investments and divestments.
Furthermore, the Board ensures a
correct capital structure and defines
the shareholder policy, including the
dividend policy. The Board also appoints
and determines the remuneration of the
President/CEO.
The Board is responsible for assuring
that the company’s Management and
employees operate in a safe, legal
and ethically responsible manner. To
emphasise the importance of these
issues, an Odfjell Code of Conduct
document has been communicated
throughout the organisation. The Code
focuses on aspects of ethical behaviour
in everyday business activities.
To be able to control and support the
organisation the Board depends on
accurate and timely information. The
Board of Odfjell is kept updated on
management and company activities
through reporting systems, including
monthly financial statements. The
company is also subject to external
control functions such as the auditors,
the ship classification societies, port and
flag state control, and other regulatory
bodies like IMO, ISM Codes, etc.
ELECTIoNANDTERmoFmEmBERsoFThEBoARDoFDIRECToRsAccording to the Articles of Association
of Odfjell ASA the company has a Board
composed of a minimum of five and
a maximum of seven members. The
members are elected by the shareholders
at the Annual General Meeting. At the
Annual General Meeting held on 4 May
2006 Peter G. Livanos, Stein Pettersen
and Laurence W. Odfjell were all re-
elected for new two-year periods. Terje
Storeng renounced being re-elected due
to his position as President/CEO.
Bernt Daniel Odfjell is the Chairman
of the Board. The Chairman has been
delegated additional tasks by the Board,
and consequently acts as Executive
Chairman. The Executive Chairman and
Laurence W. Odfjell represent the Odfjell
family, the largest shareholder of Odfjell
ASA. Board Member Peter G. Livanos
represents Chemlog Holdings Ltd., the
second largest shareholder. Reidar Lien,
Marianna Moschou and Stein Pettersen
are independent Board Members. Great
care is taken to avoid any conflict of
interest in issues with related parties.
In this connection the independent Board
Members represent valuable external
viewpoints.
mEETINGsoFThEBoARDoFDIRECToRsThe Board held seven regular meetings in
2006. Apart from ongoing business, four
of the meetings dealt with the quarterly
financial reports, one covered strategic
matters and one meeting reviewed
and approved the next year’s budget.
One of the meetings was held in May,
in connection with the Annual General
Meeting. The auditor participated in the
meeting of the Board of Directors that
dealt with the annual accounts.
The Annual General Meeting represents
an occasion for the Board to meet and
discuss with shareholders face to face
and to decide on important issues such
as the appointment of the auditors,
dividend payments, and the election
or re-election of Board members.
In addition to the regular Board meetings,
the Board may hold special meetings,
either by telephone conference or by
written resolution at the request of the
Executive Chairman, the President/CEO
or any two Board Members.
CommITTEEoFThEBoARDoFDIRECToRsThe Board has discussed the need for a
specific Audit Committee, but has decided
that since the Board is relatively small
it is preferable that all Board members
participate in discussions regarding
Auditing. An Audit Committee is not
mandatory under Norwegian legislation.
Odfjell has a Compensation Committee
consisting of the Executive Chairman
Bernt Daniel Odfjell, the Board Member
Reidar Lien and the President/CEO Terje
Storeng. All other issues are evaluated by
the full Board and consequently no other
permanent committee exists.
REmuNERATIoNThe Annual General Meeting on
4 May 2006 resolved that the annual
compensation to the members of the
Board be NOK 1 277 680 for the Executive
Chairman and NOK 200 000 for each
of the other members of the Board.
The compensation was paid in cash.
President/ CEO Terje Storeng received
compensation and benefits of totally NOK
3 986 000 in 2006. Neither the Board
members, the President /CEO nor the
Management have stock options.
More information about the
compensation and benefits to the
Board, the President/CEO and Senior
Management can be found in the notes to
Odfjell ASA’s financial statements.
INsIDERs’TRADINGWIThsECuRITIEsThe Board has established a policy in
respect of stock trading. The policy is
in line with the guidelines for Insiders
issued by the Oslo Stock Exchange and
applies to the Board, the President/CEO
and the Senior Management as well as
to other employees who in connection
with their work may gain access to price
sensitive, non-public, information.
CoDEoFCoNDuCTOdfjell is a truly multinational company
that operates and serves clients on all
continents. This means that we have to
adapt to many cultures, religions and
general customs and practices. All
Odfjell employees are obliged to
behave in a manner that is not perceived
as offensive, and of course that does
not violate applicable legislation or
regulations.
Odfjell’s Code of Conduct focuses on
ethical behaviour in everyday business
activities. All Odfjell employees shall
comply with the Code of Conduct.
ComPLIANCEoFFICERThe Compliance Officer of Odfjell
monitors that the company acts in
accordance with applicable law and
regulations. Particular focus is put
on competition law compliance. The
Compliance Officer reports to the
President/CEO.

Shareholder Information
EArNINGS PEr SHArE
cASH fLOW PEr SHArE
EARNINGs/CAshFLoWPERshARE
18
16
14
12
10
8
6
4
2
0
2
NOK
OrdINAry dIvIdENd
EXTrA 2Nd HALf dIvIdENd
DIvIDENDPERshARE
97 98 99 00 01 02 03 04 05 06
NOK
0
0.5
1
1.5
2
2.5
3
3.5
4
4.5
5
shAREhoLDERPoLICYOdfjell’s aim is to provide competitive
longterm return to its shareholders.
The company emphasises an inves
tor friendly dividend policy based upon
financial performance, current capital
expenditure programmes and tax
positions. The company strives for
semiannual dividend payments.
shAREPERFoRmANCEAt year-end 2006 the Odfjell A-shares
traded at NOK 115 (USD 18.34), down
16% compared to NOK 137 (USD 20.26)
a year earlier. The B-shares traded at
NOK 95.25 (USD 15.19) at year-end, down
18.6% from NOK 117 (USD 17.3) a year
earlier. During 2006 an dividend of NOK
3.25 per share was paid out in May and
another dividend of NOK 2.25 per share
was paid out in October. Adjusted for this
dividend, the A- and B- shares had nega-
tive yields of 12% and 14% respectively.
By way of comparison, the Oslo Stock
Exchange benchmark index rose by 32%,
the marine index increased by 1.3% and
the transportation index improved by
2.6% during 2006.
The market capitalisation of Odfjell
decreased by NOK 2.3 billion (USD 220
million) in 2006, from NOK 11.5 billion
(USD1.7 billion) as per 31 December 2005
to NOK 9.2 billion (USD 1.5 billion) as per
31 December 2006.
TRADINGvoLumEsIn 2006 about 16 million Odfjell shares
were traded, equally spread over A-
shares and B-shares. This represents
about 18.5 % of the issued and outstand-
ing shares. The A-shares were traded on
the Oslo Stock Exchange on 222 out of
251 trading days during the year.
To maintain liquidity in the Odfjell shares
and secure a good spread, Odfjell has
entered into a market maker agreement
with DnB NOR.
shAREhoLDERsAt the end of 2006 there were 1 123
holders of Odfjell A-shares and 534
holders of Odfjell B-shares. Taking into
account shareholders owning both share
classes, the total number of shareholders
was 1 356, a slight decrease compared
to the preceding year.
INTERNATIoNALoWNERshIP76.96% of the company’s A-shares and
38.5% of the B-shares were held by inter-
national investors at year-end, equivalent
to 67.6% of the total share capital.
shAREREPuRChAsEPRoGRAmDuring 2006 Odfjell acquired 1.5 million
treasury A-shares, and 1 811 255 treasury
B- shares, representing about 3.8% of the
number of shares of the company.
At the Ordinary General Meeting held on
4 May 2006 the Board was authorized to
acquire treasury shares of up to 10%
of the company’s outstanding shares,
at a minimum price of NOK 2.50 (i.e. par
value) and a maximum price of NOK 250
per share. This authorisation is valid for
18 months from 4 May 2006.
INvEsToRRELATIoNsCorrect and timely information is of vital
importance when wishing to create cred-
ibility and confidence. The demand for
information is ever increasing, and our
policy is to provide the market with rele-
vant information. Odfjell qualifies for both
the Information Mark and the English
Mark from the Oslo Stock Exchange. We
attach great importance to ensuring that
shareholders receive swift, relevant and
correct information about the company.
Our aim is to provide a good understanding
of the company’s activities and its pros-
pects so that shareholders are in a good
position to assess the share’s trading price
and underlying values.
Our quarterly reports are presented in open
presentations or in telephone conferences
by the CEO. CFO also participates at these
presentations where there is possibility
to ask questions. We maintain a regular
dialogue with analysts and investors.
All reports and press releases, together
with a detailed description of the company
and our activities, are available on Odfjell’s
website at: http://www.odfjell.com
The financial calendar for 2007 is as
follows:
3 May 2007 Annual General Meeting
3 May 2007 Report 1st quarter 2007
23 August 2007 Report 2nd quarter 2007
7 November 2007 Report 3rd quarter 2007
5 February 2008 4th quarter result 2007
sPECIALINFoRmATIoNFoRNoRWEGIANshAREhoLDERsUnder the tax reform of 1 January 1992
the cost of shares for tax purposes is to be
adjusted annually to reflect the company’s
retained taxed earnings in order to prevent
double taxation. The adjustment is named
RISK-adjustment. This system was discon-
tinued as from 1 January 2006, however,
the RISK-adjustments for previous years
still apply.
The reason why the RISK adjustments
are negative (and reduce the cost price
of the shares for tax purposes) is that the
company has paid dividend in excess of
taxable earnings in each particular year.
Norwegian shareholders do not pay tax on
dividend when received, but the dividend
becomes taxable when the shares are sold.
In accordance with the Norwegian tax
reform of 1 January 1992, the price paid by
Norwegians for shares acquired prior to
1 January 1989 may be adjusted upwards
to NOK 15.41 for A-shares and NOK 14.87
for B-shares.
All share data have been restated accord-
ing to the 2:1 split of the shares that took
place in 2004 and 2005.
80 ODFJELL ANNUAL REPORT 2006 SHArEHOLdEr INfOrMATION ODFJELL ANNUAL REPORT 2006 SHArEHOLdEr INfOrMATION 81
The following RISK adjustments have been
set for the Odfjell-share:
1 January 2006 minus NOK 2.50 per share
1 January 2005 minus NOK 3.50 per share
1 January 2004 minus NOK 2.50 per share
1 January 2003 minus NOK 1.84 per share
1 January 2002 minus NOK 1.80 per share
1 January 2001 minus NOK 1.00 per share
1 January 2000 minus NOK 1.00 per share
1 January 1999 minus NOK 1.00 per share
1 January 1998 minus NOK 1.00 per share
1 January 1997 minus NOK 0.75 per share
1 January 1996 minus NOK 0.50 per share
1 January 1995 minus NOK 0.38 per share
1 January 1994 minus NOK 0.32 per share
1 January 1993 NOK 0.00 per share
5.5
6
97 98 99 00 01 02 03 04 05 06
(31.13%) NOrcHEM APS
(19.04%) cHEMLOG HOLdINGS LTd
(5.24%) SIS SEGA INTErSETTLE
(5.23%) OdIN fONdENE
(4.66%) fOLKETryGdfONdET
(4,03%) AS rEdErIET OdfJELL
(30.67%) OTHErS
shAREhoLDERsTRuCTuREPer 31.12.2006
(76.96%) INTErNATIONAL SHArEHOLdErS
(23.04%) dOMESTIc SHArEHOLdErS
shAREhoLDERDomICILEPer 31.12.2006
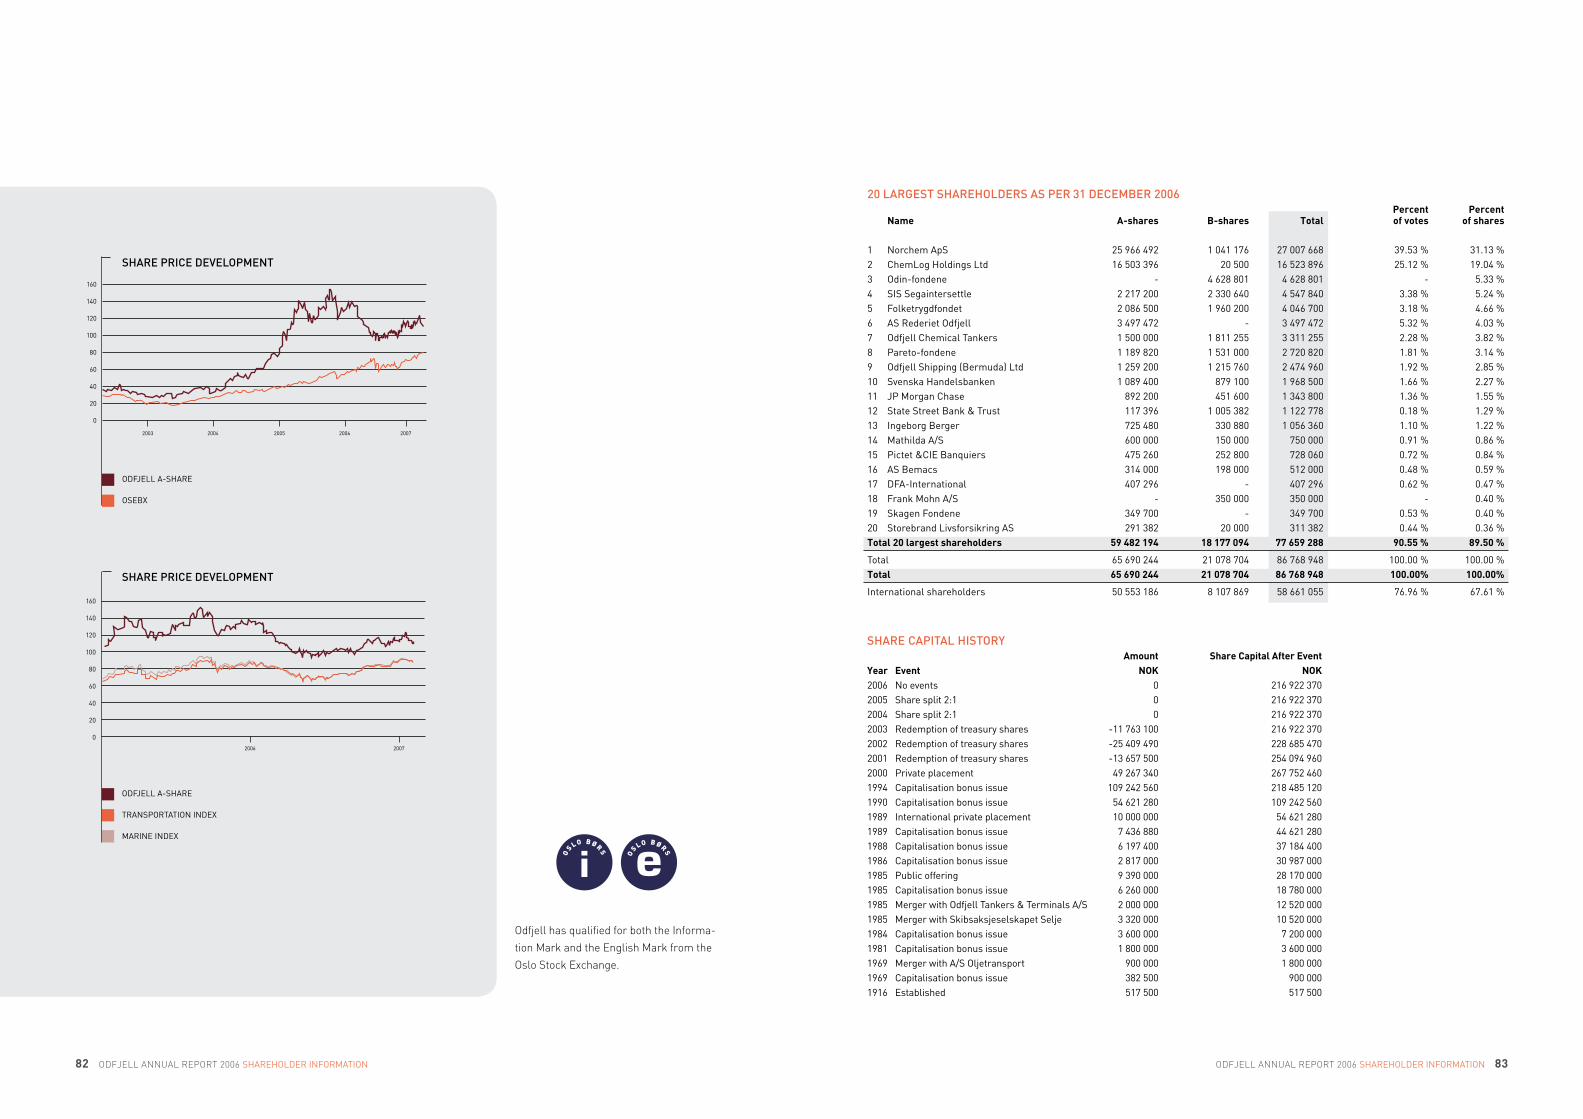
OdfJELL ASHArE
TrANSPOrTATION INdEX
MArINE INdEX
shAREPRICEDEvELoPmENT
2006 2007
OdfJELL ASHArE
OSEBX
shAREPRICEDEvELoPmENT
2003 2004 2005 2006 2007
160
140
120
100
80
60
40
20
0
160
140
120
100
80
60
40
20
0
82 ODFJELL ANNUAL REPORT 2006 SHArEHOLdEr INfOrMATION ODFJELL ANNUAL REPORT 2006 SHArEHOLdEr INfOrMATION 83
Odfjell has qualified for both the Informa-
tion Mark and the English Mark from the
Oslo Stock Exchange.
20LARGEsTshAREhoLDERsAsPER 31DECEmBER2006 Percent Percent Name A-shares B-shares Total of votes of shares
1 Norchem ApS 25 966 492 1 041 176 27 007 668 39.53 % 31.13 %2 chemLog Holdings Ltd 16 503 396 20 500 16 523 896 25.12 % 19.04 %3 Odinfondene 4 628 801 4 628 801 5.33 %4 SIS Segaintersettle 2 217 200 2 330 640 4 547 840 3.38 % 5.24 %5 folketrygdfondet 2 086 500 1 960 200 4 046 700 3.18 % 4.66 %6 AS rederiet Odfjell 3 497 472 3 497 472 5.32 % 4.03 %7 Odfjell chemical Tankers 1 500 000 1 811 255 3 311 255 2.28 % 3.82 %8 Paretofondene 1 189 820 1 531 000 2 720 820 1.81 % 3.14 %9 Odfjell Shipping (Bermuda) Ltd 1 259 200 1 215 760 2 474 960 1.92 % 2.85 %10 Svenska Handelsbanken 1 089 400 879 100 1 968 500 1.66 % 2.27 %11 JP Morgan chase 892 200 451 600 1 343 800 1.36 % 1.55 %12 State Street Bank & Trust 117 396 1 005 382 1 122 778 0.18 % 1.29 %13 Ingeborg Berger 725 480 330 880 1 056 360 1.10 % 1.22 %14 Mathilda A/S 600 000 150 000 750 000 0.91 % 0.86 %15 Pictet &cIE Banquiers 475 260 252 800 728 060 0.72 % 0.84 %16 AS Bemacs 314 000 198 000 512 000 0.48 % 0.59 %17 dfAInternational 407 296 407 296 0.62 % 0.47 %18 frank Mohn A/S 350 000 350 000 0.40 %19 Skagen fondene 349 700 349 700 0.53 % 0.40 %20 Storebrand Livsforsikring AS 291 382 20 000 311 382 0.44 % 0.36 %Total 20 largest shareholders 59 482 194 18 177 094 77 659 288 90.55 % 89.50 %
Total 65 690 244 21 078 704 86 768 948 100.00 % 100.00 %Total 65 690 244 21 078 704 86 768 948 100.00% 100.00%
International shareholders 50 553 186 8 107 869 58 661 055 76.96 % 67.61 %
shARECAPITALhIsToRY Amount Share Capital After Event Year Event NOK NOK2006 No events 0 216 922 370 2005 Share split 2:1 0 216 922 3702004 Share split 2:1 0 216 922 3702003 redemption of treasury shares 11 763 100 216 922 3702002 redemption of treasury shares 25 409 490 228 685 4702001 redemption of treasury shares 13 657 500 254 094 9602000 Private placement 49 267 340 267 752 4601994 capitalisation bonus issue 109 242 560 218 485 1201990 capitalisation bonus issue 54 621 280 109 242 5601989 International private placement 10 000 000 54 621 2801989 capitalisation bonus issue 7 436 880 44 621 2801988 capitalisation bonus issue 6 197 400 37 184 4001986 capitalisation bonus issue 2 817 000 30 987 0001985 Public offering 9 390 000 28 170 0001985 capitalisation bonus issue 6 260 000 18 780 0001985 Merger with Odfjell Tankers & Terminals A/S 2 000 000 12 520 0001985 Merger with Skibsaksjeselskapet Selje 3 320 000 10 520 0001984 capitalisation bonus issue 3 600 000 7 200 0001981 capitalisation bonus issue 1 800 000 3 600 0001969 Merger with A/S Oljetransport 900 000 1 800 0001969 capitalisation bonus issue 382 500 900 0001916 Established 517 500 517 500

Worldwide Activities
84 ODFJELL ANNUAL REPORT 2006 WOrLdWIdE AcTIvITIES ODFJELL ANNUAL REPORT 2006 WOrLdWIdE AcTIvITIES 85
RotterdamQuebec
Sao Luis
Sao Paulo
San AntonioDurban
RiyadhDubai
Shanghai
Manila
Main OfficeMarketing OfficesTank Terminals
Callao
Ningbo
Ulsan/Onsan
Campana
HamburgLondon
Melbourne
SantosRio
Buenos Aires
Dalian
Mumbai
Singapore
Houston
Tokyo
Bergen

Petrochemicals have become a part of
modern life, and in many ways our socie
ties and ways of living now depend on
such products. The petrochemical sector
has for many years been subject to solid
growth, and the worldwide use of chemi
cals has increased considerably. While
the industrial nations have been the driv
ing forces behind this growth, developing
economies around the world now account
for major increases in consumption.
Historically, the production of petro-
chemical products was based in the US
and Europe. However, production capacity
has been growing in Asia, South America,
South Africa and particularly in the
Arabian Gulf where Saudi Arabia plays
a leading role. The new plants in these
regions are mostly built for production of
base chemicals; so called building blocks,
whilst the production of derivatives and
specialty chemicals still are mostly con-
centrated in the US and Europe.
Chemical production facilities have
traditionally been located in areas with
easy access to the required raw ma-
terials. Historically, much of the petro-
chemical production was coal-based.
Naphtha, a derivative from crude oil refin-
ing, is another raw material that is widely
used, particularly in Asia. Nevertheless,
the most commonly used raw material
is derived from natural gas from which
one gets ethylene and propylene, the two
main building blocks for the chemical
industry.
New plants are still being built in areas
where natural gas is readily available,
which is why we for instance are see-
ing the biggest increases in production
capacity in the Middle East, particularly in
Iran; a country with gigantic gas reserves.
The petrochemical industry is interna-
tional with both production and consump-
tion in all regions of the world. As a result
of mergers and acquisitions, many of the
petrochemical companies have become
global in their market approach. Most of
these companies have their main focus
on Asia and China in particular; the
region with the biggest current and future
expected growth in demand for chemical
products.
As a result, the petrochemical industry
is in constant demand for logistics service
providers capable of offering different
types of storage and transportation. As of
today there are a limited number of logis-
tics service providers operating globally.
Some of these companies are specialised
for one type of service, like for instance
bulk liquid storage. There are only some
very few companies in existence with the
ability to offer a multiple of different serv-
ices on a global basis. Most shipping and
storage companies are operating locally
or within a certain region.
Odfjell is one of few companies offering
the petrochemical industry a worldwide
network of bulk shipping and storage
services. Operating through offices at
central locations around the world, Odfjell
has a global market share of around
13 % of the chemical tanker segment,
and as such is operating in all major
trade lanes. Whilst parcel or chemical
tankers only represent a small percent-
age of the total world fleet of ocean-
going tankers, for which the main cargo
is crude oil, there is a constant interplay
between the various segments of this
huge market. As far as the chemical
tanker market is concerned, there is
a constant impact by the so called handy-
size tankers, the type of ships employed
for carriage of clean petroleum products
such as naphtha, gasoline, diesel and
gasoil.
A chemical tanker is designed and
constructed in order to handle a multiple
of different types of cargoes simultane-
ously and as such, combine different
customers’ requirements under single
voyages. Different customers’ products
are always kept segregated though.
Chemical tankers are often evaluated in
two different categories; ships with all or
the majority of its cargo tanks made of
stainless steel as opposed to ships with
only coated tanks.
Ships with coated tanks are typically
engaged for carriage of commodity-type
chemicals, clean petroleum products
and vegetable oils. The biggest trade for
coated chemical tankers are with full
loads of commodity-type chemicals from
Northwest Europe, the US or the Ara-
bian Gulf to different destinations in the
Asia/Pacific region. Backhaul cargoes are
often vegetable oils, molasses or clean
petroleum products to Europe or the US.
Ships with cargo tanks made of stainless
steel are often built to handle a higher
number of different products. These ships
are used for the most specialised types
of chemical products which in addition
to the stainless steel requirement, may
also demand special handling in terms
of temperature and pressure control.
Stainless steel cargo tanks are also
required for carriage of different types of
acids. Odfjell has increasingly invested in
ships with cargo compartments made of
stainless steel.
For a global and long-term operator it is
clearly an advantage to be in possession
of a different but efficient mix of ships
and as such, be able to adjust to changing
market requirements.
Odfjell carries over 600 different generic
products every year, ranging from various
organic chemicals such as alcohols, acr-
ylates, aromatics as well as clean petro-
leum products, lubricating oils, vegetable
oils, animal fats and inorganic chemicals
like sulphuric and phosphoric acids.
With frequent sailings in all major trade
lanes Odfjell is able to offer unique and
flexible services allowing customers
to ship small parcels from 100 to 150
tons to full cargoes of up to 40 000 tons.
By entering into so called contracts of
affreightments the customer can plan
regular shipments in order to meet
required delivery targets whilst they also
help Odfjell from a scheduling point of
view. However, a significant part of the
cargoes carried by chemical tankers are
still fixed in the spot market, often by
trading companies taking advantage of
arbitrage of commodity prices.
Odfjell’s strategy involves consolidation
of loading and discharging operations at
certain key hubs for chemical distribu-
tion. Our investments in small ships for
transhipment purposes and in tank ter-
minals at major ports such as Houston,
Rotterdam, Singapore and Ulsan play an
important role in this respect.
Tank terminals are an integral part of the
chemical logistic chain and their services
constitute a natural link between our
traditional shipping services and inland
transportation by different modes such
as barges, railcars, trucks, ISO-contain-
ers and pipelines. Odfjell’s tank terminals
handle, store and distribute bulk liquid
chemicals to or from all different modes
of transportation.
Chemical Transportation and Storage
oRGANICChEmICALs
Rawmaterials
Coal
Gas
Crude Oil
BasicProducts
BTX
Ethylene
Propylene
Methanol
Butadiene
Derivatives
EDC
Styrene
Glycol
MTBE
Industrial alcohols
Polyester
EndProducts
Paint
Fibres
Plastics
Detergents
Oil additives
Rubber
86 ODFJELL ANNUAL REPORT 2006 cHEMIcAL TrANSPOrTATION ANd STOrAGE ODFJELL ANNUAL REPORT 2006 cHEMIcAL TrANSPOrTATION ANd STOrAGE 87
(10.6%) Odfjell
(10.1%) StoltNielsen
(3.6%) JO Tankers
(3.9%) Tokyo Marine
(23.4%) Other majors
(48.4%) Others
ThEChEmICALTANkERmARkETShips 13 000 dwt. and aboveTotal fleet about 20.2 million dwt., 726 ships
(18.9%) Odfjell
(18.0%) StoltNielsen
(6.4%) JO Tankers
(7.0%) Tokyo Marine
(32.5%) Other majors
(17.2%) Others
ThECoREChEmICALTANkERmARkET Ships 13 000 dwt. and aboveTotal fleet about 11.3 million dwt., 416 ships

Parcel Tankers
The Odfjell fleet consists of about 92
ships out of which 77 are operated
globally by Odfjell Seachem in a net-
work of shipping services as well as for
spot trading. Odfjell Seachem is our
fully owned chartering and operating
company with headquarters in Bergen,
Norway. The company is represented with
overseas offices in 13 different countries,
each with the purpose of marketing and
serving customers at their home turf.
Several of these offices have a dual role
as both commercial and operational
issues can be dealt with. Our Singapore
office has the commercial control of
14 ships employed in inter Asia trade.
The Odfjell Seachem fleet consists of
a variety of ship types; both in terms
of size, sophistication, number of tanks,
tank configuration and other criteria of
importance for our clients. Fleet develop-
ment and utilization are therefore critical
success factors in the daily management
and running of the fleet.
Flexibility and inter-changeability of ships
between trade lanes have always been
an important factor. Some of the ships
are involved in a “round the world” trade,
servicing ports in Europe, the US, Asia
Pacific and Africa. Our 16 state-of-the-
art 37 500 dwt fully stainless steel ships
constitute an important backbone of this
service. Our 40 000 dwt newbuildings
from Poland, of which seven have been
delivered, have also successfully started
to contribute to our overall ability to serve
customers world-wide. These ships have
40 tanks, made of duplex stainless steel,
and represent the highest level of flexibil-
ity yet to be built. Delivery of the remain-
ing units is scheduled from 2007 through
2010. Odfjell Seachem has contracts for
another 12 ships, eight for long term time
charter and four for inclusion on a pool
basis. These are all newbuildings in sizes
from 19 500 – 33 000 dwt; scheduled for
delivery from different Japanese yards in
a period from 2007 to 2009.
Odfjell has also an agreement with the
state owned Russian shipyard “Sevmash”
at Severodvinsk near Archangel to build
a series of eight to twelve advanced
product/chemical carriers. The first ship
in the series will be delivered in Octo-
ber 2007. These will be IMO type II fully
coated vessels of about 45 000 dwt. and
will replace some of our older single
hull chemical carriers. We expects an
enhanced commercial demand for such
ships due to stricter IMO rules for car-
riage of vegetable oils and certain other
bulk liquid products by double-hulled
chemical tankers. The new rules came
to effect as from January 2007.
Odfjell therefore has a significant order
book and is well positioned to meet future
demands both with regards to capacity,
age restrictions and quality as required
by the major oil and chemical companies.
Odfjell has been a supporter of high
standards of chemical tankers since the
inception of the industry and has there-
fore taken a proactive approach towards
PARCEL TANKERS Figures in 2006 2005 2004 2003 2002 2001 2000 1999 1998 1997Gross revenue uSd mill. 939 915 814 739 714 728 604 489 458 521 Operating result before depreciation and gain (loss) on sale of fixed assets (EBITdA) uSd mill. 202 216 159 120 116 164 90 71 78 100 Operating result (EBIT) uSd mill. 106 138 85 47 48 100 31 36 48 97 Total assets uSd mill. 1 739 1 597 1 467 1 296 1 260 1 294 1 346 1 130 volume shipped 1 000 tons 20 658 22 156 22 614 21 232 22 123 21 083 19 633 11 037 11 619 11 326 Number of products shipped 562 551 587 593 535 545 579 515 389 368 Number of parcels shipped 6 351 6 760 5 612 5 137 4 881 4 818 5 138 4 669 5 306 5 356 Port calls 6 030 6 234 3 991 3 704 3 586 3 699 3 316 2 606 2 486 2 367 Number of ships 92 93 95 98 86 88 85 63 49 50 Total deadweight 1 000 tons 2 362 2 393 2 447 2 480 2 335 2 413 2 339 1 716 1 567 1 596
88 ODFJELL ANNUAL REPORT 2006 PArcEL TANKErS ODFJELL ANNUAL REPORT 2006 PArcEL TANKErS 89
HOuSTON/rOTTErdAM
HOuSTON/fAr EAST
FREIGhTRATEs
79 81 83 85 87 89 91 93 95 97 99 01 03 05
150
125
100
75
50
25
0
3 000 tons easy grade chemicalsuSd/Ton
Source: Quincannon
HOuSTON/rOTTErdAM
HOuSTON/fAr EAST
FREIGhTRATEs
88 90 92 94 96 98 00 02 04 06
150
125
100
75
50
25
0
1 000 tons stainless steel grades chemicalsuSd/Ton
Source: Quincannon
Source: cMAI
ChEmICALANDPLAsTICsGRoWThhAsouTPACEDGDPGRoWThovERThELAsTTWoDECADEs
85 87 89 91 93 95 97 99 01 03 05 07 09 11
325
300
275
250
225
200
175
150
125
100
BASIS cHEMIcALS & PLASTIc INdEX
GdP INdEX
dELIvErIES
AcTuALLy dEMOLISHEd
OrdErBOOK
vESSEL OuTPHASING
dELIvErIES IN % Of EXISTING fLEET
CoREChEmICALDEEPsEAFLEETChANGEs1992-2010
1.600
1.200
800
400
0
400
800
92 94 96 98 00 02 04 06 08 10
Source: Odfjell

international regulatory bodies and major
customers in order to improve safety. The
three to four largest oil- and chemical
companies typically inspect every ship
once a year.
The 14 ships operated out of our office
in Singapore are traded intra North East
Asia, intra South East Asia and we are of-
fering regular services between these two
regions. Petrochemical trade to and from
China continues to increase, and more
and more ports for transfer of petro-
chemical products are being introduced.
Our Singapore office is also responsi-
ble for running regular parcel services
between Asia-Pacific and Australia/New
Zealand as well as services between
Asia-Pacific and AG/India/Africa.
Volumes shipped deep-sea as well as
regionally are steadily increasing. As
end-users of petrochemicals require
products delivered on shorter notice and
with less lead-time, the major petro-
chemical producers are building petro-
chemical production complexes closer
to their markets, whilst manufacturers
with production facilities far from the
markets like those located in the Middle
East, to a larger extent seem to base their
logistics on keeping sufficient invento-
ries in the proximity of their customers.
Consequently, the demand for modern
quality carriers, large, small and of dif-
ferent configuration and capabilities are
all on the rise. The key to being able to
serve the customer in the best and most
economical manner is to be in possession
of the right size and type of ships for the
right trade.
In addition to wanting a major position in
the increasingly important and growing
inter Asian trades, Odfjell Seachem also
aims to offer its global customers trans-
shipment to restricted ports. Consolida-
tion of loading and discharging operations
for the deep-sea fleet is also of great
importance. By reducing port calls and
thereby reducing risk of delays, Odfjell
Seachem is able to offer a more reliable
and economical service to our customers.
oDFJELLAhRENkIELThe 50/50 joint venture with Ahrenkiel
for marketing and operation of chemical
tankers in inter-European trade became
operational in January 2004. Odfjell
Ahrenkiel, based in Hamburg, currently
operates a fleet of nine chemical tankers
of which eight are the advanced Multitank
ships of 5 870 dwt. Four of these ships
were acquired by Odfjell in April 2005.
During its first three years of operation
the company has firmly established itself
as a reliable carrier in the inter-European
trade. Odfjell Ahrenkiel carried 0.5 million
tons of cargo in 2006.
FLumAROdfjell owns 50 % of the Brazilian ship-
ping company Flumar. Operating out of
Sao Paulo, Brazil, the company‘s core
business is transportation of bulk liquid
chemicals and gases primarily on the
Brazilian coast and within the Mercosul
area. Presently, the company operates
four chemical tankers and one LPG ship,
ranging in size from 4 400 to 12 450 dwt.
Combined, Odfjell and Flumar are able to
provide customers with enhanced service
capabilities. Furthermore, the extensive
network of associated terminals in Brazil
and Argentina adds important flexibility
towards our customers’ logistical require-
ments. Flumar carried more than 1.5
million tons of cargo in 2006.
oDFJELLYvAPoREsThrough the 50/50 joint venture company,
Odfjell y Vapores, we carried 1.6 million
tons of cargo in 2006, primarily sulphuric
acid along the Chilean coast.
90 ODFJELL ANNUAL REPORT 2006 PArcEL TANKErS ODFJELL ANNUAL REPORT 2006 PArcEL TANKErS 91

Odfjell has six fully or partly owned
terminals at strategic locations around
the world. In addition we are cooperating
closely with eight associated terminals
in South America. In total, our tank ter-
minal network now employs more than
860 people and offers close to 2.8 mil-
lion cbm of storage space in about 930
tanks in 15 ports around the world. This
makes us one of the world-leaders in
combined shipping and storage servic-
es. We have a strategy of expanding the
tank terminal activities along Odfjell’s
major shipping lanes. We also focus on
strategic ports in newly industrialized
countries, in order to improve the devel-
opment of chemical markets. In addition
to being profitable investments on a
stand-alone basis, our tank terminals
also play an important operational role
in our cargo-consolidation programme
to reduce the time our ships spend in
port. Commercially, the combination of
shipping and tank terminals gives Odfjell
an excellent position to offer complete
logistics packages to our customers.
The demand for combined services has
steadily increased as a result of the
industry’s ongoing pursuit of improving
efficiency in the supply chain.
oDFJELLTERmINALs(housToN)LP-housToN,TEXAs,usA(oTh)Houston is the major international hub
for import and export of chemicals in the
US. Our terminal in Houston was built by
Odfjell in 1983, and since the mid 1990’s
the terminal has been through a consid-
erable expansion period. The capacity
has been increased by close to 70%. The
expansions have improved the profitabil-
ity through a better utilization of already
existing and costly infrastructure.
The tank terminal comprises 92 tanks
ranging from 350 cbm to 9 000 cbm and
has a total capacity of about 272 000
cbm. The tank terminal comprises the
largest stainless steel storage capacity
of any privately owned tank terminal in
the world, in total 90 000 cbm.
The facilities’ unused land and existing
infrastructure provide good opportuni-
ties for further expansion, with potential
storage capacity of around 350 000 cbm
in the existing area.
Odfjell Terminals (Houston) is the hub
for Odfjell’s global and regional trades
to and from the US Gulf. The realisation
of synergies has been prioritised and
the company’s joint transportation and
storage contracts have helped in this
respect.
oDFJELLTERmINALs(RoTTERDAm)Bv–RoTTERDAm,ThENEThERLANDs(oTR)Located at the heart of Rotterdam
harbor, the most important chemical
distribution centre in Europe, Odfjell
Terminals (Rotterdam) has a total stor-
age capacity of about 1 540 000 cbm,
and around 300 storage tanks. OTR is
one of the largest facilities of its kind in
the world. The tank terminal stores both
chemicals and mineral oil products.
The chemical storage capacity is 610
000 cbm, while the mineral oil capacity
is about 930 000 cbm. In addition to the
storage business, the facility has an in-
dustrial distillation plant, which retains
a large market share of the independent
product distillation market in northwest
Europe.
Part of the storage capacity can be
shifted from one segment to another,
including servicing the distillation busi-
ness. This provides us a great flexibility
and diversifies commercial risk.
The tank terminal has excellent infra-
structure, with four berths for seagoing
ships and eleven berths for barges.
It also has extensive facilities for the
handling of trucks, rail cars and ISO-
containers. The site has its own water
treatment plant that also serves third
parties.
The facility is already one of the most
important docking facilities for Odfjell in
the Rotterdam-Antwerp area, and our
goal is to make it the primary hub for our
global trade to and from Europe.
oILTANkINGoDFJELLTERmINALsINGAPoREPTELTD–sINGAPoRE(ooTs)As one of the busiest ports in the world,
Singapore plays a major role in the
distribution of petrochemicals in South
East Asia. Singapore also has a high
concentration of refinery capacity as
well as a large and diversified chemical
production. Further growth is secured
through its prime location, good infra-
structure and a stable economy and
government. Oiltanking Odfjell Terminal
Singapore is located on Jurong Island,
where most of Singapore’s development
of petrochemical industry is concen-
trated.
The tank terminal, which became opera-
tional in 2001, has a total capacity of 213
000 cbm in 51 tanks, ranging from 800
cbm to 18 000 cbm. The stainless steel
capacity is around 5 000 cbm. More than
100 000 cbm of the capacity is commit-
ted on long-term contracts. With access
to additional land, the tank terminal
can eventually grow to about 300 000
cbm. The terminal has two modern ship
berths, and has access to another two
berths.
The flexible storage and transfer ser-
vices offered by the terminal, along with
excellent marine facilities create a good
basis for Odfjell to develop a hub for the
global and regional shipping services in
South East Asia.
The tank terminal is a 50/50 joint ven-
ture, in which Oiltanking is the managing
partner.
oILTANkINGoDFJELLTERmINALs&CoL.L.C-sohAR,omAN(ooT)Sohar Industrial Port is strategically
located in Oman outside the Strait of
Hormuz only a few hours driving form
the petrochemical industry in UAE,
Saudi Arabia and Qatar. Several world
scale petrochemical complexes are
currently under construction in the port.
This development is driven by the desire
of the Sultanate of Oman to exploit
the nations gas reserves and create a
strong “value added process economy”
as opposed to a energy export economy.
OOT has the exclusive right to manage
six liquid berths and provide bulk liquid
storage within Sohar Industrial Port.
Odfjell holds 35 % of the company, with
the others partners being Oiltanking
Tank Terminals
TANK TERMINALS Figures in 2006 2005 2004 2003 2002 2001 2000 1999 1998 1997Gross revenue uSd mill. 152 132 130 118 97 90 59 32 28 27 Operating result before depreciation and gain (loss) on sale of fixed assets (EBITdA) uSd mill. 58 48 49 45 38 35 25 16 13 13 Operating result (EBIT) uSd mill. 51 33 29 27 22 23 16 11 8 9 Total assets uSd mill. 499 393 352 343 336 274 243 129
Tank capacity 1 000 cbm. 2 256 2 256 2 256 2 256 2 155 2 155 1 917 354 315 255
92 ODFJELL ANNUAL REPORT 2006 TANK TErMINALS ODFJELL ANNUAL REPORT 2006 TANK TErMINALS 93
oDFjeLL TerMinaLS (korea), onSan
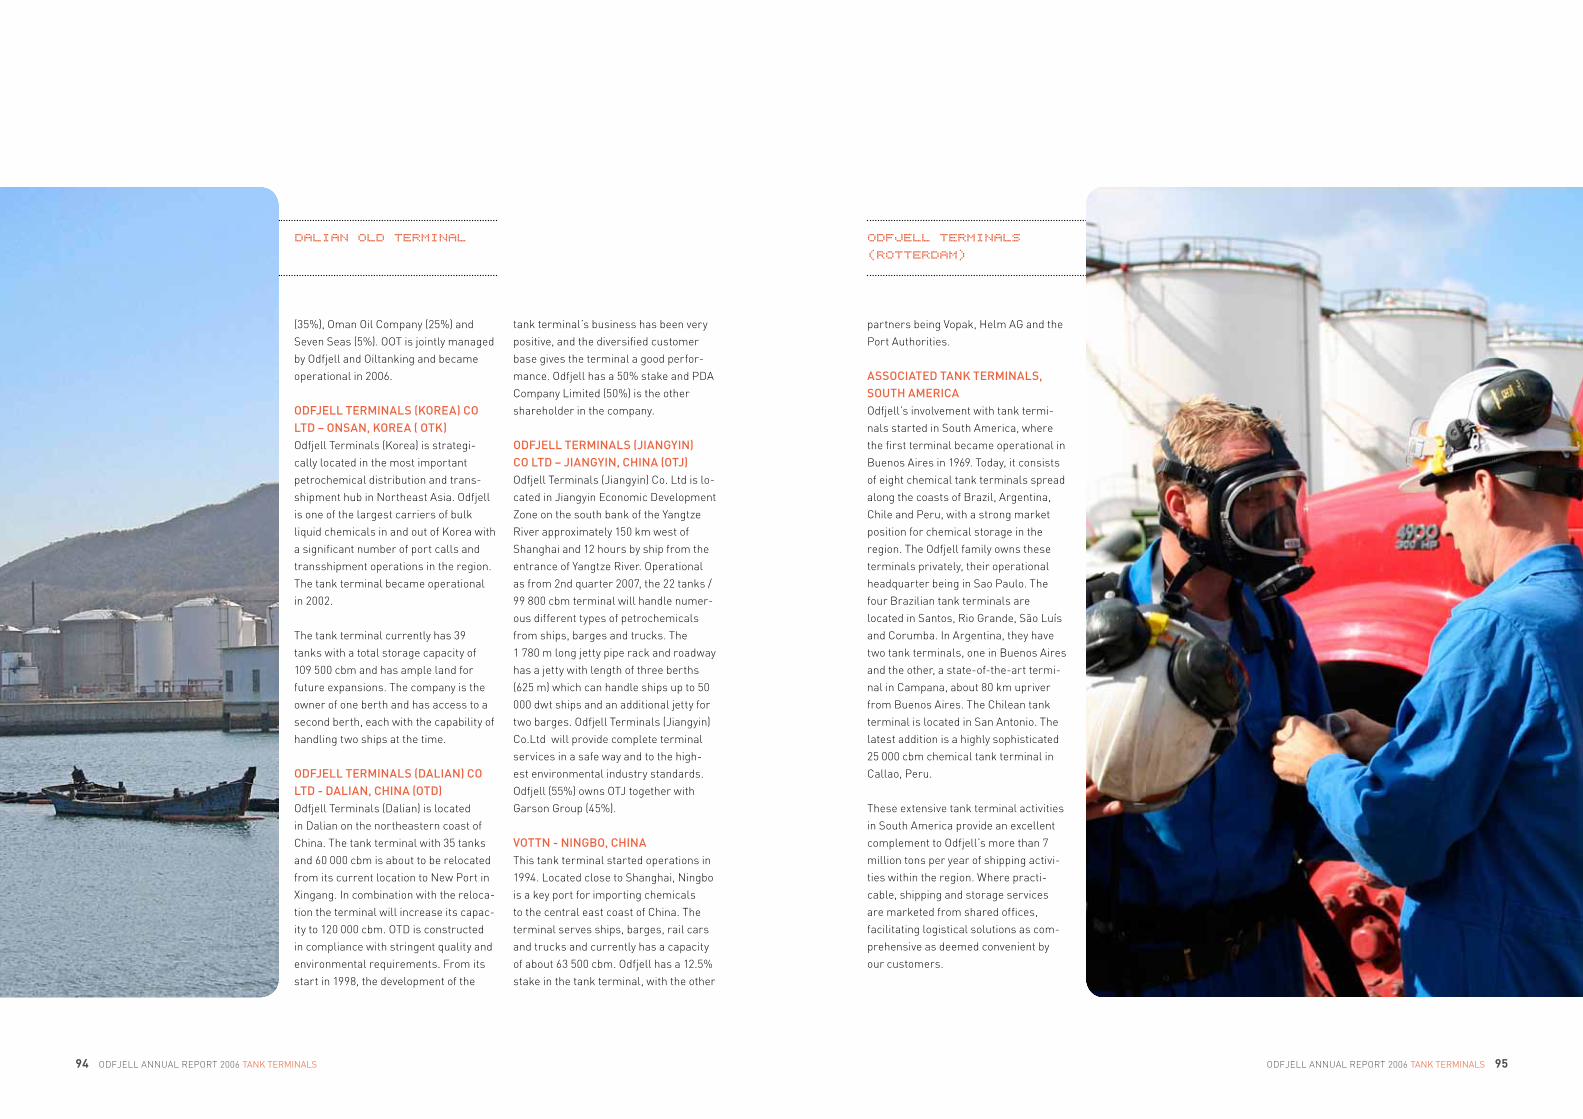
(35%), Oman Oil Company (25%) and
Seven Seas (5%). OOT is jointly managed
by Odfjell and Oiltanking and became
operational in 2006.
oDFJELLTERmINALs(koREA)CoLTD–oNsAN,koREA(oTk)Odfjell Terminals (Korea) is strategi-
cally located in the most important
petrochemical distribution and trans-
shipment hub in Northeast Asia. Odfjell
is one of the largest carriers of bulk
liquid chemicals in and out of Korea with
a significant number of port calls and
transshipment operations in the region.
The tank terminal became operational
in 2002.
The tank terminal currently has 39
tanks with a total storage capacity of
109 500 cbm and has ample land for
future expansions. The company is the
owner of one berth and has access to a
second berth, each with the capability of
handling two ships at the time.
oDFJELLTERmINALs(DALIAN)CoLTD-DALIAN,ChINA(oTD)Odfjell Terminals (Dalian) is located
in Dalian on the northeastern coast of
China. The tank terminal with 35 tanks
and 60 000 cbm is about to be relocated
from its current location to New Port in
Xingang. In combination with the reloca-
tion the terminal will increase its capac-
ity to 120 000 cbm. OTD is constructed
in compliance with stringent quality and
environmental requirements. From its
start in 1998, the development of the
tank terminal’s business has been very
positive, and the diversified customer
base gives the terminal a good perfor-
mance. Odfjell has a 50% stake and PDA
Company Limited (50%) is the other
shareholder in the company.
oDFJELLTERmINALs(JIANGYIN)CoLTD–JIANGYIN,ChINA(oTJ)Odfjell Terminals (Jiangyin) Co. Ltd is lo-
cated in Jiangyin Economic Development
Zone on the south bank of the Yangtze
River approximately 150 km west of
Shanghai and 12 hours by ship from the
entrance of Yangtze River. Operational
as from 2nd quarter 2007, the 22 tanks /
99 800 cbm terminal will handle numer-
ous different types of petrochemicals
from ships, barges and trucks. The
1 780 m long jetty pipe rack and roadway
has a jetty with length of three berths
(625 m) which can handle ships up to 50
000 dwt ships and an additional jetty for
two barges. Odfjell Terminals (Jiangyin)
Co.Ltd will provide complete terminal
services in a safe way and to the high-
est environmental industry standards.
Odfjell (55%) owns OTJ together with
Garson Group (45%).
voTTN-NINGBo,ChINAThis tank terminal started operations in
1994. Located close to Shanghai, Ningbo
is a key port for importing chemicals
to the central east coast of China. The
terminal serves ships, barges, rail cars
and trucks and currently has a capacity
of about 63 500 cbm. Odfjell has a 12.5%
stake in the tank terminal, with the other
partners being Vopak, Helm AG and the
Port Authorities.
AssoCIATEDTANkTERmINALs,souThAmERICAOdfjell’s involvement with tank termi-
nals started in South America, where
the first terminal became operational in
Buenos Aires in 1969. Today, it consists
of eight chemical tank terminals spread
along the coasts of Brazil, Argentina,
Chile and Peru, with a strong market
position for chemical storage in the
region. The Odfjell family owns these
terminals privately, their operational
headquarter being in Sao Paulo. The
four Brazilian tank terminals are
located in Santos, Rio Grande, São Luís
and Corumba. In Argentina, they have
two tank terminals, one in Buenos Aires
and the other, a state-of-the-art termi-
nal in Campana, about 80 km upriver
from Buenos Aires. The Chilean tank
terminal is located in San Antonio. The
latest addition is a highly sophisticated
25 000 cbm chemical tank terminal in
Callao, Peru.
These extensive tank terminal activities
in South America provide an excellent
complement to Odfjell’s more than 7
million tons per year of shipping activi-
ties within the region. Where practi-
cable, shipping and storage services
are marketed from shared offices,
facilitating logistical solutions as com-
prehensive as deemed convenient by
our customers.
oDFjeLL TerMinaLS (roTTerDaM)
DaLian oLD TerMinaL
94 ODFJELL ANNUAL REPORT 2006 TANK TErMINALS ODFJELL ANNUAL REPORT 2006 TANK TErMINALS 95

Odfjell is a fully integrated shipping
company incorporating all functions
required to ensure the provision of
reliable high-quality transportation
services. Owning ships and taking
responsibility for chartering, operations
and ship management ensure effec-
tive co-ordination and common priori-
ties across all our operations. As ships
account for about 75% of our total fixed
assets, it is vital that the fleet is man-
aged and operated efficiently, assets are
protected and values maintained.
The number of vessels managed by
Odfjell Ship Management has increased
significantly over the last two years. The
recent reorganisation of Ship Manage-
ment is implemented to safeguard the
development of competence and to en-
sure support to the vessels. Our primary
focus is on ensuring quality management.
shIPsOur ship maintenance programme en-
sures safe and efficient operation, a long
useful life and high second-hand values.
The maintenance is managed through
our computerised Planned Maintenance
System, which is certified by Det Norske
Veritas (DNV). Surface protection and
maintenance of tanks, structures and
machinery are based on thorough as-
sessments, with periodical dry-docking
carried out normally every 30 months.
Our ship management division takes care
of Odfjell’s ships and also three ships
owned by National Chemical Carriers Ltd
Co in Saudi Arabia. This includes crewing,
technical operation and maintenance,
purchasing, safety assurance and
insurance.
In 2004 we established an Odfjell ship
management branch office in Singapore.
This unit manages ships in regional
trades as well as ships in the
deep-sea fleet.
CREWThe safe operation of chemical tank-
ers depends on highly qualified officers
and crew. Our ships are registered in
Norway (NIS) and Singapore, and are
mainly manned by Norwegian and Filipino
seafarers with long experience from
chemical tankers.
Odfjell pays considerable attention to
recruiting qualified officers and crew and,
at any given time more than 100 seafar-
ers are normally working as trainees or
cadets.
Training of officers and crew is a key area
to ensuring quality management. Odfjell
allocates significant resources to train-
ing. In 2006 we met our target of close
to 9 000 training/ man/ days at Odfjell
Academy, and further development is in
progress.
RIskmANAGEmENTShip Management actively evolve our cur-
rent use of Risk Management to maintain
and improve our performance.
Every year Odfjell carries out regular
internal audits of all ships. Customers
make inspections through the Chemical
Distribution Institute (CDI) and the Oil
Companies International Marine Forum
(OCIMF). Periodical surveys are carried
out by various classification societies, flag
states and port states. DNV performs ISM
Code inspections of our ships’ quality sys-
tems. When ships or offices report critical
situations, accidents, non-conformances
or possible improvements through our
Safety and Improvement Reporting
System proper response is prepared
and corrective actions implemented. Our
Quality Board, at senior management
level, takes action on major issues. We
view this system as an effective tool in
our work to increase safety and to prevent
injuries, damage and losses.
In 2006 Ship Management has imple-
mented a number of Key Performance
Indicators. Measuring and following up of
the performance related to these indica-
tors are important tools in monitoring
performance.
The initiative titled “Tanker Management
and Self Assessment” (TMSA) introduced
by the Oil Companies International
Marine Forum (OCIMF) requires ship
managers responsible for tankers to
demonstrate the effectiveness of their
management system. Odfjell’s Ship
Management has now put in place the
processes to achieve the higher levels for
several operational elements specified by
the TMSA guide.
CommuNICATIoNAn in-house Information Technology and
Communication network provides ship-
to-shore communication and the elec-
tronic exchange of databases. All ships
and offices are connected to this system,
thus ensuring swift communication and
rapid exchange of information needed to
operate and manage our ships safely and
efficiently.
Ship Management
ODFJELL ANNUAL REPORT 2006 SHIP MANAGEMENT 96 ODFJELL ANNUAL REPORT 2006 SHIP MANAGEMENT 97
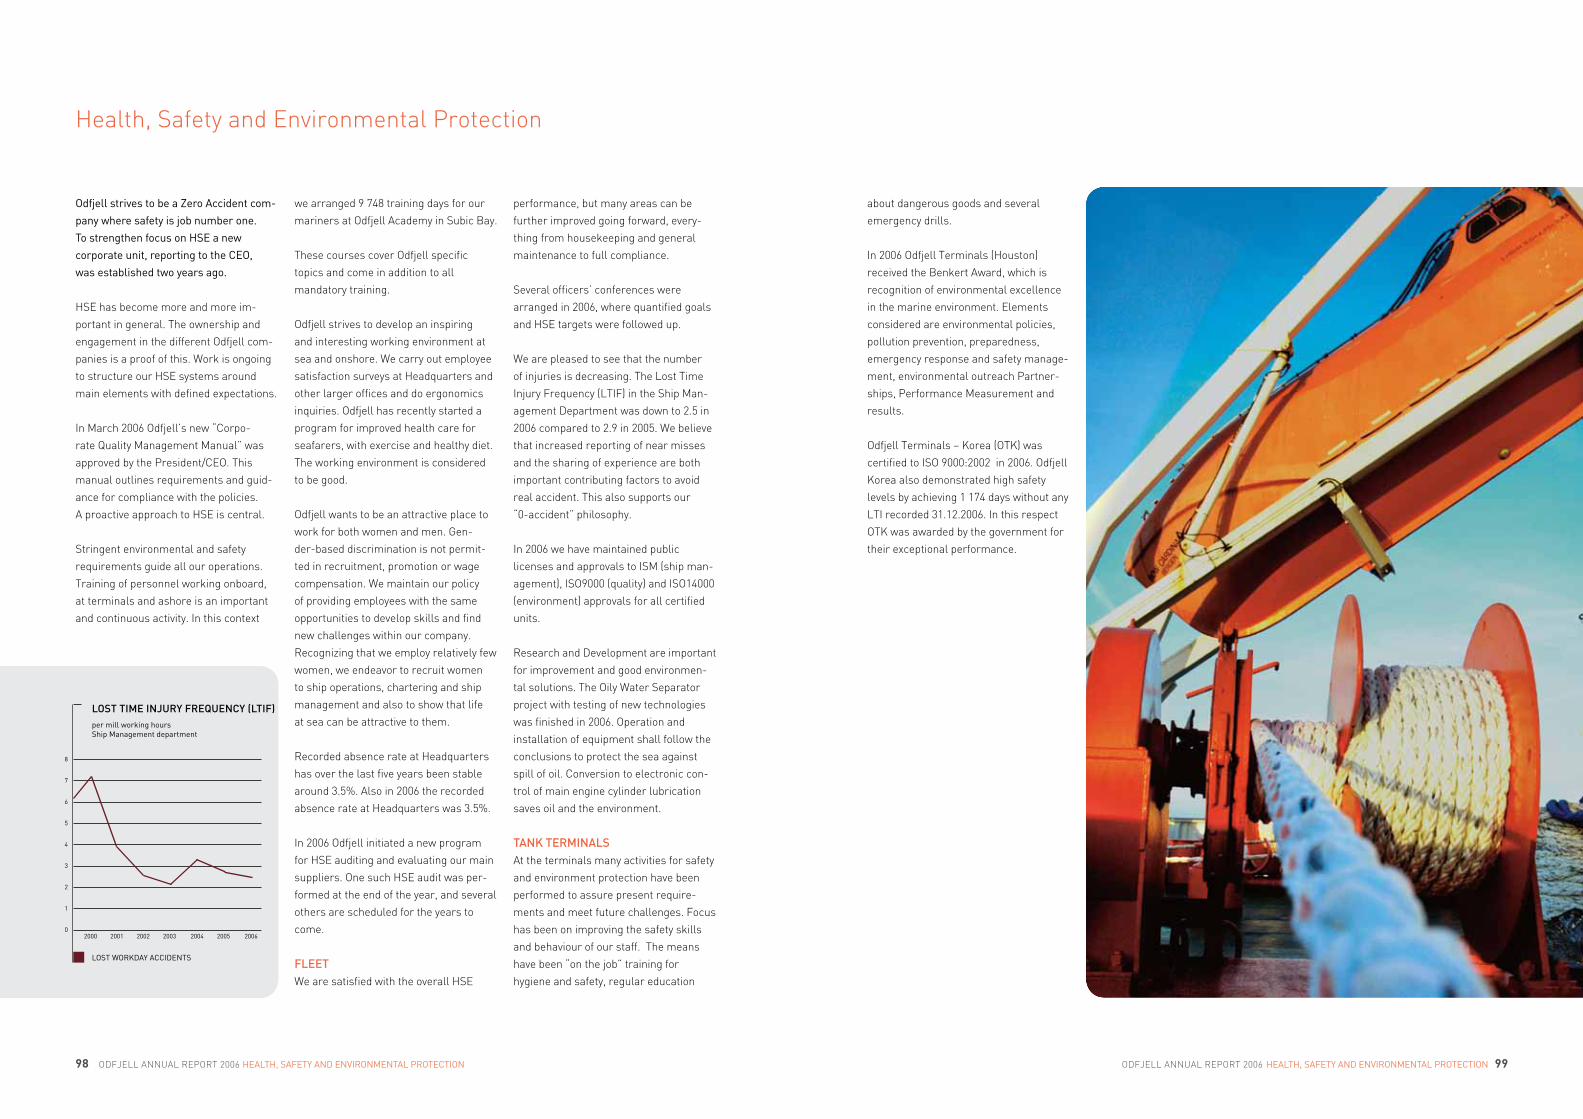
Odfjell strives to be a Zero Accident com
pany where safety is job number one.
To strengthen focus on HSE a new
corporate unit, reporting to the cEO,
was established two years ago.
HSE has become more and more im-
portant in general. The ownership and
engagement in the different Odfjell com-
panies is a proof of this. Work is ongoing
to structure our HSE systems around
main elements with defined expectations.
In March 2006 Odfjell’s new “Corpo-
rate Quality Management Manual” was
approved by the President/CEO. This
manual outlines requirements and guid-
ance for compliance with the policies.
A proactive approach to HSE is central.
Stringent environmental and safety
requirements guide all our operations.
Training of personnel working onboard,
at terminals and ashore is an important
and continuous activity. In this context
we arranged 9 748 training days for our
mariners at Odfjell Academy in Subic Bay.
These courses cover Odfjell specific
topics and come in addition to all
mandatory training.
Odfjell strives to develop an inspiring
and interesting working environment at
sea and onshore. We carry out employee
satisfaction surveys at Headquarters and
other larger offices and do ergonomics
inquiries. Odfjell has recently started a
program for improved health care for
seafarers, with exercise and healthy diet.
The working environment is considered
to be good.
Odfjell wants to be an attractive place to
work for both women and men. Gen-
der-based discrimination is not permit-
ted in recruitment, promotion or wage
compensation. We maintain our policy
of providing employees with the same
opportunities to develop skills and find
new challenges within our company.
Recognizing that we employ relatively few
women, we endeavor to recruit women
to ship operations, chartering and ship
management and also to show that life
at sea can be attractive to them.
Recorded absence rate at Headquarters
has over the last five years been stable
around 3.5%. Also in 2006 the recorded
absence rate at Headquarters was 3.5%.
In 2006 Odfjell initiated a new program
for HSE auditing and evaluating our main
suppliers. One such HSE audit was per-
formed at the end of the year, and several
others are scheduled for the years to
come.
FLEETWe are satisfied with the overall HSE
performance, but many areas can be
further improved going forward, every-
thing from housekeeping and general
maintenance to full compliance.
Several officers’ conferences were
arranged in 2006, where quantified goals
and HSE targets were followed up.
We are pleased to see that the number
of injuries is decreasing. The Lost Time
Injury Frequency (LTIF) in the Ship Man-
agement Department was down to 2.5 in
2006 compared to 2.9 in 2005. We believe
that increased reporting of near misses
and the sharing of experience are both
important contributing factors to avoid
real accident. This also supports our
“0-accident” philosophy.
In 2006 we have maintained public
licenses and approvals to ISM (ship man-
agement), ISO9000 (quality) and ISO14000
(environment) approvals for all certified
units.
Research and Development are important
for improvement and good environmen-
tal solutions. The Oily Water Separator
project with testing of new technologies
was finished in 2006. Operation and
installation of equipment shall follow the
conclusions to protect the sea against
spill of oil. Conversion to electronic con-
trol of main engine cylinder lubrication
saves oil and the environment.
TANkTERmINALsAt the terminals many activities for safety
and environment protection have been
performed to assure present require-
ments and meet future challenges. Focus
has been on improving the safety skills
and behaviour of our staff. The means
have been “on the job” training for
hygiene and safety, regular education
Health, Safety and Environmental Protection
LosTTImEINJuRYFREQuENCY(LTIF)
2000 2001 2002 2003 2004 2005 2006
8
7
6
5
4
3
2
1
0
per mill working hours Ship Management department
LOST WOrKdAy AccIdENTS
about dangerous goods and several
emergency drills.
In 2006 Odfjell Terminals (Houston)
received the Benkert Award, which is
recognition of environmental excellence
in the marine environment. Elements
considered are environmental policies,
pollution prevention, preparedness,
emergency response and safety manage-
ment, environmental outreach Partner-
ships, Performance Measurement and
results.
Odfjell Terminals – Korea (OTK) was
certified to ISO 9000:2002 in 2006. Odfjell
Korea also demonstrated high safety
levels by achieving 1 174 days without any
LTI recorded 31.12.2006. In this respect
OTK was awarded by the government for
their exceptional performance.
98 ODFJELL ANNUAL REPORT 2006 HEALTH, SAfETy ANd ENvIrONMENTAL PrOTEcTION ODFJELL ANNUAL REPORT 2006 HEALTH, SAfETy ANd ENvIrONMENTAL PrOTEcTION 99

Fleet Overview
fLEET OvErvIEW as per 6 March 2007 Stainless Number Ship Year built Dwt Cbm steel, Cbm of tanksOWNEd: Bow Sirius 2006 40 005 52 126 52 126 40 Bow Sea 2006 40 048 52 126 52 126 40 Bow Summer 2005 40 036 52 126 52 126 40 Bow Sky 2005 40 005 52 126 52 126 40 Bow Spring¹ 2004 39 942 52 126 52 126 40 Bow Star¹ 2004 39 832 52 126 52 126 40 Bow Sun 2003 39 842 52 126 52 126 40 Bow firda¹ 2003 37 427 40 515 40 515 47 Bow chain¹ 2002 37 518 40 515 40 515 47 Bow favour 2001 37 438 40 515 40 515 47 Bow century 2000 37 438 40 515 40 515 47 Bow fortune 1999 37 395 40 515 40 515 47 Bow Master 1999 6 046 6 878 6 878 14 Bow Mate 1999 6 001 6 864 6 864 14 Bow Pilot 1999 6 000 6 865 6 865 14 Bow Sailor 1999 6 000 6 870 6 870 14 Bow cecil¹ 1998 37 345 40 515 33 236 47 Bow flora 1998 37 369 40 515 33 236 47 Bow Balearia 1998 5 870 5 941 5 941 20 Bow Oceanic 1997 17 460 18 620 18 620 24 Bow Bracaria 1997 5 870 5 941 5 941 20 Bow Brasilia 1997 5 870 5 941 5 941 20 Bow cardinal 1997 37 446 41 487 34 208 52 Bow faith 1997 37 479 41 487 34 208 52 Bow Bahia 1996 5 870 5 941 5 941 20 Bow Querida 1996 10 115 10 956 10 956 18 Bow cedar 1996 37 455 41 608 34 329 52 Bow fagus 1995 37 375 41 608 34 329 52 Bow clipper 1995 37 166 41 492 34 213 52 Bow flower 1994 37 221 41 492 34 213 52 Bow Eagle 1988 24 728 32 458 19 662 25 Bow cheetah 1988 40 258 47 604 29 Bow Leopard 1988 40 249 47 604 29 Bow Lion 1988 40 272 47 604 29 Bow Peace 1987 45 655 52 173 2 167 23 Bow Power 1987 45 655 52 173 2 167 23 Bow Pride 1987 45 655 52 173 2 167 23 Bow Prima 1987 45 655 52 173 2 167 23 Bow Prosper 1987 45 655 52 173 2 167 23 Bow fertility 1987 45 507 52 173 2 167 23 Bow fraternity 1987 45 507 52 173 2 167 23 Bow Panther 1986 40 263 47 604 29 Bow Puma 1986 40 092 47 604 29 Bow Hunter 1983 23 002 25 026 21 031 28 Bow Maasstad 1983 38 039 48 866 22 Bow Maasstroom 1983 38 039 48 866 22 Bow Maasslot 1982 38 039 48 866 22 Bow fighter 1982 34 982 41 184 6 299 34 Owl Trader 1982 12 450 14 482 8 070 22 Bow Pioneer 1982 23 016 25 965 20 969 28 Bow viking 1981 33 590 40 956 21 745 36 Bow Lancer 1980 35 100 42 468 6 252 34 Bow Lady 1978 32 225 41 354 3 077 42 Bao Hai Tun (49 %) 2006 3 845 4 361 10 flumar Aratu (50 %) 1997 13 834 15 831 15 831 29 Angelim (50 %) 1985 10 259 10 136 6 500 18 Araucaria (50 %) 1984 10 259 10 159 6 500 18 Bow Pacifico (50 %) 1982 18 657 22 929 10 849 31 Jatai (50 %, LPG) 1979 4 452 4 031 3 Bow condor (50 %) 1978 27 950 34 656 21 035 43 TIMEcHArTErEd: Bow fuji 2006 19 800 22 140 22 140 22 Bow Ophelia³ 2006 19 900 22 655 22 655 20
100 ODFJELL ANNUAL REPORT 2006 fLEET OvErvIEW
Bow Plata 2006 19 807 22 143 22 143 22 Bow Engineer 2006 30 086 35 548 35 548 28 Bow Orania³ 2006 19 993 22 050 22 050 20 Bow Architect 2005 30 058 36 000 36 000 28 Bow rio 2005 19 990 21 408 21 408 22 Bow Europe 2005 19 727 21 573 21 573 36 Bow Santos 2004 19 997 21 846 21 846 22 Bow Asia 2004 9 901 10 866 10 866 20 Bow Singapore 2004 9 888 10 867 10 867 20 Bow Americas 2004 19 707 22 050 22 050 36 Bow de rich 2003 12 452 13 300 13 300 22 Bow Wallaby 2003 11 951 13 485 13 485 22 Bow de feng 2002 12 514 13 289 13 289 22 Bow West 2002 12 503 13 299 13 299 22 Bow Andino 2000 16 121 17 270 17 270 30 Bow de Jin 1999 11 752 12 296 12 296 20 Multitank Batavia³ 1998 5 870 5 941 5 941 20 Multitank Badenia³ 1997 5 870 5 941 5 941 20 Multitank Bolognia³ 1997 5 870 5 941 5 941 20 Multitank Britannia³ 1996 5 870 5 941 5 941 20 Ncc Jubail³ 1996 37 499 41 488 34 209 52 Ncc Mekka³ 1995 37 272 41 588 34 257 52 Ncc riyad³ 1995 37 274 41 492 34 213 52 Bow Antisana² 1989 8 192 9 899 5 777 22 Bow Gorgonilla² 1989 8 192 9 899 5 777 22 Ncc Baha³ 1988 24 728 32 458 19 662 25 Ncc Asir³ 1983 23 001 24 965 20 969 28 Ncc Arar³ 1982 23 002 24 965 20 969 28 Bow Orion 1977 28 083 34 656 21 035 43 Number of ships: 91 2 350 643 2 731 562 1 675 952
Yard Delivery Dwt Owner CommentON OrdEr: NB Szczecin B588/III/8 4/2007 39 500 Odfjell NB Szczecin B588/III/9 10/2009 39 500 Odfjell Option NB Szczecin B588/III/10 4/2010 39 500 Odfjell Option NB Sevmash #1 9/2007 45 000 Odfjell NB Sevmash #2 6/2008 45 000 Odfjell NB Sevmash #3 11/2008 45 000 Odfjell NB Sevmash #4 6/2009 45 000 Odfjell NB Sevmash #5 10/2009 45 000 Odfjell NB Sevmash #6 6/2010 45 000 Odfjell NB Sevmash #7 10/2010 45 000 Odfjell NB Sevmash #8 6/2011 45 000 Odfjell NB Sevmash #9 10/2011 45 000 Odfjell Option NB Sevmash #10 6/2012 45 000 Odfjell Option NB Sevmash #11 10/2012 45 000 Odfjell Option NB Sevmash #12 6/2013 45 000 Odfjell Option NB fukuoka 12/2007 19 900 Timecharter NB fukuoka 6/2008 19 900 Timecharter NB Shin Kurishima 6/2008 32 500 Timecharter NB Kitanihon 8/2008 33 000 Timecharter NB Kitanihon 10/2008 33 000 Timecharter NB Kitanihon 12/2008 33 000 Timecharter NB Shin Kurishima 6/2009 32 500 Timecharter NB Kitanihon 9/2009 33 000 Timecharter NB usuki 6/2007 19 900 variable t/c NB usuki 8/2007 19 900 variable t/c NB usuki 11/2007 19 900 variable t/c NB usuki 1/2008 19 900 variable t/c Number of newbuildings: 27 974 900 0 0 0
¹ vessel beneficially owned through financial lease.
² vessel on bareboat charter.3 vessel on variable timecharter.

mAINoFFICEodfjellAsA-odfjellseachemAsConrad Mohrsv. 29, P.O. Box 6101 Postterminalen5892 Bergen, NORWAYTel: +47 5527 0000Fax: +47 5528 4741Fax: +47 5527 9070 (Chartering/Operations)
INTERNATIoNALoFFICEsodfjellusALP12211 Port RoadSeabrook, TX 77586, USATel: +1 713 844 2200Fax: +1 713 844 2211
odfjellsingaporePteLtd6 Shenton Way, # 27-08/09 DBS Tower 2SINGAPORE 068809Tel: +65 6349 1300Fax: +65 6224 2285
odfjellJapanLtdOgawa Bldg. 8F2-2 Uchikanda 1-ChomeChiyoda-ku, Tokyo 101-0047 JAPANTel: +81 3 3259 8555Fax: +81 3 3259 8558
odfjellNetherlandsBvOude Maasweg 6, P.O. Box 50103197 XC Rotterdam-BotlekThe NETHERLANDSTel: +31 102 953 666Fax: +31 102 953 668
odfjellBrasilLtdaAv. Paulista 460 - 18 andarCEP 01310-000 São Paulo SP, BRAZILTel: +55 11 3549 5800Fax: +55 11 3549 5808
odfjellshanghaiSuite B, 13/FHuamin Empire Plaza728 Yan An West RoadChangning DistrictShanghai, 200050 P.R. CHINATel: +86 21 5239 9469Fax: +86 21 5239 9897
odfjellArgentinasAAlicia Moreau de Justo 1960Office no. 202 - Puerto Madero1107 Buenos Aires, ARGENTINATel: +54 114 313 7837Fax: +54 114 313 4619
odfjellAustralasiaPtyLimitedSuite 4, Level 1443 Little Collins StreetP.O.Box 1279Melbourne VIC 3001 AUSTRALIATel: +61 3 9642 2210Fax: +61 3 9642 2214
odfjellIndiaA-26, Nandbhuvan Industrial EstateMahakali Caves Road, Andheri (East)Mumbai 400093, INDIATel: +91 22 6695 4701Fax: +91 22 5695 4707
odfjellseachemsouthAfricaPtyLtdThe Sharaf House2 Sinembe CrescentLa Lucia RidgeDurban 4051, SOUTH AFRICATelefon: +27 31 583 4470Fax: +27 31 583 4488
odfjellkoreaCoLtd13th fl. Dongbu-Dadong Bldg.#103, Da-Dong, Chung-GuSeoul, KOREATel: +82 2 775 9760Fax: +82 2 775 9761
odfjellmanilac/o Magsaysay Maritime Corp.5th floor, 520 t.m. Kalaw StreetErmitaManila, PHILIPPINESTel: +63 2 526 9773Fax: +63 2 525 7720
odfjellDubaic/o Sharaf Shipping AgencySharaf Building, Al Mina RoadP.O. Box 576,Dubai, UNITED ARAB EMIRATESTel: +971 4 351 9785Fax: +971 4 351 9756
odfjell(uk)Ltd14 Headfort PlaceLondon SW1X 7DHUNITED KINGDOMTel: +44 207 823 0605Fax: +44 207 823 0606
oDFJELLPERuAv. Enrique Meiggs, 240Urb. Chacaritas,Callao, PERUTel : +51 1 614 0800Fax: +51 1 614 0801
NationalChemicalCarriersLtdCoRoom 301, 3rd Floor, Al-Akariyah Bldg No 1Sitteen Street, Malaz AreaP.O. Box 8931Riyadh 11492, SAUDI ARABIATel: +966 1 477 3934Fax: +966 1 476 4328
Terquims.ABlanco Encalada 840Dept 702, San Antonio, CHILETel: +56 35 211 050Fax: +56 35 211 161
REGIoNALoFFICEsodfjellAsiaPteLtd6 Shenton Way, # 27-08/09 DBS Tower 2SINGAPORE 068809Tel: +65 6349 1300Fax: +65 6224 2285
odfjellAhrenkielEuropeGmbhBurchardstrasse 8Postfach 100 22020095 HamburgGERMANYTel: +49 40 24838 307Fax: +49 40 24838 319
FlumarTransportesdeQuimicoseGasesLtdaAv. Paulista 460 - 18 andarCEP 01310-904 São Paulo SP, BRAZILTel: +55 11 3549 5800Fax: +55 11 3549 5807
TANkTERmINALsodfjellTerminals(houston)LP12211 Port RoadSeabrook, TX 77586, USATel: +1 713 844 2300Fax: +1 713 844 2355
odfjellTerminals(Rotterdam)BvOude Maasweg 6, P.O. Box 5010Harbour Number 40403197 KJ Rotterdam-BotlekThe NETHERLANDSTel: +31 102 953 400Fax: +31 104 384 679
odfjellTerminals(Dalian)LtdNo. 3 Binhai North RoadZhongshan DistrictDalian 116001, P.R. CHINATel: +86 411 8262 9701Fax: +86 411 8262 3707
odfjellTerminals(Jiangyin)Co.Ltd Jiasheng South Road 1 Economic Development Zone (West) Jiangyin 214446, Jiangsu Province, P.R. CHINATel: +86 510 8666 9111Fax: +86 510 8666 9110
odfjellTerminals(korea)Co,Ltd136, Cheongyong-RiOnsan-Eup, Ulju-GunUlsan, KOREATel: +82 522 311 600Fax: +82 522 376 636
oiltankingodfjellTerminalsingaporePteLtd1 Seraya AvenueSINGAPORE 628208Tel: +65 6473 1700Tel: +65 6479 4500
vopakTerminal,NingboLtdNo. 111 Zhaobaoshan Road, Zhenhai DistrictNingbo, P.R. CHINA Tel: +86 574 2769 5638Fax: +86 574 8627 5931
AssoCIATEDTANkTERmINALsTAGsAs.AAv. Alicia Moreau de Justo 1960,piso 4 of.4021107 Buenos AiresARGENTINATel: +54 11 4001 9700Fax: +54 11 4001 9701
GRANELQuImICALtdaAv. Paulista 460, 180andarCEP 01310- 000 São Paulo, SPBRAZILTel: +55 11 3549 5800Fax: +55 11 3549 5832
TERQuIms.ABlanco Encalada 840Dept 702, San AntonioCHILETel: +56 35 21 1050Fax: +56 35 21 1161
DQms.AAv. Enrique Meiggs, 240Urb. Chacaritas,Callao, PERUTel : +51 1 614 0800Fax: +51 1 614 0801
Offices and Addresses
www.odfjell.com
BALLAsT: A voyage with no cargo on board to get a ship in position for next loading port or dry docking.
BALLAsTTANk: A tank that is filled with sea water when a ship sails in ballast, or in order to provide stability.
BARE-BoATChARTER(B/B):The ship owner hires out a ship without crew for a fee, payable as a specific sum per day or a specific sum per dwt per month. The party that hires the ship pays for bunkers, port and canal charges and any other voyage related costs as well as all other operating cost.
BARGING:Transfer of cargo to/from a ship from/to a barge.
BRokER:An independent intermediary who negotiates freight contracts between owners and charterers as well as the sale and purchase of ships.
BuNkERs/BuNkERING:Fuel, to power a ship’s engine. Bunkering is to take on board bunkers.
CBm: Cubic Metres.
ChARTERPARTY(C/P):Agreement between a shipowner and a charterer, outlining terms and conditions governing the transportation. The agreement may be for one or several voyages, or for a certain period of time.
ChARTERER:The party paying for the transportation. It may be the cargo owner, supplier or receiver of the cargo.
CLAssIFICATIoNsoCIETY:An independent international organisation, e.g. Det norske Veritas, controlling and verifying that the technical condition, the safety and quality of a ship complies with its own rules, as well as those of national authorities.
CoATING:Paint protecting the inside of a ship’s tanks. Usually epoxy or zinc based paints.
CoNTRACToFAFFREIGhTmENT(CoA): An agreement between an owner and a charterer to transport given quantities of cargo during a given period of time and the owner is basically free to decide whichever ship he will use.
DEADWEIGhTToN(DWTorTDW):A measure of the weight carrying capacity of the ship. The total dwt is
the weight of the cargo the ship can carry plus bunkers, fresh water, spare parts etc.
DEEP-sEA(GLoBAL):Sea-borne trade that moves on intercontinental trade routes.
DEmuRRAGE:Compensation paid by the charterer, supplier or receiver of the cargo for each day or pro rata for time spent in port during loading/discharging, in excess of the laytime stipulated in the Charter Party.
DouBLEhuLL:The ship has an inner and an outer hull. Such construction increases the safety during a possible grounding or collision. In this way leakage may be avoided. The double hull is also used as ballast tank. DRYDoCk: Putting a ship into a dry dock for inspection and repairs of underwater parts, and painting of ship bottom. Usually carried out every 2 ½ to 5 years.
FREIGhTRATE:Agreed transportation cost, stipulated either per metric ton of cargo, cubic meter of cargo or as a lump sum for the total cargo.
Imo:International Maritime Organisation. The international UN advisory body on transport by sea.
INoRGANICChEmICALs:Chemicals which molecular structure contain no carbon atoms (other than as part of a carbonate-group), and are derived from sources other than hydrocarbons, such as sulphuric acid, phosphoric acid and caustic soda.
IsmC:International Safety Management Code. The first formalised initiative by IMO to provide a universal standard for the safety management systems of ships. kNoT:A measure of the speed of the ship. 1 knot= 1 nautical mile per hour, that is 1.85 km/h.
LIBoR:London Interbank Offered Rate.
mARPoL:The International Con-ventions governing Marine Pollution Prevention. It is a part of IMO.
m/T: Motor Tanker.
mTBE:Methyl tert butyl ether. Used as additive in gasoline.
NIs:Norwegian International Ship Register
oECD:Organisation for Economic Co-operation and Development, an information-gathering body. The members are mainly industrialised countries in Western Europe, North America and the Asia/Pacific region.
oFF-hIRE:The time a ship according to the charter party is not gainfully employed and not generating an income for its owner (e.g. time used for repairs).
oPA-90: The US Oil Pollution Act of 1990. An American federal law that imposes strict requirements on shipping companies, ships and crews when trading in US waters.
oPERATINGEXPENsEs:Expenses for crew as well as all other expenses directly connected with the running of the ship, including insurance.
oPERAToR:A person in a shipping company whose duties amongst other things is to take care of the contact between the ship and the charterer, give instructions to the ship and the port agents concerning stowage, loading and discharging of cargo, and arranging purchase of bunkers etc.
oRGANICChEmICALs:Chemicals containing carbon, often referred to as petrochemicals when derived from hydrocarbon sources such as oil, gas and coal.
PARCELTANkER:Tanker designed for the transportation of several different segregated cargoes simultaneously.
PETRoChEmICALs: See organic chemicals.
PooL:A co-operation between owners putting their ships into an operation where net revenues are divided according to a predetermined key.
sEGREGATIoN: The division of a ship’s cargo space into individual tanks.
sEP: Safety and Environmental Protection, classification system used by Det norske Veritas.
shIPmANAGEmENT:The administration of a ship, including services like technical operation, maintenance, crewing and insurance.
shoRT-sEA(REGIoNAL):Sea-borne trade that moves on regional trade routes (not intercontinental).
sPoTRATE:Freight rate for a voyage agreed on the basis of current market level.
sTCW:International convention on standards of training, certification and watchkeeping of seafarers. TImEChARTER(T/C):The ship owner hires out a ship complete with the crew for a fee, payable as a specific sum per day or a specific sum per dwt per month. The party that hires the ship pays for bunkers, port and canal charges and any other voyage related costs.
TImEChARTEREARNINGs:Gross freight revenues minus voyage costs. Usually expressed in USD per day.
ToN:A gross registered ton is a volume of 100 cubic feet (2.83 cubic meters). Gross registered tonnage is basically the volume of the ship’s closed areas, excluding the bridge, the galley and a few other rooms. Net registered tonnage is the gross tonnage less volumes needed for the operation of the ship (deck storage room, engine room etc.), i.e. the volume available for cargo.
TRADE:The geographical area where a ship mainly trades.
TRADINGDAYs: The number of days a ship is not off-hire.
TRANshIPmENT:Transfer of cargo to/from a ship from/to another ship. For example, cargo from a ship within global trade to a ship within regional trade bound for final destination/harbour.
voYAGEChARTER:The transportation of cargo from the port(s) of loading to the port(s) of discharge. Payment is normally per ton of cargo, and the ship owner pays for bunkers, port and canal charges and other voyage related costs.
voYAGEEXPENsEs:Expenses directly related to the voyage, such as bunkers, port charges, canal dues, etc.
TANK TERMINALS Number Location Share CBM Steel, CBM of tanksOdfjell Terminals (rotterdam) Bv rotterdam, NL 100 % 1 540 000 31 000 300Odfjell Terminals (Houston) LP Houston, uSA 100 % 270 563 81 902 92Odfjell Terminals (dalian) Ltd dalian, china 50 % 59 700 5 750 35Odfjell Terminals (Korea) co Ltd Onsan, Korea 50 % 109 500 2 850 39Oiltanking Odfjell Terminal Singapore Ltd Singapore 50 % 213 000 5 700 51vOTTN Ltd (Ningbo) Ningbo, china 12.5 % 63 500 7 900 36 2 256 263 135 102 553
Glossary

ODFJELL ASAconrad Mohrsv. 29,
P.O. Box 6101 Postterminalen5892 Bergen, NOrWAy
Tel: +47 5527 0000fax: +47 5528 4741
Email: [email protected]
Ent.no: 930 192 503