Embed Size (px)
Citation preview

ARSON IN THE UNITED STATES
FEDERAL EMERGENCY MANAGEMENT AGENCY
UNITED STATES FIRE ADMINISTRATION
NATIONAL FIRE DATA CENTER
FA 174 / August 1997

FEDERAL EMERGENCY M ANAGEMENT AGENCY
UNITED STATES FIRE ADMINISTRATION
NATIONAL FIRE DATA CENTER
ARSON IN THE UNITED STATES
FA 174 / August 1997
Prepared by:
TriData Corporation1000 Wilson Boulevard
Arlington, Virginia 22209
7KLV�SXEOLFDWLRQ�ZDV�SURGXFHG�XQGHU�&RQWUDFW�(0:����&������E\�7UL'DWD�&RUSRUDWLRQ�IRU�WKH�8QLWHG6WDWHV�)LUH�$GPLQLVWUDWLRQ��)HGHUDO�(PHUJHQF\�0DQDJHPHQW�$JHQF\���$Q\�LQIRUPDWLRQ��ILQGLQJV�FRQFOXVLRQV��RU�UHFRPPHQGDWLRQV�H[SUHVVHG�LQ�WKLV�SXEOLFDWLRQ�GR�QRW�QHFHVVDULO\�UHIOHFW�WKH�YLHZV�RIWKH�)HGHUDO�(PHUJHQF\�0DQDJHPHQW�$JHQF\�RU�WKH�8QLWHG�6WDWHV�)LUH�$GPLQLVWUDWLRQ�

TABLE OF CONTENTS
INTRODUCTION .......................................................................................................................... 1
PART I. THE MAGNITUDE OF THE U.S. ARSON PRO BLEM .......................................... 3
OVERVIEW....................................................................................................................................... 3
ARSON IN RESIDENTIAL STRUCTURES ........................................................................................... 6
TRENDS IN ARSON FIRES ................................................................................................................ 9
CHARACTERISTICS OF THE ARSON PRO BLEM............................................................. 21
PART II. FACTORS CONTRIBUTING TO ARSON ............................................................. 24
WHERE ARSON HAPPENS................................................................................................................ 24
MOTIVATIONS FOR FIRESETTING.................................................................................................... 26
JUVENILES....................................................................................................................................... 28
THE RELATIONSHIP BETWEEN DRUGS AND ARSON.......................................................................... 32
INADEQUATE SCREENING OF VOLUNTEER FIREFIGHTERS................................................................ 33
CIVIL DISTURBANCES..................................................................................................................... 34
PART III. BARRIERS TO COMBATING THE ARSON PRO BLEM................................. 35
PROSECUTOR RETICENCE............................................................................................................... 35
TRAINING IN ARSON DETECTION.................................................................................................... 36
STRUCTURE OF FIRE INVESTIGATION UNITS.................................................................................... 37
TRAINING AND CERTIFICATION IN FIRE INVESTIGATION.................................................................. 37
CONCLUSION ............................................................................................................................ 38
REFERENCES ............................................................................................................................ 40

1
ARSON IN THE UNITED STATES
INTRODUCTION
Arson is a serious problem in the United States. It is the number one cause of all fires,
and it annually kills hundreds of Americans, injures thousands more, and causes over $3 billion in
damage to property. In each of the past ten years there have been over 500,000 arson fires.
During 1994, the most recent year for which information is available, the total number of arson
fires in the U.S. was estimated at 548,500. Over 107,000 of these fires occurred in structures,
both residential and non-residential. In 1994 arson fires accounted for an estimated 560 fire
deaths, 3,440 fire injuries, and $3.6 billion in property damage.1
For many years the general populace has perceived arson as primarily an insurance
concern -- an invisible “paper loss” crime with limited impact on anyone other than insurers. But
for the firefighters who have been injured or killed responding to set fires and the hundreds of
civilians killed each year in incendiary or suspicious building fires, arson looms as a significant
issue that is anything but invisible or limited. The time has come to correct the public’s
perception so that arson is understood for what it is -- a violent crime that terrorizes, kills, and
injures.
Investigators increasingly report that fire is chosen as a weapon by jilted lovers,
delinquent youths, rival gang members, and drug pushers. Investigators are also becoming more
aware of Molotov cocktails and pipe bombs being used as incendiary devices. Fires caused by
explosives or motivated by spite and revenge tend to be more deadly because they often target
residential structures, in keeping with the desire to inflict personal harm. As arson increasingly
becomes a crime against persons, it becomes critical to have sufficient research and resources
available to adequately address the magnitude of the arson problem in the U.S.
1 While “arson” is technically a legal term, it is used here to refer to all fires of incendiary or suspicious origins.

2
This report deals with several different aspects of the arson problem and is divided into
three sections. The first section presents data on the magnitude and characteristics of the arson
problem. Data from both the National Fire Incident Reporting System (NFIRS) and the National
Fire Protection Association (NFPA) are included in this section. The second section of this
report discusses factors known to contribute to the incidence of arson, including the motivations
of firesetters. The final section addresses several of the challenges faced in dealing with the
problem of arson.

3
Part I. The Magnitude of the U.S. Arson Problem
Overview
This discussion of the magnitude of the U.S. arson problem is broken down into three
parts. In the first part, an overview of the arson problem is presented. The second part provides
additional information on arson in residential structures because these arson fires tend to be the
most deadly. Finally, in the third part, trends in arson fires relative to other types of fires are
discussed.
U.S. Arson Fires. According to NFIRS arson fires accounted for 28 percent of all fires
that occurred in the U.S. during 1994, making arson the leading cause of fire (see Figure 1). In
comparison the second leading cause, open flame fires, made up 12 percent of all fires, and
cooking fires, the third leading cause, represented nine percent of all fires.
Figure 1Causes of All Fires, 1994
6% 6%7%
9%8%
4%
12%
6%
8%
3%4%
28%
0.0%
5.0%
10.0%
15.0%
20.0%
25.0%
30.0%
Ince
ndiar
y/ S
uspic
ious
Childr
en P
laying
Carele
ss S
moking
Heatin
g
Cookin
g
Electric
al Dist
ributi
on
Applia
nces
Open F
lame
Other H
eat
Other E
quipm
ent
Natura
l
Expos
ure
Source: NFIRS
4
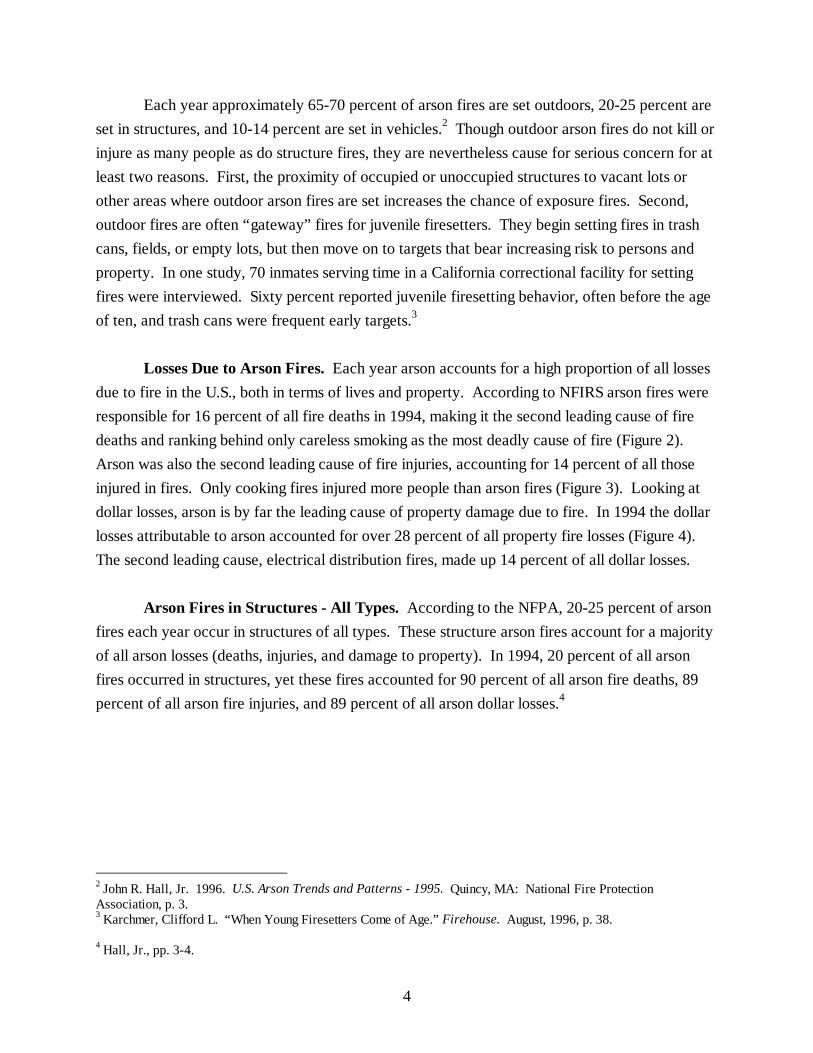
Each year approximately 65-70 percent of arson fires are set outdoors, 20-25 percent are
set in structures, and 10-14 percent are set in vehicles.2 Though outdoor arson fires do not kill or
injure as many people as do structure fires, they are nevertheless cause for serious concern for at
least two reasons. First, the proximity of occupied or unoccupied structures to vacant lots or
other areas where outdoor arson fires are set increases the chance of exposure fires. Second,
outdoor fires are often “gateway” fires for juvenile firesetters. They begin setting fires in trash
cans, fields, or empty lots, but then move on to targets that bear increasing risk to persons and
property. In one study, 70 inmates serving time in a California correctional facility for setting
fires were interviewed. Sixty percent reported juvenile firesetting behavior, often before the age
of ten, and trash cans were frequent early targets.3
Losses Due to Arson Fires. Each year arson accounts for a high proportion of all losses
due to fire in the U.S., both in terms of lives and property. According to NFIRS arson fires were
responsible for 16 percent of all fire deaths in 1994, making it the second leading cause of fire
deaths and ranking behind only careless smoking as the most deadly cause of fire (Figure 2).
Arson was also the second leading cause of fire injuries, accounting for 14 percent of all those
injured in fires. Only cooking fires injured more people than arson fires (Figure 3). Looking at
dollar losses, arson is by far the leading cause of property damage due to fire. In 1994 the dollar
losses attributable to arson accounted for over 28 percent of all property fire losses (Figure 4).
The second leading cause, electrical distribution fires, made up 14 percent of all dollar losses.
Arson Fires in Structures - All Types. According to the NFPA, 20-25 percent of arson
fires each year occur in structures of all types. These structure arson fires account for a majority
of all arson losses (deaths, injuries, and damage to property). In 1994, 20 percent of all arson
fires occurred in structures, yet these fires accounted for 90 percent of all arson fire deaths, 89
percent of all arson fire injuries, and 89 percent of all arson dollar losses.4
2 John R. Hall, Jr. 1996. U.S. Arson Trends and Patterns - 1995. Quincy, MA: National Fire ProtectionAssociation, p. 3.3 Karchmer, Clifford L. “When Young Firesetters Come of Age.” Firehouse. August, 1996, p. 38.
4 Hall, Jr., pp. 3-4.

5
Figure 2Causes of Civilian Fire Deaths, 1994 -- All Property Types
16%
10%
21%
13%
8%
11%
7%
5%
1% 1%
4% 4%
0%
5%
10%
15%
20%
25%
Incen
diary/
Sus
piciou
s
Childr
en P
laying
Carele
ss S
mok
ing
Heatin
g
Cookin
g
Electric
al Dist
ributi
on
Applia
nces
Open F
lame
Other H
eat
Other E
quipm
ent
Natura
l
Expos
ure
Source: NFIRS
Figure 3Causes of Civilian Fire Injuries, 1994 -- All Property Types
11%10%
9%
21%
8%
6%
9%
3%
5%
2% 1%
14%
0.0%
5.0%
10.0%
15.0%
20.0%
25.0%
Incen
diary/
Sus
piciou
s
Childr
en P
laying
Carele
ss S
mok
ing
Heatin
g
Cookin
g
Electric
al Dist
ributi
on
Applia
nces
Open F
lame
Other H
eat
Other E
quipm
ent
Natura
l
Expos
ure
Source: NFIRS

6
Arson in Residential Structures
Arson Fires in Residential Structures. The category “structures” includes both
residential and non-residential properties. Analyzing these property types separately reveals that,
not surprisingly, arson fires in residential structures account for higher losses than non-residential
structures in terms of both fire deaths and fire injuries. According to NFIRS, of those people
killed in arson structure fires in 1994, 96 percent were killed in residential structures. Similarly,
of those who were injured in structure fires caused by arson, 82 percent were injured in
residential properties.
Arson Fire Deaths and Injuries. Arson is one of the leading causes of residential fire
deaths. Figure 5 shows that arson fires tied with heating fires as the second leading cause of
residential fire deaths in 1994, accounting for 14 percent of such deaths. Arson fires also
accounted for 13 percent of residential fire injuries and represented the third leading cause, as is
shown in Figure 6.
Figure 4Causes of Dollar Loss from All Fires, 1994
28%
4% 4%
10%
7%
14%
4%
7%
3%
9%
5% 5%
0.0%
5.0%
10.0%
15.0%
20.0%
25.0%
30.0%
Incen
diary/
Sus
piciou
s
Childr
en P
laying
Carele
ss S
mok
ing
Heatin
g
Cookin
g
Electric
al Dist
ribut
ion
Applia
nces
Open F
lame
Other H
eat
Other E
quipm
ent
Natura
l
Expos
ure
Source: NFIRS

7
Figure 5Causes of Residential Fire Deaths, 1994
15%
12%
15%
9%
12%
4%5%
2% 2%
0% 0%
24%
0%
5%
10%
15%
20%
25%
Incen
diary/
Sus
piciou
s
Childr
en P
laying
Carele
ss S
mok
ing
Heatin
g
Cookin
g
Electric
al Dist
ributi
on
Applia
nces
Open F
lame
Other H
eat
Other E
quipm
ent
Natura
l
Expos
ure
Per
cent
Adj
uste
d
Source: NFIRS
Figure 6Causes of Residential Fire Injuries, 1994
13%14%
10%
25%
8%
6%
8%
1%2%
1% 1%
12%
0%
5%
10%
15%
20%
25%
30%
Incen
diary/
Sus
piciou
s
Childr
en P
laying
Carele
ss S
mok
ing
Heatin
g
Cookin
g
Electric
al Dist
ributi
on
Applia
nces
Open F
lame
Other H
eat
Other E
quipm
ent
Natura
l
Expos
ure
Per
cent
Adj
uste
d
Source: NFIRS

8
Arson Fires. Figure 7 shows that in 1994, arson accounted for 14 percent of all
residential fires and was the third leading cause of such fires. The only two causes of residential
fires that were more frequent than arson fires were cooking fires (24 percent of all residential
fires) and heating fires (17 percent).
Arson Fire Dollar Losses. In 1994, arson fires accounted for 21 percent of all dollar
losses attributable to arson in residential structures and were the leading cause of dollar loss
(Figure 8). The next two leading causes in residential structures were heating fires (15 percent)
and electrical distribution fires (14 percent).
Figure 7Causes of Residential Fires, 1994
6% 6%
17%
10%
8%7%
2% 2% 2%
4%
24%
14%
0%
5%
10%
15%
20%
25%
30%
Incen
diary/
Sus
piciou
s
Childr
en P
laying
Carele
ss S
mok
ing
Heatin
g
Cookin
g
Electric
al Dist
ribut
ion
Applia
nces
Open F
lame
Other H
eat
Other E
quipm
ent
Natura
l
Expos
ure
Source: NFIRS

9
Trends in Arson Fires
The data presented thus far present a snapshot of the magnitude of the arson problem. In
this section, current trends in the number of arson fires and related losses are discussed.
Trends in Overall Arson Fires. Overall, the number of fires occurring each year in the
U.S. has fallen 19 percent over the past ten years. However, NFPA data reveal that the number
of total arson fires is falling relatively slower than the number of all fires. While the trend has
been inconsistent, between 1985 and 1994 the number of arson fires declined by 11 percent
(Figure 9). Within the category of all arson fires there are three major occupancy types:
structures, vehicles, and outdoor and other areas. Figure 10 displays the distribution of arson
fires in these categories for 1994. Figure 11 shows the trends for these categories between 1985
and 1994. The most noteworthy decline has been the drop in the number of arsons in structures,
which have fallen over 25 percent over ten years. The declines in vehicle fires and outdoor and
other fires have been more modest, falling 11 percent and five percent respectively.
Figure 8Causes of Residential Fire Dollar Loss, 1994
7% 6%
15%
12%
14%
6% 7%
1%3%
4% 4%
21%
0%
5%
10%
15%
20%
25%
Incen
diary/
Sus
piciou
s
Childr
en P
laying
Carele
ss S
mok
ing
Heatin
g
Cookin
g
Electric
al Dist
ributi
on
Applia
nces
Open F
lame
Other H
eat
Other E
quipm
ent
Natura
l
Expos
ure
Source: NFIRS

10
Figure 9. Arson Fires in the U.S., 1985-1994
597,500
539,500
519,800
548,500545,200
558,100
519,600
583,400
574,500
592,600
480,000
500,000
520,000
540,000
560,000
580,000
600,000
620,000
1985 1986 1987 1988 1989 1990 1991 1992 1993 1994
Source: NFPA, 1996
The number of arson fires is down 10.7 percent over the ten-year period. The overall number of fires is down 18.8 percent over the same period.
Figure 10. Arson Fires b y Major Occu pancy Type, 1994
20%
12%
69%
0%
10%
20%
30%
40%
50%
60%
70%
80%
Structures Vehicles and OtherOutdoor
Source: NFPA, 1996
N = 548,500

11
Trends in Overall Arson Deaths. Figure 12 displays NFPA data tracking the number of
civilian arson deaths for the period 1985 to 1994. There were an average of over 750 deaths per
year, and Figure 13 shows that they overwhelmingly occurred in structures.
Figure 11. Arson Fires by Major Occupancy Type, 1985-1994
107,800
63,100
381,000
347,200
377,600
104,400116,600113,900111,900117,000
125,100129,100140,500143,600
68,20073,50076,80076,20070,00072,50076,50078,60072,900
355,100367,400
351,400332,600
385,800368,900373,500
-
50,000
100,000
150,000
200,000
250,000
300,000
350,000
400,000
450,000
1985 1986 1987 1988 1989 1990 1991 1992 1993 1994
Structure Fires
Vehicle Fires
Outdoor and Other Fires
Source: NFPA, 1996

12
Figure 12. Civilian Arson Deaths, 1985-1994
560
889
760742
851
911927
818853
798
-
100
200
300
400
500
600
700
800
900
1,000
1985 1986 1987 1988 1989 1990 1991 1992 1993 1994
Source: NFPA, 1996
Figure 13. Percentage Civilian Arson Deaths by Major Occupancy Type, 1994
9%
1%
90%
0%
10%
20%
30%
40%
50%
60%
70%
80%
90%
100%
Structures Vehicles and OtherOutdoor
N = 560
Source: NFPA, 1996

13
Trends in Overall Arson Inju ries. The incidence of fire injuries in arson fires is charted
in Figure 14. Between 1985 and 1994 there were an average of over 3,300 civilian arson injuries
each year. As with arson deaths, almost all of these injuries occurred in structure arson fires
(Figure 15).
Figure 14. Civilian Arson Injuries, 1985-1994
3,000
3,5803,440
3,260
3,700
3,4803,420
3,200
3,120
3,500
-
500
1,000
1,500
2,000
2,500
3,000
3,500
4,000
1985 1986 1987 1988 1989 1990 1991 1992 1993 1994
Source: NFPA, 1996
Figure 15. Percentage Civilian Arson Injuries by Major Occupancy Type, 1994
89%
5% 6%
0%
10%
20%
30%
40%
50%
60%
70%
80%
90%
100%
Structures Vehicles and OtherOutdoor
N = 3,440
Source: NFPA, 1996

14
Trends in Overall Arson Dollar Loss. Figure 16 displays the dollar loss in millions due
to arson fires occurring between 1985 and 1994. Losses, as expressed in constant 1994 dollars,
were fairly stable from 1985 through 1990, ranging from $3.3 billion to $3.8 billi on. Beginning in
1991, however, the incidence of several major arson fires in 1991, 1992, and 1993 make the
loss estimates from these years problematic and the overall trend in arson losses uncertain. The
methodology employed in calculating these estimates means that the figures for 1991 and 1993
are understated, while the estimate for 1992 is overstated (see Hall Jr., 1996 for a fuller
explanation).
Figure 16. Arson Dollar Loss (in Millions) in 1994 Constant Dollars
$3,801.8$3,697.0
$4,371.7
$3,393.0
$3,615.3
$3,749.1
$3,476.0$3,305.9
$3,600.7$3,566.9
$-
$500
$1,000
$1,500
$2,000
$2,500
$3,000
$3,500
$4,000
$4,500
$5,000
1985 1986 1987 1988 1989 1990 1991 1992 1993 1994
Source: NFPA, 1996

15
Figure 17 shows the distribution of arson dollar loss by major occupancy types. Not
surprisingly, the majority of all dollar losses (87 percent, or an estimated $3.1 billi on) occur in
structures. Vehicles account for 12 percent of dollar losses, and outdoor fires account for
another one percent. The discrepancy between the proportion of all arson fires occurring in
outdoor and other locations and the amount of total arson loss they represent is partly an artifact
of how losses are assessed. It is difficult to assign a dollar loss amount to destruction of wildland
vegetation. Regardless, these losses are still much lower than losses associated with arson in
structures.5
5 Hall Jr., 1996, p. 17.
Figure 17. Arson Dollar Loss by Major Occupancy, 1994
87%
12%
1%0%
10%
20%
30%
40%
50%
60%
70%
80%
90%
100%
Structures Vehicles and OtherOutdoor
Source: NFPA, 1996
.
Total Loss = $3,615.3 Billion (in 1994 Dollars )

16
Trends in Arson Fires in Structures. Within the category of structures there are two
property types: residential and non-residential structures. Figure 18 shows that the decrease in
arson fires is different within these two categories. According to NFIRS data, arson in residential
structures is decreasing much slower than arson in non-residential structures (a 19 percent
decrease versus a 34 percent decrease over ten years). Consequently, the trend is for a gradually
increasing proportion of arson fires in any given year to occur in residential structures. This is an
important trend to watch given that higher losses, both in terms of lives and property, are
associated with arson in residential structures than in non-residential structures such as
commercial structures.
Figure 18Arson Fires in Structures
73,20072,20076,90074,60068,800 67,500 67,700 66,600 61,900 62,000
46,50045,90053,80050,900
48,20052,40055,000
59,70067,000
71,100
120,400
143,900145,700
128,200131,900
121,200
118,600
108,500107,800115,700
-
20,000
40,000
60,000
80,000
100,000
120,000
140,000
160,000
1985 1986 1987 1988 1989 1990 1991 1992 1993 1994
Residential Arson Fires
Non-Residential Arson Fires
Total Structure Fires
Total Structures: down 26%Non-Residential: down 34%Residential: down 19%
Source: NFIRS and NFPA

17
While the number of residential deaths due to arson each year can vary substantially,
Figure 19 reveals that over the past ten years, the overall trend has been a decline of about 17
percent in the number of residential arson fire deaths. This is a significantly slower rate of
decline than the 32 percent decline in the overall number of residential fire deaths over the same
period. As with arson fires, the slower rate of decline in arson fire deaths means that these
deaths represent an increasing proportion of all fire deaths. An encouraging sign, however, is
that the number of deaths occurring in residential structures arson fires in 1994 was 502, a ten-
year low.
Figure 191985-1994 Residential Arson Fire Deaths
727770 756
677
770
505
698
663
809857
0
100
200
300
400
500
600
700
800
900
1000
1985 1986 1987 1988 1989 1990 1991 1992 1993 1994
Arson
Linear (Arson)
Arson fire deaths are down 16.7% over the last 10 years
Source: NFIRS and NFPA

18
In contrast to the downward trend in deaths, the trend in residential arson fire injuries is
upward. Figure 20 shows that residential arson fire injuries have risen about 18 percent over the
past ten years. This is over two times the increase in the overall level of residential fire injuries,
which has increased 8 percent over the past ten years.
Figure 201985-1994 Residential Arson Injuries
2,340
2,6602,590
2,250
2,460
2,600
2,520
2,7702,840
2,280
0
500
1,000
1,500
2,000
2,500
3,000
1985 1986 1987 1988 1989 1990 1991 1992 1993 1994
Residential Arson Injuries
Linear Trend Line
Arson injuries are up 17.6 percent
Source: NFIRS and NFPA

19
Metropolitan vs. Non-metropolitan Residential Arson Fires. While arson is among
the leading causes of all residential fires, NFIRS data suggest it represents a bigger problem in
metropolitan areas than in non-metropolitan areas. In 1990, arson fires comprised 14 percent of
all residential fires with known causes and were the third leading cause of all residential fires.
However, in metropolitan areas, arson fires accounted for 24 percent of residential fires in
metropolitan areas and were the leading cause of residential fires. Cooking fires were second,
accounting for 21 percent of metropolitan residential fires.6
This relationship between the size of place and the incidence of arson is borne out in
other studies. A 1995 study by the National Fire Protection Association (NFPA) shows that for
the period 1990-1994, the rate for incendiary and suspicious fires in cities of 250,000 or more
was greater than twice the rate for communities of 5,000 to 10,000 or 10,000 to 25,000. For
rural areas with under 2,500 to 5,000 residents the rates were higher than for the medium-sized
communities but lower than the rates for the largest places. Arson rates for areas with different
sized populations appear in Table 1. 7
Table 1. Incendiary/Suspicious Fire Rates by Area Population Size
Area Population
Incendiary/Suspicious Fire Rate
per 100,000 Population
< 2,500 - 2,500 36
2,500 - 4,999 30
5,000 - 9,999 26
10,000 - 24,999 25
25,000 - 49,999 30
50,000 - 99,999 35
100,000 - 249,999 45
250,000 and over 52
Source: NFPA, 1996, pp. 17-18.
6 United States Fire Administration. Fire in the United States, 1983 - 1990. Washington, D.C.: Federal EmergencyManagement Agency, United States Fire Administration, 1990, p. 355. This information is intended to give readers ageneral idea of how metropolitan and national data compare, but it must be interpreted with care. Due to the way thedata is collected and reported in the National Fire Incident Reporting System (NFIRS), data from some areas that arelargely rural in character are included as metropolitan areas.7 Hall Jr., pp. 17-18.

20
In the same study, NFPA reported that arson fires represented a higher proportion of all
fires reported in large cities than in smaller cities for the period 1990-1994. The proportion of all
fires attributable to suspicious and incendiary causes is more than two times higher in large cities
than in smaller communities, as shown in Table 2.8
Table 2. Arson Fires as a Percent of All Reported Fires by Area Population
Area Population Arson Fires as a Percent of all
Reported Fires
< 2,500 - 2,500 10%
2,500 - 4,999 10%
5,000 - 9,999 10%
10,000 - 24,999 10%
25,000 - 49,999 14%
50,000 - 99,999 18%
100,000 - 249,999 21%
250,000 and over 23%
Source: NFPA, 1996, pp. 19-20.
8 Hall Jr., pp. 19-20.

21
For 1990-1994, the NFPA analyzed the types of structures that experienced arson fires
and the distribution of arson losses. The results appear in Table 3.9
Table 3. 1989-1993 Incidence of Arson by Type of Structure
and Distribution of Dollar Loss
Type of Structure
Percent of Arson Fires by
Structure TypeaPercent of All Arson
Dollar Lossesa
Residential 56% 48%
Stores/Offices 6% 20%
Storage 10% 7%
Public Assembly 4% 6%
Educational 4% 3%
Institutional 3% 1%
Industrial/Manufacturing 1% 5%
Special 14% 6%
Unknown 2% 3%a may not add to 100% due to rounding
Source: NFPA, 1996, p. 31.
As indicated in Table 3, residential structures experienced the highest number of arson
fires and accounted for the highest proportion of total arson dollar losses of all structure types.
Important to note, however, is that while stores and offices experienced only six percent of all
arson fires, they accounted for 20 percent of all dollar losses resulting from arson fires.
Characteristics of the Arson Pr oblem
Time of Day. Table 4 shows the distribution of arson fires throughout the day for 1994.
The two time periods with the highest proportion of arson fires are 4 p.m. to 8 p.m. and 8 p.m. to
midnight. Looking at these two periods together, almost half of all arson fires occurred between
4 o’clock in the evening and midnight.
9 Hall Jr., 1996, p. 31.

22
Table 4. Time of Day, Incendiary and Suspicious Fires, 1994
Time of Day Percent of All Arson Fires
12:00 a.m. to 4:00 a.m. 17.4%
4:01 a.m. to 8:00 a.m. 7.8%
8:01 a.m. to 12:00 p.m. 8.8%
12:01 p.m. to 4:00 p.m. 17.8%
4:01 p.m. to 8:00 p.m. 23.9%
8:01 p.m. to 12:00 p.m. 24.2%
Total* 100.0%
* figures may not add to 100% due to rounding
Day of the Week. Table 5 shows the distribution of arson fires throughout the week for
1994. While arson fires are fairly well distributed throughout the week, they occur slightly more
frequently on Saturdays and Sundays.
Table 5. Days of the Week, Incendiary and Suspicious Fires, 1994
Day of Week Percent of All Arson Fires
Sunday 16.5%
Monday 15.0%
Tuesday 13.5%
Wednesday 12.8%
Thursday 12.5%
Friday 13.4%
Saturday 16.2%
Total* 100.0%
* figures may not add to 100% due to rounding

23
Fixed Property Use. Table 6 shows the distribution of the types of properties that
experienced arson fires in 1994 as coded in NFIRS. The six categories of fixed property that
experienced the highest number of arson fires are identified. Together, these properties
accounted for 80 percent of the fixed property use types that experienced arson fires.
Table 6. Fixed Property Use of Locations Experiencing Incendiary
or Suspicious Fires, 1994
Fixed Property Use
Percent of All Arson
Fires
Road Property * 25.1%
Outdoor Properties ** 24.6%
One- and Two- Family Dwellings 17.0%
Apartments, Tenements, Flats 6.0%
Construction, Unoccupied Property 5.1%
Schools, Non-residential 2.2%
All Others Uses 20.0%
Total 100.0%
* refers to vehicle fires** this is one of the NFIRS categories that refers to outdoor fires

24
Part II. Factors Contributing to Arson
This section addresses factors that contribute to the arson problem in the U.S. The
discussion includes the special problem of vacant and abandoned buildings, the motivations of
firesetters, the involvement of juveniles and juvenile gangs in firesetting, the relationship between
drugs and arson, the problem of firefighters who set fires, and arson fires that result from civil
unrest. The recent attention paid to suspicious church fires is also addressed.
:KHUH�$UVRQ�+DSSHQV
An arson fire can be set almost anywhere, but there are two particular types of locations
that deserve special mention. The first is outdoor locations, where about two-thirds of all arson
fires are set each year, as discussed in Part I. Juveniles typically are behind these fires which are
set out of boredom, to vandalize, to attract help for psychological problems, or for other reasons.
Another frequent arson target is vacant and abandoned buildings. Most fire investigators agree
that these buildings are fodder for a large percentage of arson fires in structures. Sternlieb and
Burchell (1973) found that abandoned buildings in general were four times more likely than other
types of structures in Newark, New Jersey to have a severe fire, often one that was intentionally
set.10
The problem of vacant and abandoned buildings is widespread in the U.S. In city after
city, building owners have abandoned their properties and moved elsewhere -- either absorbing
the loss or leaving a bank to deal with it. Banks, however, are usually reluctant to assume
responsibility for property upkeep when the potential for resale is negligible, so many properties
are simply left “as is”. Frequently, while the building sits vacant it falls victim to “urban mining”.
The windows are smashed and vandals tear off the boarded up entrances to steal copper pipes,
heating and plumbing fixtures, or anything else of value. Firesetters often finish the job.
Data from several cities highlights the problem of arson in vacant abandoned buildings.
Lawrence, Massachusetts, a city of 70,000 population, faced a problem with 500 vacant or
abandoned buildings -- many of them residential structures sandwiched between occupied
dwellings in multifamily blocks. During the first six months of 1992, more than 90 structure fires
were classified as incendiary or suspicious. Most of the buildings targeted in the arson epidemic
10 Sternlieb, George and Robert Burchell. “Fires in Abandoned Buildings.” Fire Journal. Vol. 67, no. 2, 1973, p. 28.

25
were vacant or abandoned rental properties in a densely populated area of the city where high
unemployment and crime fed the neighborhood arson problem. Indianapolis reported that in the
same year, 36 percent of their structure fires occurred in vacant dwellings. Omaha’s fire
statistics for 1992 showed that they had 221 incendiary and suspicious fires in vacant or
abandoned structures.
Intervention Strategies for Blighted Buildings. Although property disinvestment is a
complex problem to solve, communities have undertaken initiatives that at least begin to turn the
tide. For example Bridgeport, Connecticut passed an anti-blight ordinance that discourages
property owners from allowing their buildings to become unsafe. Once their property is
identified as blighted, owners are subjected to a daily fine until the structure is brought into
compliance or demolished. The law is enforced by a special committee of representatives from
city departments and community organizations that meets regularly to identify blighted buildings,
act on cases, and initiate the process of rehabilitation or demolition. The City of Lawrence has
helped curb their arson problem by implementing an aggressive nuisance abatement program,
part of which directs the boarding up or demolition of vacant buildings.
The City of Saginaw, Michigan also has a problem with vacant, abandoned, and fire-
damaged buildings. The city passed a Dangerous Building Ordinance (DBO) to identify and
notify owners of substandard properties. Neighbors, the fire department, the police department
and the water department all report delinquent owners. Water meter readers identify suspected
vacant buildings and enter the addresses into hand-held computers. A computer-generated list of
all the addresses is forwarded to the fire department, which then confirms the building’s status
and follows up by securing the structure to prevent additional deterioration, and then initiating
the DBO process.
Neighborhood organizations have gone on the offensive to stem the tide of the arson
blight in their communities. Some neighborhood groups have developed coalitions with
government agencies, fire departments, banking and financial institutions, insurance companies,
and other related agencies. These coalitions can help bring arson problems in their
neighborhoods into sharp focus. Some of the approaches neighborhood organizations have taken
include:
• finding new owners for abandoned buildings, and assisting them in renovating them
for reoccupancy;

26
• acting as a developer in acquiring and renovating abandoned and deteriorating
residential structures;
• providing financial advice and counseling for neighborhood home owners;
• organizing neighborhoods against block busting;
• researching the background of arson and incendiary fires in the neighborhood and
organizing a media campaign to alert the public to the problem;
• participating in fire prevention education activities;
• installing smoke detectors and fire extinguishers in newly renovated housing units;
• monitoring abandoned buildings to ensure that they are and remain adequately
secured; and
• building confidence in the neighborhood through collective action and organization.
0RWLYDWLRQV�IRU�)LUHVHWWLQJ
As with any crime, people set fires for varied and complex reasons. For criminals
prosecuted for crimes where there is direct evidence, motive is often a secondary consideration
and is not necessarily crucial for conviction. But because arson is a clandestine crime where
witnesses are rare and some or most of the direct evidence burns in the fire, motive becomes a
critical element in prosecuting firesetting cases. Pinpointing the motivation for setting a fire helps
identify suspects and helps convince a jury of the accused’s guilt.
The most common motives behind firesetting are :
• Vandalism
• Spite and revenge
• Intimidation
• Concealment of another crime
• Economic motives, including
⇒ insurance fraud
⇒ debt removal
⇒ direct monetary gain
⇒ elimination of unwanted ownership
⇒ land assembly for development
27
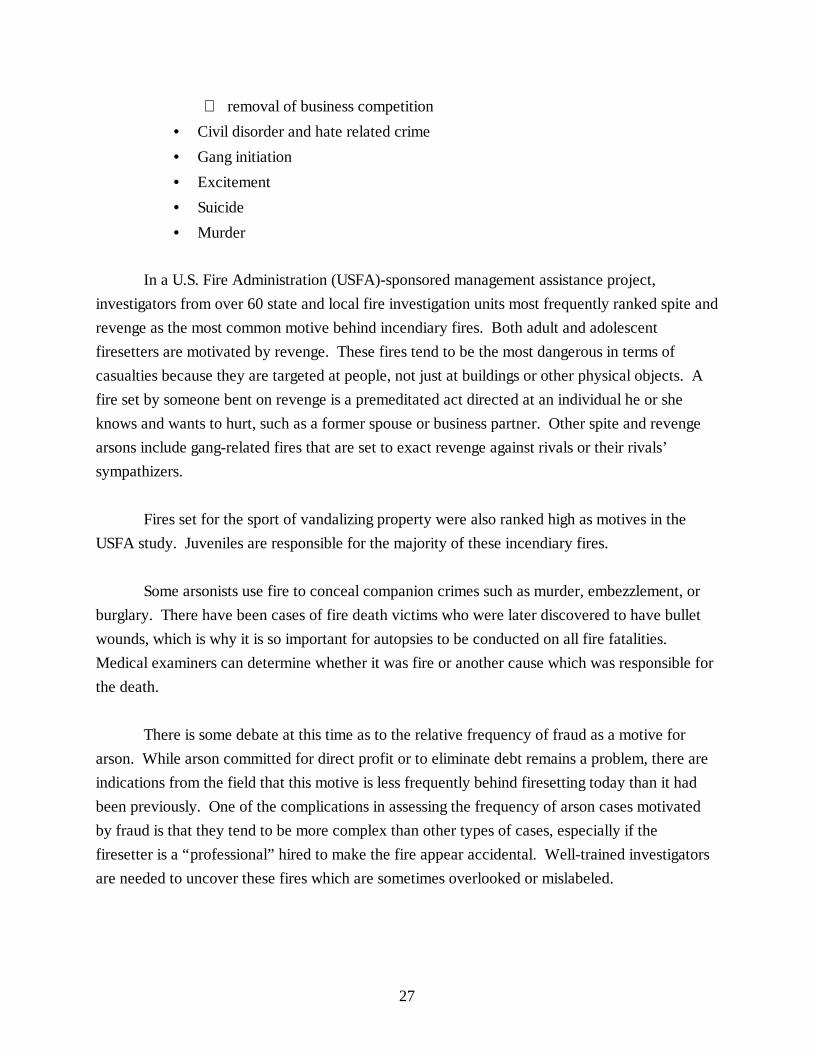
⇒ removal of business competition
• Civil disorder and hate related crime
• Gang initiation
• Excitement
• Suicide
• Murder
In a U.S. Fire Administration (USFA)-sponsored management assistance project,
investigators from over 60 state and local fire investigation units most frequently ranked spite and
revenge as the most common motive behind incendiary fires. Both adult and adolescent
firesetters are motivated by revenge. These fires tend to be the most dangerous in terms of
casualties because they are targeted at people, not just at buildings or other physical objects. A
fire set by someone bent on revenge is a premeditated act directed at an individual he or she
knows and wants to hurt, such as a former spouse or business partner. Other spite and revenge
arsons include gang-related fires that are set to exact revenge against rivals or their rivals’
sympathizers.
Fires set for the sport of vandalizing property were also ranked high as motives in the
USFA study. Juveniles are responsible for the majority of these incendiary fires.
Some arsonists use fire to conceal companion crimes such as murder, embezzlement, or
burglary. There have been cases of fire death victims who were later discovered to have bullet
wounds, which is why it is so important for autopsies to be conducted on all fire fatalities.
Medical examiners can determine whether it was fire or another cause which was responsible for
the death.
There is some debate at this time as to the relative frequency of fraud as a motive for
arson. While arson committed for direct profit or to eliminate debt remains a problem, there are
indications from the field that this motive is less frequently behind firesetting today than it had
been previously. One of the complications in assessing the frequency of arson cases motivated
by fraud is that they tend to be more complex than other types of cases, especially if the
firesetter is a “professional” hired to make the fire appear accidental. Well-trained investigators
are needed to uncover these fires which are sometimes overlooked or mislabeled.

28
Church Arsons. The recent spate of arson church fires in the U.S., predominantly in
southern states, has once again brought the issue of arson to national attention. In response, the
President allocated $6 million to hire more police and security guards in areas considered at high
risk for church fires. Congress passed legislation doubling the penalty for church arson from ten
years to twenty years, and the Federal Emergency Management Agency (FEMA) was directed to
create an interagency task force including the Justice and Treasury Departments to give the
government more power to investigate and prosecute arson fires. More than 200 FBI agents and
agents from the Bureau of Alcohol, Tobacco, and Firearms were assigned to work church fire
investigations.
Arson targeted at churches represents only a small part of the overall arson problem,
accounting for less than 1 percent of all arson fires. However, more than one of every four fires
occurring in churches are caused by arson, making it the leading cause of church fires. In spite of
the recent publicity surrounding church arsons, they are down from a total of 1,420 in 1980 to
520 in 1994. This is a 15-year low in church arsons.
A primary concern about incendiary fires in churches has been the suggestion that they
were racially motivated. The evidence on this point is mixed. First, of 230 church burnings
investigated (at the time of this project), 41 percent targeted black churches and 59 percent
targeted white churches. Second, in the over 100 arrests made to date, racial hatred was found to
be but one of several motivations for the firesetting, consistent with the picture for other types of
arson scenarios. Other motivations included: juvenile vandalism, insurance fraud, and a
firefighter seeking excitement. Of those arrested, 66 percent were white and 34 percent were
black.
-XYHQLOHV
Of particular concern is the involvement of juveniles in intentionally set fires, not
including those children who play with fire and are too young to understand the extreme danger
inherent in it. The NFPA (1996) reports that in 1995, for the second year in a row, juvenile

29
firesetters accounted for a majority (52 percent) of those who were arrested on arson charges.11
Likewise, Federal Bureau of Investigation (FBI) statistics show that half of all those arrested on
arson charges in 1992 were under the age of 18; two-thirds were under the age of 25.12 The
growing involvement of youths in setting fires is cause for serious concern and deserves more
attention from policymakers.
For 1992 the FBI reports that, based on arson arrests, juveniles were responsible for 40
percent of arsons in structures, 24 percent of vehicle arsons, and 59 percent of arson in all other
property types. FBI crime statistics also show that arrests of juveniles for arson offenses
increased eight percent from 1991 to 1992, while the rate of adult arrests decreased three
percent.13
These statistics raise an important question: is the reported rise in arson fires set by
juveniles an indication of growing involvement in misdemeanor and felony firesetting among
juveniles--or are we just doing a better job of identifying this activity? If anecdotal reports from
the field are any indication, it would appear that nationwide, juveniles have been increasingly
using fire to vandalize structures and autos. This is in addition to the fact that some communities
are doing a better job of documenting juvenile firesetting than they were previously.
Because juvenile firesetting is such a serious problem, more detailed information on these
fires is needed at the local level. A common problem is that fire investigation agencies generally
do not maintain much data on perpetrators, so profiling the ages, motives, and characteristics of
those suspected or arrested for firesetting is difficult. Sometimes juvenile fire records are kept by
a branch of government other than the fire department, such as the police youth division or the
juvenile court. Their numbers typically are lower than those recorded by the fire department,
because the police and the courts only become involved if the juvenile is arrested or brought
before juvenile court.
Another complication is that localities do not necessarily distinguish between different
types of fires started by juveniles, and their data may include accidental fires set by children of
11Hall Jr., 1996, p. i.12U.S. Department of Justice. Crime in the United States, 1992: Uniform Crime Reports. Washington, D.C.:Federal Bureau of Investigation, U.S. Department of Justice, 1993, p. 56. These FBI statistics refer to the distributionof those arrested on arson charges data and may or may not be representative of the proportion of all arson offensescommitted by juveniles. Only fires with incendiary origins are included in the statistics, not those with suspicious orunknown origins.13 ibid., p. 55.

30
all ages, especially very young children who start fires by playing with lighters, matches, or other
fire materials. It is important that separate numbers be maintained for largely “accidental” fires
set by very young children and for fires set willfully and maliciously by older youths so that fire
and law enforcement officials can determine where to put their focus -- on a preschool/early
elementary school fire safety program, for example, or on a court-based intervention program.
At the national level, the National Fire Incident Reporting System (NFIRS) tracks arson
fires separately from fires set by children playing. Child-playing fires differ from arson fires in
that the children who set them are usually below the age of reasoning, about seven years old.
Within the category of arson fires, NFIRS does not collect information on the age of perpetrators
of incendiary or suspicious fires, so it is not possible to distinguish between arson fires set by
juveniles and those set by adults. Information on juvenile arsonists is available through national
crime data, yet the representativeness of this data is unknown since a majority of arson cases
each year go unsolved. Hall (1996) reports that of the fires confirmed as incendiary, an
estimated 80-85 percent are never solved or cleared by an arrest.14
The Role of Adults. Lack of adult supervision and care plays a significant role in
firesetting behavior by juveniles of all ages. This finding is not unique to arson, but is a major
factor in all types of misdemeanors and felonies involving juveniles. The Juvenile Firesetter
Program of the Delaware State Fire Marshal’s Office has maintained exceptionally good data on
the juveniles who have been involved in their program. Examining records from 1,462 juvenile
firesetters over the period 1981-1994, Delaware’s Program reports that “parents (were) gone a
lot” in 68 percent of the cases, 58 percent of the youths were unsupervised at the time of the fire,
and 39 percent suffered from actual neglect.15
Parents, especially single mothers and other parents facing significant child care
obstacles, should be provided with information verbally and in writing about the dangers of
leaving children alone, the importance of keeping matches and lighters out of sight and out of
reach, and the signs of firesetting behavior and stress in school-age children. In general, when
addressing our country’s “juvenile” firesetting problem, we need to acknowledge the critical role
adults play as well.
14 Hall Jr., 1996, p. 30.15 Program statistics made available by the Office of the State Fire Marshal, State of Delaware, January, 1995.

31
Fire departments and State Fire Marshals Offices can not significantly reduce the
incidence of juvenile-caused fires, including criminal fires, unless they have allies. With social
problems underlying most of the firesetting incidents, resources from other sectors must be drawn
into a partnership with public safety officials. Local mental health agencies, police juvenile
crime officers, school officials, housing and community development leaders, social service
agencies, and youth club directors all have a vested interest in controlling the rate of juvenile
firesetting. Studies have shown that firesetting is often the “gateway” crime to other more
serious crimes. Reason would have it that if kids can be reached at the beginning of this potential
crime cycle, the overall level of juvenile crime, and adult crime as well, might be positively
affected.
The most successful local juvenile firesetter control programs for older children are those
directly tied to the juvenile court system. While a program based on voluntary participation is
better than no program at all, to be truly effective with older juveniles the program should be one
that is court-mandated. Juvenile court judges can rule that youths cooperate with counselors and
educators as an alternative to incarceration. In Cobb County, Georgia juveniles who have been
arrested for arson must participate in mediation sessions with the victim(s) of the crime to
negotiate restitution and community service.
Juvenile Gangs. Youth gangs have been a serious problem in big cities for many years.
Los Angeles, Philadelphia, Miami, and other urban centers have struggled with rising juvenile
crime rates, including arson. Much of the criminal activity can be linked to gangs or to youths
imitating gang behavior. While some juveniles operate crime syndicates to make money from the
sale of illegal drugs and weapons, more often they organize to obtain power, control, and
“respect”. Both types of gangs often resort to violence to accomplish their goals.16
The nexus between gangs and fire revolves around the gang’s desire to be respected.
Gangs use fire and Molotov cocktail fire bombs, in particular, to send messages of domination
and power over rivals, the neighborhood in general, and local businesses. For example, a
business owner who removes gang graffiti from his building may find that structure burned.
Neighbors who protect the gang’s enemies or talk to law enforcement officers may become
victims of fire bombs. While juvenile gangs have mainly been associated with inner city
16 Telephone interview with Corporal Tony Avendorph, Prince George’s County Police Department, September 24,1996.

32
neighborhoods, the problem has spilled over into suburban areas surrounding central cities, as
well as into small communities. In Prince George’s County, Maryland, a county contiguous to
Washington, D.C., three juveniles set out to intimidate a woman who had witnessed them
commit a crime. The youths returned at night and hurled a Molotov cocktail through a bedroom
window. Tragically, a sleeping baby occupied that room and died in the ensuing fire. The
intended victim was not even in the building at the time.17
7KH�5HODWLRQVKLS�EHWZHHQ�'UXJV�DQG�$UVRQ
The increase in drug use by our society has spawned related criminal activity, including
robberies, assaults, murder and arson. The illegal drug trade and drug use impacts the crime of
arson in three ways: first, sometimes a firesetter is under the influence of alcohol or drugs when
he or she commits the crime; second, methods of processing drugs sometimes cause explosions
and fires; and third, dealers and gang members set property fires to retaliate when drug payments
are overdue or to threaten rivals. There even have been cases of otherwise law-abiding citizens
burning known “shooting galleries” in an effort to rid their neighborhoods of drug activity.
In a study of drug activity and arson conducted by Virginia Commonwealth University, it
was found that 65 percent of arson fires occurred in violent crime areas, and that drug use or sale
was indicated in 31 percent of arson targets. The study found that revenge was the motive for
drug-related arson fires in 23 percent of the cases.18
In 1989, 12 percent of the total fires in New York City were labeled as drug-related
arsons. A 1993 study of five U.S. cities found that roughly 22 percent of arson fires were drug
related. Boston has reported that 20 percent of its drug-related arson cases resulted in fatalities
because drug dealers intentionally set fires at building exits in order to trap people inside. Los
Angeles, Philadelphia, Buffalo, and many other cities around the country have reported an
increasing problem with gangs and drug-related arson. Gangs involved in drug dealing have
burned locations where drugs are used or sold in order to eliminate a competitor’s headquarters
or production facilities. Sometimes they use fire in much the same way as they do drive-by
17 ibid.18 Towberman, Thomas J. And Donna B. Towberman. Final Report on the Relationship Between Drug Activity andArson in Selected Cities. U.S. Department of Justice, Bureau of Alcohol, Tobacco, and Firearms, September 1994,pp. 27-37.

33
shootings. They brazenly set fires in open daylight, in front of scores of witnesses, in order to
instill terror.19
In Minnesota, the State Fire Marshal’s Office is completing a two year study into the
relationship between drug and alcohol use and set fires. Operating under a grant from the U.S.
Fire Administration, the state expects results to be available in early 1998.
The State of Maryland has passed a law intended to provide more stringent consequences
for fires caused during the commission of other crimes, especially drug-related crimes. Anyone
involved in illegal drug activity, such as the sale, use, or production of drugs, and who as a
consequence causes a fire -- even if willful intent can not be proven -- can be held responsible for
the fire. The key section of the law reads:
Any person who, while perpetrating or attempting to perpetrate a crime, shall set fire to
or burn any of the building enumerated in this subtitle, shall upon conviction thereof be
sentenced to the penitentiary for not more than three years.
One of the reasons this type of law is so important is that the fires intentionally or
unintentionally set by drug dealers and users predominately occur in vacant and abandoned
structures that are contiguous to occupied residences. Clearly, innocent neighbors are at risk of
being injured or killed in drug-related fires.
Another casualty of the drug problem is the increasing unavailability of police detectives
to work criminal fires. In large part law enforcement resources for arson control have been
shrinking because of the increased manpower required to pursue homicides and other crimes.
,QDGHTXDWH�6FUHHQLQJ�RI�9ROXQWHHU�)LUHILJKWHUV
One of the most egregious situations is when a firefighter betrays the public’s trust and
turns to arson. The motives of firefighter arsonists often stem from a desire to experience the
excitement that many firefighters feel in putting out fires. Related to this excitement is the
opportunity to appear as a hero by successfully extinguishing a blaze. Other less common
motives include profit and revenge. Sometimes firefighters turn to arson because they are
frustrated by falling incident rates and want to get more hands-on experience fighting fires.
19 ibid., pp. 4-5.

34
There was even a bizarre case in California where the mother of a volunteer firefighter wanted to
“help” her son’s career, so she set multiple fires in his response area, giving him an opportunity
to excel.
While it is not possible to predict a person’s behavior absolutely, warning signs of the
propensity of a prospective fire service member to set fires might be discovered through proper
screening and background checks. A routine procedure in paid departments, volunteer
companies are also feeling pressure to investigate the appropriateness of firefighters for the job
and the inherent public trust that goes with it. Many fire service leaders believe that all potential
new employees should be formally screened through background checks, interviews with
references and neighbors, and driving record histories.
The State of Delaware has taken a commendable, proactive approach to this problem, at a
time when many fire departments would rather not talk about firefighter arson. The Delaware
State Fire School, in cooperation with the Volunteer Fireman’s Association and the State Fire
Marshal’s Office, provides a training course that addresses the problem of firefighter arson, why
it occurs, and how offenders are arrested and prosecuted. The program, “Arson by Firefighters:
A Program for Prevention,” is provided as in-service training to all fire service members.
&LYLO�'LVWXUEDQFHV
Massive property damage and dollar loss can occur when civil unrest turns to arson. This
category of arson fires may be related to religious or political beliefs that use arson to vent anger,
to intimidate, or to attract publicity for a cause. The riots which followed the criminal trial
related to the Rodney King beating took a high economic toll. In the city of Los Angeles alone,
868 incidents of arson were documented, and the losses associated with these fires totaled $462
million.20 More recently, rioting following the shooting death of a black motorist in St.
Petersburg, Florida resulted in dozens of arson fires being set.
20 Los Angeles Fire Department, Fire Investigation Unit. Telephone interview, October, 1996.

35
Part III. Barriers to Combating the Arson Problem
This section addresses a number of issues that present barriers to reducing the incidence
of arson in the U.S. or, at a minimum, to increasing the number of arrests and prosecutions of
suspected arsonists. The topics include the reluctance of prosecutors to pursue arson cases,
inadequate training in arson detection in some fires departments, and the structure of fire
investigation units.
3URVHFXWRU�5HWLFHQFH
A serious problem in countering the incidence of arson fires has been the reluctance of
many local district attorneys to prosecute arson cases. Even the best investigation, the most
thoroughly documented case file, and the best physical and circumstantial evidence go for naught
if the local prosecutor is disinterested or unequipped to take on an arson case. The crux of the
problem is that while physical evidence at the scene can directly prove incendiarism, the
evidence linking the crime to the suspect is usually largely circumstantial. Thus, arson has been
tagged “the most difficult crime to prove”. While some prosecutors would argue the point, this
label has nevertheless become attached to the crime of arson, and it discourages prosecutors.
This is especially true in less populated counties where there are too few arson cases for
prosecutors to develop a level of comfort and expertise in this area. Lackluster prosecution
efforts hamper the success of the State fire investigators who have jurisdiction in these
unincorporated areas.
Urban areas are not necessarily spared from inadequate prosecutor support. Fifteen years
ago, many district attorneys were rallying to the call for special prosecutors to handle all arson
cases and to participate in an arson task force. Budget constraints and rising caseloads virtually
put an end to this effort in many large cities, though there remain a few jurisdictions (e.g.
Chicago) where this ideal solution remains intact.
In an effort to promote better prosecution and conviction rates for arson cases, the U.S.
Fire Administration is co-sponsoring a series of prosecutor arson training courses with the
Department of Treasury, Bureau of Alcohol, Tobacco and Firearms. Some states are also trying
to work with prosecutors to make them more cognizant of fire behavior and more comfortable
with the methods used to collect evidence. The Texas State Fire Prevention Commission, for
example, helped produce a well-researched arson prosecution manual. They sent copies of the

36
manual to all criminal prosecutors in the state and urged that the document be used as a training
tool. At the local level, prosecutors in some cities are participating in joint training with fire and
police investigators. The public safety agencies teach the prosecutors about origin and cause and
criminal investigation work, while the prosecutors instruct investigators on legal technicalities,
courtroom procedures, and case presentation requirements.
A few prosecutors have placed a high priority on arson cases, building distinguished
careers in part on their expertise and success in putting arsonists behind bars. Mary Galvin in
Connecticut is a much sought after expert on the subject. Diane Gordon in Cook County, Illinois
and Dan Mabley in Hennepin County, Minnesota gained significant recognition and public
confidence for their work in arson, among other issues. Both are now judges.
7UDLQLQJ�LQ�$UVRQ�'HWHFWLRQ
The main factors that influence the “winnability” of an arson case rest with how the fire
incident is handled at the beginning and the end of the case. If an otherwise good case is
mishandled by a prosecutor (or not pursued at all), the investigator’s work goes for naught and
the arsonist is free to strike again. Likewise, if fire department personnel do not properly identify
a suspicious fire, then an investigation that could uncover arson never occurs. Many fire
departments now routinely train department personnel on arson awareness. These courses
typically detail the things firefighters should be aware of en route to and upon arrival at the
scene, and why overhaul should wait until an investigator can process the scene. Safeguarding
potential evidence is critical. Other important issues are call-out guidelines for notifying fire
investigators, maintaining custody of the scene, and assisting investigators with lighting tools and
manpower.
There remain many departments, especially rural fire departments with volunteer staff,
that do not receive arson awareness training. Volunteer departments generally look to the State
Fire Marshal’s Office for this type of training -- unfortunately, most of them have been hit
comparatively harder with budget cuts than many cities, so the money needed to run field
training programs is hard to come by.
The U.S. Fire Administration is responding by generating a new firefighter arson
awareness course that will be made available to local fire departments. In addition, private sector
sponsors should be tapped to work in partnership with the State and with local departments.
Insurance companies, for example, could help pay for the development of course materials, offer

37
facilities for training, or underwrite the cost of trainers/instructors. Another resource is the
Federal government, which in 1996 released over $700,000 for arson training programs to
increase state capabilities for investigating arson fires, particularly in rural areas.
6WUXFWXUH�RI�)LUH�,QYHVWLJDWLRQ�8QLWV
It is widely held that arsonists stand more of a chance of getting caught and convicted if
fire and police investigators work together on investigating fires. In fact, many U.S. cities formed
such interagency investigation units in the late 1970s and early 1980s when Federal programs like
the Law Enforcement Assistance Act provided seed money for these experiments. But rising
homicide and drug-related crime rates coupled with declining tax bases in cities put fire and
police teams into early retirement, even though by many accounts they had been successful. A
few cities, like Indianapolis and Buffalo, maintained their teams. But in other communities, dual-
agency investigation teams were dismantled. Bridgeport, Connecticut investigated 81 percent of
all structure fires in fiscal year l988-89, and officials felt they were able to identify virtually all of
the incendiary cases. But in fiscal year 1991-92, only 57 percent of structures fires were
investigated -- a direct result of a policy decision to remove the police detectives from the unit.21
7UDLQLQJ�DQG�&HUWLILFDWLRQ�LQ�)LUH�,QYHVWLJDWLRQ
Training line firefighters to detect signs of criminal firesetting helps with the first leg of
strengthening local arson control capabilities. Adequately training the fire investigators is the
next step. Over the last ten years, the U.S. has made gains in the quality and availability of fire
and arson investigation training courses. Investigators have access to program through the
National Fire Academy, the FBI, and the Bureau of Alcohol, Tobacco and Firearms -- both
through resident and field delivered courses. Many State Fire Marshals Offices use their field
investigators to conduct basic investigation instruction for volunteer departments.
The International Association of Arson Investigation (IAAI) and their local and State
chapters routinely provide seminars related to arson control. Investigators now can become
certified through either IAAI’s process and/or by meeting NFPA’s certification criteria. The
NFPA 921 Committee on Fire and Explosion Investigations also continues its research and work
on the 1998 edition of the NFPA 921 Guide. The field has made great strides in becoming more
professional.
21 U.S. Fire Administration. Managing Arson Control: Ideas from Studies of State and Local Programs. U.S. FireAdministration, January 1994, p. 16.

38
Today, the shortage of adequately trained investigators has been addressed, in part,
through cross-training and by providing police powers to fire department investigators. While not
as advantageous a situation as having police partners, the fire investigators are qualified and
equipped to handle full arson investigations. Unfortunately, inadequate staffing levels and
reticent police and fire chiefs who have not endorsed police powers for fire investigators have
left some major cities with a dilemma: they have good origin and cause work that has nowhere to
go. These situations make it more likely that arsonists will get away with their crimes.
Conclusion
Arson in the U.S. is characterized by increasing violence, fewer resources, and competing
demands on law enforcement and prosecutors. It is the leading cause of all fires and the number
two killer of fire victims in residential structures. Juveniles, as in other major crimes, increasingly
are responsible for the casualties and property loss wrought by incendiary fires.
Two conclusions are evident at this point. First, better information is needed in order to
more precisely define the arson problem in the U.S. Second, public safety agencies, community
leaders, and the general public need to be made more aware of the extent and deadly nature of
the arson problem. Then the political support needed to prevent further erosion of arson control
initiatives can be generated.
Systematic research into the problem of arson in the U.S. is hampered by a lack of
information. More data is needed on the incidence of arson fires and the motivations of arsonists
in setting them. Currently the National Fire Incident Reporting System (NFIRS) has a
classification for arson fires but does not collect data on individuals who set them. One possible
solution is to develop a national protocol separate from NFIRS to collect data on incendiary and
suspicious fires. This would allow collection of data critical to a better understanding of the
nature of the arson problem in the U.S., including types of firesetters, firesetter motives, and prior
histories of firesetting among firesetters. The Bureau of Alcohol, Tobacco, and Firearms is
currently working toward this goal by establishing the Arson and Explosives Incident System
2000 (AEXIS 2000). The System is being designed as a national repository of information on the
suspected criminal use of explosives and of arson incidents.

39
At the local level, all suspected cases of arson must be classified, reported, and pursued as
incendiary or suspicious or our understanding of the extent of the arson problem in the U.S. will
remain incomplete. Inadequate investigator training in some areas, particularly rural areas,
means that many fires of an incendiary or suspicious nature currently are not identified and do
not get fully investigated. Local prosecutors need to participate in training as well.
Political support for arson control at all levels of government would enable state and local
governments to access new training and technical assistance designed to improve the extremely
low two-percent conviction rate associated with arson. Currently, budgetary constraints and
other demands on staff have reduced the level of fire and police resources available to
investigate suspected arson cases in many cities throughout the U.S. These circumstances exist
even though many are aware that closer cooperation between fire and law enforcement officials
is critical to stemming the tide of arson fires.
In sum, better information, more training and technology, and stronger linkages among
public safety agencies are needed to reduce the incidence of arson in our communities, a crime
which bears extremely high costs both in terms of lives and property. Without improvements in
these areas, little headway can be made in the effort to reduce the incidence and damage caused
by arson fires in the U.S.

40
References
John R. Hall, Jr. 1996. U.S. Arson Trends and Patterns - 1995. Quincy, MA: National FireProtection Association.
Karchmer, Clifford L. 1996. “When Young Firesetters Come of Age.” Firehouse. (August) pp.37-38.
Sternlieb, George and Robert Burchell. 1973 “Fires in Abandoned Buildings.” Fire Journal.Vol. 67, no. 2 (March), pp. 24-31.
Towberman, Thomas J. And Donna B. Towberman. 1994. Final Report on the RelationshipBetween Drug Activity and Arson in Selected Cities. Washington, D.C.: U.S. Department ofJustice, Bureau of Alcohol, Tobacco, and Firearms.
U.S. Department of Justice. 1993. Crime in the United States, 1992: Uniform Crime Reports.Washington, D.C.: Federal Bureau of Investigation, U.S. Department of Justice.
United States Fire Administration. 1993. Fire in the United States, 1983 - 1990. Washington,D.C.: Federal Emergency Management Agency, United States Fire Administration.
U.S. Fire Administration. 1994. Managing Arson Control: Ideas from Studies of State andLocal Programs. Washington, D.C.: U.S. Fire Administration.