Embed Size (px)
Citation preview
www.pittsburghpa.gov/police
1. INTRODUCTION
This brief presents an analysis of arson in the City of Pittsburgh from January 2005 through July 2015. It begins with a study of trends in the Pittsburgh arson rate in comparison to benchmark U.S. cities. Next, this report examines the nature of arson in the City of Pittsburgh, with special attention to the distinct categories of arson, the times when arsons are most prevalent, and the geographic distribution of arson throughout the city. This brief concludes with an examination of the Pittsburgh Bureau of Police’s clearance rate statistics and the relationship between clearance rates and crime characteristics, including locations, times and victim demographics.
This document offers three broad conclusions about arson in the City of Pittsburgh:
1. Arson rates have increased in the City of Pittsburgh since 2005, contrary to trends observed in comparable cities.
2. Arson is most prevalent in the Homewood, North Side and South Side Hilltop neighborhoods of Pittsburgh.
3. Arson clearance rates are highest during the first months of the year and for arsons involving an occupied structure.
Arson Defined
Any willful or malicious burning or attempting to burn, with or without intent to defraud, a
dwelling house, public building, motor vehicle or aircraft, personal property of another, etc.
— The FBI Uniform Crime Report
OCTOBER 2015
Arson in the City of Pittsburgh
City of Pittsburgh Bureau of Police | Arson in the City of Pittsburgh | October 2015 page 1
www.pittsburghpa.gov/police
2. DATA
2.1. Sources
City of Pittsburgh Bureau of Police Offense DataThe analysis in this report is drawn, largely, from incident data collected by the City of Pittsburgh Bureau of Police and reported under the FBI Uniform Crime Report. These data are available for incidents that occurred from January 2005 through July 2015, and include information about the location, date, time and clearance status of each incident. These data also include victim information, including age, race and gender, for the period January 2009 through July 2015.
Federal Bureau of Investigation, Uniform Crime Report (UCR)The Federal Bureau of Investigation collects crime data from police agencies nationwide. Because crime rates tend to vary with a city’s population size,1 this brief uses data from the UCR to compare Pittsburgh’s 2014 arson rate to similarly sized U.S. cities, referred to as the FBI cohort. Specifically, this brief compares Pittsburgh’s rate of arson to that of cities, with populations 250,000 to 499,999, which reported this crime to the UCR in 2014.
United States Census BureauThe analysis in this brief incorporates population estimates from the U.S. Census Bureau’s 2014 Population Estimates Program to compute the arson rates of 13 comparable U.S. cities and the City of Pittsburgh.
PGHSNAP, City of Pittsburgh Department of City Planning The analysis of arson incident rates by neighborhood incorporates data from the City of Pittsburgh’s Department of City Planning data tool, PGHSNAP. PGHSNAP offers population and demographic statistics derived from the 2010 US Census.
Pittsburgh TodayThis report uses 13 of the 14 Pittsburgh Today benchmark cities to compare Pittsburgh’s arson rate to those in comparable cities. Pittsburgh Today is a University of Pittsburgh project that has identified a list of 14 U.S. cities that are similar in size and demographics to the City of Pittsburgh, for use in comparing key indicators. The Pittsburgh Today benchmark cities include: Baltimore, Boston, Charlotte, Cleveland, Cincinnati, Denver, Detroit, Indianapolis, Kansas City, Milwaukee, Minneapolis, Philadelphia, Richmond and St. Louis. Indianapolis is omitted from this analysis, due to inconsistencies in data reported to the FBI.
1 Lee Ellis, Kevin M. Beaver, and John Wright, Handbook of Crime Correlates, 2009, San Diego, CA: Academic Press.

City of Pittsburgh Bureau of Police | Arson in the City of Pittsburgh | October 2015 page 2
www.pittsburghpa.gov/police
2.2 Period of StudyMuch of the analysis in this report is derived from incident records collected from 2005 through 2014, the most recent years for which complete and reliable City of Pittsburgh data are available. A study of clearance rates, for example, would be skewed by the inclusion of recent 2015 records, since there is a lower likelihood of case resolution. However, this report does include 2015 data in the analyses of victim demographics, as the 2015 records offer victim descriptions nearly as complete as those of prior years. Victim data are only available for records collected from January 2009 through July 2015.
In comparing across U.S. cities, this report draws on data from the FBI’s Uniform Crime Reporting Program, which has released national statistics through 2014. Comparisons of arson rates or clearance rates, therefore, include comparisons to Pittsburgh’s 2014 data.
2.3 Incident-level AnalysisThis report uses incidents, rather than victims, as the primary unit of analysis. In the case of arson, there are a few duplicate records in the data. Records of this kind were consolidated for the purposes of this brief, except when used for victim demographic analysis.
3. ANALYSIS
3.1 Trends in ArsonIn 2014, Pittsburgh Police responded to 186 incidents of arson, at a rate of 62 arsons per 100,000 city residents. This rate is among the highest in a group of comparable mid-sized cities, selected for comparison purposes by Pittsburgh Today. Figure 1 compares Pittsburgh’s 2014 arson rate to the rates of these 12 cities. Although Pittsburgh’s rate is lower than the rates of Cincinnati, Cleveland and Detroit, arsons in Pittsburgh still far exceed the benchmark median of 40 per 100,000.
FIGURE 1: Arson rates of comparable U.S. cities, 2014
0 20 40 60 80 100 120
Cincinnati
Cleveland
Detroit
Pittsburgh
St. Louis
Milwaukee
Kansas City
Baltimore
Minneapolis
Philadelphia
Denver
Richmond
Charlotte
City of Pittsburgh Bureau of Police | Arson in the City of Pittsburgh | October 2015 page 3
www.pittsburghpa.gov/police
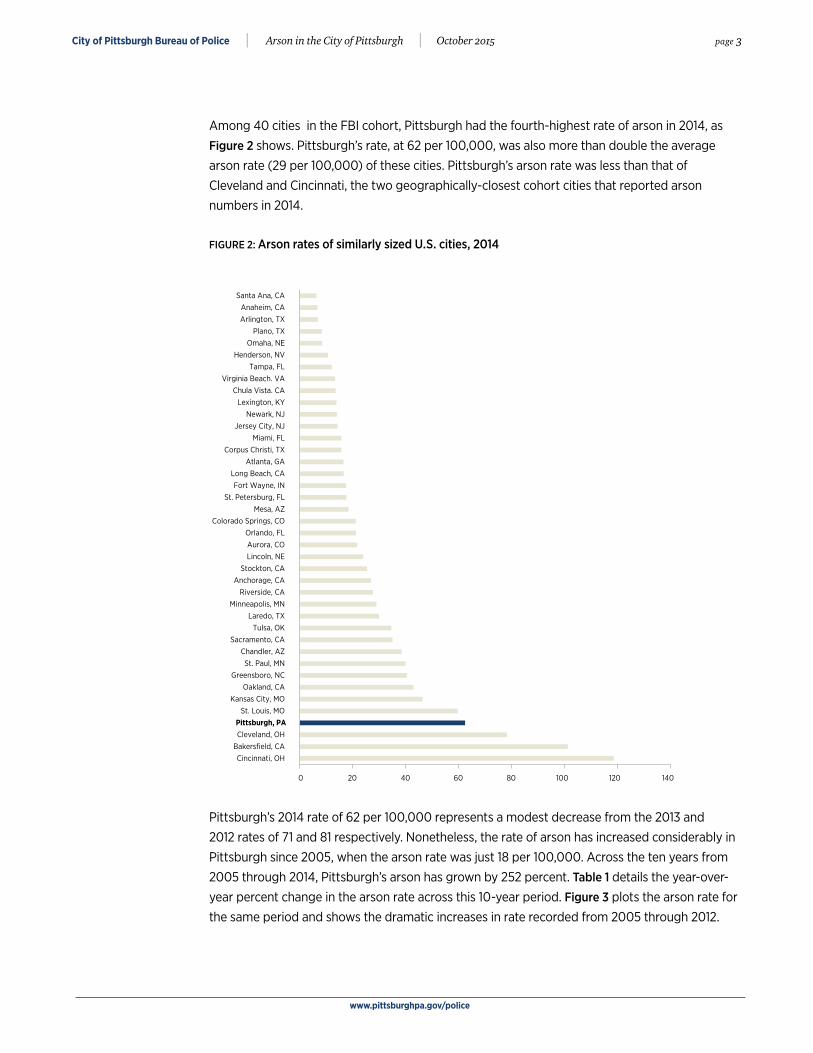
Among 40 cities in the FBI cohort, Pittsburgh had the fourth-highest rate of arson in 2014, as Figure 2 shows. Pittsburgh’s rate, at 62 per 100,000, was also more than double the average arson rate (29 per 100,000) of these cities. Pittsburgh’s arson rate was less than that of Cleveland and Cincinnati, the two geographically-closest cohort cities that reported arson numbers in 2014.
FIGURE 2: Arson rates of similarly sized U.S. cities, 2014
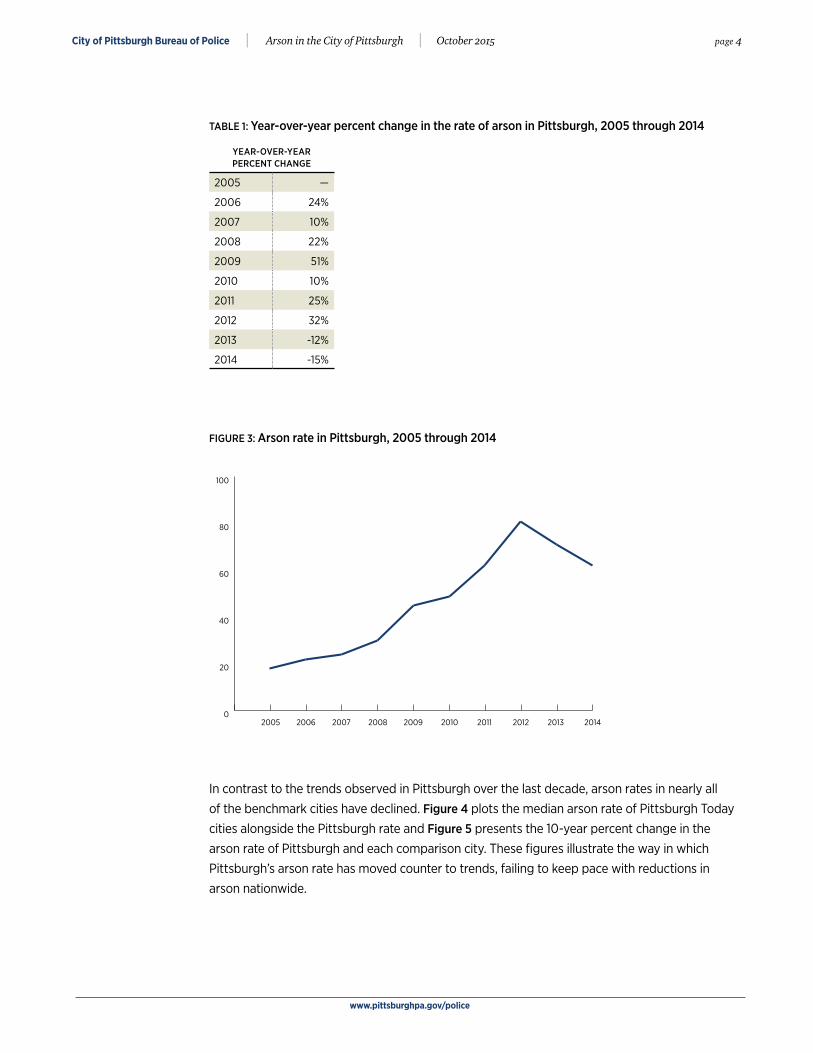
Pittsburgh’s 2014 rate of 62 per 100,000 represents a modest decrease from the 2013 and 2012 rates of 71 and 81 respectively. Nonetheless, the rate of arson has increased considerably in Pittsburgh since 2005, when the arson rate was just 18 per 100,000. Across the ten years from 2005 through 2014, Pittsburgh’s arson has grown by 252 percent. Table 1 details the year-over-year percent change in the arson rate across this 10-year period. Figure 3 plots the arson rate for the same period and shows the dramatic increases in rate recorded from 2005 through 2012.
0 20 40 60 80 100 120 140
Cincinnati, OH
Bakersfield, CA
Cleveland, OH
Pittsburgh, PASt. Louis, MO
Kansas City, MO
Oakland, CAGreensboro, NC
St. Paul, MN
Chandler, AZSacramento, CA
Tulsa, OKLaredo, TX
Minneapolis, MNRiverside, CA
Anchorage, CAStockton, CA
Lincoln, NEAurora, CO
Orlando, FLColorado Springs, CO
Mesa, AZSt. Petersburg, FL
Fort Wayne, IN
Long Beach, CA
Atlanta, GACorpus Christi, TX
Miami, FL
Jersey City, NJ
Newark, NJLexington, KY
Chula Vista. CA
Virginia Beach. VA
Tampa, FLHenderson, NV
Omaha, NEPlano, TX
Arlington, TXAnaheim, CA
Santa Ana, CA
City of Pittsburgh Bureau of Police | Arson in the City of Pittsburgh | October 2015 page 4
www.pittsburghpa.gov/police
TABLE 1: Year-over-year percent change in the rate of arson in Pittsburgh, 2005 through 2014
YEAR-OVER-YEAR PERCENT CHANGE
2005 —
2006 24%
2007 10%
2008 22%
2009 51%
2010 10%
2011 25%
2012 32%
2013 -12%
2014 -15%
FIGURE 3: Arson rate in Pittsburgh, 2005 through 2014
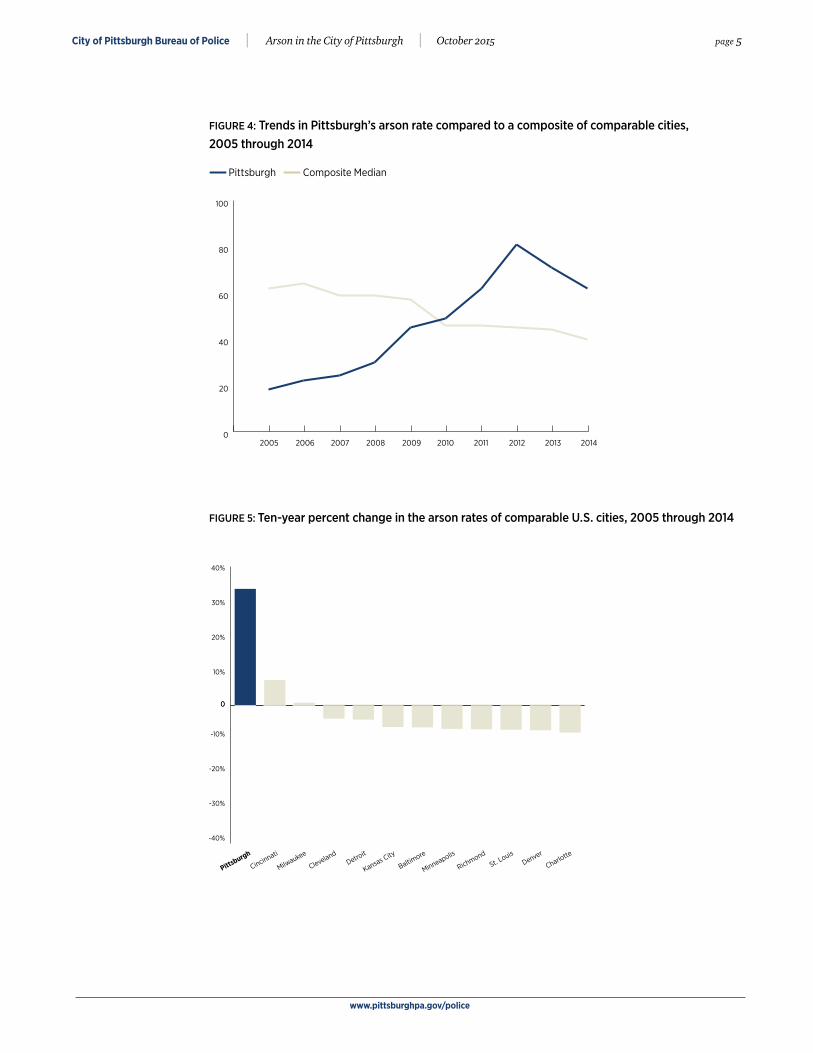
In contrast to the trends observed in Pittsburgh over the last decade, arson rates in nearly all of the benchmark cities have declined. Figure 4 plots the median arson rate of Pittsburgh Today cities alongside the Pittsburgh rate and Figure 5 presents the 10-year percent change in the arson rate of Pittsburgh and each comparison city. These figures illustrate the way in which Pittsburgh’s arson rate has moved counter to trends, failing to keep pace with reductions in arson nationwide.
0
20
40
60
80
100
2005 2006 2007 2008 2009 2010 2011 2012 2013 2014
City of Pittsburgh Bureau of Police | Arson in the City of Pittsburgh | October 2015 page 5
www.pittsburghpa.gov/police
FIGURE 4: Trends in Pittsburgh’s arson rate compared to a composite of comparable cities, 2005 through 2014
Pittsburgh Composite Median
FIGURE 5: Ten-year percent change in the arson rates of comparable U.S. cities, 2005 through 2014
0
20
40
60
80
100
2005 2006 2007 2008 2009 2010 2011 2012 2013 2014
Rate
per
100,
00
0 re
side
nts
00
Pittsburgh
Cincinnati
Milwaukee
ClevelandDetro
it
Kansas City
Baltimore
Minneapolis
RichmondSt. L
ouisDenver
Charlotte
10%
20%
30%
40%
-40%
-30%
-20%
-10%
City of Pittsburgh Bureau of Police | Arson in the City of Pittsburgh | October 2015 page 6
www.pittsburghpa.gov/police
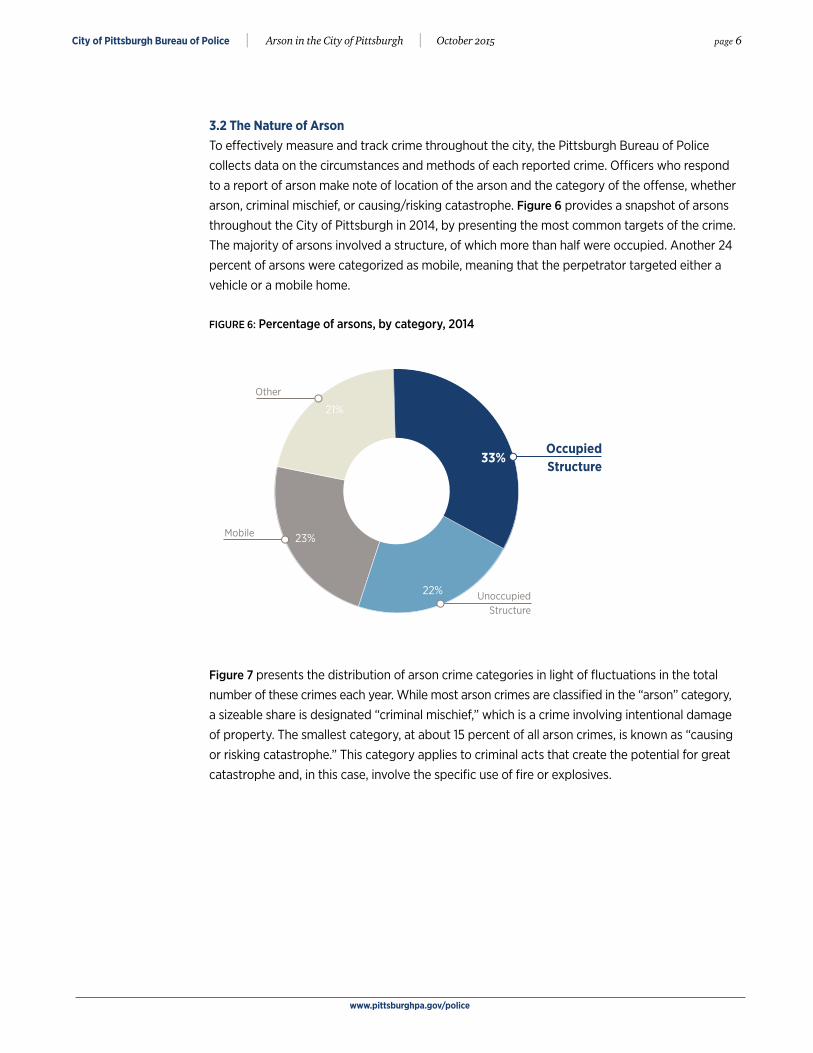
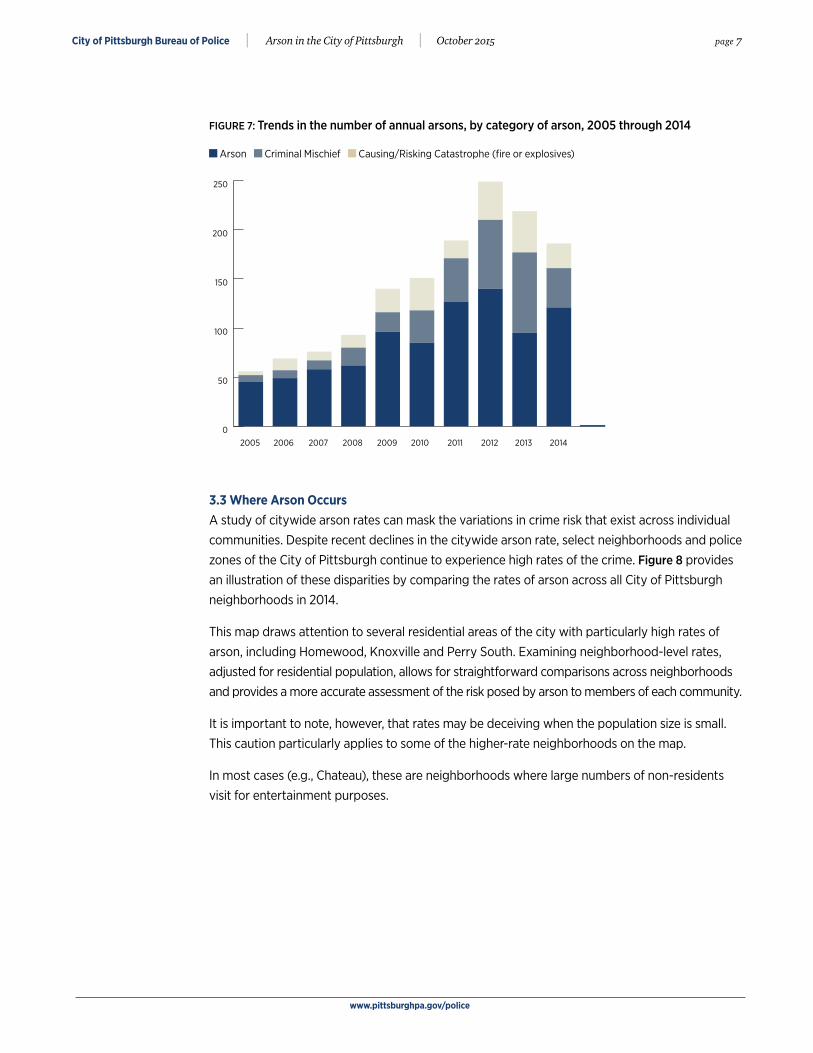
3.2 The Nature of ArsonTo effectively measure and track crime throughout the city, the Pittsburgh Bureau of Police collects data on the circumstances and methods of each reported crime. Officers who respond to a report of arson make note of location of the arson and the category of the offense, whether arson, criminal mischief, or causing/risking catastrophe. Figure 6 provides a snapshot of arsons throughout the City of Pittsburgh in 2014, by presenting the most common targets of the crime. The majority of arsons involved a structure, of which more than half were occupied. Another 24 percent of arsons were categorized as mobile, meaning that the perpetrator targeted either a vehicle or a mobile home.
FIGURE 6: Percentage of arsons, by category, 2014
Figure 7 presents the distribution of arson crime categories in light of fluctuations in the total number of these crimes each year. While most arson crimes are classified in the “arson” category, a sizeable share is designated “criminal mischief,” which is a crime involving intentional damage of property. The smallest category, at about 15 percent of all arson crimes, is known as “causing or risking catastrophe.” This category applies to criminal acts that create the potential for great catastrophe and, in this case, involve the specific use of fire or explosives.
OccupiedStructure
33%
UnoccupiedStructure
22%
Mobile
Other
23%
21%
City of Pittsburgh Bureau of Police | Arson in the City of Pittsburgh | October 2015 page 7
www.pittsburghpa.gov/police
FIGURE 7: Trends in the number of annual arsons, by category of arson, 2005 through 2014
Arson Criminal Mischief Causing/Risking Catastrophe (fire or explosives)
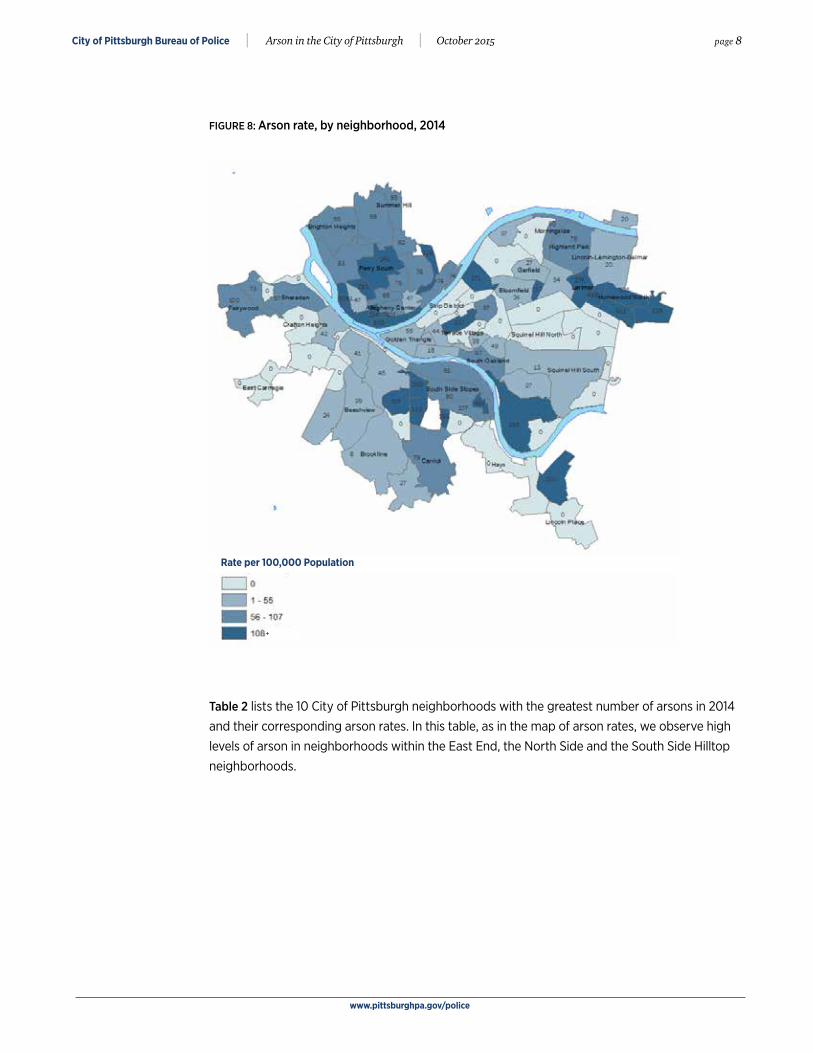
3.3 Where Arson OccursA study of citywide arson rates can mask the variations in crime risk that exist across individual communities. Despite recent declines in the citywide arson rate, select neighborhoods and police zones of the City of Pittsburgh continue to experience high rates of the crime. Figure 8 provides an illustration of these disparities by comparing the rates of arson across all City of Pittsburgh neighborhoods in 2014.
This map draws attention to several residential areas of the city with particularly high rates of arson, including Homewood, Knoxville and Perry South. Examining neighborhood-level rates, adjusted for residential population, allows for straightforward comparisons across neighborhoods and provides a more accurate assessment of the risk posed by arson to members of each community.
It is important to note, however, that rates may be deceiving when the population size is small. This caution particularly applies to some of the higher-rate neighborhoods on the map.
In most cases (e.g., Chateau), these are neighborhoods where large numbers of non-residents visit for entertainment purposes.
0
50
100
150
200
250
2005 2006 2007 2008 2009 2010 2011 2012 2013 2014 2015
City of Pittsburgh Bureau of Police | Arson in the City of Pittsburgh | October 2015 page 8
www.pittsburghpa.gov/police
FIGURE 8: Arson rate, by neighborhood, 2014
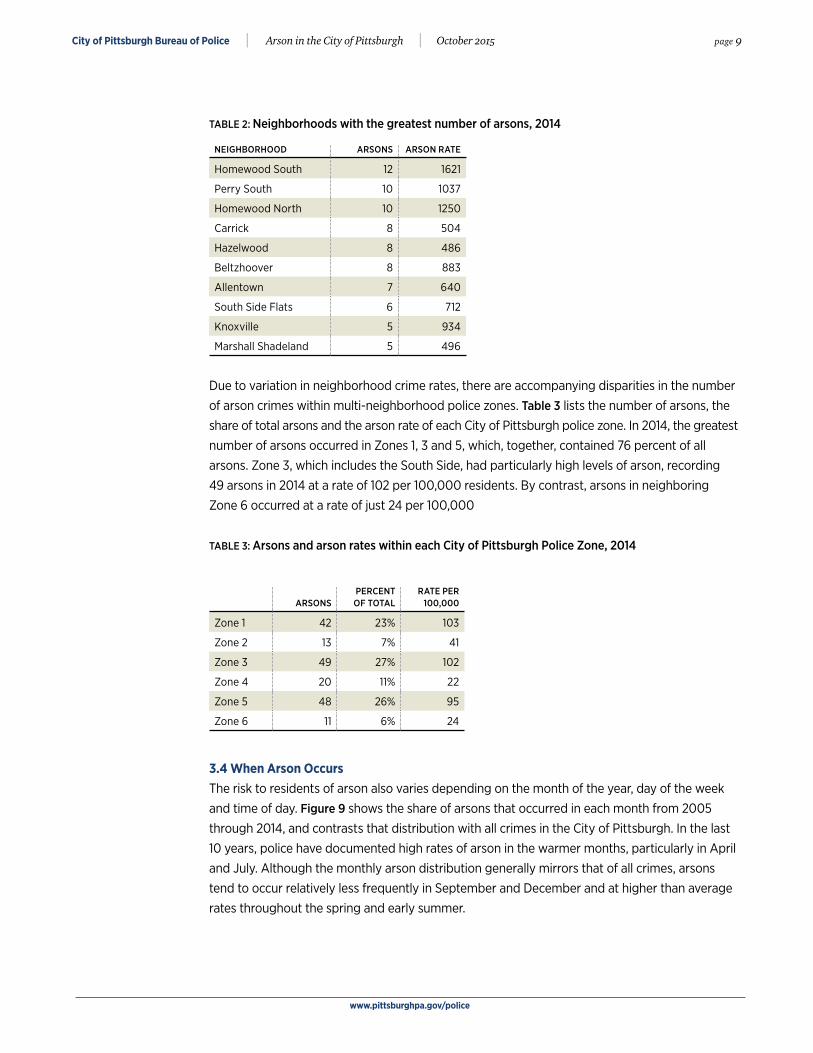
Table 2 lists the 10 City of Pittsburgh neighborhoods with the greatest number of arsons in 2014 and their corresponding arson rates. In this table, as in the map of arson rates, we observe high levels of arson in neighborhoods within the East End, the North Side and the South Side Hilltop neighborhoods.
Rate per 100,000 Population
+
City of Pittsburgh Bureau of Police | Arson in the City of Pittsburgh | October 2015 page 9
www.pittsburghpa.gov/police
TABLE 2: Neighborhoods with the greatest number of arsons, 2014
NEIGHBORHOOD ARSONS ARSON RATE
Homewood South 12 1621
Perry South 10 1037
Homewood North 10 1250
Carrick 8 504
Hazelwood 8 486
Beltzhoover 8 883
Allentown 7 640
South Side Flats 6 712
Knoxville 5 934
Marshall Shadeland 5 496
Due to variation in neighborhood crime rates, there are accompanying disparities in the number of arson crimes within multi-neighborhood police zones. Table 3 lists the number of arsons, the share of total arsons and the arson rate of each City of Pittsburgh police zone. In 2014, the greatest number of arsons occurred in Zones 1, 3 and 5, which, together, contained 76 percent of all arsons. Zone 3, which includes the South Side, had particularly high levels of arson, recording 49 arsons in 2014 at a rate of 102 per 100,000 residents. By contrast, arsons in neighboring Zone 6 occurred at a rate of just 24 per 100,000
TABLE 3: Arsons and arson rates within each City of Pittsburgh Police Zone, 2014
ARSONSPERCENT OF TOTAL
RATE PER 100,000
Zone 1 42 23% 103
Zone 2 13 7% 41
Zone 3 49 27% 102
Zone 4 20 11% 22
Zone 5 48 26% 95
Zone 6 11 6% 24
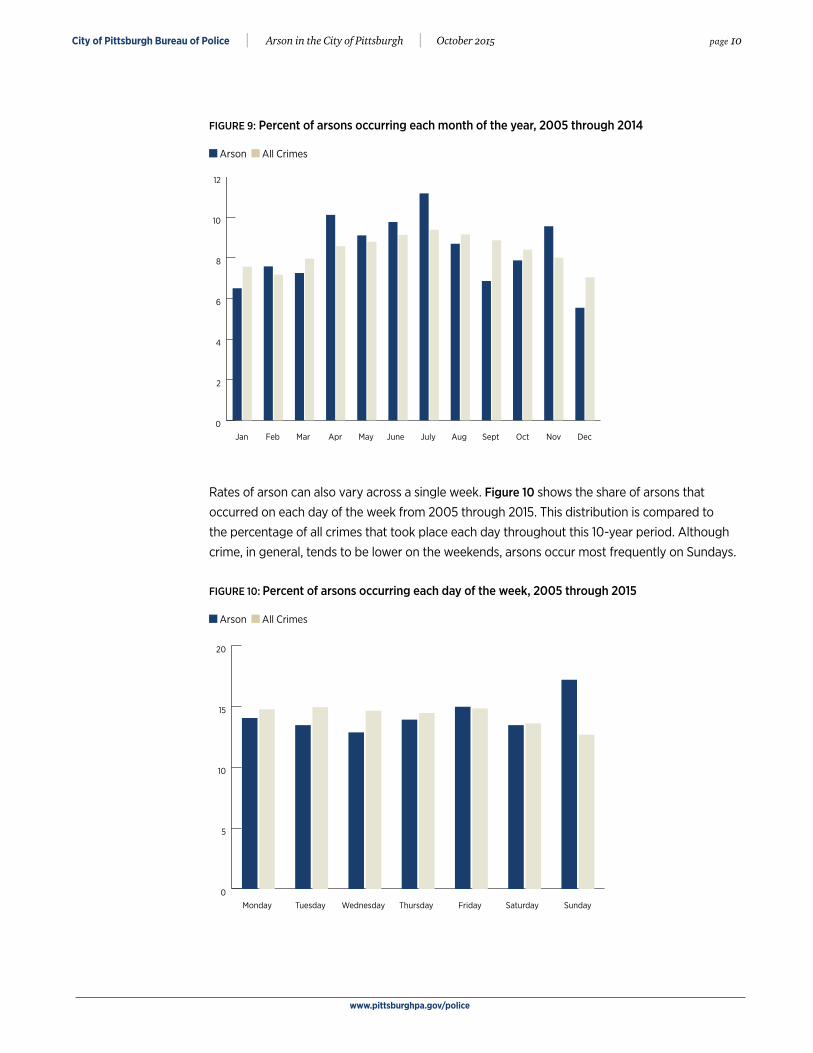
3.4 When Arson OccursThe risk to residents of arson also varies depending on the month of the year, day of the week and time of day. Figure 9 shows the share of arsons that occurred in each month from 2005 through 2014, and contrasts that distribution with all crimes in the City of Pittsburgh. In the last 10 years, police have documented high rates of arson in the warmer months, particularly in April and July. Although the monthly arson distribution generally mirrors that of all crimes, arsons tend to occur relatively less frequently in September and December and at higher than average rates throughout the spring and early summer.
City of Pittsburgh Bureau of Police | Arson in the City of Pittsburgh | October 2015 page 10
www.pittsburghpa.gov/police
FIGURE 9: Percent of arsons occurring each month of the year, 2005 through 2014
Arson All Crimes
Rates of arson can also vary across a single week. Figure 10 shows the share of arsons that occurred on each day of the week from 2005 through 2015. This distribution is compared to the percentage of all crimes that took place each day throughout this 10-year period. Although crime, in general, tends to be lower on the weekends, arsons occur most frequently on Sundays.
FIGURE 10: Percent of arsons occurring each day of the week, 2005 through 2015
Arson All Crimes
0
2
4
6
8
10
12
Jan Feb Mar Apr May June July Aug Sept Oct Nov Dec
0
5
10
15
20
Monday Tuesday Wednesday Thursday Friday Saturday Sunday

City of Pittsburgh Bureau of Police | Arson in the City of Pittsburgh | October 2015 page 11
www.pittsburghpa.gov/police
Arsons also fluctuate over the course of a day. Figure 11 shows the distribution of arson across 12 two-hour time increments, as observed from 2005 through 2015. Arsons occur most frequently late at night, with the largest share of arsons recorded between 6:00 pm and 4:00 am. Arson occurs less frequently in the morning, with less that half as many incidents taking place between 6:00 am and 10:00 am compared to the period between 10 pm and midnight.
FIGURE 11: Arsons by time of day, 2005 through 2015
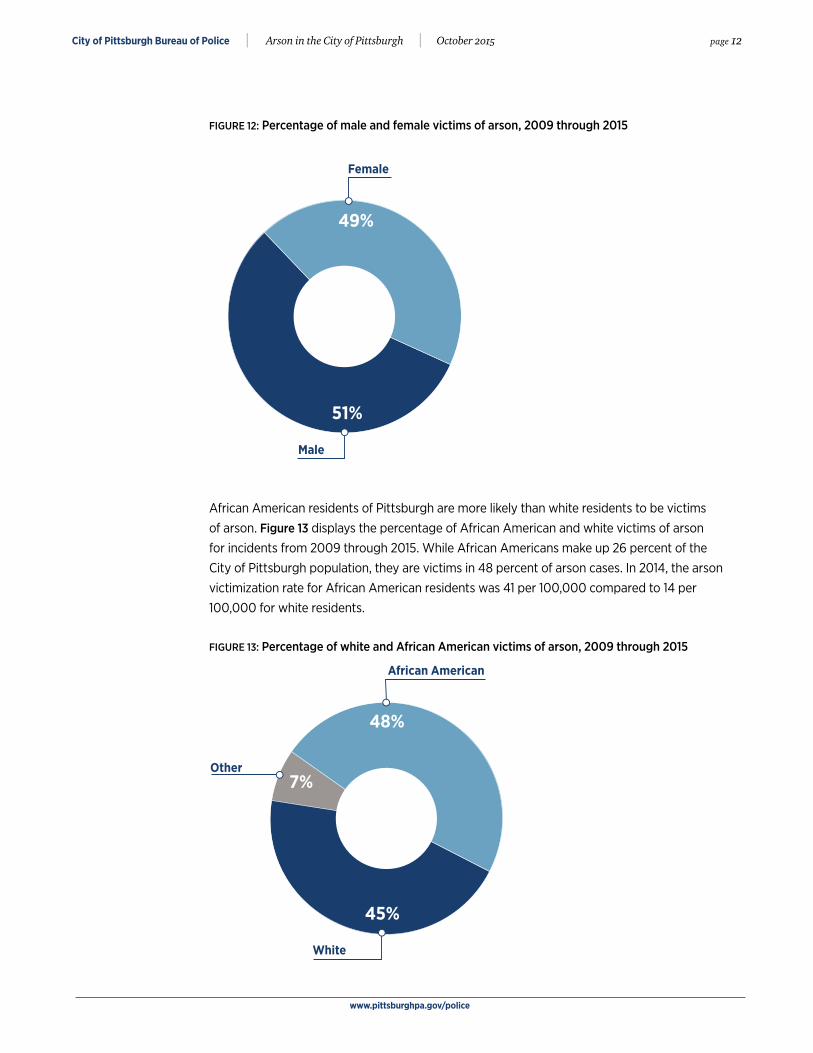
3.5 The Victims of ArsonThe demographics of victims of arson differ slightly from those of the general population of Pittsburgh. Figure 12 displays the percentage of male and female victims of arson for incidents from 2009 through 2015. Since 2009, 53 percent of arson victims have been male and 47 percent have been female. This ratio is similar to the proportion of each gender in the wider population, meaning that victimization rates for men and women are roughly the same.
0
50
100
150
200
12 amto
2 am
2 amto
4 am
4 amto
6 am
6 amto
8 am
8 amto
10 am
10 amto
12 pm
12 pmto
2 pm
2 pmto
4 pm
4 pmto
6 pm
6 pmto
8 pm
8 pmto
10 pm
10 pmto
12 pm
City of Pittsburgh Bureau of Police | Arson in the City of Pittsburgh | October 2015 page 12
www.pittsburghpa.gov/police
FIGURE 12: Percentage of male and female victims of arson, 2009 through 2015
African American residents of Pittsburgh are more likely than white residents to be victims of arson. Figure 13 displays the percentage of African American and white victims of arson for incidents from 2009 through 2015. While African Americans make up 26 percent of the City of Pittsburgh population, they are victims in 48 percent of arson cases. In 2014, the arson victimization rate for African American residents was 41 per 100,000 compared to 14 per 100,000 for white residents.
FIGURE 13: Percentage of white and African American victims of arson, 2009 through 2015
49%
51%
Male
Female
7%
48%
45%
Other
White
African American
City of Pittsburgh Bureau of Police | Arson in the City of Pittsburgh | October 2015 page 13
www.pittsburghpa.gov/police
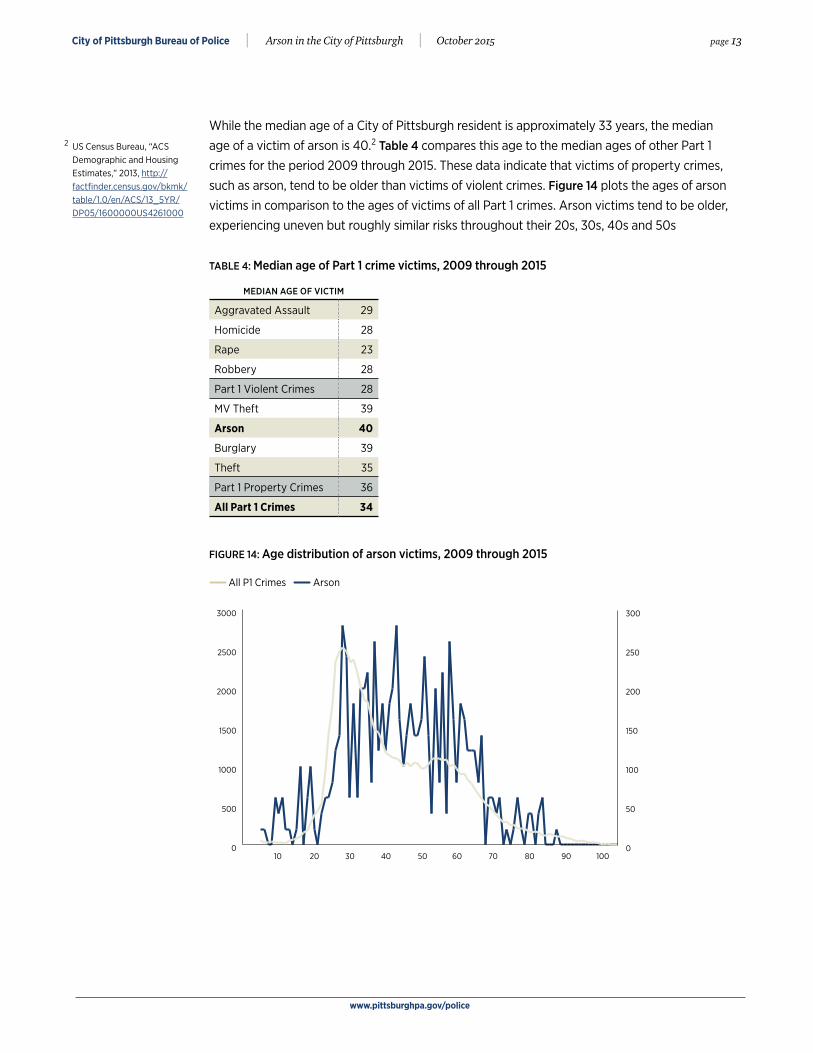
While the median age of a City of Pittsburgh resident is approximately 33 years, the median age of a victim of arson is 40.2 Table 4 compares this age to the median ages of other Part 1 crimes for the period 2009 through 2015. These data indicate that victims of property crimes, such as arson, tend to be older than victims of violent crimes. Figure 14 plots the ages of arson victims in comparison to the ages of victims of all Part 1 crimes. Arson victims tend to be older, experiencing uneven but roughly similar risks throughout their 20s, 30s, 40s and 50s
TABLE 4: Median age of Part 1 crime victims, 2009 through 2015
MEDIAN AGE OF VICTIM
Aggravated Assault 29
Homicide 28
Rape 23
Robbery 28
Part 1 Violent Crimes 28
MV Theft 39
Arson 40
Burglary 39
Theft 35
Part 1 Property Crimes 36
All Part 1 Crimes 34
FIGURE 14: Age distribution of arson victims, 2009 through 2015
All P1 Crimes Arson
0
3
6
9
12
15
0
500
1000
1500
2000
2500
3000
10 20 30 40 50 60 70 80 90 1000
50
100
150
200
250
300
2 US Census Bureau, “ACS Demographic and Housing Estimates,” 2013, http://factfinder.census.gov/bkmk/table/1.0/en/ACS/13_5YR/DP05/1600000US4261000

City of Pittsburgh Bureau of Police | Arson in the City of Pittsburgh | October 2015 page 14
www.pittsburghpa.gov/police
3.6 Clearance Rates for ArsonPolice departments across the country rely on clearance rates as a measure of success. A clearance rate represents the proportion of reported crimes that are investigated and closed. A case is classified as cleared when a perpetrator is arrested and charged or when exceptional circumstances prevent the police and the courts from arresting or prosecuting a known perpetrator. While rising clearance rates can signal increased success in solving crimes, they can also be indicative of falling rates of incident reporting among hard-to-solve crimes, such as theft, or increases in rates of crimes with nearly automatic clearances, such as drug violations, disorderly conduct, or weapon violations.
Due to characteristic differences across Part 1 crimes, it is useful to calculate and track clearance rates within a single crime category. In the City of Pittsburgh, arson tends to have a higher clearance rate than burglary or theft, but a lower rate than rape. Figure 15 illustrates this variation in clearance rate by crime category.
FIGURE 15: Clearance rate by crime type, 2014
0 10 20 30 40 50 60
Rape
Aggravated Assault
Homicide
Robbery
MV Theft
Arson
Theft
Burglary
Key Terms
Cleared by Exceptional Means: The case is closed due to exceptional circumstances that prevent arrest and prosecution. These circumstances can include the death of a suspect, difficulty securing victim cooperation, or challenges with extradition.
Cleared by arrest: Police have arrested a juvenile or adult in connection with the incident, charged them with the crime, and turned the case over to a court.
Pending: The case remains open.
Clearance Rate: The number of cases cleared by arrest or by exceptional means as a percentage of the total number of reported incidents.
City of Pittsburgh Bureau of Police | Arson in the City of Pittsburgh | October 2015 page 15
www.pittsburghpa.gov/police
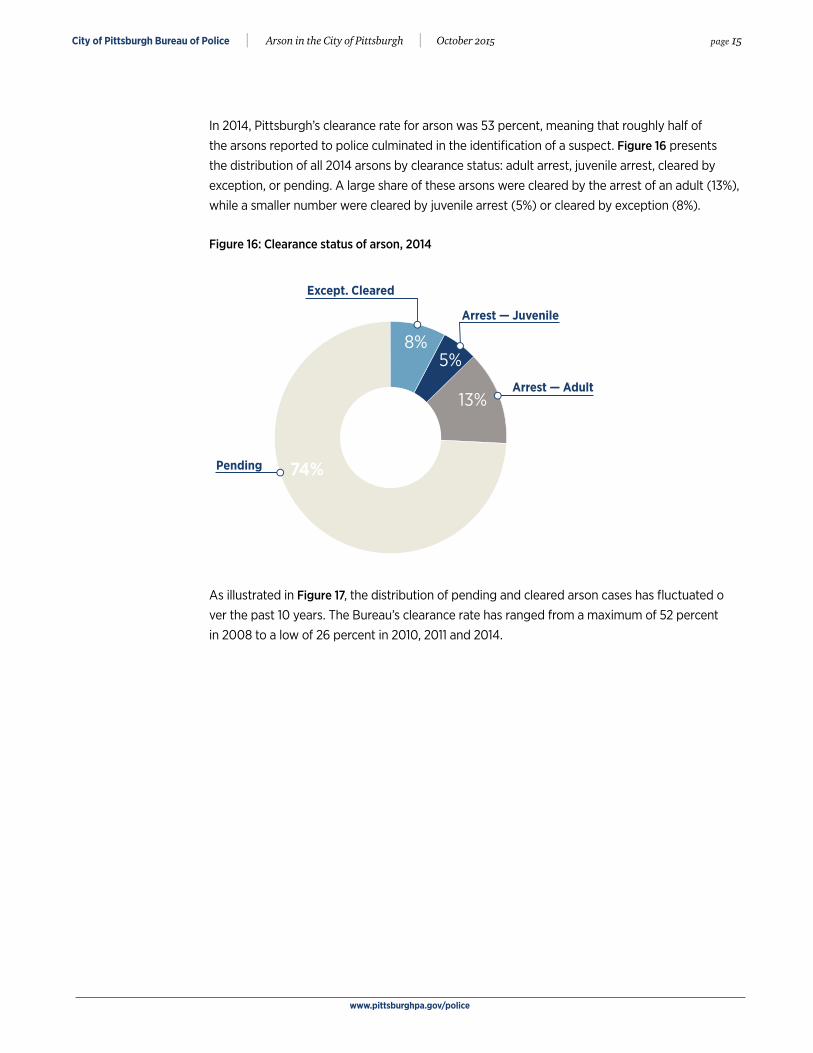
In 2014, Pittsburgh’s clearance rate for arson was 53 percent, meaning that roughly half of the arsons reported to police culminated in the identification of a suspect. Figure 16 presents the distribution of all 2014 arsons by clearance status: adult arrest, juvenile arrest, cleared by exception, or pending. A large share of these arsons were cleared by the arrest of an adult (13%), while a smaller number were cleared by juvenile arrest (5%) or cleared by exception (8%).
Figure 16: Clearance status of arson, 2014
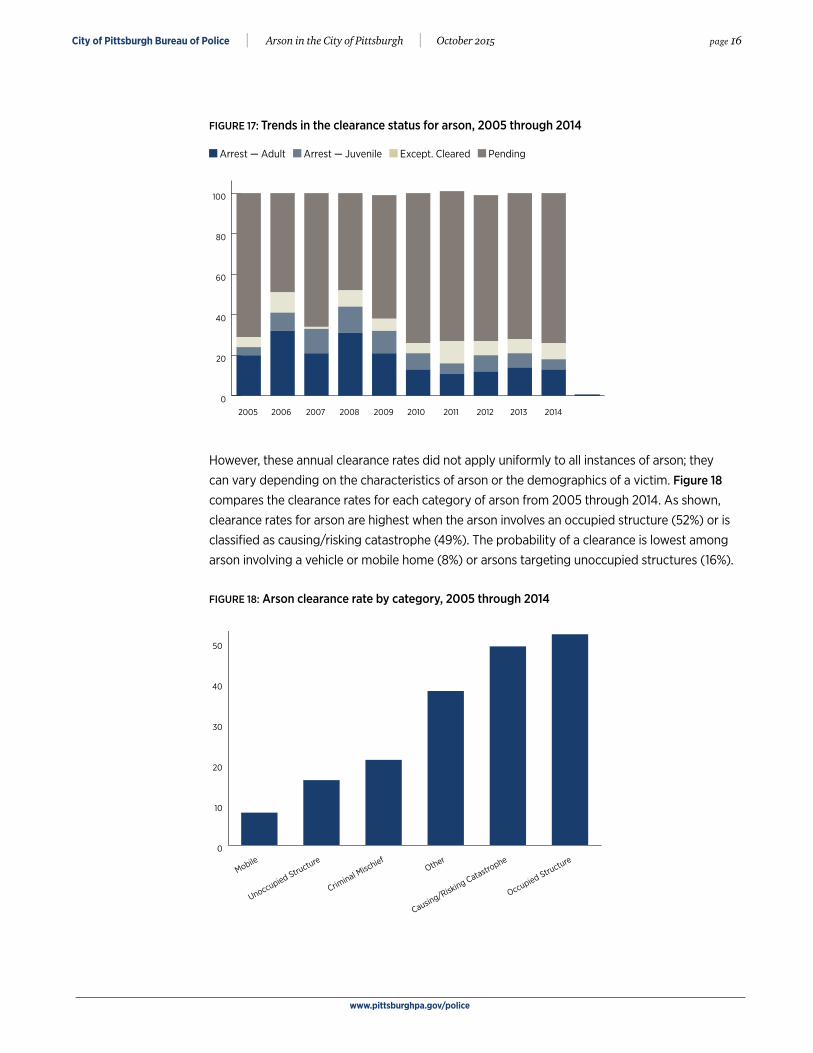
As illustrated in Figure 17, the distribution of pending and cleared arson cases has fluctuated o ver the past 10 years. The Bureau’s clearance rate has ranged from a maximum of 52 percent in 2008 to a low of 26 percent in 2010, 2011 and 2014.
13%
8%
74%Pending
Arrest — Juvenile
Except. Cleared
Arrest — Adult
5%
City of Pittsburgh Bureau of Police | Arson in the City of Pittsburgh | October 2015 page 16
www.pittsburghpa.gov/police
FIGURE 17: Trends in the clearance status for arson, 2005 through 2014
Arrest — Adult Arrest — Juvenile Except. Cleared Pending
However, these annual clearance rates did not apply uniformly to all instances of arson; they can vary depending on the characteristics of arson or the demographics of a victim. Figure 18 compares the clearance rates for each category of arson from 2005 through 2014. As shown, clearance rates for arson are highest when the arson involves an occupied structure (52%) or is classified as causing/risking catastrophe (49%). The probability of a clearance is lowest among arson involving a vehicle or mobile home (8%) or arsons targeting unoccupied structures (16%).
FIGURE 18: Arson clearance rate by category, 2005 through 2014
0
20
40
60
80
100
2005 2006 2007 2008 2009 2010 2011 2012 2013 2014 2015
0
10
20
30
40
50
60
Mobile
Unoccupied Structure
Criminal Mischief
Other
Causing/Risking Catastrophe
Occupied Structure
City of Pittsburgh Bureau of Police | Arson in the City of Pittsburgh | October 2015 page 17
www.pittsburghpa.gov/police
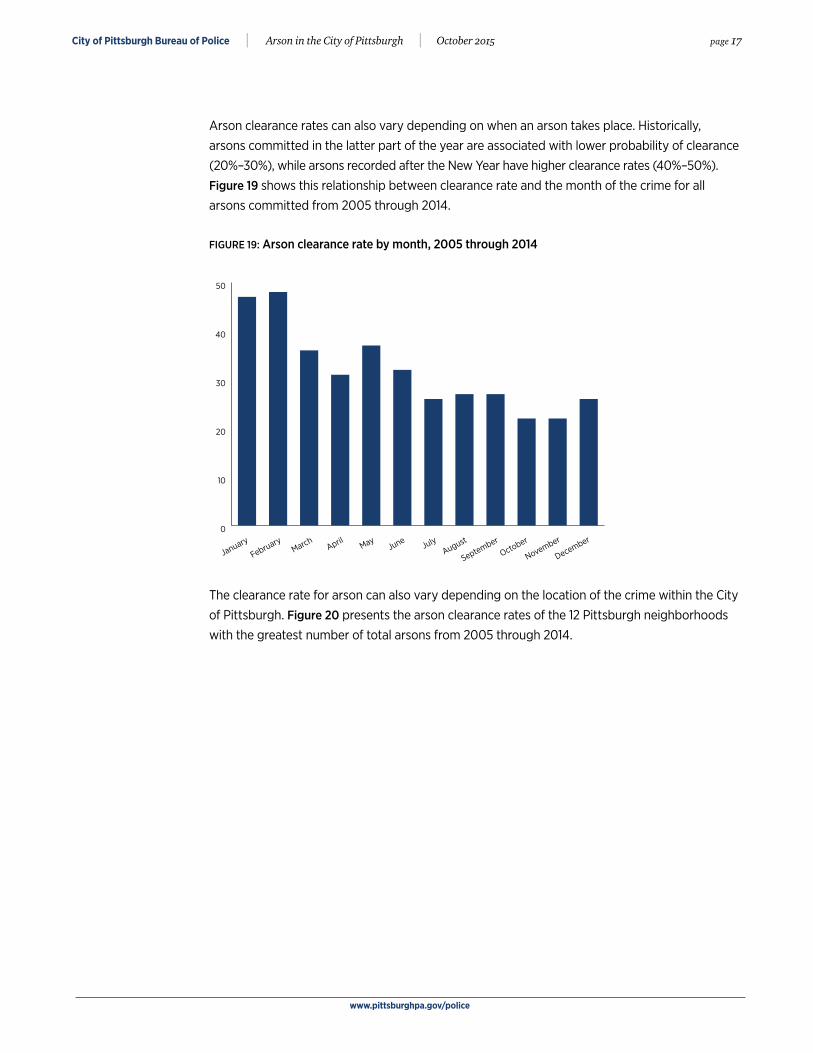
Arson clearance rates can also vary depending on when an arson takes place. Historically, arsons committed in the latter part of the year are associated with lower probability of clearance (20%–30%), while arsons recorded after the New Year have higher clearance rates (40%–50%). Figure 19 shows this relationship between clearance rate and the month of the crime for all arsons committed from 2005 through 2014.
FIGURE 19: Arson clearance rate by month, 2005 through 2014
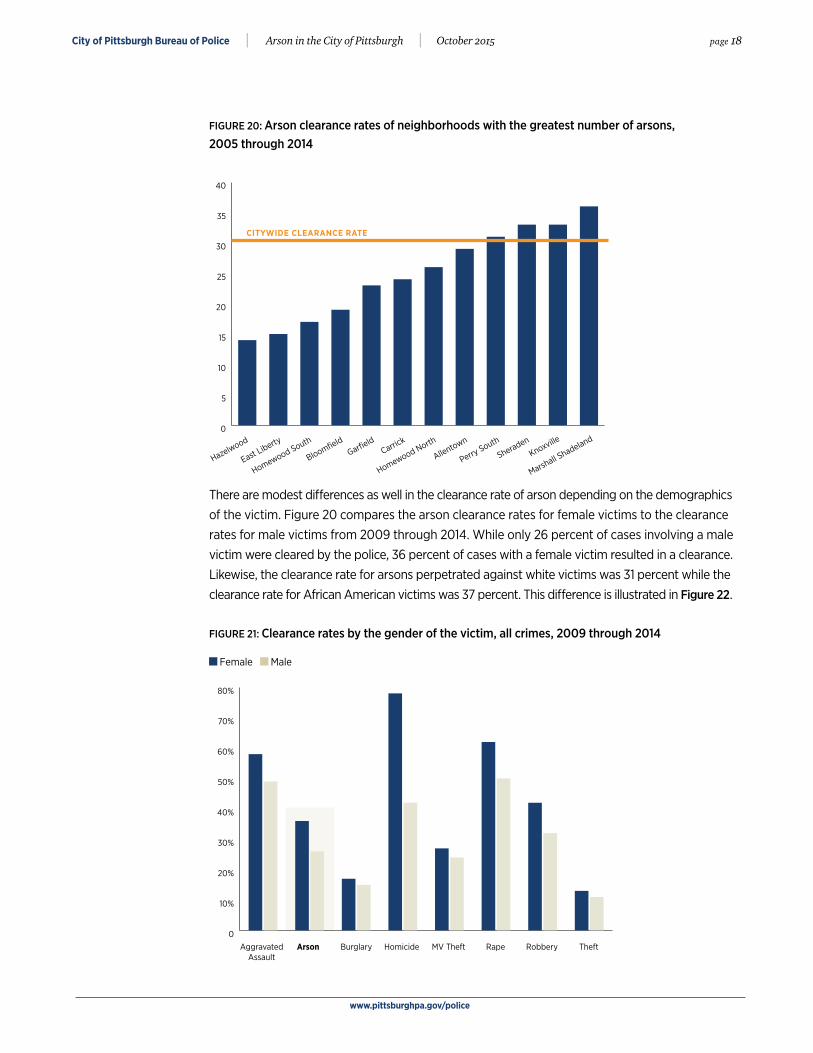
The clearance rate for arson can also vary depending on the location of the crime within the City of Pittsburgh. Figure 20 presents the arson clearance rates of the 12 Pittsburgh neighborhoods with the greatest number of total arsons from 2005 through 2014.
0
10
20
30
40
50
January
FebruaryMarch
April MayJune July
August
September
October
November
December
City of Pittsburgh Bureau of Police | Arson in the City of Pittsburgh | October 2015 page 18
www.pittsburghpa.gov/police
FIGURE 20: Arson clearance rates of neighborhoods with the greatest number of arsons, 2005 through 2014
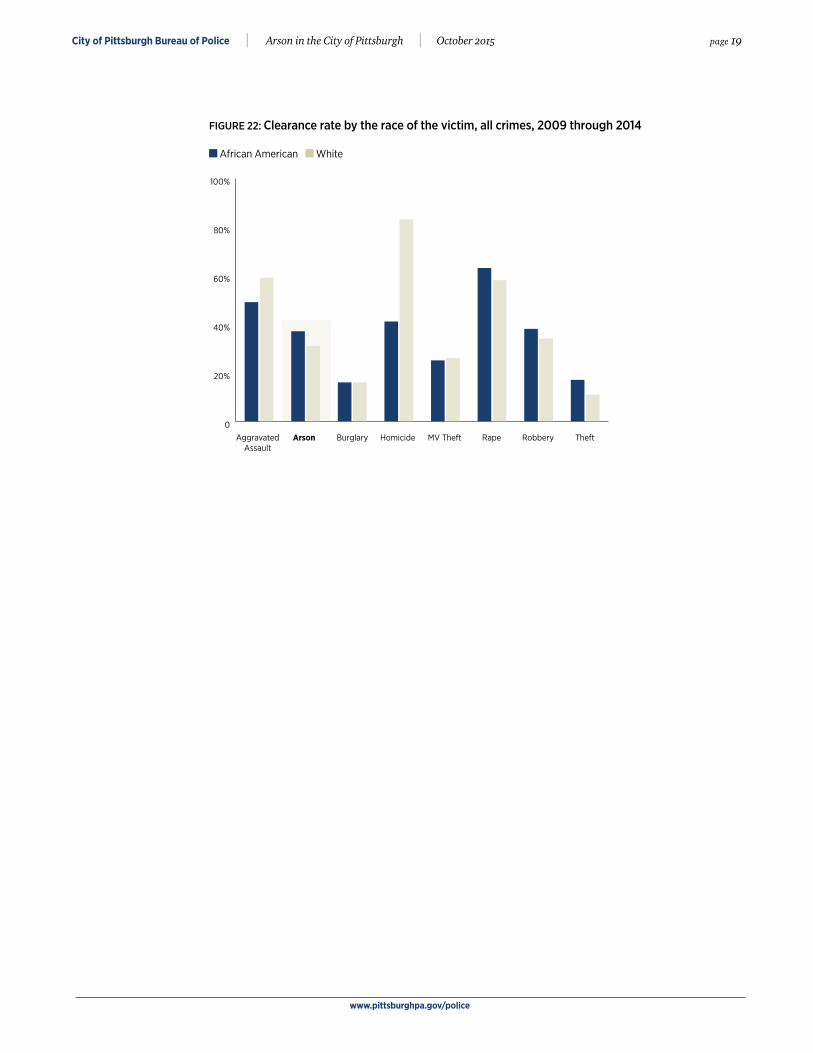
There are modest differences as well in the clearance rate of arson depending on the demographics of the victim. Figure 20 compares the arson clearance rates for female victims to the clearance rates for male victims from 2009 through 2014. While only 26 percent of cases involving a male victim were cleared by the police, 36 percent of cases with a female victim resulted in a clearance. Likewise, the clearance rate for arsons perpetrated against white victims was 31 percent while the clearance rate for African American victims was 37 percent. This difference is illustrated in Figure 22.
FIGURE 21: Clearance rates by the gender of the victim, all crimes, 2009 through 2014
Female Male
0
5
10
15
20
25
30
35
40
Hazelwood
East Liberty
Homewood South
BloomfieldGarfield
Carrick
Homewood North
Allentown
Perry South
Sheraden
CITYWIDE CLEARANCE RATE
Knoxville
Marshall S
hadeland
0
10%
20%
30%
40%
50%
60%
70%
80%
AggravatedAssault
Arson Burglary Homicide MV Theft Rape Robbery Theft
City of Pittsburgh Bureau of Police | Arson in the City of Pittsburgh | October 2015 page 19
www.pittsburghpa.gov/police
FIGURE 22: Clearance rate by the race of the victim, all crimes, 2009 through 2014
African American White
0
20%
40%
60%
80%
100%
AggravatedAssault
Arson Burglary Homicide MV Theft Rape Robbery Theft