Embed Size (px)
Citation preview

1
Roadshow Presentation
November 2012

2
IPO overview
Issuer Alior Bank S.A. (“Alior Bank”, “the Bank” or the “Company”)
Offering
Public offering in Poland to institutional investors, retail investors and employees
Sales to QIBs in reliance on Rule 144A
Sales to institutional investors under Reg S outside the US
Syndicate
Joint Global Coordinators and Joint Bookrunners Barclays IPOPEMA JP Morgan Morgan Stanley
Co-Lead Managers Erste Group Bank, Renaissance Securities (Europe) Ltd
Offering Agent
IPOPEMA
Structure
Primary: PLN700 MM
Secondary: up to PLN1.7 Bn (based on the maximum price)
Immediately after the Offering, the free float of the Bank is expected to exceed 50%
Listing Warsaw Stock Exchange
Overview
Lock-up
Company: 180 days
Carlo Tassara: 270 days
Entities linked to Zaleski family: 360 days
Management board: (i) 360 days for the shares held prior to the IPO, (ii) 36 months for the shares acquired in the IPO, (iii) management incentive scheme with the selling shareholder: 30% locked-up for 270 days, 70% locked-up for 2 years
Employees: 1 year
Stabilisation Brownshoe for up to 8-9% of offered shares
Price range PLN 57 – 71 per share

3
IPO timetable
IPO timetable
Institutional investors‟ subscription period 05 Dec 2012 – 07 Dec 2012
First day of trading at Warsaw Stock Exchange 13/14 Dec
2012
International investors’ settlement with international banks 18/19 Dec
2012
Management roadshow 21 Nov 2012- 04 Dec 2012
Retail investors‟ subscription period 22 Nov 2012 – 03 Dec 2012
Pricing 04 Dec 2012
Institutional bookbuilding (books closing on 04 Dec 2012 at 5 PM CET/4 PM UK) 21 Nov 2012- 04 Dec 2012
Allocations released in the morning 05 Dec 2012
Stabilisation
13/14 Dec 2012 + 30
days

4
Wojciech Sobieraj
Co-Founder & CEO
Niels Lundorff
Co-Founder & Deputy CEO
Today’s presenters

5
The concept The opportunity
Alior: The future of banking
Entrepreneurial
society
IT literate population
Banking market offering
potential
Outdated service models & limited focus on innovation
Outdated & inflexible IT systems
„Legacy‟ and „subsidiary‟ issues: Market dominated by subsidiaries of foreign banks, many with legacy issues
5th largest facebook user in Europe
4 MM Companies(1)
14 MM Households(1)
Underpenetrated market
EU-139% PL-38%
Loans/GDP (3)
2007–2008
Constant innovation
Superior offering at a
fair price
Ability to execute
Cost advantage
Technology centred business model
Fast decision making lead time
Multi channel management
World-wide renowned product
innovation
Top quality bank in Poland
Effective brand concept
Bowler-hat bankers
Significant client acquisition
Management with excellent track
record
Fast profitable branch rollout
Strict risk policy
Flat hierarchy
Cost efficient IT systems
Full centralisation of operations
Outsourcing
(2)
Notes 1. Polish Central Statistical Office as of 2008 2. According to GlobalWebIndex, comScore as of February 2011 3. European Banking Federation, Eurostat as of 2007
Why we started Alior
S1

6
Alior: The future of banking delivered today
4.0% market share in mortgages (new volumes), 3.2% in consumer loans, 3.8% current accounts (8)
Ranked best bank in Poland by Newsweek and Forbes with award-winning staff (4)
Strong market position
Broad platform
1.4 million clients and #1 bank by new client acquisition (1)
#3 physical distribution network (5) and top 5 Internet Bank (6)
Technology advantage
Versatile and advanced IT platform providing a unique competitive advantage
Prized platform (e.g. Forbes 2011; Computerworld 2009 / 2011; Nominated for 2012 Banking Technology Award in the category “Best Internet Banking Services Provider”)
Product innovation
Leading in product innovation in Poland since 2008 (9)
Alior Trader – first bank in Poland with direct FX pricing for individuals (9)
Strict risk management
Advanced scoring model
Minimisation of unknown risks – no proprietary trading
Profit focus Break-even for bank after 22 months
Overdelivery on financial targets
PBT RoE Revenue
983 118 11% 2011 Initial Plan
995 166 14.6% 2011 Actual
1,366 347 23.2% 9M 2012 (2)
Actual
37% 110% 9 ppt. Growth (3)
Source Alior Bank
PLN MM
Going forward
Underpinning fundamentals: Efficiency focus and technology centred business model
Innovation-led growth/ cross-selling
Expansion of client centric network
Redefining business ideas: Virtual bank “Alior Sync – first truly virtual bank in Poland”
Operating leverage from scale
Notes 1. In 1H 2012 based on Bankier.pl 2. Annualised; RoE calculated by dividing net profit (loss) by the average balance of equity (calculated as arithmetical average of equity at the end of the prior fiscal year and the end of a reporting period) 3. Annualised growth compared to 2011 year end 4. As of 2010 and 2011 in Forbes ranking and 2009-2011 for Newsweek ranking, where Alior was recognised the leader of quality 5. Includes branches and agencies as of 3Q 2012 based on Financial Reporting from respective banks 6. According to Newsweek index, based on communication, operating capabilities, quality of service and clients‟ acquisition and retention. Data as of 2011 7. In 2011 effective tax-rate for Alior Bank was 8% due to certain one-off effects 8. Management figures based on company reporting; market data from the following sources: Mortgages as end of Q3 2012 (calculated based on new sales volume) – ZBP, consumer loans as end of Q3 2012 (calculated based on EOP volume) –
NBP, current accounts as end of Q2 2012 (based on # of accounts) – PR news 9. Management view and company opinion 10. Total net income from business activities defined as the sum of i) net interest income, ii) dividend income iii) net fee and commission income, iv) trading result, v) net gain on other financial instruments and vi) net other operating income
The delivery (2009-9M 2012)
(10)
S2
S3
(7)

7
Agenda
Appendix 29
What is the vision behind Alior Bank? 7
What is Alior Bank today? 10
What is next for Alior Bank? 24
S1
S2
S3

8
The opportunity in Poland – for the creation of an innovative new bank
Significant market growth... ...resulting from under penetration...
Source European Banking Federation, Eurostat
% of GDP, 2007 and 2010
38 3815 23 11
123139
64 75
35
48
140
56
144
16
61
40
83
19
41
0
50
100
150
200
Poland 2007 Poland 2010 EU-27 2007 EU-27 2010
Total deposits Total loans Corporate loans Retail loans O/w mortgages
184
255
369413
470
526
0
100
200
300
400
500
600
2006 2007 2008 2009 2010 2011
FXPLN
136
168
216207 204
239
0
50
100
150
200
250
2006 2007 2008 2009 2010 2011
Loans to households Loans to corporations
PLN Bn PLN Bn
Source National Bank of Poland
237261
328
377413
468
0
50
100
150
200
250
300
350
400
450
500
2006 2007 2008 2009 2010 2011
Deposits from households
PLN Bn
126144 151
166183
205
0
50
100
150
200
250
2006 2007 2008 2009 2010 2011
Deposits from corporations
PLN Bn
…with limited attention to innovation
158%
49%
48%
27%
6%
1%
(5%
)
(5%
)
(10%
)
(12%
)
127%
40%
57%
21%
25%
(15%
)
25%
26%
(30%
)
(8%
)
(100%)
(50%)
0%
50%
100%
150%
200%
Alior Millennium ING Nordea BZ WBK Citibank Pekao PKO Multibank BPH
Stands out (0% is equivalent to market average)Trend-setter
Source SMG-KRC, 2009 (1)
Relative assessment of individual banks to market average
Results of customer survey about innovation perception of Polish banks
Note 1. Sample of 7,400 respondents, with monthly income above PLN2.5k

9
Focus on results and execution excellence
Equity injection of PLN1.5 Bn paid in full and clear targets set at the beginning Goal to create a valuable bank within five years by 2012
Sizeable
Target market share of
1.7% to 3.7%
808k clients (vs. 988k actual)
200 branches (vs. 208 actual)
Profitable
Revenues: PLN 983 MM
(vs. PLN 995 MM actual)
Net profit: PLN 118 MM (vs. PLN 152 MM actual)
Cost/Income 69%
(vs. 64% actual), ROE 11%
(vs. 15% actual)
Entrepreneurial
Break-even at bank level
after 28 months from start (22 actual) (2)
Branches profitable after 12-15 months from start
(achieved)
Superior growth & returns
Targets for 2011 set at inception in 2007 (1)
Notes 1. Figures in brackets represent actual 2011 results 2. Alior commenced its operations in November 2008 and has produced positive net income for the first time in September 2010

10
Agenda
Appendix 29
What is the vision behind Alior Bank? 7
What is Alior Bank today? 10
What is next for Alior Bank? 24
S1
S2
S3

11
A well-established banking platform designed for efficient growth
Strong, entrepreneurial management team with a proven track record of achieving growth and profitability targets
Attractive banking proposal based on quality of service, innovative technology-based products, and strong brand
Modern and multi-channel distribution network
A strong focus on operational excellence, scalability and cost efficiency
3
4
1
2
Innovative integrated and versatile IT platform with a low cost profile 5
Prudent risk management driving strong portfolio performance and asset quality
6
Balanced business mix with strong financial performance 7

12
One of Poland’s strongest and most entrepreneurial management teams
Management Board
(CEO/
Deputy CEOs)
Wojciech Sobieraj
CEO
Krzysztof Czuba
Modern Banking Division
Niels Lundorff
Finance Risk, Collection, HR
and IR
Artur Maliszewski
Traditional Banking Division
Witold Skrok
Finance Division
Cezary Smorszczewski
Corporate Division
Katarzyna Sułkowska
Credit Risk Division
Banking experience
21 years 18 years 23 years 20 years 14 years 14 years 14 years
With Alior since
2008 2008 2008 2008 2008 2008 2008
Relevant previous
experience
2002–2006
Bank BPH
1994–2002
BCG
1994–2007 Bank BPH
2006–2007 UniCredit Group
1999–2006 Bank BPH
1992–2007 Raiffeisen Bank Polska
2002–2008 Bank BPH
1991-2000 Ministry of Finance
2004–2007 PKN Orlen
1995–2004 Bank Pekao
2002–2007 Bank BPH
1998–2001 Citibank Polska
Contribution to Alior
Bank development
Trendsetter for customer service while optimising bank‟s operations
Retail sales
Integrator of sales in branch network, modern sales channels and product development
Risk, Finance
Integrator of quality in infrastructure for steering profitability and risk
SME banking
Risk conscious development of products and services for SMEs
Finance
Administrator of resources, budgeting and reporting
Corporate and private banking
Development of client services and network
Credit risk
Trendsetter for excellence in monitoring, collection and credit policy activities
1
Source Alior Bank

13
Mar
2011
741874
988 1,0791,199
1,359
Jul-11 Sept-11 Dec-11 Mar-12 Jun-12 Sep-12
Innovation differentiates Alior franchise and drives market share gains
2
“Kill Bill”(1)
...driving strong customer acquisition...
Innovative earnings account
600k+ new customers (o/w 290k+ “Kill Bill”)
Number of customers (k)
Since inception, Alior launched innovative products that competitors struggled to imitate...
ATMs worldwide for free
...and consistent market share gains
Dec 2010
Apr 2010
Jun 2009
May 2009
Apr 2010
Sep 2010
Feb
2011
Reta
il
SM
E 0.6% 0.8%
2.5%2.2%
Corporate lending balances Corporate deposits
Dec-09 Sep-12
Source Alior Bank, Polish Financial Supervision Authority
Note
1. Cash payments of utilities and other bills free of charge in the branch
14
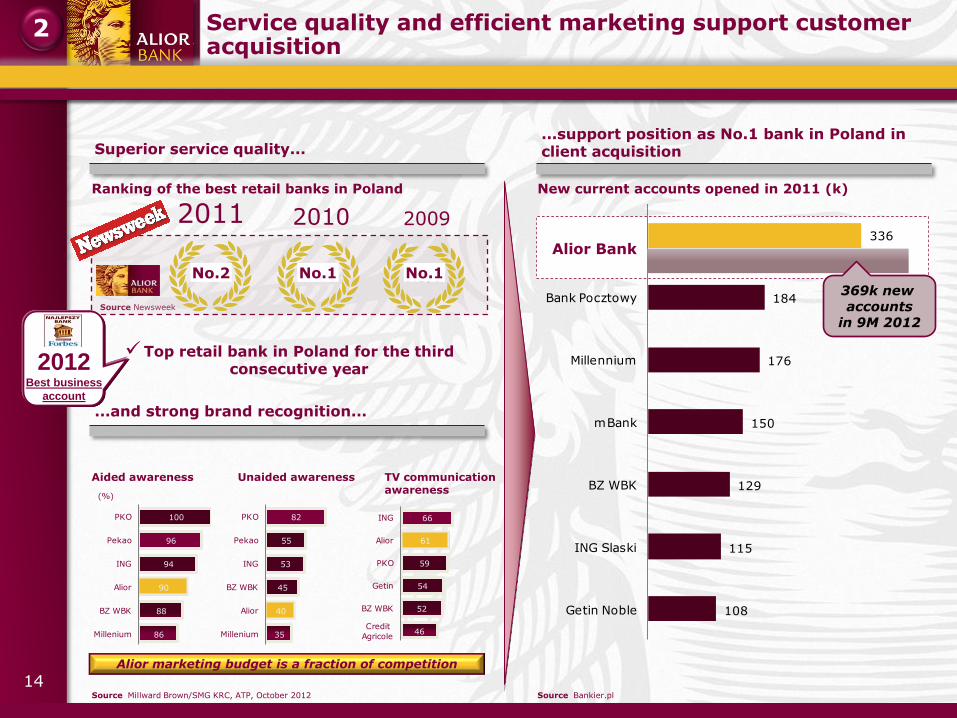
Service quality and efficient marketing support customer acquisition
2
...support position as No.1 bank in Poland in client acquisition Superior service quality...
Source Newsweek
Ranking of the best retail banks in Poland
No.1No.1 No.1No.1No.1No.1
2011 2010 2009
No.2 No.1 No.1
Top retail bank in Poland for the third consecutive year
...and strong brand recognition...
Aided awareness Unaided awareness TV communication awareness
100
96
94
90
88
86
PKO
Pekao
ING
Alior
BZ WBK
Millenium
Source Millward Brown/SMG KRC, ATP, October 2012
New current accounts opened in 2011 (k)
336
184
176
150
129
115
108
Bank Pocztowy
Millennium
mBank
BZ WBK
ING Slaski
Getin Noble
Source Bankier.pl
Alior Bank
(%)
82
55
53
45
40
35
PKO
Pekao
ING
BZ WBK
Alior
Millenium
66
61
59
54
52
46
ING
Alior
PKO
Getin
BZ WBK
Credit
Agricole
369k new accounts
in 9M 2012
Alior marketing budget is a fraction of competition
2012 Best business
account

15
13%22% 27% 28% 30%
45%
78% 79%85%
Pola
nd
(2007)
Port
ugal
Pola
nd
(2011)
Spain
Czech
Republic
Germ
any
Sw
eden
Fin
land
Norw
ay
A modern and truly multi-channel distribution platform...
Rapidly growing Internet banking population User-friendly virtual/call centre and mobile banking services
Alior Sync: another story of innovation success Alior at the forefront of this change
Internet banking users % of total population (2011)
Source Eurostat
Virtual Banking/Call center
Live video connection
Live document sharing
Best banking call centre in
Poland (2)
Mobile Banking
Money transfers, bill payouts,
mobile top-ups
Shopping–special offers from
retail partners
Contact points between clients and Alior Bank
Payment cards 22%
Internet 53%
Branches 4%
Call Centre 2%
Mobile 2% ATM 17%
Source Alior Bank
Notes
1. Ranking of personal accounts among 34 banks in Poland, based on the cheapest and best-fit model offered to the customers‟ needs. The main criteria used: lack of fees for basic functionalities of the account (money transfers, withdrawals from ATMs, debit cards etc.) as well as availability of such services as: mobile banking, express transfers, return of the part of expenditure (data as of July 2012)
2. „ARC Rynek i Opinia‟ as of August 2010
3
After less than 4 months of operations:
~90k clients: acquired
~800k clients: 2016 target
No.1 internet account in Poland
(according to Bankier.pl, Money.pl and
Comperia.pl)
No.1 “Disruptive Innovation
Worldwide” (Global Banking
Innovation Awards) Best Internet Banking
Services Provider

16
2.0
6.9
13.8
4.1 4.3
7.4
4.4 4.76.4
199
485
29
684
139
276
374429 437 449
518
659
...with traditional network at par with mid-sized players 3
Increase in the number of outlets since 2009 Number of outlets (2) as of Jun-12 (Alior as of Sep-12)
Revenues per branch (PLN MM)(3) Customers per branch (k)
2.0 4.3 14.5 2.0 3.7 7.0 2.4 3.5 4.1
Given most activity happens over alternative channels, Alior has potential to accommodate even more customers per branch than competitors
Source Companies‟ financial reports and websites as of June 2012. Alior as of 3Q12
Notes
1. Third largest distribution network by total number of outlets (branches plus agencies) after PKO BP, Pekao (as per respective financial statements)
2. Including branches and agencies
3. Revenues as of June 2012 annualized divided by number of branches at the end of June 2012 if available (extracted from the respective financial statements). Alior as of September 30, 2012
Alior has already developed Poland’s third(1) largest distribution network...
…capable to support customer acquisition and revenues growth
Current network can support
strong revenue growth

17
Key performance
indicator (monthly) Jan-11 Sep-12
Market
Benchmark(2)
Loan documentation
verification per operator
(mortgages)
216 261 175
Loan disbursement per
operator (mortgages) 573 843 543
Loan & deposits sales
per operator 477 804 500
Number of outgoing
foreign payments per
FTE in payments team
4,543 7,443 450-6,500
Employees per HR &
payroll administrator 292 437 250
Organisational culture focused on excellence, scalability and cost efficiency...
4
Cost efficient organisation
Scalable support infrastructure
Operational excellence in numbers
Operating expenses by customer (PLN)(1)
430 469 561 603 643 696
852 918 990 1,075
1,403
BRE
GN
B
Alior
(3Q
12)
ING
Alior
(2011)
BZ W
BK
Alior
(2010)
BPH
Nord
ea
Mille
nniu
m KB
117
201227 238
Sep-09 Sep-10 Sep-11 Sep-12
Number of FTE in operations Customers per operational FTE
Source Companies‟ financial reports and websites
Notes
1. Data for all banks as of 1H12 annualised. Number of customers is latest available. Data for Alior as of 3Q12 annualised except for 2010, 2011
2. Market benchmark based on management‟s expert opinion
2,064 3,095 3,852 5,710

18
…and a versatile IT platform providing a unique competitive advantage
5
Key IT aspects
Unique functionalities supporting growth
Lowest IT costs in the sector(1)
New product launch every 2 months
Systematic data mining with data from all systems processed in single data warehouse
Scalability allowing for cost efficient capacity increases
Full multichannel approach supported by IT solution
Middleware solutions allowing for quick and efficient implementation of new applications
Cooperation with IT developers from Ukraine, Sweden and Hungary
Notes
1. European IT Benchmarking in Banking as of January 2010 produced by The Boston Consulting Group; Company data
2. As of 2011
No legacy issue and simple IT organisation
Access to highly competent IT staff (Kraków centre)
State-of-the-art system supporting different sales models
Internet based infrastructure allowing for quick new branch connectivity
Effective telecommunication solutions and data transmission models
Highest standards of data protection and information security
CEE EU Alior Bank
IT costs as % of total general & administrative costs
13.3% 13.9% 6.8%(²)
IT costs per employee €12k €26k €2.2k(²)

19
Tested risk management systems driving strong portfolio performance and asset quality
Alior delivers best risk management practices Strong credit risk practices supporting asset quality
Own scoring and rating models
verified and fed with data from top-4
accounting firms
Sophisticated in-house collection
management
Highly qualified credit and risk
management teams
Analytical and systems based credit
management underscores healthy loan
growth
More deposits than loans
Conservative provisioning policy
No proprietary trading
High proportion of liquid assets on
balance sheet
High coverage(3)
Retail
Corporate
Mortgages1.1%
7.8%
5.3%
2.7%
14.7%
11.3%
Mortgages Retail Corporate
Alior Bank
Polish banking sector average
(2)
(2)
Source Alior Bank as of September 30, 2012, Polish Financial Supervision Authority
Notes
1. Calculated by dividing gross impaired loans and advances to customers by net loans and advances to customers
2. Other retail loan exposures
3. Calculated by dividing impairment allowances at the end of the period by gross impaired loans and advances to customers
6
Well-below-market NPL ratios (1)
65.6%
52.3%
14.1%
Careful assessment of customers’
creditworthiness based on data on
customer income, credit liabilities,
credit history, etc. obtained from
internal and external databases

20
A well diversified and balanced business mix 7
Diversified loan portfolio... ...funded by customer deposits... ...with balanced segment profits
Gross profit by segment (PLN MM) Net customer loans by product
Supporting diversified revenues... ...from different sources
Total result before impairment losses(2) Total net income from business activities(4) by type
FX loans represent ~14% of Alior loans vs. 32% Polish market average
Working capital 30.4%
Investment loans
10.1%
Other corporate
8.0%
Mortgage 21.3%
Consumer loans 26.6%
Other retail 3.7%
Business segment 48.5%
Retail segment 51.5%
Loans and settlements
53%
Current account and sale of insurance
19%
Trade 8%
Debt instruments 6%
Other 14%
Source Alior Bank as of September 30, 2012, Polish Financial Supervision Authority
Notes
1. Calculated by dividing loans and advances to customers (excluding other receivables) by financial liabilities measured at amortised cost due to customers (excluding other liabilities)
2. Includes interest income, dividend income, fee and commission income, trading result, result on financial instruments and other operating income
3. FX result includes result from FX transactions with customers and – to a very limited extent, as the bank is not holding significant open FX positions – the revaluation result, result on SWAP transactions, currency option result and result on revaluation of assets and liabilities expressed in foreign currencies
4. Net income from business activities defined as the sum of: i) net interest income, ii) dividend income , iii) net fee and commission income, iv) trading result, v) net gain (realised) on the financial instruments, vi) net other operating income
Net interest income 51%
Net fee & commission income 33%
Trading result 13%
Other income 4%
FX result (3) 73%
Interest rate result 27%
No proprietary trading
11.2
4.0
15.2
7.0 6.6
13.5
Retail segment Business segment
Total
Excess of deposits over loans: PLN4.2 Bn
Excess of deposits over loans: PLN1.6 Bn
(19)
125 154
261
Treasury activities and other
Business segment
Retail segment
Total
Customer deposits Customer loans (PLN Bn)

21
Growing and structurally well matched loans and deposits
FX matching Maturity matching (2)
13,8
70
729
733
842
1,7
16
1,3
26
2,8
04 5,7
20
1,0
08
956
1,3
20
1,4
45
1,5
73
2,2
60 5
,808
14,3
72
1M 3M 6M 1Y 2Y 5Y 10Y+ TOTAL
Loans Deposits
152
1,109
1,914
1,058
1,990 1,943
575
2,342
2009 2010 2011 9M 2012
FX Loans FX DepositsPLN MM, 9M 2012 PLN MM
Source Alior Bank Source Alior Bank
Notes 1.Delta for each year calculated as the difference between the value at the end of the period and at the beginning of the period 2.Based on Alior Bank‟s financial reporting and refers to expected maturity
2,865
4,603
3,40210,135
2,667
13,537
2009 2010 Δ 2011 Δ 2011 9M12 Δ 9M 2012
Sustained loan growth... (1) ...Funded by deposits (1)
PLN MM PLN MM
4,1093,610
5,812
1,63813,531
15,170
2009 2010 ∆ 2011 ∆ 2011 9M12 ∆ 9M 2012
Source Alior Bank Source Alior Bank
7
22
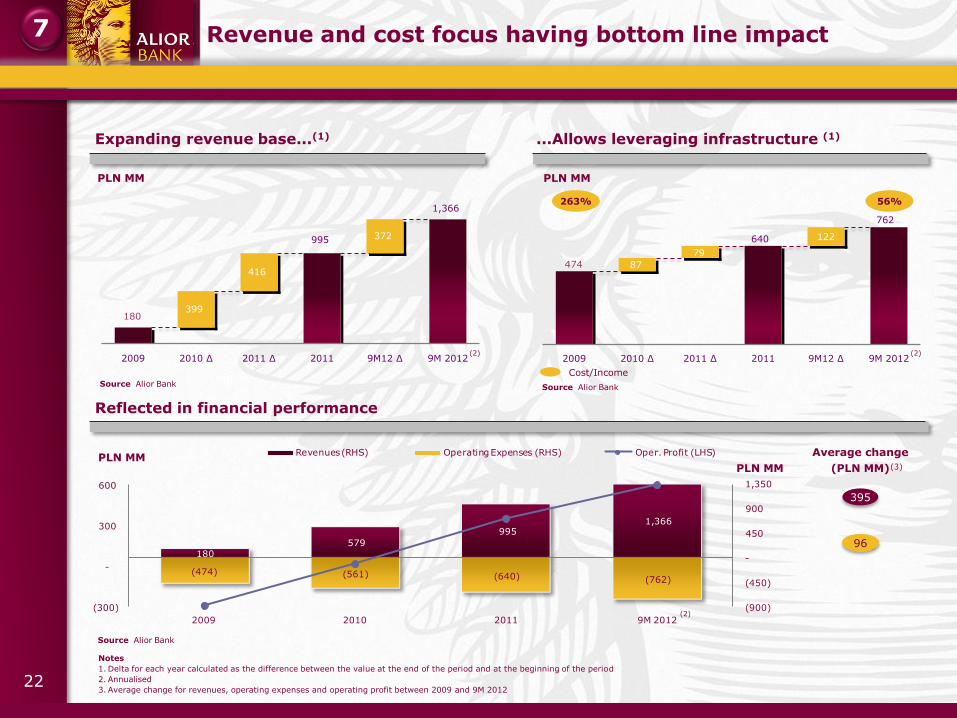
Revenue and cost focus having bottom line impact
180 579
995 1,366
(474) (561) (640) (762)
(300)
-
300
600
(900)
(450)
-
450
900
1,350
2009 2010 2011 9M 2012
Revenues (RHS) Operating Expenses (RHS) Oper. Profit (LHS)
Reflected in financial performance
PLN MM
Average change
(PLN MM)
395
96
PLN MM
Notes
1. Delta for each year calculated as the difference between the value at the end of the period and at the beginning of the period
2. Annualised
3. Average change for revenues, operating expenses and operating profit between 2009 and 9M 2012
Source Alior Bank
(2)
Expanding revenue base...(1)
PLN MM
263% 56%
Cost/Income
...Allows leveraging infrastructure (1)
PLN MM
Source Alior Bank Source Alior Bank
(2)
(3)
(2)
399
416
372995
180
1,366
2009 2010 ∆ 2011 ∆ 2011 9M12 ∆ 9M 2012
640
79
87
122
474
762
2009 2010 ∆ 2011 ∆ 2011 9M12 ∆ 9M 2012
7
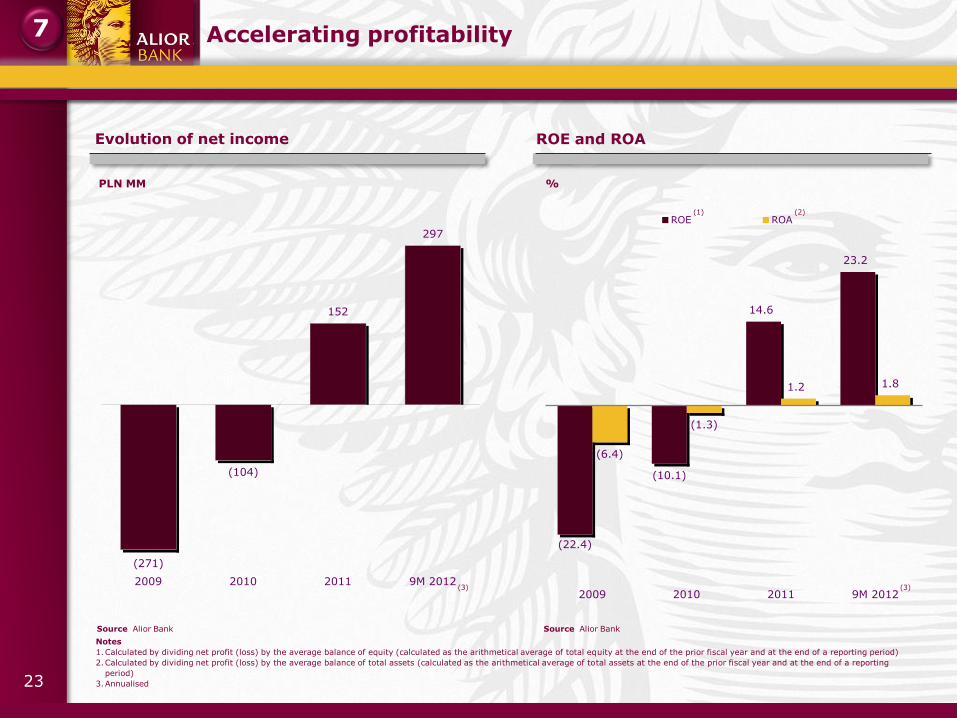
23
Accelerating profitability
(104)
152
297
(271)
2009 2010 2011 9M 2012
PLN MM
(3)
Evolution of net income
Source Alior Bank
Notes
1.Calculated by dividing net profit (loss) by the average balance of equity (calculated as the arithmetical average of total equity at the end of the prior fiscal year and at the end of a reporting period)
2.Calculated by dividing net profit (loss) by the average balance of total assets (calculated as the arithmetical average of total assets at the end of the prior fiscal year and at the end of a reporting
period)
3.Annualised
Source Alior Bank
(10.1)
14.6
23.2
(6.4)
(1.3)
1.2 1.8
(22.4)
2009 2010 2011 9M 2012
ROE ROA
ROE and ROA
%
(3)
(1) (2)
7

24
Agenda
Appendix 29
What is the vision behind Alior Bank? 7
What is Alior Bank today? 10
What is next for Alior Bank? 24
S1
S2
S3

25
Ambitious targets supported by two – pillar strategy
Double market share in Poland, mainly by gaining further market shares in all retail segments and SME
Market share at the end of 3Q2012: 2.1% for deposits and 1.7% for loans (1)
Cost/income ratio below 42%
Medium-term target
Pillars
Generating two thirds of revenue in the medium term
from existing distribution network
Focus on building long-term relationships with existing clients
Continue to provide high quality of service and introduce innovative products to
attract new clients and act as an incentive to change their main bank and
choose Alior as their main banking service provider
One third of revenue in the medium term to come from new
products and channels
Alior Sync: a Virtual Bank
Alior Bank Express mini branches
Consumer Finance
1
2
Note
1. KNF data

26
• Mortgages
• Consumer Loans
• Consumer Deposits
• Credit Cards
• Current Accounts
• Brokerage Accounts
• Corporate Deposits
• Corporate Loans
• Factoring
Market Shares - 2012 3Q (1)
Network expansion sets platform for long-term client acquisition
Current Target Distribution platform will keep growing over next years… …with scope for growth
in all segments
Notes 1.Management figures based on company reporting; market data from the following sources: Mortgages (calculated based on new sales volume) – ZBP,
Credit Cards (calculated based on EOP volume) and consumer loans and deposits (calculated based on EOP volume) – NBP, corporate loans and deposits (calculated based on volume)- KNF, current accounts (based on # of accounts) – PR news, brokerage accounts (calculated based on # of brokerage accounts) – KDPW, factoring (gross value of invoices purchased) – Rzeczpospolita
2.As of 30th of June 2012
4.0%
3.2%
1.3%
3.8%
4.5%
2.2%
2.4%
4.1%
• Initiated 2012 to capture non market locations
• Leveraging of strength in cash loan credit process
280 65 Alior Bank
Express
• Continued significant expansion
• Cost efficient method to acquire clients (the estimated cost of opening a new agency amounts to PLN50k vs. branch opening cost of PLN1.4 MM)
• Performance based remuneration for Agents
410 Agencies
• Alior Sync launched in June 2012
• Distinct brand but part of Alior
• Unique virtual bank concept - virtual branch with virtual support and sales
n/a n/a Internet
Banking / Alior Sync
• Platform in place
• Provides nationwide coverage
• Leveraging of unsaturated network
209 209 Branches
Mid-term
Target Sep-12
2.2%
(2)

27
Future revenue opportunities from new products and channels
Alior Sync: a Virtual Bank – launched mid June 2012
Almost 90k clients acquired between June and end of September 2012 and have
brought to the Bank PLN225 MM in deposits
Expected 800k new clients by 2016
Increase market share in deposits and loans by 0.3 p.p. each
Ready for “white label” services
Alior Bank Express mini branches
65 new mini branches between March 2012 and the end of September 2012, and
plans to open another 215 by the end of 2013
Aim to increase the Bank‟s market share in loans by 0.3 p.p. by 2016
Almost 20k clients acquired between March and end of September 2012. They have
brought to the Bank PLN55 MM in deposits and PLN32 MM in loans
Consumer Finance – started in March 2012
Plan to develop cooperation with the largest retail networks in Poland and replicate
successful story of providing consumer loans at IKEA chain
Opportunistic M&A
Carefully monitor investment opportunities in Polish assets that could complement the
product and service offerings of Alior
Strategic partnerships
Plan to expand consumer finance offering through cooperation with largest retail
networks and Internet shops (Alior already cooperates with Allegro, the largest
auction portal in Poland with 12.5 MM users, Neckermann and others)

28
9.9%9.3% 9.4%
10.9% 11.2% 11.4%
13.3%13.8%
15.3%
A strong capital position to support profitable organic growth
Source Companies‟ financial reports as of September 30, 2012 unless differently indicated
Note
1. Estimated BZ WBK pro-forma Core Tier I ratio including PLN332 MM capital increase without pre-emptive rights fully underwritten by the European Bank for Reconstruction and Development (“EBRD”)
Alior Bank Core Tier I ratio pro-forma PLN700 MM capital increase vs. major Polish peers
9M12 9M12 pro-forma for PLN700 MM
capital increase
(1)
A capital increase will allow Alior Bank to exploit high credit quality business opportunities that arise in the attractive Polish Banking sector

29
Agenda
Appendix 29
What is the vision behind Alior Bank? 7
What is Alior Bank today? 10
What is next for Alior Bank? 24
S1
S2
S3

30
PLN MM 2009 2010 2011 9M 2012 CAGR
Balance sheet
Cash and balances with central bank 220 476 449 702 52% Financial assets (1) 2,876 2,540 3,219 2,502 N/M Loans and advances to customers 2,667 5,532 10,135 13,537 81% Amounts due from banks 93 242 1,106 380 67%
Intangible assets 82 109 123 123 16%
Other assets (2) 321 413 453 561 22% Total assets 6,260 9,312 15,484 17,806 46% Amounts due to customers 4,109 7,719 13,531 15,170 61% Subordinated loan 0 0 44 344 N/M
Other liabilities (3) 1,074 617 795 842 N/M Shareholders’ equity 1,077 976 1,112 1,451 11% Tangible equity (4) 995 866 990 1,328 11%
Customer loans segmentation Total gross customer loans 2,704 5,699 10,485 14,043 82%
Retail loans 1,291 2,705 5,269 7,272 87% o/w mortgage 43 866 1,787 2,182 317% o/w other retail 1,247 1,839 3,481 5,090 67%
Corporate loans 1,413 2,994 5,217 6,771 77%
Asset quality
Non performing loans Total gross loans 60 227 458 745 Retail loans 36 129 246 395
o/w mortgage 0 0 8 23 o/w other retail 36 128 238 372
Corporate loans 25 98 212 349 Coverage ratios Total gross loans 36% 64% 65% 58% Retail loans 33% 73% 76% 63% o/w mortgage N/A 21% 25% 14%
o/w other retail 33% 73% 78% 66% Corporate loans 40% 52% 52% 52%
Balance sheet snapshot
Notes 1.Financial assets include financial assets held for trading and available for sale 2.Other assets include tangible fixed assets, income tax and other assets 3.Other liabilities include liabilities due Central Bank, liabilities due to other banks, financial liabilities held for trading, provisions, income tax liabilities and other liabilities 4.Calculated as shareholders‟ equity less intangibles 5.CAGR calculated for the period 2009-9M 2012 6.Calculated by dividing impairment allowances on impaired loans by gross non-performing loans
Source Alior Bank Financial Statements; Audited for the years 2009-2011; non audited for 9M 2012
(5)
(6)
31
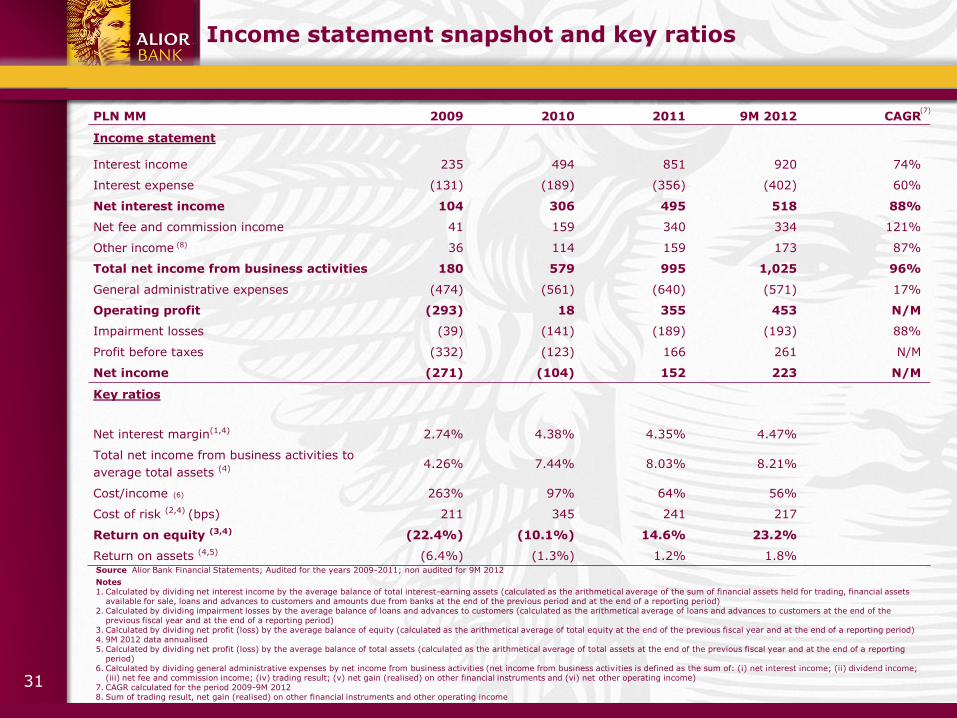
PLN MM 2009 2010 2011 9M 2012 CAGR
Income statement
Interest income 235 494 851 920 74%
Interest expense (131) (189) (356) (402) 60%
Net interest income 104 306 495 518 88%
Net fee and commission income 41 159 340 334 121%
Other income 36 114 159 173 87%
Total net income from business activities 180 579 995 1,025 96%
General administrative expenses (474) (561) (640) (571) 17%
Operating profit (293) 18 355 453 N/M
Impairment losses (39) (141) (189) (193) 88%
Profit before taxes (332) (123) 166 261 N/M
Net income (271) (104) 152 223 N/M
Key ratios
Net interest margin(1,4) 2.74% 4.38% 4.35% 4.47%
Total net income from business activities to
average total assets (4) 4.26% 7.44% 8.03% 8.21%
Cost/income 263% 97% 64% 56%
Cost of risk (2,4) (bps) 211 345 241 217
Return on equity (3,4) (22.4%) (10.1%) 14.6% 23.2%
Return on assets (4,5) (6.4%) (1.3%) 1.2% 1.8%
Income statement snapshot and key ratios
Source Alior Bank Financial Statements; Audited for the years 2009-2011; non audited for 9M 2012
Notes 1. Calculated by dividing net interest income by the average balance of total interest-earning assets (calculated as the arithmetical average of the sum of financial assets held for trading, financial assets
available for sale, loans and advances to customers and amounts due from banks at the end of the previous period and at the end of a reporting period) 2. Calculated by dividing impairment losses by the average balance of loans and advances to customers (calculated as the arithmetical average of loans and advances to customers at the end of the
previous fiscal year and at the end of a reporting period) 3. Calculated by dividing net profit (loss) by the average balance of equity (calculated as the arithmetical average of total equity at the end of the previous fiscal year and at the end of a reporting period) 4. 9M 2012 data annualised 5. Calculated by dividing net profit (loss) by the average balance of total assets (calculated as the arithmetical average of total assets at the end of the previous fiscal year and at the end of a reporting
period) 6. Calculated by dividing general administrative expenses by net income from business activities (net income from business activities is defined as the sum of: (i) net interest income; (ii) dividend income;
(iii) net fee and commission income; (iv) trading result; (v) net gain (realised) on other financial instruments and (vi) net other operating income) 7. CAGR calculated for the period 2009-9M 2012 8. Sum of trading result, net gain (realised) on other financial instruments and other operating income
(6)
(7)
(8)

32
Shareholders and Corporate Governance structure
Supervisory Board composition
Hélène Zaleski Chairman
Józef Wancer Deputy Chairman
Małgorzata Iwanicz-
Drozdowska Member
Marek Michalski Member
Krzysztof Obłój
Member
Members meeting independence criteria
Governance structure
Supervisory Board
Consists of 5–8 members
Currently 5 members (4
independent)
Management Board
Currently 7 members
Audit Committee(2)
Performed by all 5
Supervisory Board
members
Remuneration Committee
3 Supervisory Board
members
Source Alior Bank
Notes 1. Carlo Tassara S.p.A owns its stake in Alior via the following entities: Alior Lux S. a r.l. & Co. S.C.A.
(76.7%), Alis SA (19.5%) and Alior Polska sp. z o.o. (1.0%) 2. Audit committee duties performed by the Supervisory Board 3. Based on the maximum price of PLN 71 per share 4. Management will own 5.4% of TSO immediately after the IPO, with the remaining 2.7% locked until
CT‟s exit
Shareholding structure
Società Camuna di Partecipazioni
2.0%
Carlo Tassara (1) 97.2%
Prior to the Offering
Zygmunt Zaleski Stichting 0.5%
Management 0.4%
Post the Offering (3)
Immediately after the Offering the free float of the Bank is expected to exceed 50%
Carlo Tassara has agreed with the KNF that it will seek to dispose at least 30% of the share capital by the end of 2013 to a regulated entity (a bank or an insurance company) that satisfies their criteria
Carlo Tassara 34.0%
Free Float
55.8%
Management (4)
8.1%
Società Camuna di Partecipazioni
1.6%
Zygmunt Zaleski Stichting
0.5%
33
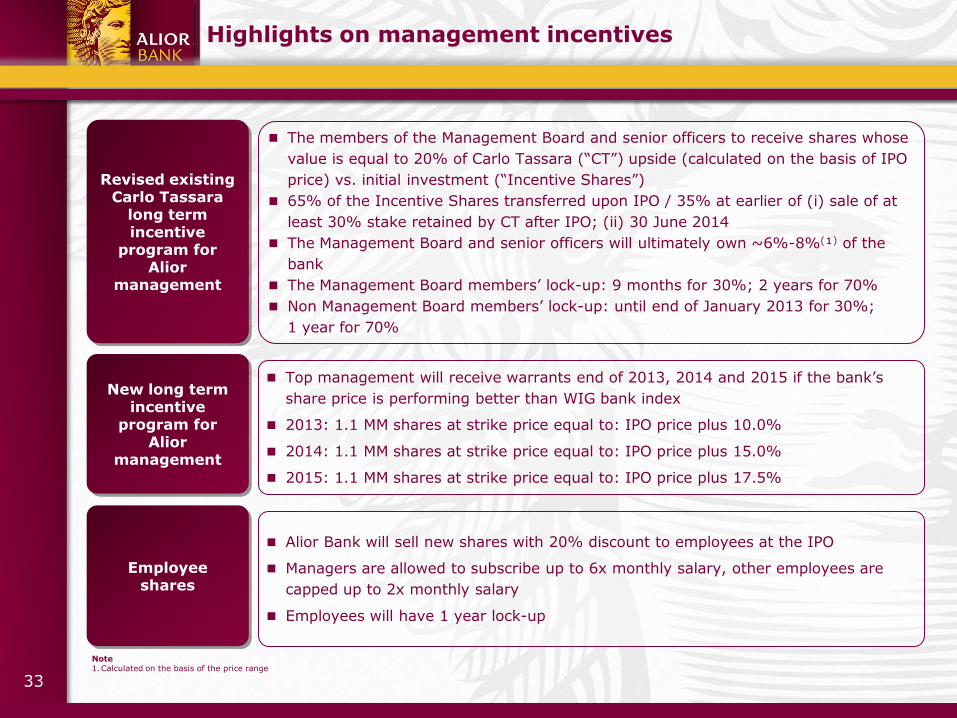
Highlights on management incentives
Revised existing Carlo Tassara
long term incentive
program for Alior
management
The members of the Management Board and senior officers to receive shares whose
value is equal to 20% of Carlo Tassara (“CT”) upside (calculated on the basis of IPO
price) vs. initial investment (“Incentive Shares”)
65% of the Incentive Shares transferred upon IPO / 35% at earlier of (i) sale of at
least 30% stake retained by CT after IPO; (ii) 30 June 2014
The Management Board and senior officers will ultimately own ~6%-8%(¹) of the
bank
The Management Board members‟ lock-up: 9 months for 30%; 2 years for 70%
Non Management Board members‟ lock-up: until end of January 2013 for 30%;
1 year for 70%
New long term incentive
program for Alior
management
Top management will receive warrants end of 2013, 2014 and 2015 if the bank‟s
share price is performing better than WIG bank index
2013: 1.1 MM shares at strike price equal to: IPO price plus 10.0%
2014: 1.1 MM shares at strike price equal to: IPO price plus 15.0%
2015: 1.1 MM shares at strike price equal to: IPO price plus 17.5%
Employee shares
Alior Bank will sell new shares with 20% discount to employees at the IPO
Managers are allowed to subscribe up to 6x monthly salary, other employees are
capped up to 2x monthly salary
Employees will have 1 year lock-up
Note 1.Calculated on the basis of the price range

34
149 195 208 208 208 209
50
97
230304
350410
16
45
65
199
292
438
528
603
684
0
200
400
600
800
4Q2009 4Q2010 4Q2011 1Q2012 2Q2012 3Q2012
Branches Agencies Mini Branches
Overview of agency model
Operational risk
All customer operations verified with
customer‟s credit card and pin
All agents are pre-checked by Alior‟s Anti-
Crime Department
Efficient security measures
System and equipment owned by Alior with
agency eligible only to input the data
Credit risk
No credit competencies in the agencies, all
credit applications reviewed in Alior‟s central
system or by credit analysts
Quality of the loan portfolio generated in the
agencies comparable to the one generated
in branches
Profitability
Agent remuneration either fixed or in
percentage of particular operations
Agents bear their own costs
Bank provides the agents with marketing
materials, certain equipment and
professional training
The agents are fully liable for any damage
caused
Source Alior Bank
Risk management and profitability Development of agencies

35
Alior Bank's innovative approach to FX market
Why different? Alior - Market leader in innovation in FX market
Autodealing – first FX platform introduced
with e-banking account
First bank in CEE which introduced algotrading system
for FX trading
Access to global services allowing to execute
orders in less than 5 minutes
Ability to use automatic trading algorithms
Access to unique currency liquidity
Ability to offer access to own excess liquidity
Feb-09
Apr-11
Feb-12
Jul-12
Nov-12
Alior Trader – First ECN platform in Poland
(replicated by BRE and BZWBK one year later)
Bureau de Change in Alior Bank branches
First online FX exchange platform for
retail
eFX – first bank in Poland with a algotrading
platform
eFX Trader – professional trading platform
for the largest corporates
Unique algotrading system and 3 trading platforms are set to increase Alior Bank’s market share in the FX market in Poland
Centralisation of the trading platform
Auto-dealing
Convenient way to enter into online FX transactions
An opportunity to trade any time
All transactions are settled immediately
Alior Trader eFX Trader
Tool for private individuals to directly trade currency with some of the largest banks
Launched in April 2011
Significant market share within the first year of launch
Professional FX trading platform for the largest corporates
Launched in November 2012

36
5.9% 5.8% 5.6% 5.3%
2.7%
DPD30+ DPD60+ DPD90+ NPL ratio NPL ratio
Alior is comfortably positioned for the difficulties in the Polish construction sector
Limited exposure
As of end of September 2012,
construction sector accounted for 20%
of total corporate loan book balance
sheet exposure
Within the construction sector, the loan
book is significantly diversified with
relatively limited exposure to road and
rail sector
High collateral coverage
166% collateral coverage for total
construction loan book balance sheet
exposure
High coverage
ratio
Coverage ratio: 43%
Low NPL ratio
NPL ratio for the construction loan book
of 2.7% or PLN62.7 MM
Construction sector coverage Total exposure to construction sector (1)
Balance sheet exposure
45.1%
Portfolio delinquency
9M 2012
Source Alior Bank
9M 2012
Total: PLN2,484 MM
Note 1.The off-balance sheet exposure includes: unused limits, not disbursed loans, off-balance sheet products (including guarantees, treasury limits and collateral in the form of surety when a company from
one sector guarantees the financing of another company from a different sector).
Off balance sheet exposure
54.9%
Source Alior Bank
Total exposure
Balance sheet exposure

37
71.7
30.316.8 11.3
124.3
Warsaw Vienna Prague Budapest Bucharest
Polish macro environment remains highly attractive despite the turmoil in Western Europe
Strong, crisis resilient GDP growth
Strong and stable domestic demand relative to GDP
Declining perception of Polish risk
1.6
3.9 4.3
2.4
2.1 2.7 3.1
2.0
1.4
(0.4
)
0.2 1
.2 1.5
(4.4
)
2009 2010 2011 2012E 2013E 2014E 2015E
Poland Euro Zone
Source International Monetary Fund as of October 2012
5858.4
60.3
59.7 59.8
2007 2008 2009 2010 2011
90
151
Jan-05 Jun-06 Nov-07 Apr-09 Sep-10 Nov-12
Source Poland‟s Central Statistical Office Source Bloomberg
Investors’ confidence translated into high FDI and capital markets activity
Poland – largest EU funds’ recipient
Source National Bank of Poland Source Federation of European Securities Exchanges as of September 2012
Source Polish Ministry of Regional Development
67.3
26.7 25.3 19.7
11.6
Poland Czech Hungary Romania Slovakia
Domestic private consumption / GDP (%)
Foreign Direct Investment in Poland (PLN Bn) Market capitalisation (€ Bn)
Real GDP growth (%)
Split of EU Program for 2007-2013 (€ Bn)
CDS (bps)
19% of total Program (€347.4 Bn)
Notes 1.Includes companies listed on alternative market NewConnect 2.Average includes CDS for UK, Germany, France, Italy and Spain
Poland Western European average (2)
855 (1) 99 28 52 81
# of companies listed
434.4486.6
527.9595.8
675.1
2007 2008 2009 2010 2011

38
Disclaimer
Neither this presentation nor any copy of it nor the information contained herein is being issued, and nor may this presentation nor any copy of it nor the information contained herein be distributed directly or indirectly to or into, the United States, Canada, Australia or Japan.
By attending this meeting where this presentation is made, or by reading the presentation slides, you agree to be bound by the following terms, conditions and limitations.
This presentation does not constitute or form part of and should not be construed as, an offer to sell, or the solicitation or invitation of any offer to buy or subscribe for or underwrite or otherwise acquire, securities of Alior Bank S.A. (the “Company”), any holding company or any of its subsidiaries or any other person in any jurisdiction, nor an inducement to enter into any investment activity. No part of this presentation, nor the fact of its distribution, should form the basis of, or be relied on in connection with, any contract or commitment or investment decision whatsoever. This presentation does not constitute a recommendation regarding any securities of the Company or any other person.
This presentation has been prepared solely for use at the presentation by the Company to investors in connection with the offering (the “Offering”) by the Company and by Carlo Tassara S.p.A. (the “Selling Shareholder”) – through its subsidiaries Alior Lux Sàrl & Co. S.C.A and Alis S.A. – of certain shares held in the Company‟s share capital (the “Shares”).
This presentation is not a prospectus for the purposes of applicable measures implementing EU Directive 2003/71/EC (such Directive, together with any applicable implementing measures in the relevant home Member State under such Directive and other applicable regulations, the “Prospectus Directive”) and as such does not constitute an offer to sell, or the solicitation of an offer to purchase, any securities.
This document has been prepared for promotional purposes only within the meaning of the Polish Act on public offers. The prospectus (the “Prospectus”) approved on 16 November 2012 by the Polish Financial Supervision Authority constitutes the sole and only legally binding offering document containing information about the Company and the offering of its shares in Poland and about their admission and introduction to trading on the regulated market operated by the Warsaw Stock Exchange. The Prospectus was published and is available on the Company‟s website http://www.aliorbank.pl and on the website of IPOPEMA Securities S.A. http://ipopema.pl. Any purchase of the Shares in the Offering should be made independently and solely on the basis of the information contained in the Prospectus and the English language international offering circular, and any supplements or amendments to them, prepared or to be prepared in connection with the Offering.
The information contained in the presentation has not been independently verified. No representation, warranty or undertaking, express or implied, is made by any person as to, and no reliance should be placed on, the fairness, accuracy, completeness or correctness of, the information or the opinions contained herein. The information and opinions contained in this presentation are provided as at the date of this presentation and are subject to change without notice. Neither the Selling Shareholder nor the Company nor any of their respective affiliates, advisors or representatives (including Barclays Bank PLC, J.P. Morgan Securities plc, Morgan Stanley & Co. International plc, IPOPEMA Securities S.A., Erste Group Bank AG, and Renaissance Securities (Cyprus) Limited as the managers for the Offering (together, the “Managers”)), shall have any liability whatsoever (in negligence or otherwise) for any loss howsoever arising from any use of this presentation or its contents or otherwise arising in connection with the presentation. The Managers and their respective affiliates are acting only for the Company and no-one else in connection with the proposals referred to in the presentation and will not be responsible to any other person for providing the protections afforded to their respective clients, or for providing advice in relation to such proposals.
This presentation and any materials distributed in connection with this presentation or the Offering are not directed to, or intended for distribution to or use by, any person or entity that is a citizen or resident or located in any locality, state, country or other jurisdiction where such distribution, publication, availability or use would be contrary to law or regulation or which would require any registration or licensing within such jurisdiction. Persons into whose possession any document or other information referred to herein comes should inform themselves about and observe any such restrictions. Any failure to comply with these restrictions may constitute a violation of the securities laws of any such jurisdiction.
This presentation does not constitute an offer of securities for sale into the United States. The Shares have not been and will not be registered under the U.S. Securities Act of 1933, as amended (the “Securities Act”), or with any securities regulatory authority of any state or other jurisdiction in the United States, and, subject to certain exemptions, may not be offered or sold within the United States, absent registration or under an exemption from, or in a transaction not subject to, the registration requirements of the Securities Act and applicable state laws. Neither the Selling Shareholder nor the Company intend to register any portion of the Offering in the United States or conduct a public offering of securities in the United States. In the United States the Offering will be made only to qualified institutional buyers in accordance with Rule 144A (QIBs) under the Securities Act or other transactions exempt from or not subject to the registration requirements of the Securities Act. Outside the United States, the Offering will be made in accordance with Regulation S under the Securities Act to non-US persons (as defined in Regulation S).
This presentation is only addressed to, and the Shares shall be offered only to, qualified investors within the meaning of Article 2(1)(e) of the Prospectus Directive (“Qualified Investors”). Any such Qualified Investor will be deemed to have represented and agreed that any such securities acquired by it in the Offering have not been acquired on behalf of persons other than such Qualified Investors. Neither the Selling Shareholder nor the Company has authorised any offer to the public of securities in any member state of the European Economic Area (the “EEA”) which has implemented the Prospectus Directive other than Poland. With respect to each member state of the EEA which has implemented the Prospectus Directive (each a „„relevant member state‟‟), no action has been undertaken or will be undertaken to make an offer to the public of securities requiring a publication of a prospectus in any relevant member state.
This presentation is directed only at persons who are (i) outside the United Kingdom or (ii) investment professionals falling within article 19(5) of the Financial Services and Markets Act 2000 (Financial Promotion) Order 2005, as amended (the “Order”) or (iii) high net worth companies and other persons to whom it may lawfully be communicated in accordance with article 49(2)(a) to (d) of the Order (all such persons together being referred to as “Relevant Persons”). Any person who is not a Relevant Person must not act or rely on this presentation or any of its contents. Any investment or investment activity to which this communication relates is available only to Relevant Persons and will be engaged in only with Relevant Persons. This presentation is only for persons having professional experience in matters relating to investments and must not be acted or relied on by persons who are not Relevant Persons. Solicitations resulting from this presentation will only be responded to if the person concerned is a Relevant Person.
This presentation and its contents are confidential and must not be distributed, published or reproduced (in whole or in part) by any medium or in any form, or disclosed or made available by recipients to any other person, whether or not such person is a Qualified Investor or a Relevant Person. If you have received this presentation and you are not a Qualified Investor or a Relevant Person or are not otherwise permitted by law to receive it, you must return it immediately to the Company, at Alior Bank S.A., al. Jerozolimskie 94, 00-807 Warsaw, Poland.
All statements in this document or made during any accompanying oral presentation other than statements of historical fact are, or may be deemed to be, forward-looking statements. In some cases, forward-looking statements can be identified by the use of terms such as “anticipate”, “believe”, “intend”, “estimate”, “expect” and words of similar meaning. All statements other than statements of historical facts included in this presentation, including, without limitation, those regarding the Company‟s financial position, business strategy, plans and objectives of management for future operations (including development plans and objectives relating to the Company‟s products and services) are forward-looking statements. Such forward-looking statements involve known and unknown risks, uncertainties and other important factors that could cause the actual results, performance or achievements of the Company to be materially different from future results, performance or achievements expressed or implied by such forward-looking statements. Such forward-looking statements are based on numerous assumptions regarding the Company‟s present and future business strategies and the environment in which the Company will operate in the future. These forward-looking statements speak only as at the date of this presentation. The Company expressly disclaims any obligation or undertaking to disseminate any updates or revisions to any forward-looking statements contained herein to reflect any change in the Company's expectations with regard thereto or any change in events, conditions or circumstances on which any such statement is based, unless otherwise required by the applicable provisions of law. The Selling Shareholder and the Company caution you that forward-looking statements are not guarantees of future performance and that the Company‟s actual financial position, business strategy, plans and objectives of management for future operations may differ materially from those made in or suggested by the forward-looking statements contained in this presentation. In addition, even if the Company‟s financial position, business strategy, plans and objectives of management for future operations are consistent with the forward-looking statements contained in this presentation, those results or developments may not be indicative of results or developments in future periods. The Company does not undertake any obligation to review or confirm, or to release publicly or otherwise to investors or any other person, any revisions to any forward-looking statements to reflect events that occur or circumstances that arise after the date of this presentation.
By attending this presentation or receiving this document, you warrant and represent that (i) if you are a U.S. person, you are a QIB, (ii) if you are a non-U.S. person, you are a Qualified Investor, or a Relevant Person (as defined above).