Embed Size (px)
Citation preview
1
November 6, 2014
ALIOR BANK S.A.
Q3 2014 results presentation
ALIOR BANK S.A.
Q3 2014 results presentation

2
AGENDA
• Highlights
• Operational Performance
• Strategic Initiatives
• Outlook
• Appendix

3
AGENDA
• Highlights
• Operational Performance
• Strategic Initiatives
• Outlook
• Appendix
4
HIGHLIGHTS
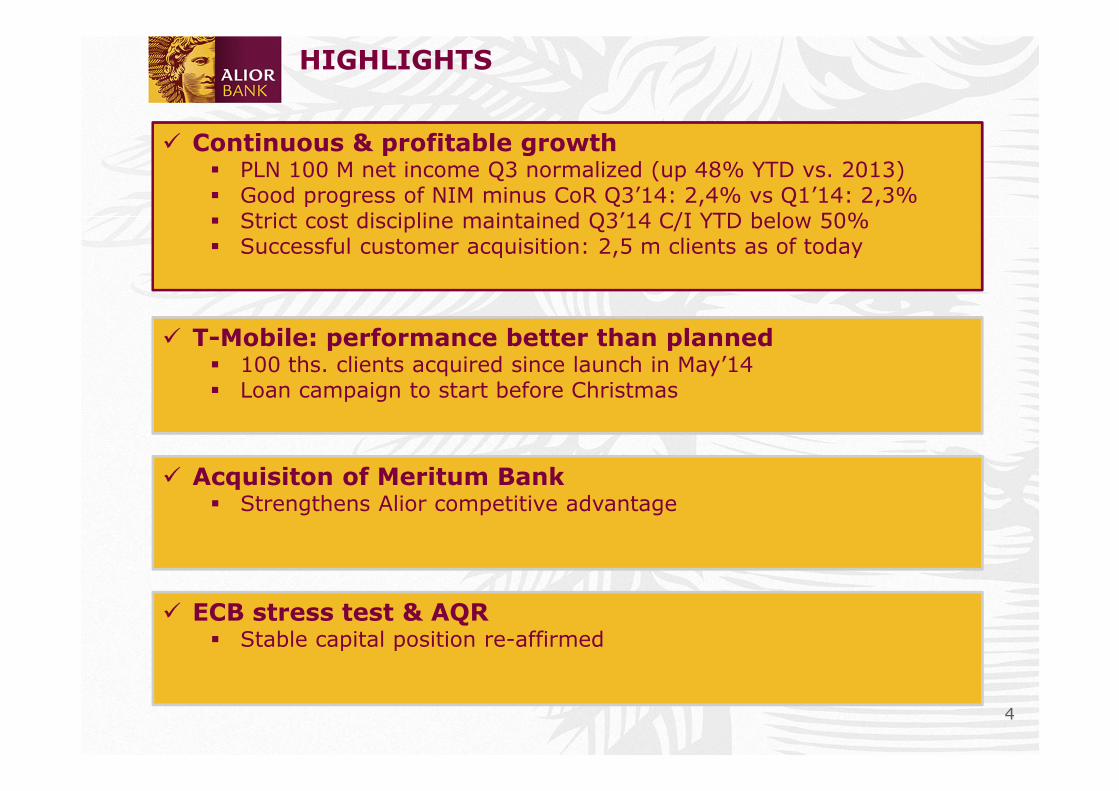
� T-Mobile: performance better than planned� 100 ths. clients acquired since launch in May’14� Loan campaign to start before Christmas
� Continuous & profitable growth� PLN 100 M net income Q3 normalized (up 48% YTD vs. 2013)� Good progress of NIM minus CoR Q3’14: 2,4% vs Q1’14: 2,3%� Strict cost discipline maintained Q3’14 C/I YTD below 50%� Successful customer acquisition: 2,5 m clients as of today
� ECB stress test & AQR� Stable capital position re-affirmed
� Acquisiton of Meritum Bank� Strengthens Alior competitive advantage
5
KEY FINANCIALS
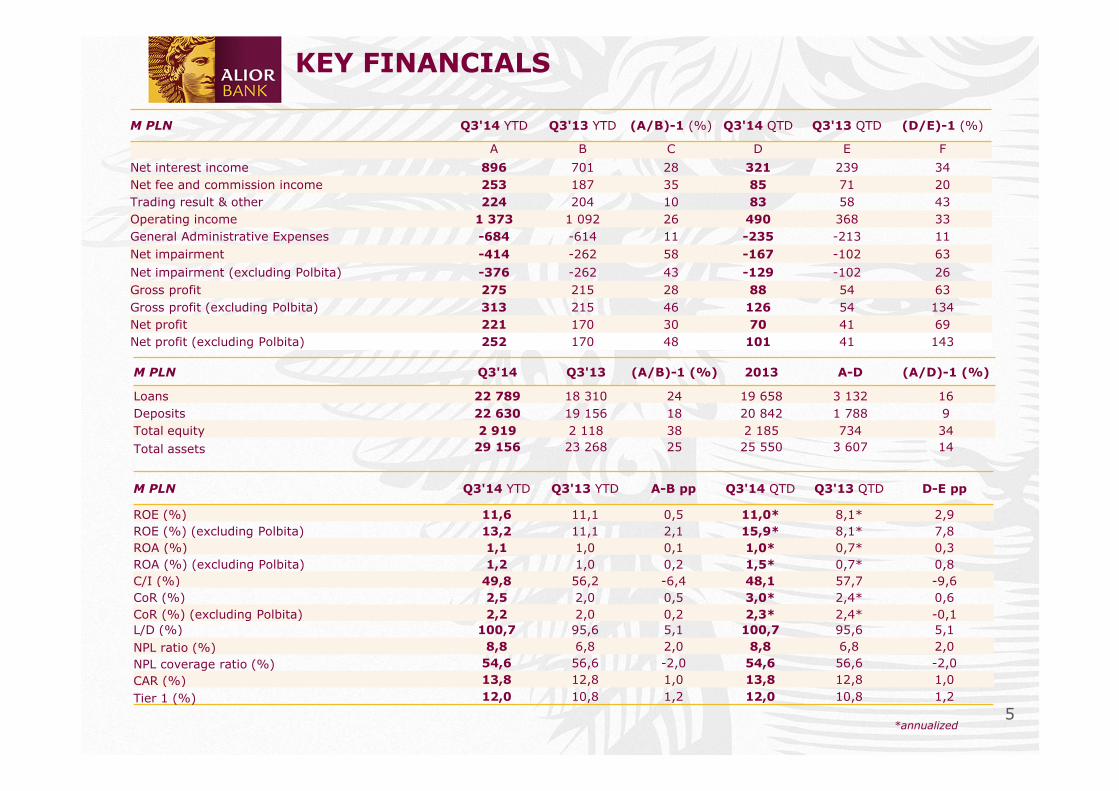
M PLN Q3'14 YTD Q3'13 YTD (A/B)-1 (%) Q3'14 QTD Q3'13 QTD (D/E)-1 (%)
A B C D E F
Net interest income 896 701 28 321 239 34Net fee and commission income 253 187 35 85 71 20Trading result & other 224 204 10 83 58 43Operating income 1 373 1 092 26 490 368 33General Administrative Expenses -684 -614 11 -235 -213 11Net impairment -414 -262 58 -167 -102 63
Net impairment (excluding Polbita) -376 -262 43 -129 -102 26Gross profit 275 215 28 88 54 63Gross profit (excluding Polbita) 313 215 46 126 54 134Net profit 221 170 30 70 41 69Net profit (excluding Polbita) 252 170 48 101 41 143
M PLN Q3'14 Q3'13 (A/B)-1 (%) 2013 A-D (A/D)-1 (%)
Loans 22 789 18 310 24 19 658 3 132 16Deposits 22 630 19 156 18 20 842 1 788 9Total equity 2 919 2 118 38 2 185 734 34
Total assets 29 156 23 268 25 25 550 3 607 14
M PLN Q3'14 YTD Q3'13 YTD A-B pp Q3'14 QTD Q3'13 QTD D-E pp
ROE (%) 11,6 11,1 0,5 11,0* 8,1* 2,9ROE (%) (excluding Polbita) 13,2 11,1 2,1 15,9* 8,1* 7,8ROA (%) 1,1 1,0 0,1 1,0* 0,7* 0,3ROA (%) (excluding Polbita) 1,2 1,0 0,2 1,5* 0,7* 0,8C/I (%) 49,8 56,2 -6,4 48,1 57,7 -9,6CoR (%) 2,5 2,0 0,5 3,0* 2,4* 0,6CoR (%) (excluding Polbita) 2,2 2,0 0,2 2,3* 2,4* -0,1L/D (%) 100,7 95,6 5,1 100,7 95,6 5,1NPL ratio (%) 8,8 6,8 2,0 8,8 6,8 2,0NPL coverage ratio (%) 54,6 56,6 -2,0 54,6 56,6 -2,0CAR (%) 13,8 12,8 1,0 13,8 12,8 1,0
Tier 1 (%) 12,0 10,8 1,2 12,0 10,8 1,2
*annualized
6
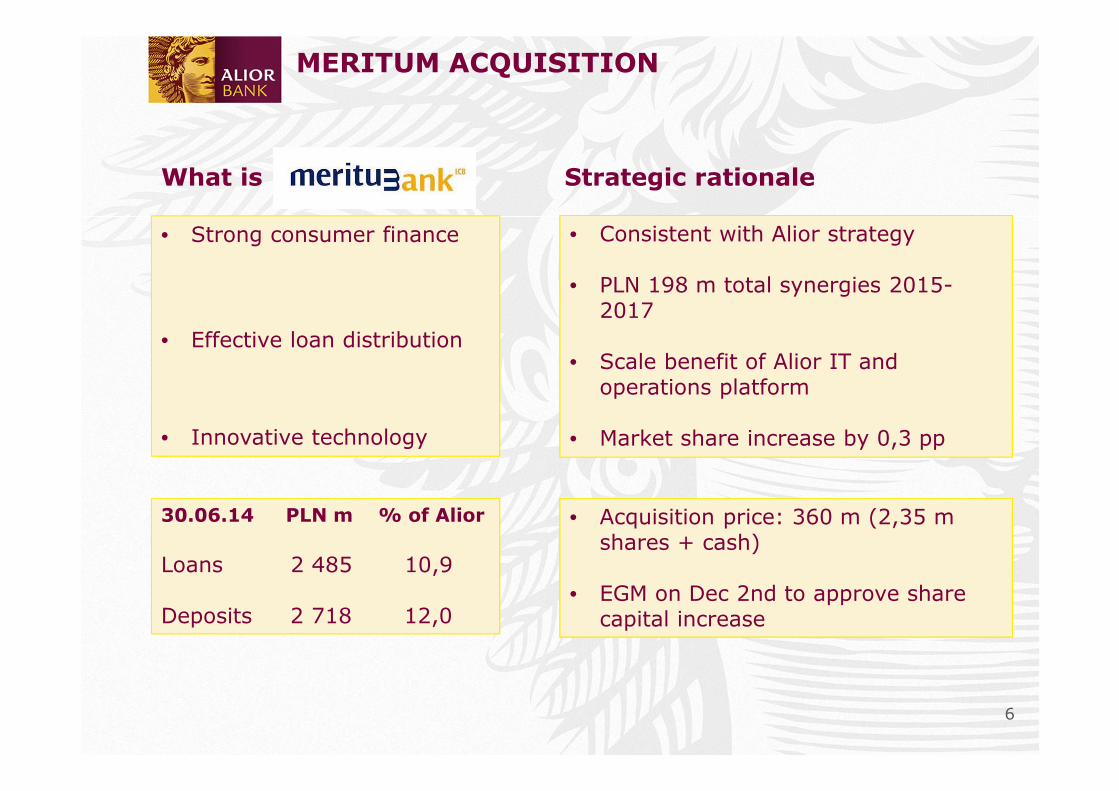
MERITUM ACQUISITION
• Strong consumer finance
• Effective loan distribution
• Innovative technology
30.06.14 PLN m % of Alior
Loans 2 485 10,9
Deposits 2 718 12,0
What is Strategic rationale
• Consistent with Alior strategy
• PLN 198 m total synergies 2015-2017
• Scale benefit of Alior IT and operations platform
• Market share increase by 0,3 pp
• Acquisition price: 360 m (2,35 m shares + cash)
• EGM on Dec 2nd to approve share capital increase

7
AGENDA
• Highlights
• Operational Performance
• Strategic Initiatives
• Outlook
• Appendix
8
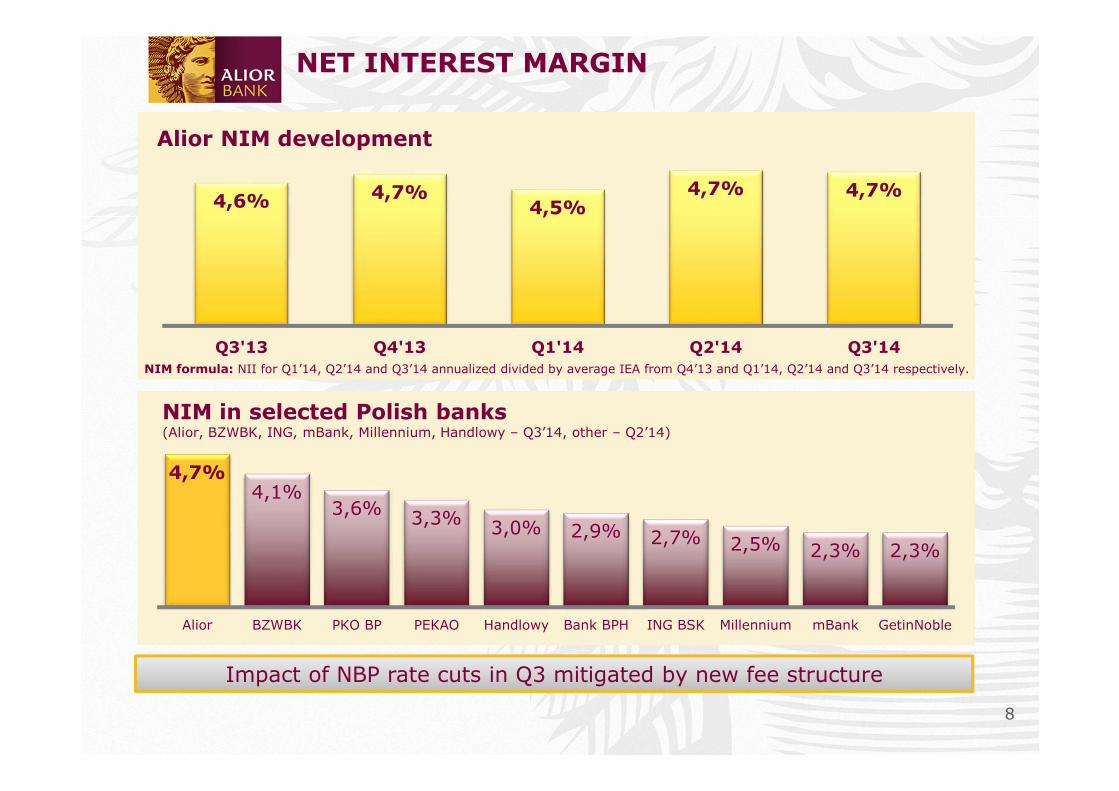
Alior NIM development
NIM in selected Polish banks(Alior, BZWBK, ING, mBank, Millennium, Handlowy – Q3’14, other – Q2’14)
NIM formula: NII for Q1’14, Q2’14 and Q3’14 annualized divided by average IEA from Q4’13 and Q1’14, Q2’14 and Q3’14 respectively.
4,6% 4,7%4,5%
4,7% 4,7%
Q3'13 Q4'13 Q1'14 Q2'14 Q3'14
4,7%4,1%
3,6% 3,3% 3,0% 2,9% 2,7% 2,5% 2,3% 2,3%
Alior BZWBK PKO BP PEKAO Handlowy Bank BPH ING BSK Millennium mBank GetinNoble
Impact of NBP rate cuts in Q3 mitigated by new fee structure
NET INTEREST MARGIN
9
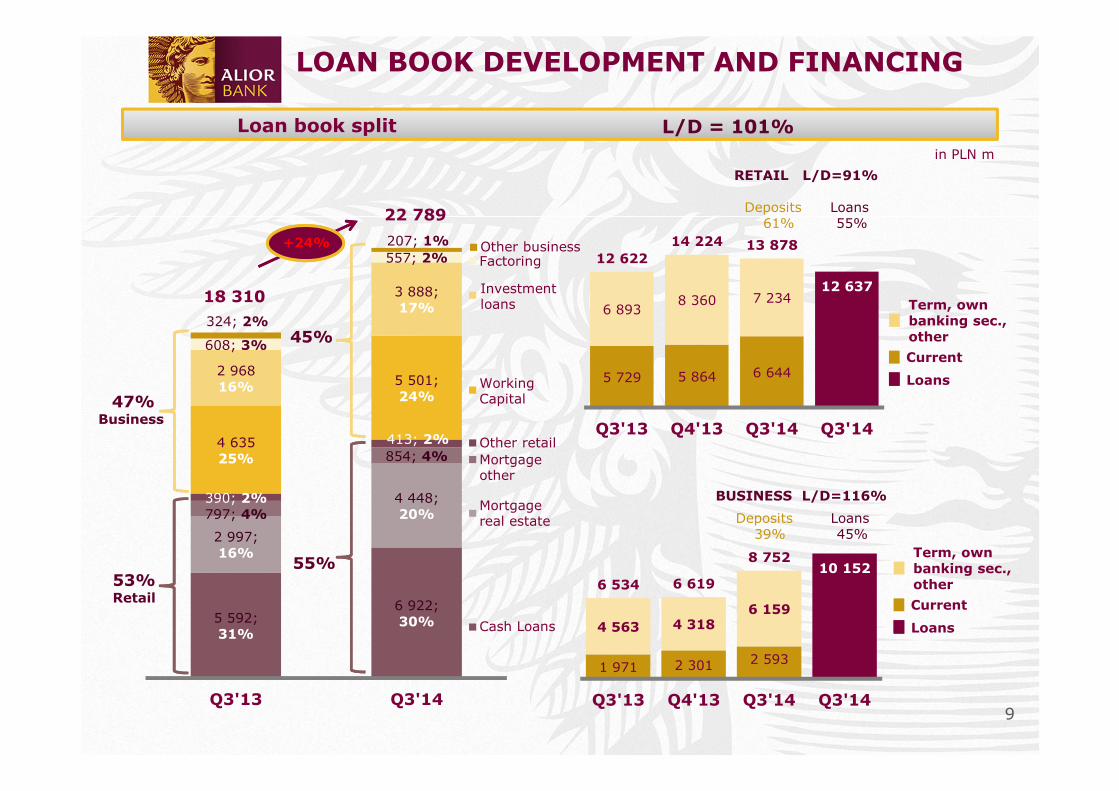
1 971 2 301 2 593
4 563 4 3186 159
10 152
6 534 6 619
8 752
Q3'13 Q4'13 Q3'14 Q3'14
LOAN BOOK DEVELOPMENT AND FINANCING
BUSINESS L/D=116%
Deposits Loans39% 45%
in PLN m
RETAIL L/D=91%
Deposits Loans61% 55%
L/D = 101%Loan book split
47%Business
53%Retail
45%
55%
Other businessFactoring
Investment loans
Working Capital
Other retailMortgage other
Mortgagereal estate
Cash Loans
Term, own banking sec., other
Current
Loans
+24%
Term, own banking sec., other
Current
Loans
18 310
22 789
5 592;31%
6 922;30%
2 997; 16%
4 448;20%797; 4%
854; 4%
390; 2%
413; 2%4 63525%
5 501;24%
2 96816%
3 888;17%
608; 3%
557; 2%
324; 2%
207; 1%
Q3'13 Q3'14
5 729 5 864 6 644
6 8938 360 7 234
12 637
12 622
14 224 13 878
Q3'13 Q4'13 Q3'14 Q3'14
10
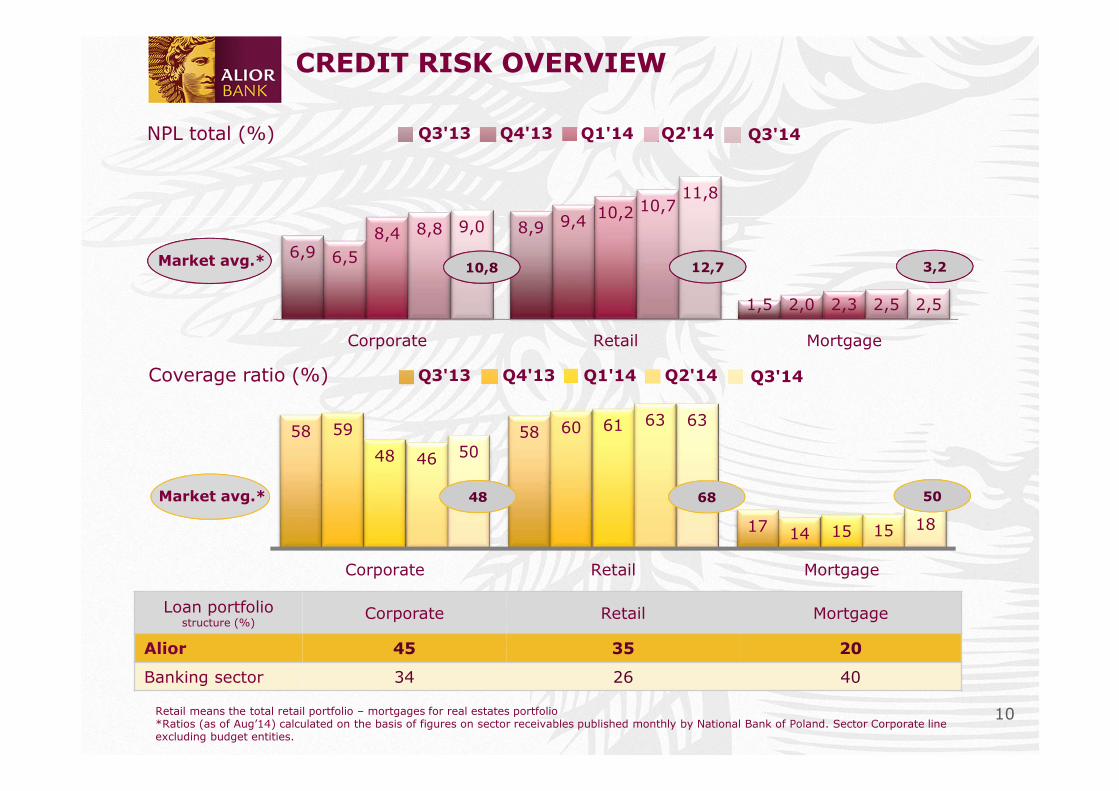
6,9
8,9
1,5
6,5
9,4
2,0
8,410,2
2,3
8,810,7
2,5
9,0
11,8
2,5
Corporate Retail Mortgage
58 58
17
59 60
14
48
61
15
46
63
15
50
63
18
Corporate Retail Mortgage
CREDIT RISK OVERVIEW
NPL total (%) Q2'14 Q3'14Q3'13 Q4'13 Q1'14
Coverage ratio (%)
Loan portfolio structure (%)
Corporate Retail Mortgage
Alior 45 35 20
Banking sector 34 26 40
Retail means the total retail portfolio – mortgages for real estates portfolio*Ratios (as of Aug’14) calculated on the basis of figures on sector receivables published monthly by National Bank of Poland. Sector Corporate line excluding budget entities.
Market avg.*10,8 12,7 3,2
Market avg.* 48 68 50
Q2'14 Q3'14Q3'13 Q4'13 Q1'14
11
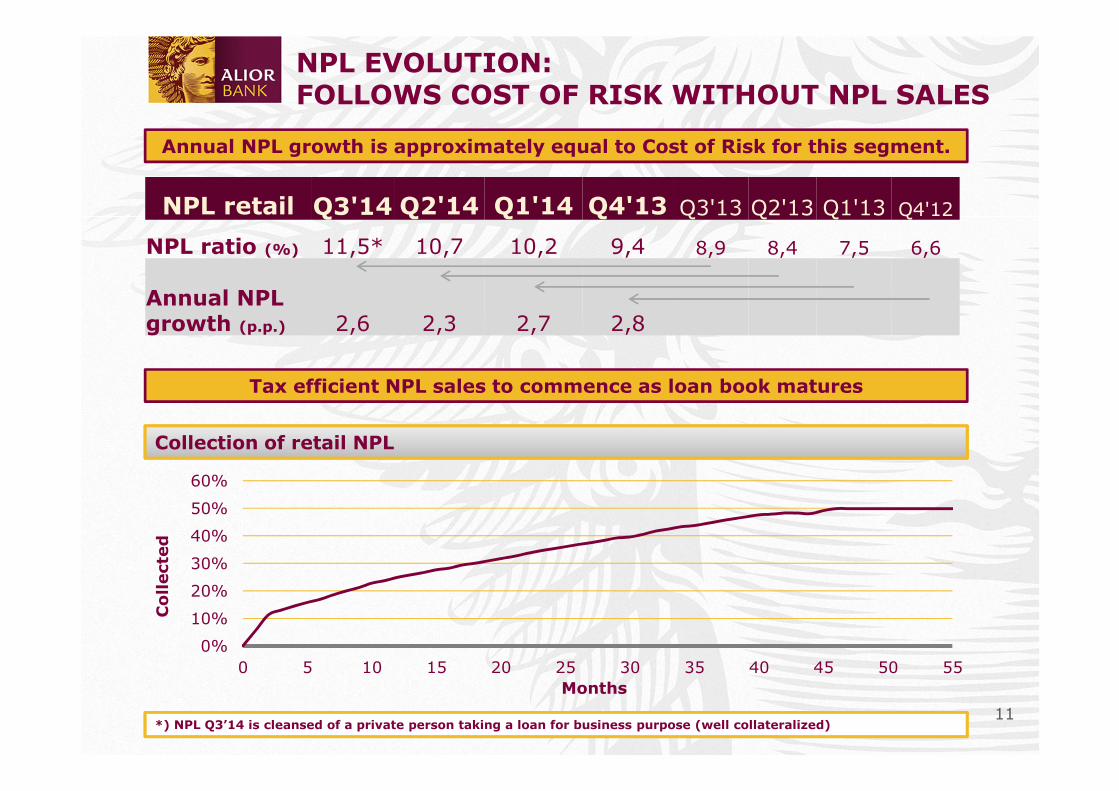
NPL EVOLUTION: FOLLOWS COST OF RISK WITHOUT NPL SALES
0%
10%
20%
30%
40%
50%
60%
0 5 10 15 20 25 30 35 40 45 50 55
Co
llecte
d
Months
Collection of retail NPL
NPL retail Q3'14 Q2'14 Q1'14 Q4'13 Q3'13 Q2'13 Q1'13 Q4'12
NPL ratio (%) 11,5* 10,7 10,2 9,4 8,9 8,4 7,5 6,6
Annual NPLgrowth (p.p.) 2,6 2,3 2,7 2,8
Tax efficient NPL sales to commence as loan book matures
*) NPL Q3’14 is cleansed of a private person taking a loan for business purpose (well collateralized)
Annual NPL growth is approximately equal to Cost of Risk for this segment.
12
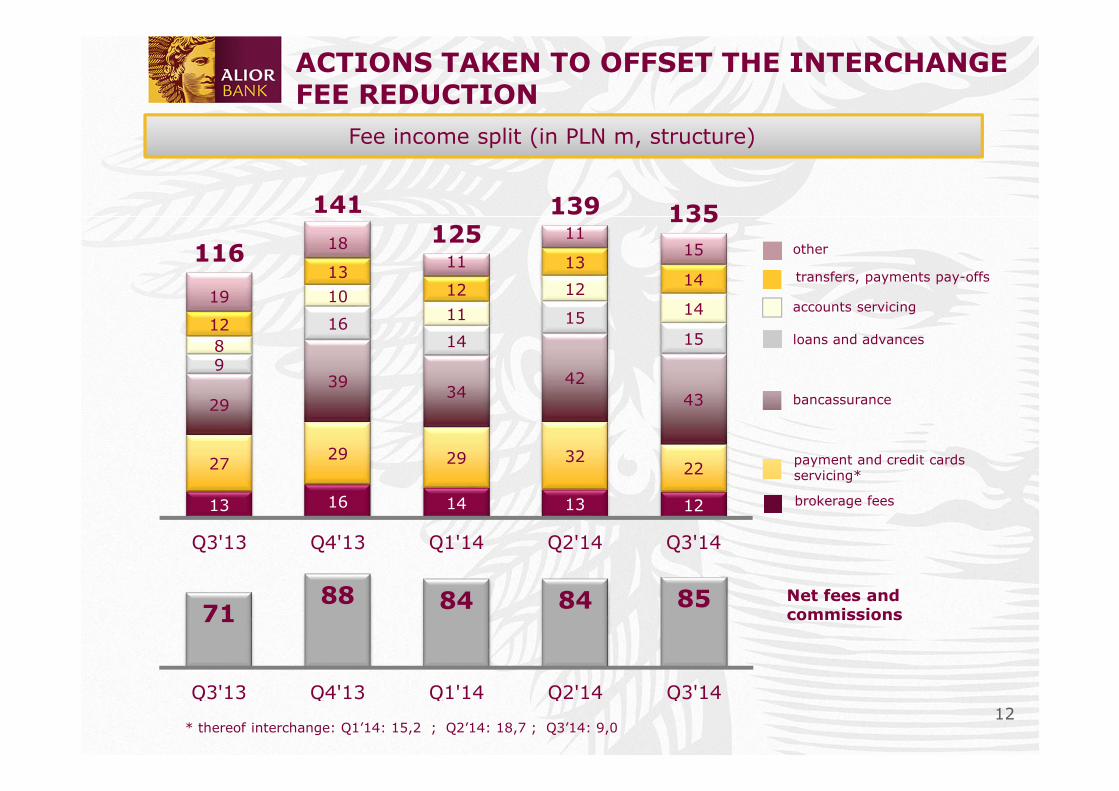
ACTIONS TAKEN TO OFFSET THE INTERCHANGE FEE REDUCTION
Fee income split (in PLN m, structure)
other
transfers, payments pay-offs
accounts servicing
loans and advances
bancassurance
payment and credit cards servicing*
brokerage fees
Net fees andcommissions
13 16 14 13 12
2729 29 32
22
2939
3442
43
9
1614
15158
1011
1214
12
1312
1314
19
1811
1115116
141
125139 135
Q3'13 Q4'13 Q1'14 Q2'14 Q3'14
7188 84 84 85
Q3'13 Q4'13 Q1'14 Q2'14 Q3'14
* thereof interchange: Q1’14: 15,2 ; Q2’14: 18,7 ; Q3’14: 9,0
13
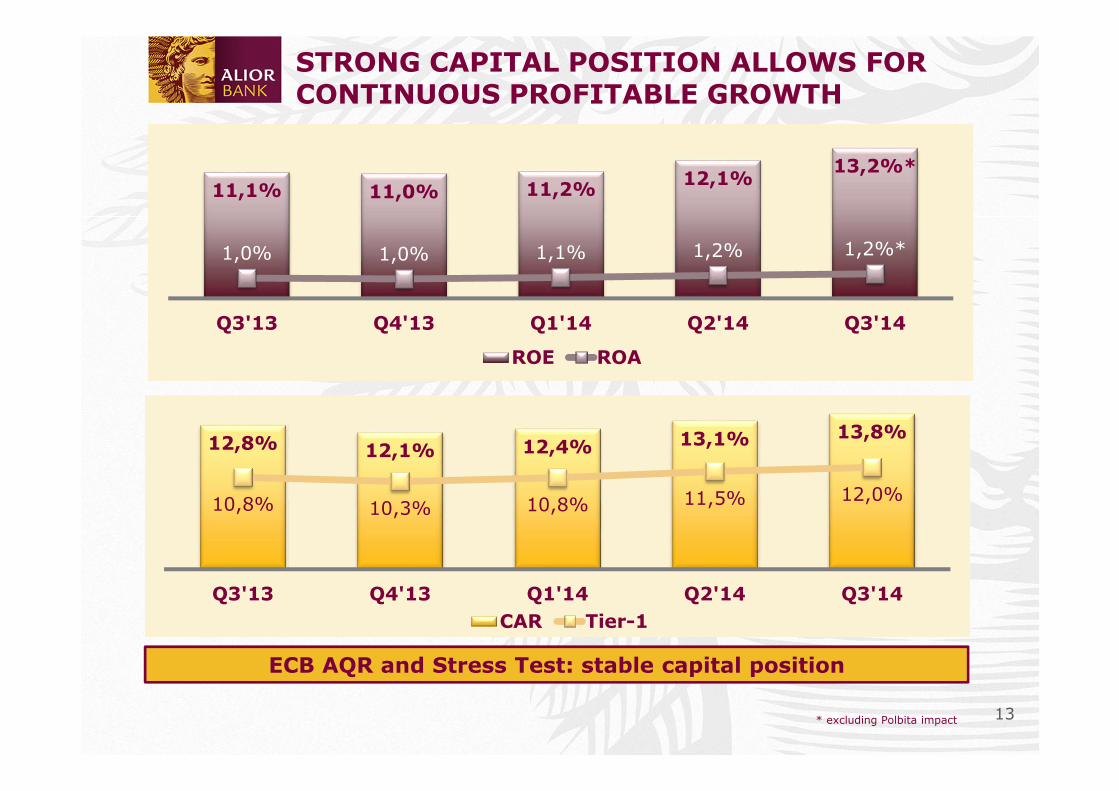
STRONG CAPITAL POSITION ALLOWS FOR CONTINUOUS PROFITABLE GROWTH
* excluding Polbita impact
11,1% 11,0% 11,2%12,1%
13,2%*
1,0% 1,0% 1,1% 1,2% 1,2%*
0,0%
1,0%
2,0%
3,0%
4,0%
5,0%
6,0%
7,0%
8,0%
0,0%
2,0%
4,0%
6,0%
8,0%
10,0%
12,0%
14,0%
Q3'13 Q4'13 Q1'14 Q2'14 Q3'14
ROE ROA
12,8% 12,1% 12,4% 13,1% 13,8%
10,8% 10,3% 10,8% 11,5% 12,0%
0,0%
2,0%
4,0%
6,0%
8,0%
10,0%
12,0%
14,0%
16,0%
18,0%
20,0%
0,0%
2,0%
4,0%
6,0%
8,0%
10,0%
12,0%
14,0%
Q3'13 Q4'13 Q1'14 Q2'14 Q3'14
CAR Tier-1
ECB AQR and Stress Test: stable capital position
14
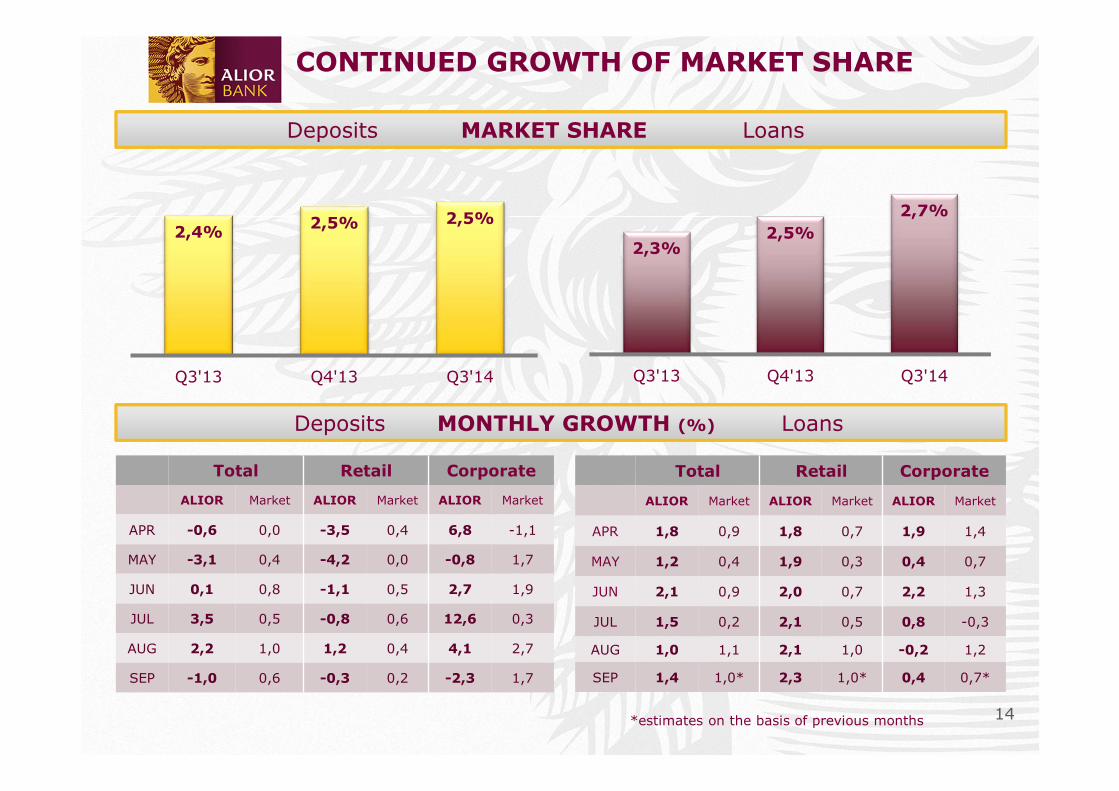
CONTINUED GROWTH OF MARKET SHARE
Total Retail Corporate
ALIOR Market ALIOR Market ALIOR Market
APR -0,6 0,0 -3,5 0,4 6,8 -1,1
MAY -3,1 0,4 -4,2 0,0 -0,8 1,7
JUN 0,1 0,8 -1,1 0,5 2,7 1,9
JUL 3,5 0,5 -0,8 0,6 12,6 0,3
AUG 2,2 1,0 1,2 0,4 4,1 2,7
SEP -1,0 0,6 -0,3 0,2 -2,3 1,7
Total Retail Corporate
ALIOR Market ALIOR Market ALIOR Market
APR 1,8 0,9 1,8 0,7 1,9 1,4
MAY 1,2 0,4 1,9 0,3 0,4 0,7
JUN 2,1 0,9 2,0 0,7 2,2 1,3
JUL 1,5 0,2 2,1 0,5 0,8 -0,3
AUG 1,0 1,1 2,1 1,0 -0,2 1,2
SEP 1,4 1,0* 2,3 1,0* 0,4 0,7*
Deposits MARKET SHARE Loans
Deposits MONTHLY GROWTH (%) Loans
2,3%2,5%
2,7%
Q3'13 Q4'13 Q3'14
2,4%2,5% 2,5%
Q3'13 Q4'13 Q3'14
*estimates on the basis of previous months
15
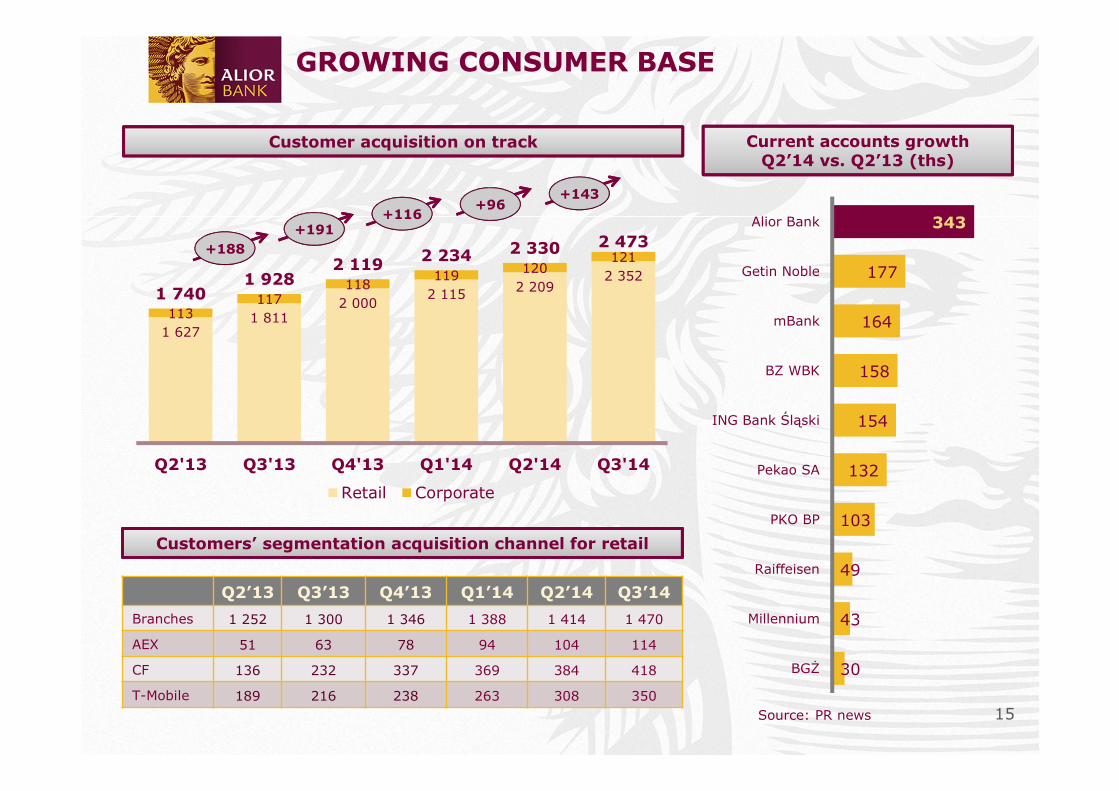
GROWING CONSUMER BASE
Customer acquisition on track
Q2’13 Q3’13 Q4’13 Q1’14 Q2’14 Q3’14
Branches 1 252 1 300 1 346 1 388 1 414 1 470
AEX 51 63 78 94 104 114
CF 136 232 337 369 384 418
T-Mobile 189 216 238 263 308 350
+96
Customers’ segmentation acquisition channel for retail
Current accounts growthQ2’14 vs. Q2’13 (ths)
Source: PR news
+191
+188
+116
1 6271 811
2 0002 115 2 209
2 352
113117
118119 120
121
1 7401 928
2 1192 234 2 330 2 473
Q2'13 Q3'13 Q4'13 Q1'14 Q2'14 Q3'14
Retail Corporate
+143
343
177
164
158
154
132
103
49
43
30
Alior Bank
Getin Noble
mBank
BZ WBK
ING Bank Śląski
Pekao SA
PKO BP
Raiffeisen
Millennium
BGŻ
16
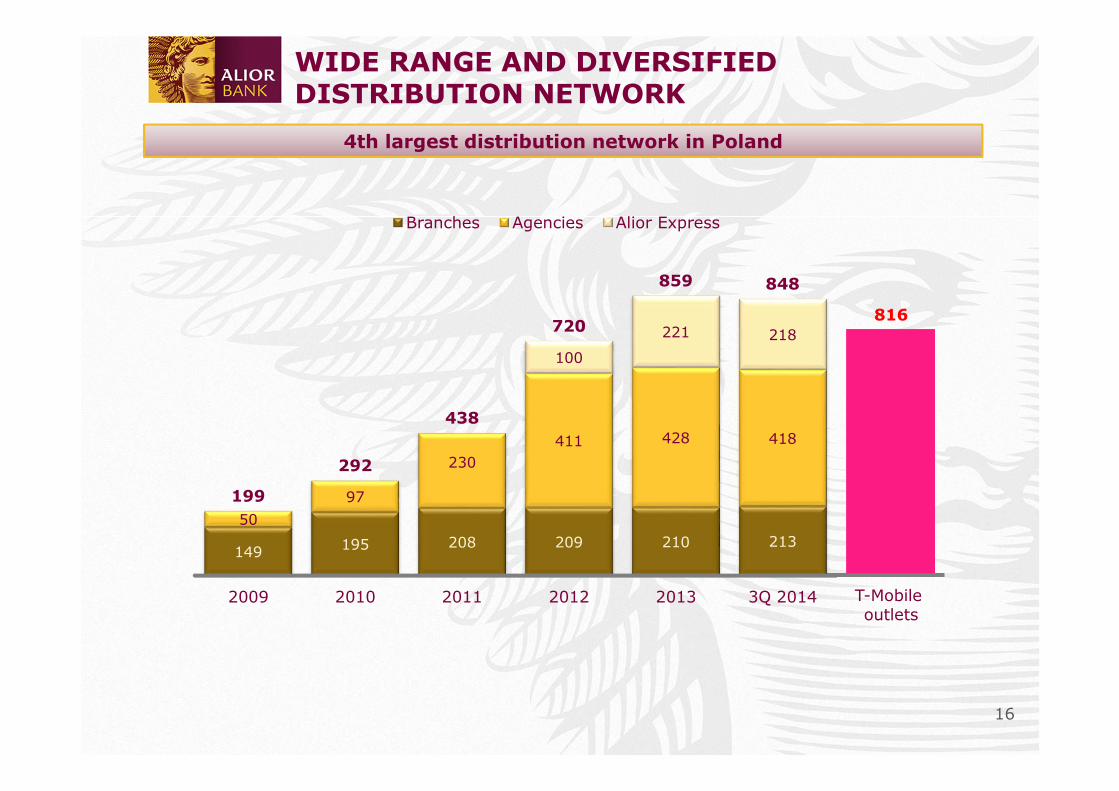
WIDE RANGE AND DIVERSIFIED DISTRIBUTION NETWORK
4th largest distribution network in Poland
816
T-Mobile outlets
149 195 208 209 210 21350
97
230411 428 418
100
221 218
199
292
438
720
859 848
2009 2010 2011 2012 2013 3Q 2014
Branches Agencies Alior Express
17
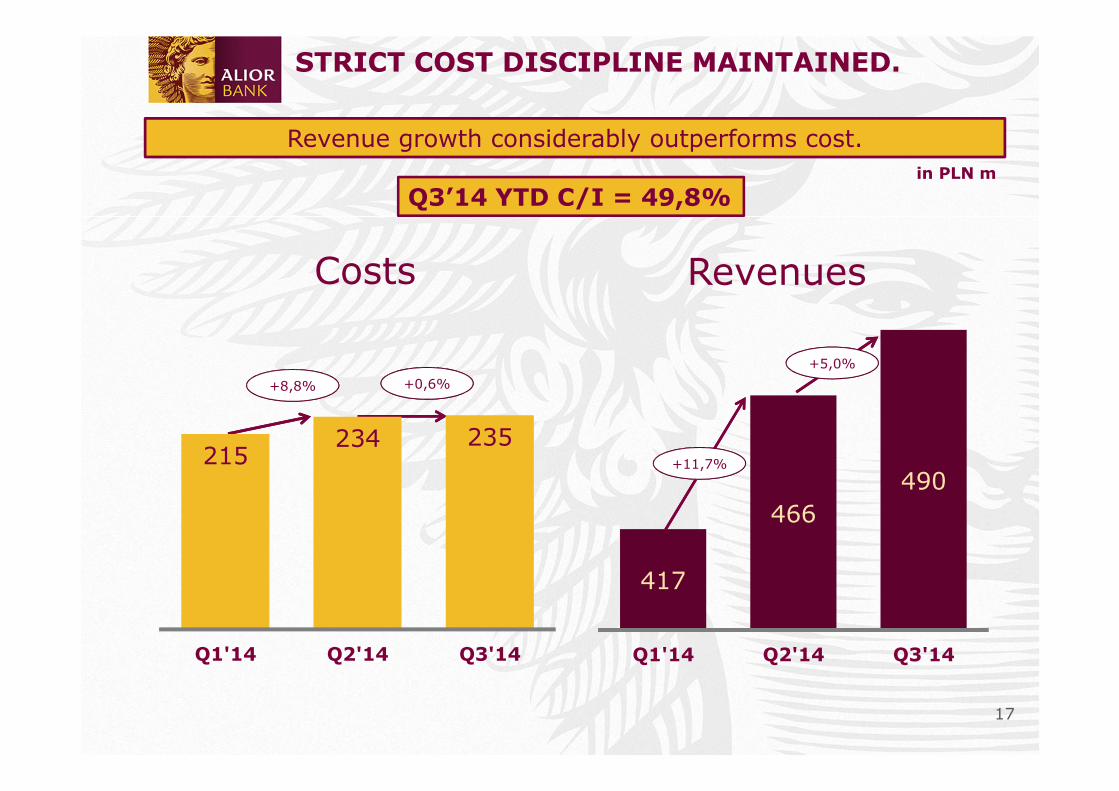
417
466490
Q1'14 Q2'14 Q3'14
STRICT COST DISCIPLINE MAINTAINED.
in PLN m
Revenue growth considerably outperforms cost.
+11,7%
Revenues
+5,0%
+8,8% +0,6%
Q3’14 YTD C/I = 49,8%
215234 235
Q1'14 Q2'14 Q3'14
Costs

18
AGENDA
• Highlights
• Operational Performance
• Strategic Initiatives
• Outlook
• Appendix
19
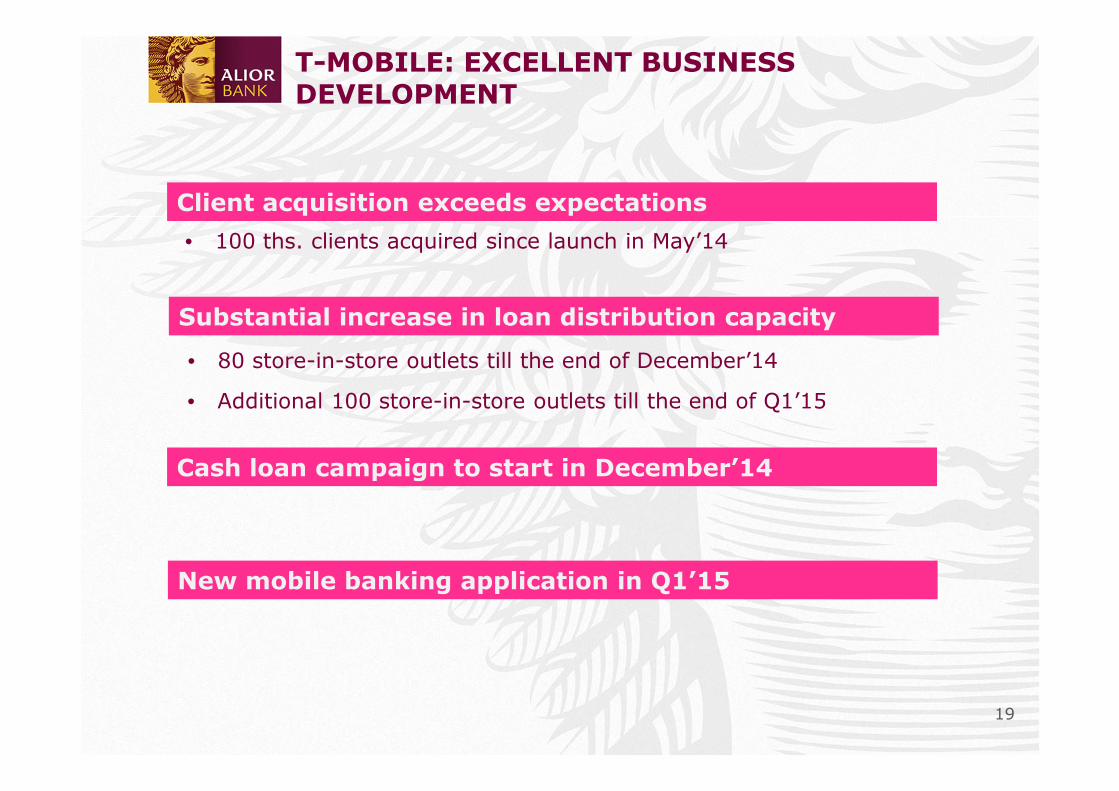
T-MOBILE: EXCELLENT BUSINESS DEVELOPMENT
Client acquisition exceeds expectations
New mobile banking application in Q1’15
Cash loan campaign to start in December’14
• 100 ths. clients acquired since launch in May’14
• 80 store-in-store outlets till the end of December’14
• Additional 100 store-in-store outlets till the end of Q1’15
Substantial increase in loan distribution capacity
20
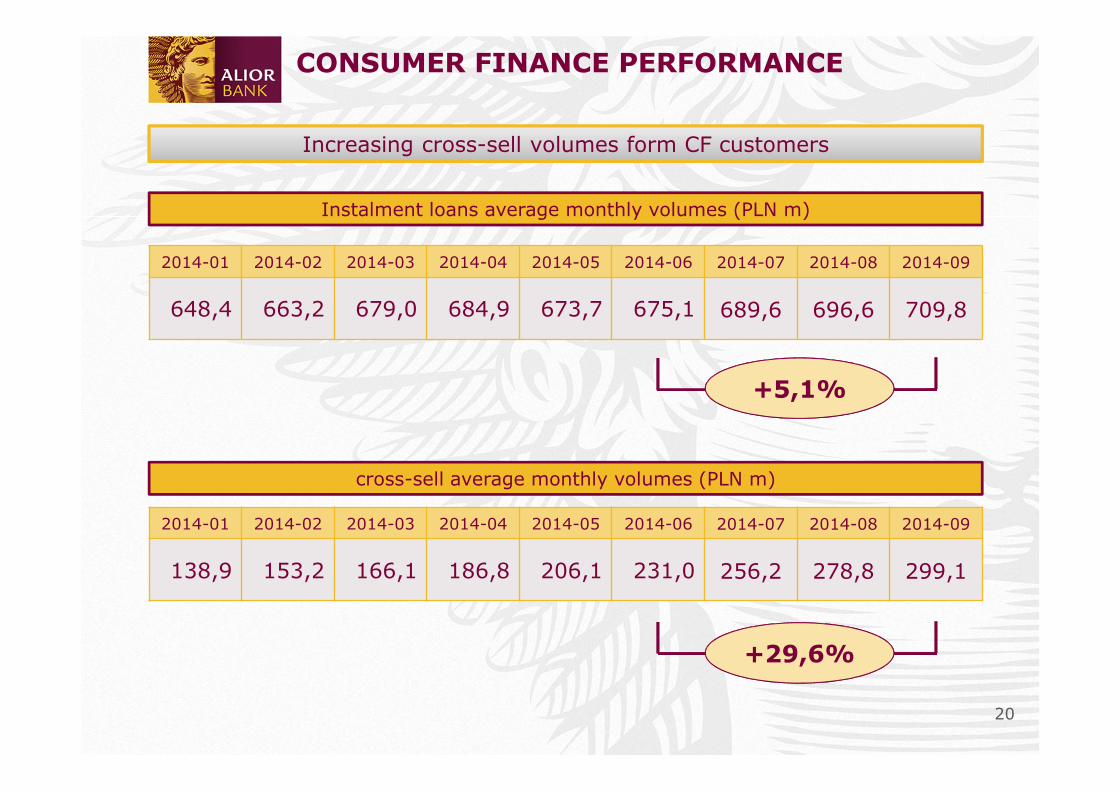
CONSUMER FINANCE PERFORMANCE
Increasing cross-sell volumes form CF customers
Instalment loans average monthly volumes (PLN m)
2014-01 2014-02 2014-03 2014-04 2014-05 2014-06 2014-07 2014-08 2014-09
648,4 663,2 679,0 684,9 673,7 675,1 689,6 696,6 709,8
+5,1%
cross-sell average monthly volumes (PLN m)
2014-01 2014-02 2014-03 2014-04 2014-05 2014-06 2014-07 2014-08 2014-09
138,9 153,2 166,1 186,8 206,1 231,0 256,2 278,8 299,1
+29,6%

21
AGENDA
• Highlights
• Operational Performance
• Strategic Initiatives
• Outlook
• Appendix
22
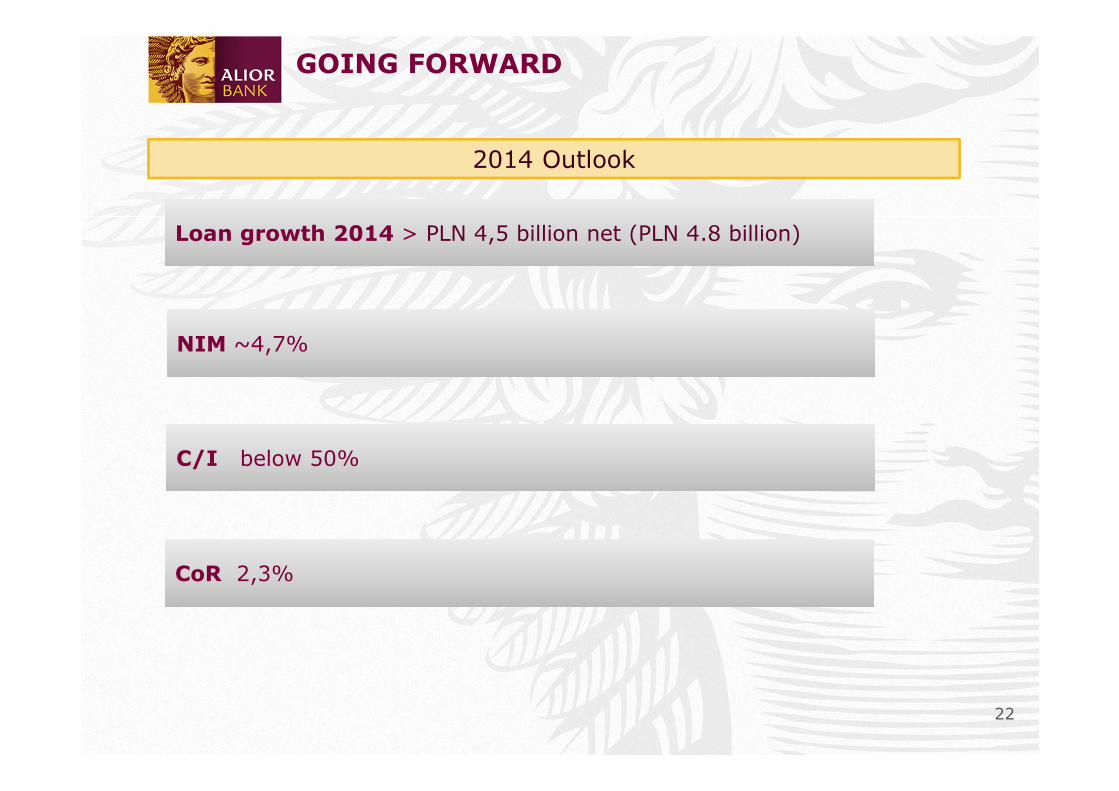
GOING FORWARD
NIM ~4,7%NIM ~4,7%
C/I below 50% C/I below 50%
CoR 2,3%CoR 2,3%
Loan growth 2014 > PLN 4,5 billion net (PLN 4.8 billion)Loan growth 2014 > PLN 4,5 billion net (PLN 4.8 billion)
2014 Outlook
23
AGENDA
• Highlights
• Operational Performance
• Strategic Initiatives
• Outlook
• Appendix
24
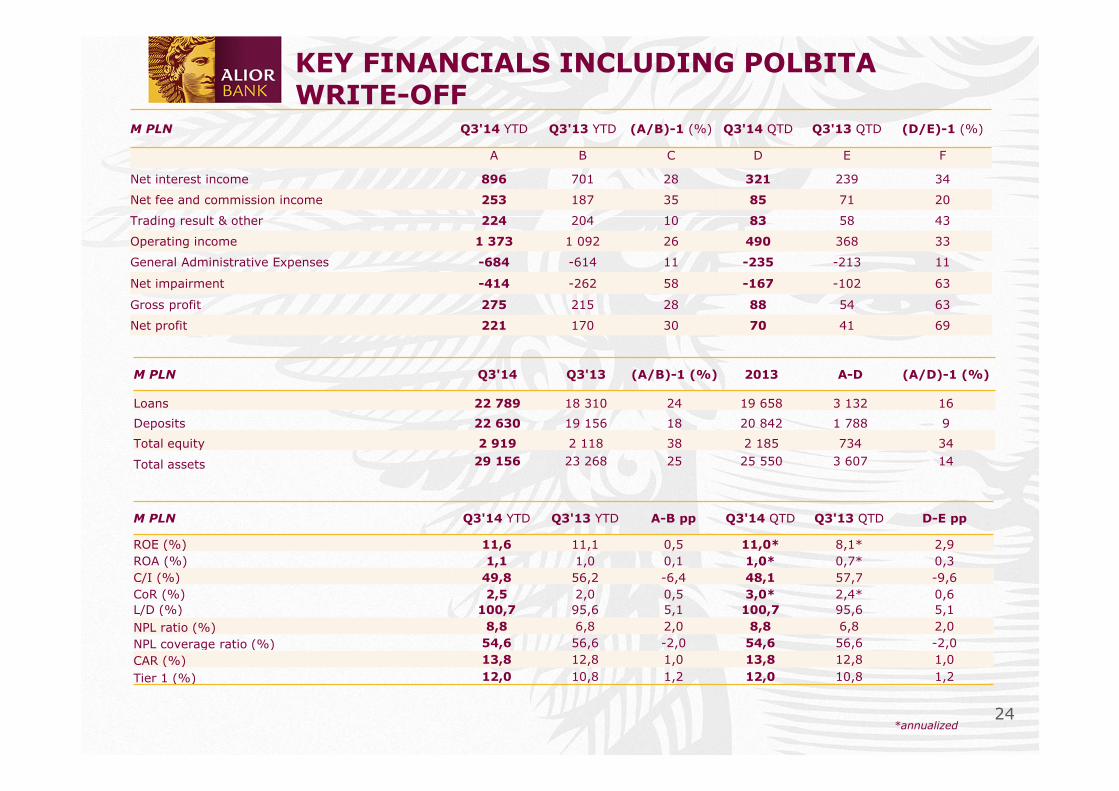
KEY FINANCIALS INCLUDING POLBITA WRITE-OFF
M PLN Q3'14 YTD Q3'13 YTD (A/B)-1 (%) Q3'14 QTD Q3'13 QTD (D/E)-1 (%)
A B C D E F
Net interest income 896 701 28 321 239 34
Net fee and commission income 253 187 35 85 71 20
Trading result & other 224 204 10 83 58 43
Operating income 1 373 1 092 26 490 368 33
General Administrative Expenses -684 -614 11 -235 -213 11
Net impairment -414 -262 58 -167 -102 63
Gross profit 275 215 28 88 54 63
Net profit 221 170 30 70 41 69
M PLN Q3'14 Q3'13 (A/B)-1 (%) 2013 A-D (A/D)-1 (%)
Loans 22 789 18 310 24 19 658 3 132 16
Deposits 22 630 19 156 18 20 842 1 788 9
Total equity 2 919 2 118 38 2 185 734 34
Total assets 29 156 23 268 25 25 550 3 607 14
M PLN Q3'14 YTD Q3'13 YTD A-B pp Q3'14 QTD Q3'13 QTD D-E pp
ROE (%) 11,6 11,1 0,5 11,0* 8,1* 2,9ROA (%) 1,1 1,0 0,1 1,0* 0,7* 0,3C/I (%) 49,8 56,2 -6,4 48,1 57,7 -9,6CoR (%) 2,5 2,0 0,5 3,0* 2,4* 0,6L/D (%) 100,7 95,6 5,1 100,7 95,6 5,1NPL ratio (%) 8,8 6,8 2,0 8,8 6,8 2,0NPL coverage ratio (%) 54,6 56,6 -2,0 54,6 56,6 -2,0CAR (%) 13,8 12,8 1,0 13,8 12,8 1,0
Tier 1 (%) 12,0 10,8 1,2 12,0 10,8 1,2
*annualized
25
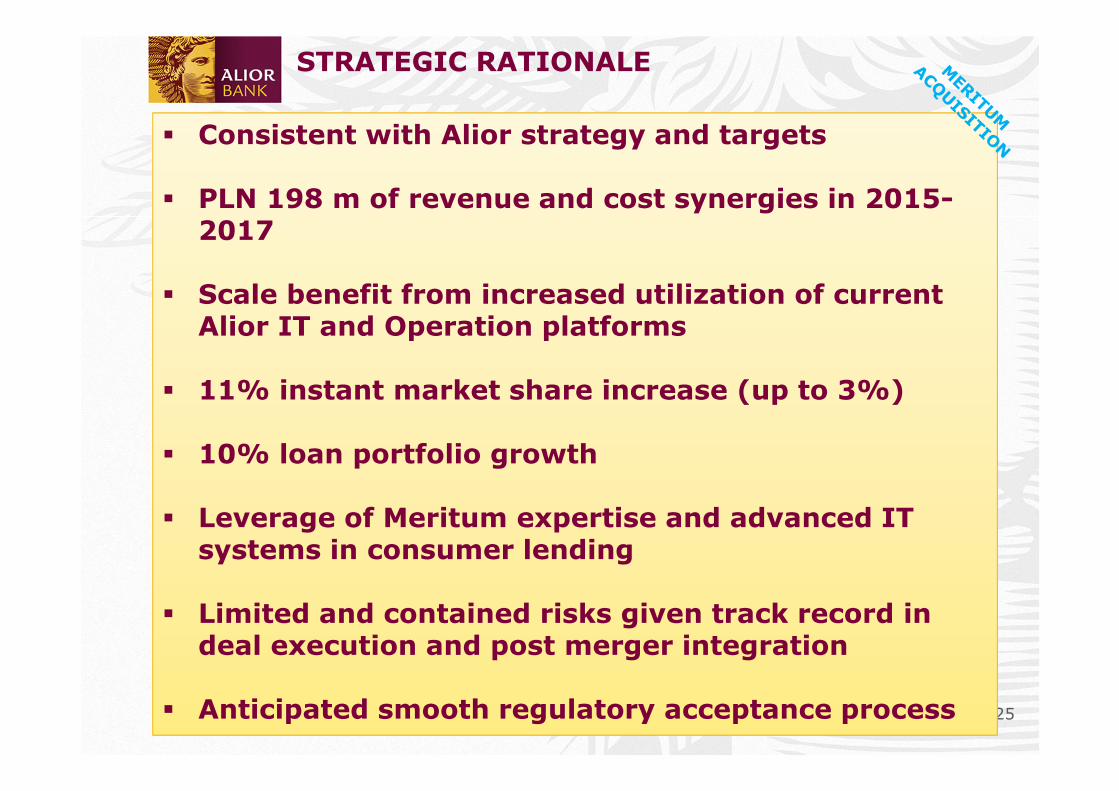
STRATEGIC RATIONALE
� Consistent with Alior strategy and targets
� PLN 198 m of revenue and cost synergies in 2015-2017
� Scale benefit from increased utilization of current Alior IT and Operation platforms
� 11% instant market share increase (up to 3%)
� 10% loan portfolio growth
� Leverage of Meritum expertise and advanced IT systems in consumer lending
� Limited and contained risks given track record in deal execution and post merger integration
� Anticipated smooth regulatory acceptance process
26
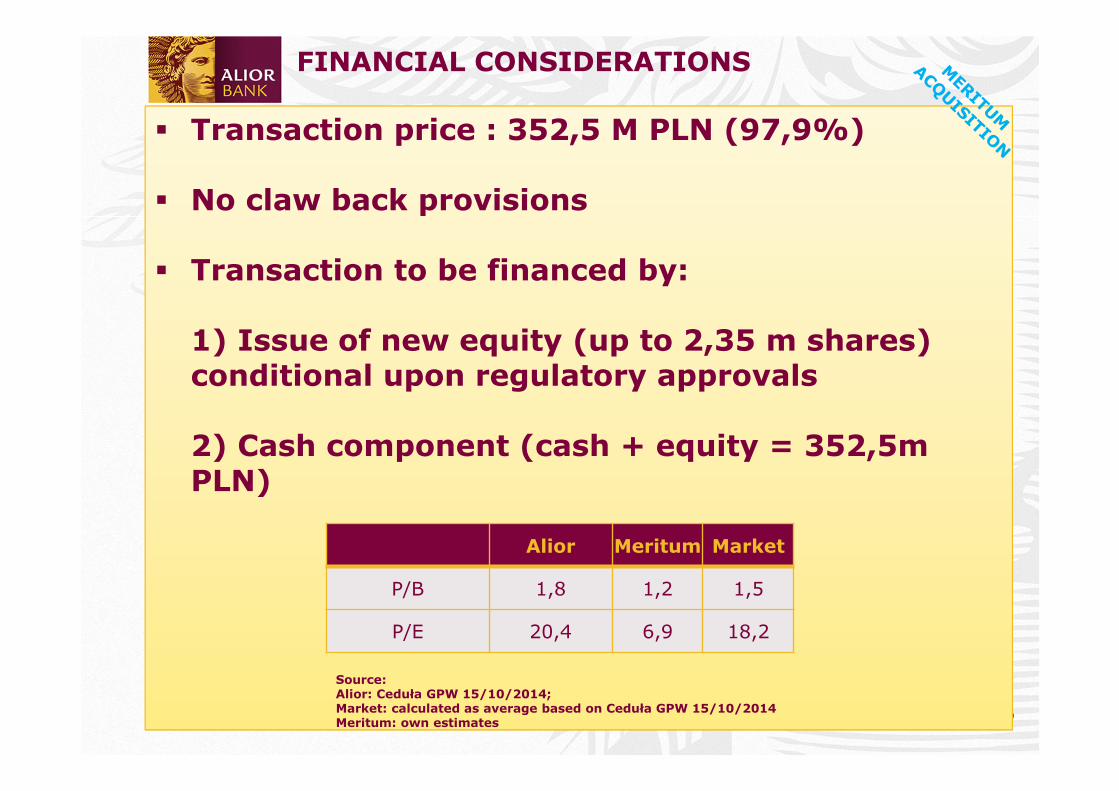
FINANCIAL CONSIDERATIONS
� Transaction price : 352,5 M PLN (97,9%)
� No claw back provisions
� Transaction to be financed by:
1) Issue of new equity (up to 2,35 m shares) conditional upon regulatory approvals
2) Cash component (cash + equity = 352,5m PLN)
Alior Meritum Market
P/B 1,8 1,2 1,5
P/E 20,4 6,9 18,2
Source:Alior: Ceduła GPW 15/10/2014;Market: calculated as average based on Ceduła GPW 15/10/2014Meritum: own estimates
27
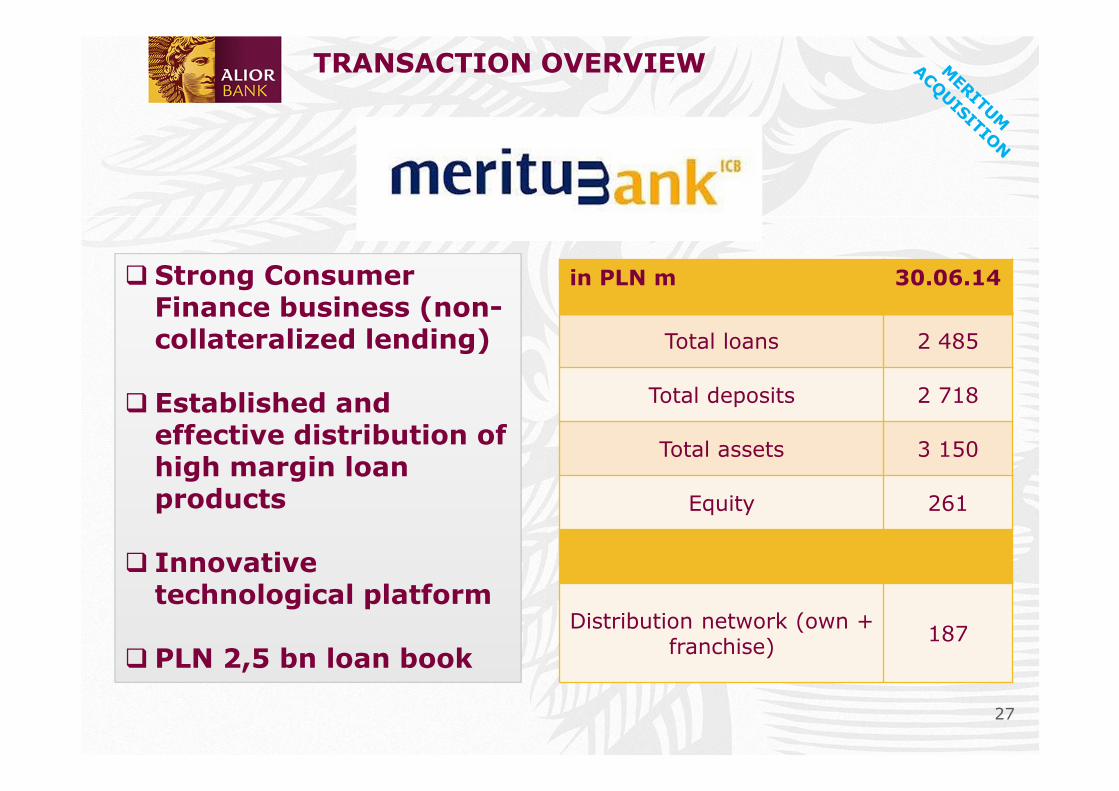
TRANSACTION OVERVIEW
� Strong Consumer Finance business (non-collateralized lending)
� Established and effective distribution of high margin loan products
� Innovative technological platform
� PLN 2,5 bn loan book
in PLN m 30.06.14
Total loans 2 485
Total deposits 2 718
Total assets 3 150
Equity 261
Distribution network (own + franchise) 187
28
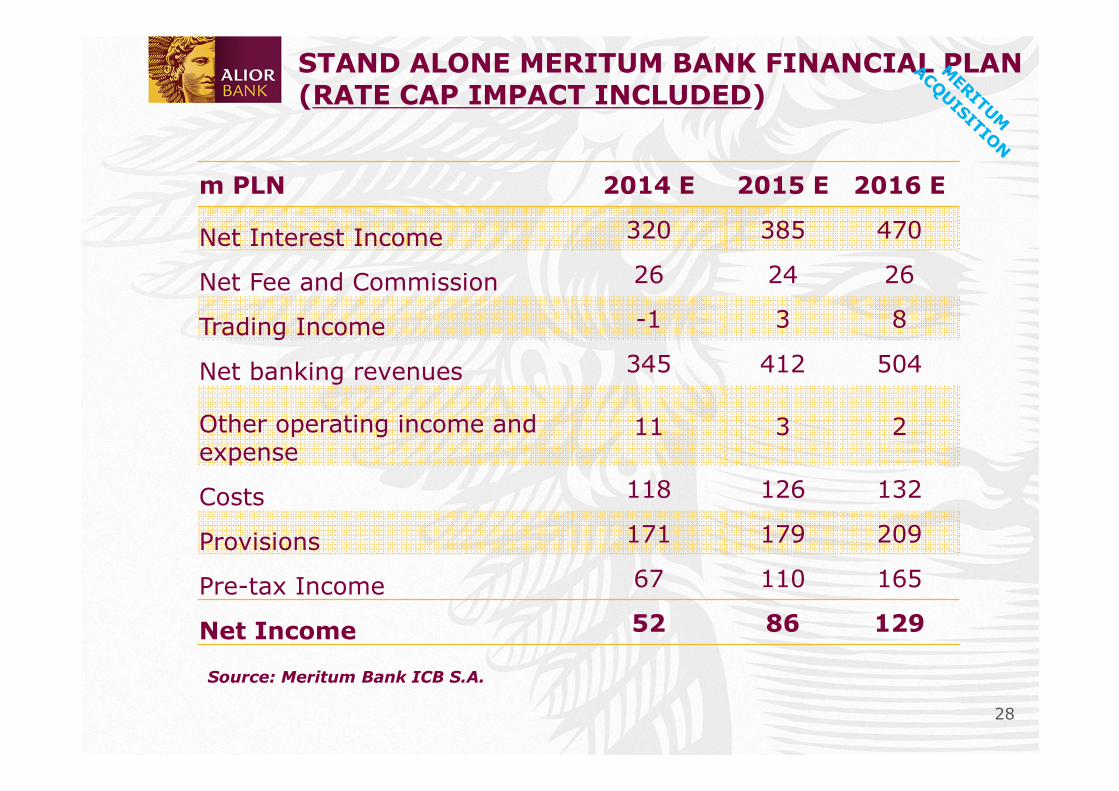
STAND ALONE MERITUM BANK FINANCIAL PLAN (RATE CAP IMPACT INCLUDED)
m PLN 2014 E 2015 E 2016 E
Net Interest Income 320 385 470
Net Fee and Commission 26 24 26
Trading Income -1 3 8
Net banking revenues 345 412 504
Other operating income and expense
11 3 2
Costs 118 126 132
Provisions 171 179 209
Pre-tax Income 67 110 165
Net Income 52 86 129
Source: Meritum Bank ICB S.A.
29
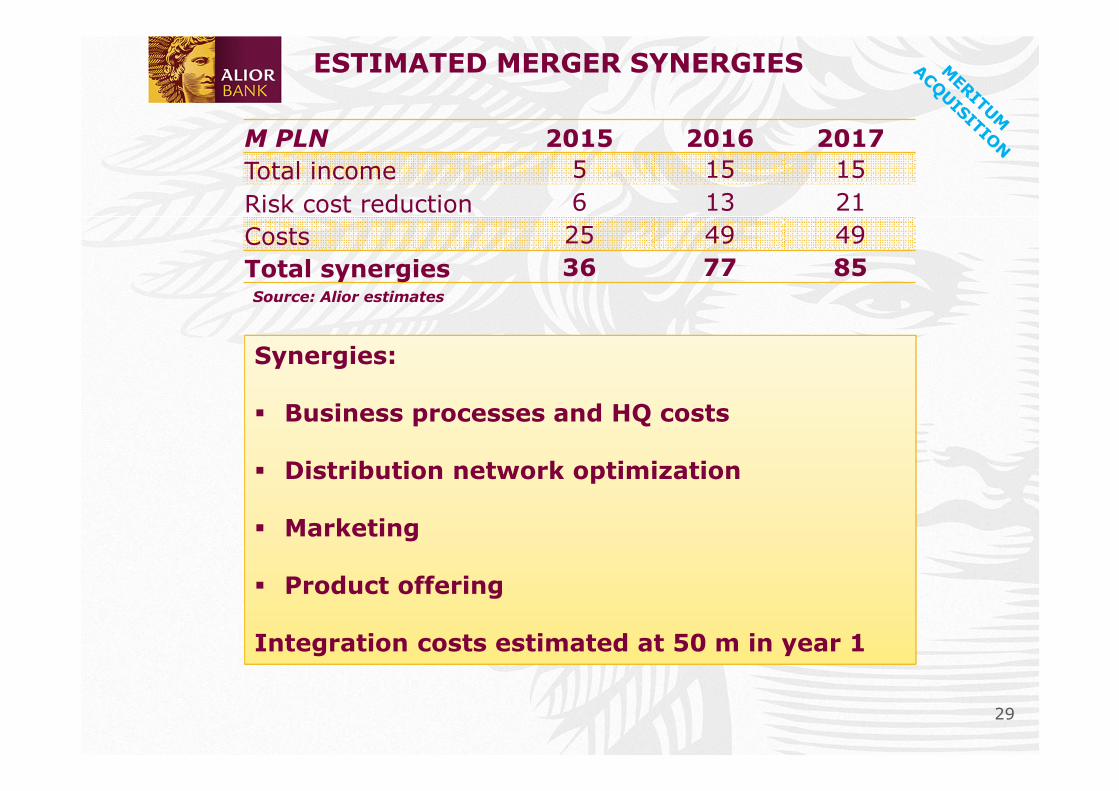
M PLN 2015 2016 2017
Total income 5 15 15Risk cost reduction 6 13 21Costs 25 49 49Total synergies 36 77 85Source: Alior estimates
Synergies:
� Business processes and HQ costs
� Distribution network optimization
� Marketing
� Product offering
Integration costs estimated at 50 m in year 1
ESTIMATED MERGER SYNERGIES

30
POTENTIAL CHALLENGES AND RISK MITIGANTS
� Migration from PAS (Polish accounting standards) to IAS (international accounting standards)� Assessed by Big 4 auditor at ~20 m PLN equity
impact
� Mitigating rate cuts impact� Robust plan for new and existing portfolio
re-pricing already being implemented� Track records and statistics from previous rate cut
related re-pricings
� Maintaining current and attracting new deposit clients in recent low interest rate environment � Combined expertise in relationship banking
31
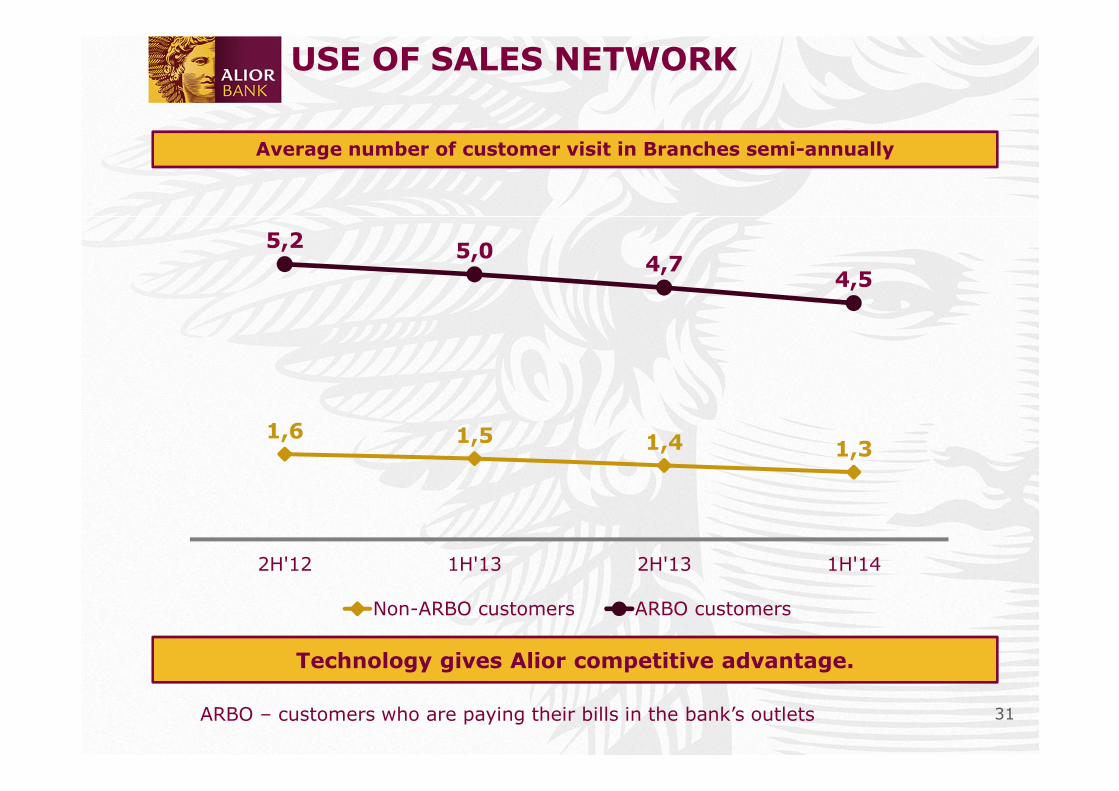
USE OF SALES NETWORK
Average number of customer visit in Branches semi-annually
1,6 1,5 1,4 1,3
5,25,0
4,74,5
2H'12 1H'13 2H'13 1H'14
Non-ARBO customers ARBO customers
Technology gives Alior competitive advantage.
ARBO – customers who are paying their bills in the bank’s outlets
32
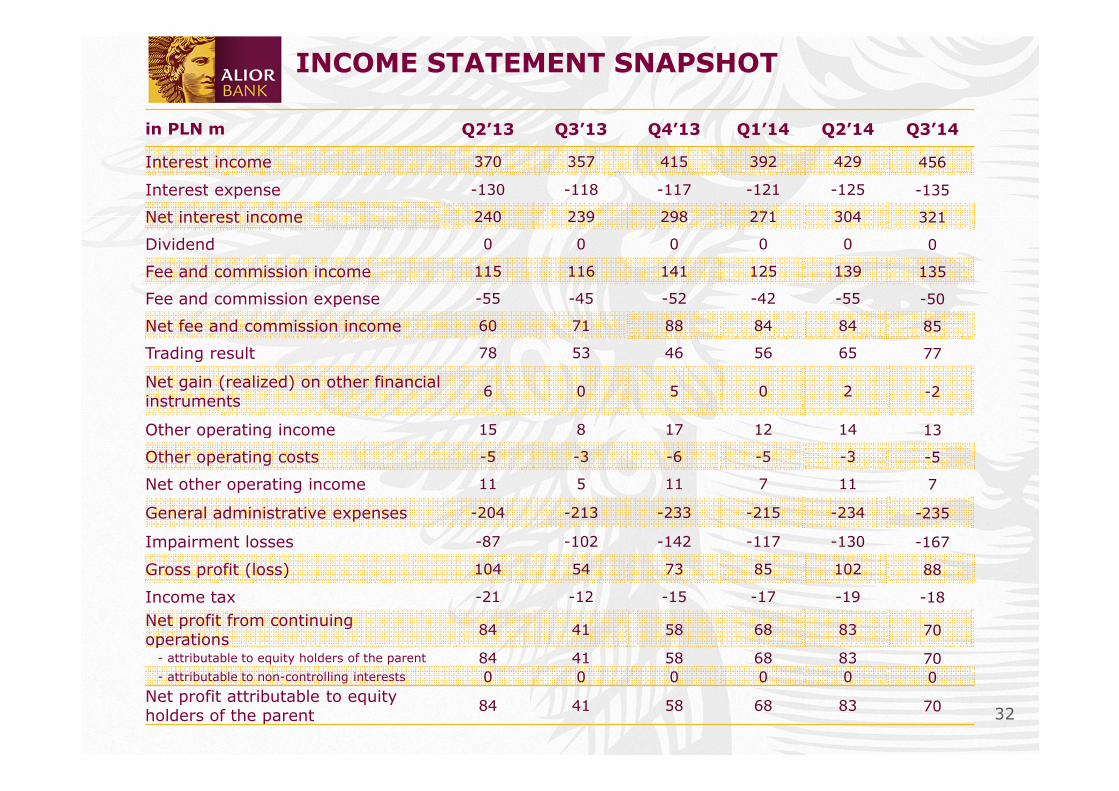
INCOME STATEMENT SNAPSHOT
in PLN m Q2’13 Q3’13 Q4’13 Q1’14 Q2’14 Q3’14
Interest income 370 357 415 392 429 456
Interest expense -130 -118 -117 -121 -125 -135
Net interest income 240 239 298 271 304 321
Dividend 0 0 0 0 0 0
Fee and commission income 115 116 141 125 139 135
Fee and commission expense -55 -45 -52 -42 -55 -50
Net fee and commission income 60 71 88 84 84 85
Trading result 78 53 46 56 65 77
Net gain (realized) on other financial instruments
6 0 5 0 2 -2
Other operating income 15 8 17 12 14 13
Other operating costs -5 -3 -6 -5 -3 -5
Net other operating income 11 5 11 7 11 7
General administrative expenses -204 -213 -233 -215 -234 -235
Impairment losses -87 -102 -142 -117 -130 -167
Gross profit (loss) 104 54 73 85 102 88
Income tax -21 -12 -15 -17 -19 -18
Net profit from continuing operations
84 41 58 68 83 70
- attributable to equity holders of the parent 84 41 58 68 83 70- attributable to non-controlling interests 0 0 0 0 0 0
Net profit attributable to equity holders of the parent
84 41 58 68 83 70
33
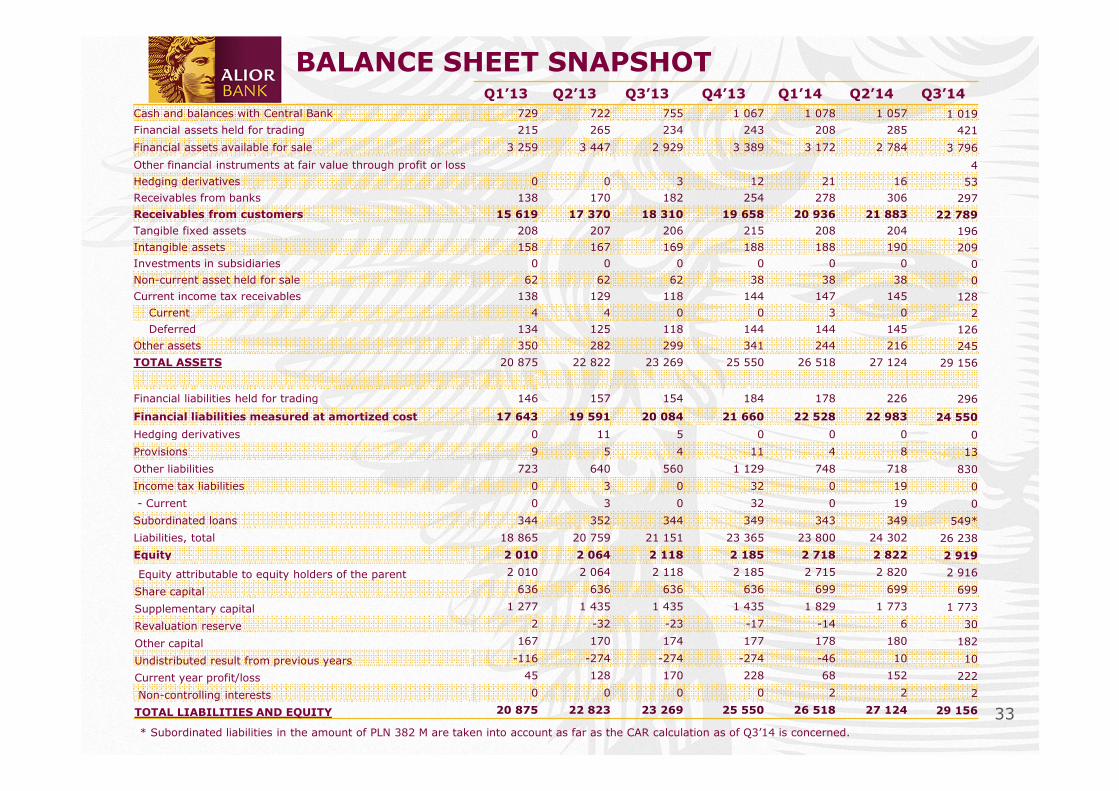
BALANCE SHEET SNAPSHOTQ1’13 Q2’13 Q3’13 Q4’13 Q1’14 Q2’14 Q3’14
Cash and balances with Central Bank 729 722 755 1 067 1 078 1 057 1 019Financial assets held for trading 215 265 234 243 208 285 421
Financial assets available for sale 3 259 3 447 2 929 3 389 3 172 2 784 3 796
Other financial instruments at fair value through profit or loss 4Hedging derivatives 0 0 3 12 21 16 53Receivables from banks 138 170 182 254 278 306 297Receivables from customers 15 619 17 370 18 310 19 658 20 936 21 883 22 789
Tangible fixed assets 208 207 206 215 208 204 196Intangible assets 158 167 169 188 188 190 209Investments in subsidiaries 0 0 0 0 0 0 0Non-current asset held for sale 62 62 62 38 38 38 0Current income tax receivables 138 129 118 144 147 145 128
Current 4 4 0 0 3 0 2Deferred 134 125 118 144 144 145 126
Other assets 350 282 299 341 244 216 245
TOTAL ASSETS 20 875 22 822 23 269 25 550 26 518 27 124 29 156
Financial liabilities held for trading 146 157 154 184 178 226 296
Financial liabilities measured at amortized cost 17 643 19 591 20 084 21 660 22 528 22 983 24 550
Hedging derivatives 0 11 5 0 0 0 0
Provisions 9 5 4 11 4 8 13
Other liabilities 723 640 560 1 129 748 718 830
Income tax liabilities 0 3 0 32 0 19 0
- Current 0 3 0 32 0 19 0
Subordinated loans 344 352 344 349 343 349 549*
Liabilities, total 18 865 20 759 21 151 23 365 23 800 24 302 26 238
Equity 2 010 2 064 2 118 2 185 2 718 2 822 2 919
Equity attributable to equity holders of the parent 2 010 2 064 2 118 2 185 2 715 2 820 2 916
Share capital 636 636 636 636 699 699 699
Supplementary capital 1 277 1 435 1 435 1 435 1 829 1 773 1 773
Revaluation reserve 2 -32 -23 -17 -14 6 30
Other capital 167 170 174 177 178 180 182
Undistributed result from previous years -116 -274 -274 -274 -46 10 10
Current year profit/loss 45 128 170 228 68 152 222
Non-controlling interests 0 0 0 0 2 2 2
TOTAL LIABILITIES AND EQUITY 20 875 22 823 23 269 25 550 26 518 27 124 29 156
* Subordinated liabilities in the amount of PLN 382 M are taken into account as far as the CAR calculation as of Q3’14 is concerned.
34
• 1,3 m shares with lock-upexpiring Dec 2014
• 1,3 m shares with lock-upexpiring Dec 2014
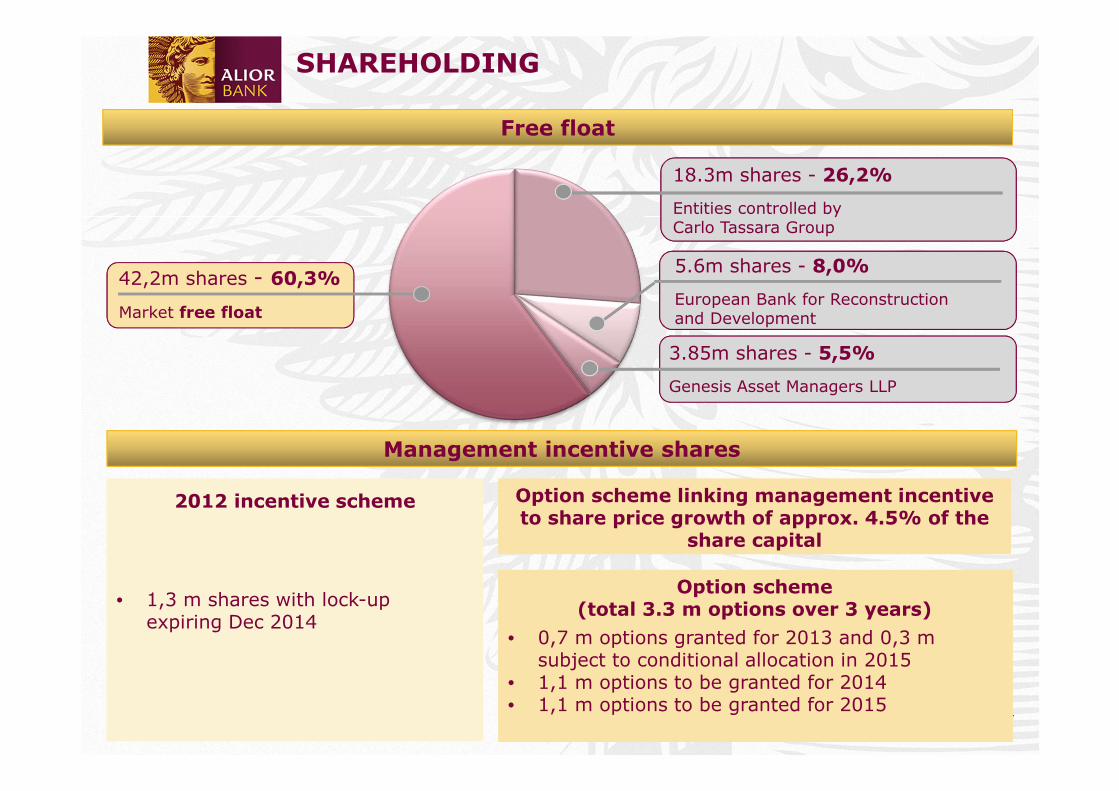
SHAREHOLDING
Free float
Management incentive shares
18.3m shares - 26,2%
Entities controlled byCarlo Tassara Group
42,2m shares - 60,3%
Market free float
5.6m shares - 8,0%
European Bank for Reconstructionand Development
2012 incentive scheme
• 0,7 m options granted for 2013 and 0,3 m subject to conditional allocation in 2015
• 1,1 m options to be granted for 2014• 1,1 m options to be granted for 2015
• 0,7 m options granted for 2013 and 0,3 m subject to conditional allocation in 2015
• 1,1 m options to be granted for 2014• 1,1 m options to be granted for 2015
Option scheme (total 3.3 m options over 3 years)
3.85m shares - 5,5%
Genesis Asset Managers LLP
Option scheme linking management incentive to share price growth of approx. 4.5% of the
share capital
Option scheme linking management incentive to share price growth of approx. 4.5% of the
share capital
35
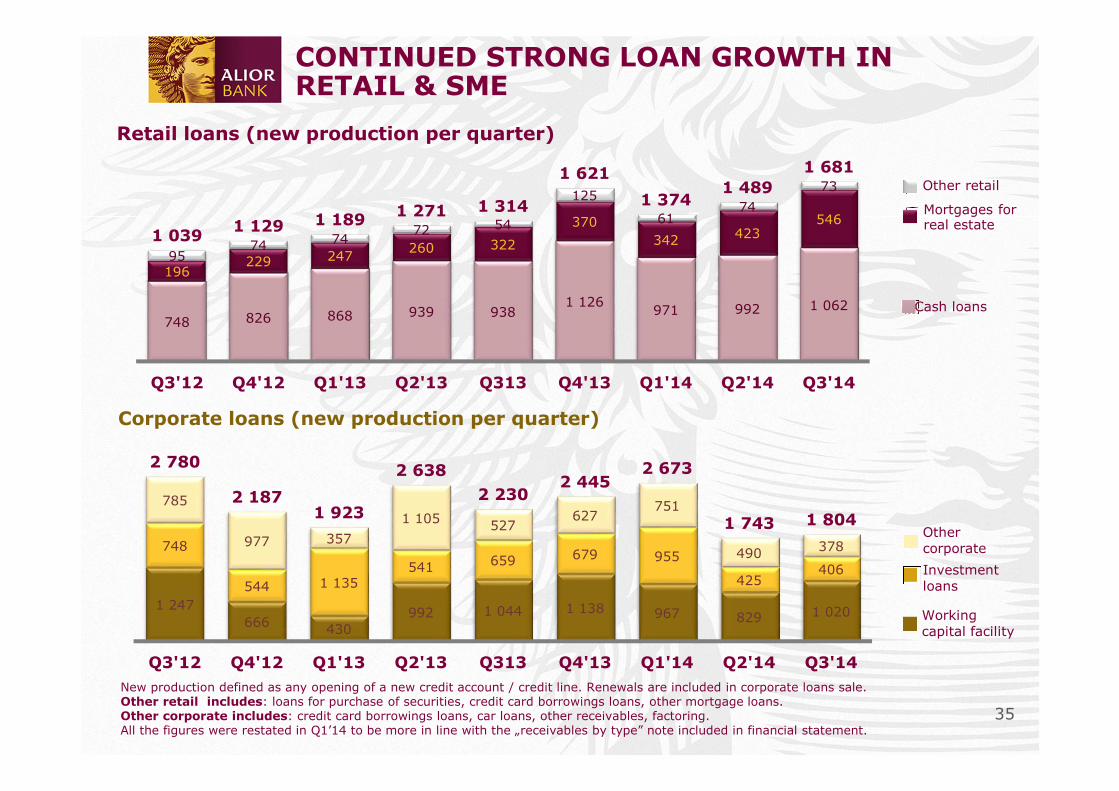
CONTINUED STRONG LOAN GROWTH IN RETAIL & SME
Retail loans (new production per quarter)
New production defined as any opening of a new credit account / credit line. Renewals are included in corporate loans sale.Other retail includes: loans for purchase of securities, credit card borrowings loans, other mortgage loans.Other corporate includes: credit card borrowings loans, car loans, other receivables, factoring.All the figures were restated in Q1’14 to be more in line with the „receivables by type” note included in financial statement.
Corporate loans (new production per quarter)
Other retail
Mortgages forreal estate
Cash loans
Othercorporate
Investmentloans
Workingcapital facility
748 826 868 939 9381 126
971 992 1 062
196229 247
260 322
370342 423
546
9574 74
72 54
125
6174
73
1 0391 129 1 189
1 271 1 314
1 621
1 3741 489
1 681
Q3'12 Q4'12 Q1'13 Q2'13 Q313 Q4'13 Q1'14 Q2'14 Q3'14
1 247666 430
992 1 044 1 138 967 829 1 020
748
544 1 135541 659 679 955
425406
785
977 357
1 105 527627
751
490 378
2 780
2 1871 923
2 638
2 2302 445
2 673
1 743 1 804
Q3'12 Q4'12 Q1'13 Q2'13 Q313 Q4'13 Q1'14 Q2'14 Q3'14
36
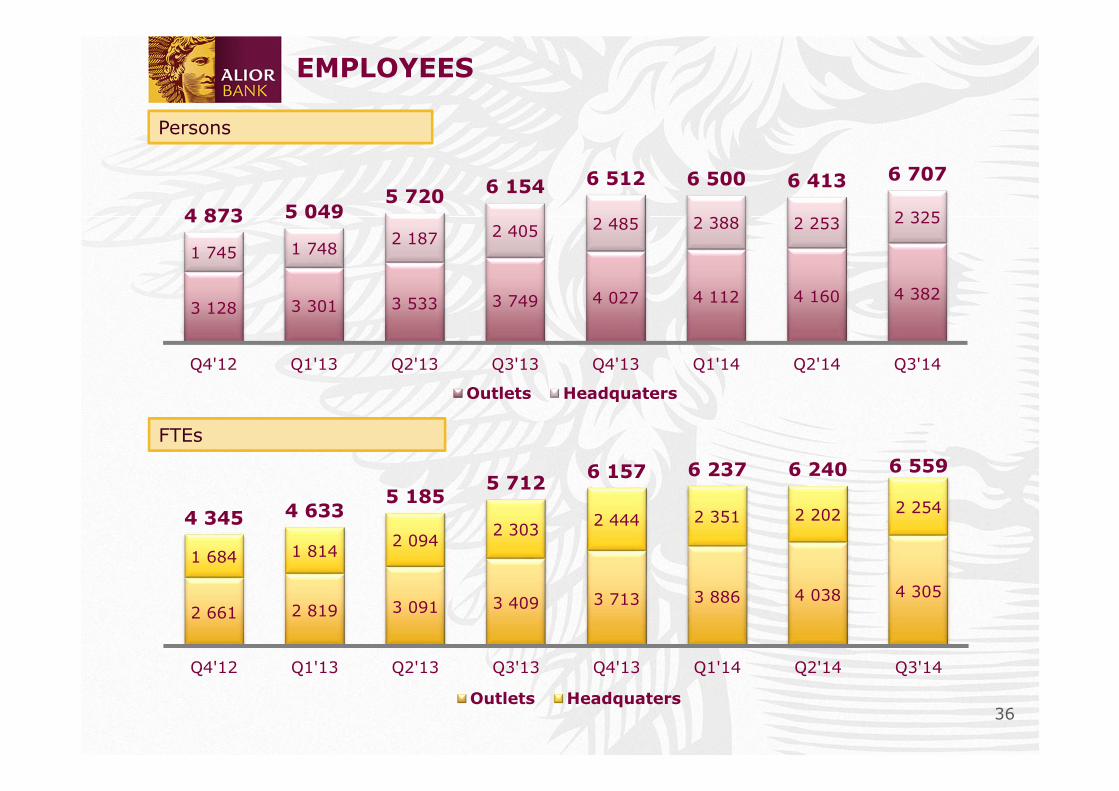
EMPLOYEES
Persons
FTEs
3 128 3 301 3 533 3 749 4 027 4 112 4 160 4 382
1 745 1 7482 187 2 405 2 485 2 388 2 253 2 3254 873 5 0495 720
6 154 6 512 6 500 6 413 6 707
Q4'12 Q1'13 Q2'13 Q3'13 Q4'13 Q1'14 Q2'14 Q3'14
Outlets Headquaters
2 661 2 819 3 091 3 409 3 713 3 886 4 038 4 305
1 684 1 8142 094
2 3032 444 2 351 2 202 2 254
4 345 4 6335 185
5 7126 157 6 237 6 240 6 559
Q4'12 Q1'13 Q2'13 Q3'13 Q4'13 Q1'14 Q2'14 Q3'14
Outlets Headquaters
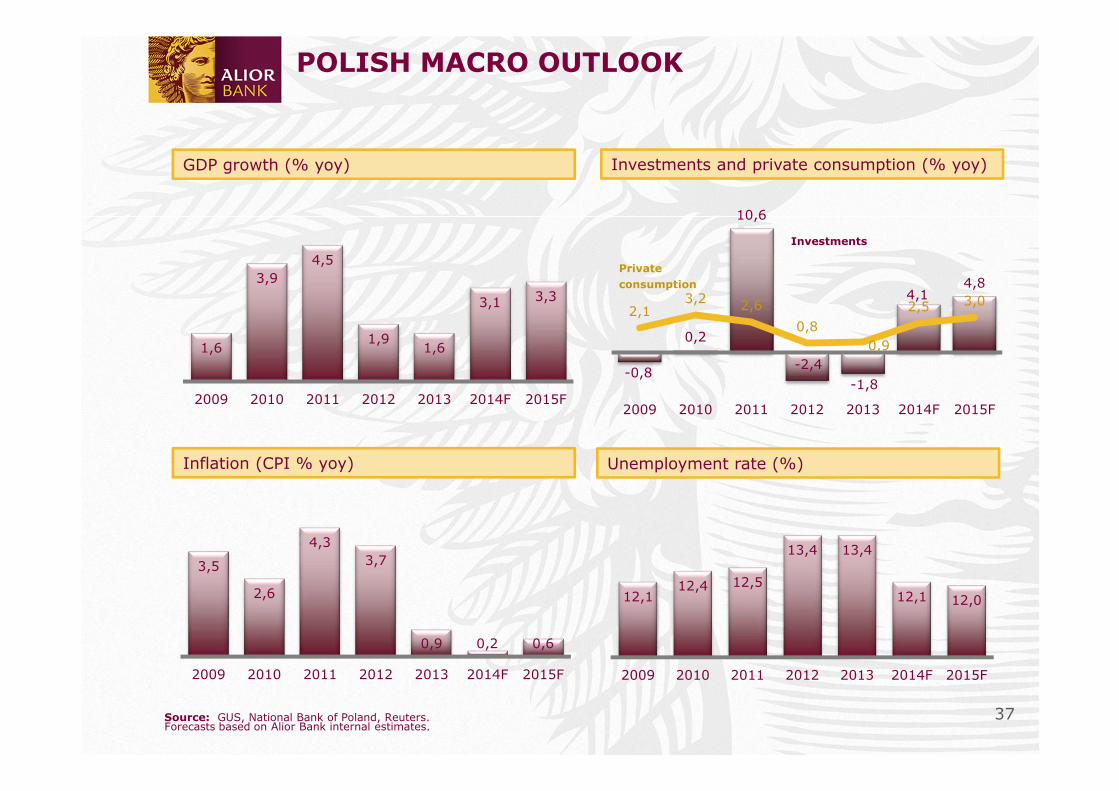
37Source: GUS, National Bank of Poland, Reuters. Forecasts based on Alior Bank internal estimates.
Investments
Private
consumption
POLISH MACRO OUTLOOK
GDP growth (% yoy) Investments and private consumption (% yoy)
Inflation (CPI % yoy) Unemployment rate (%)
1,6
3,94,5
1,91,6
3,1 3,3
2009 2010 2011 2012 2013 2014F 2015F
3,5
2,6
4,33,7
0,9 0,2 0,6
2009 2010 2011 2012 2013 2014F 2015F
12,112,4 12,5
13,4 13,4
12,1 12,0
2009 2010 2011 2012 2013 2014F 2015F
-0,8
0,2
10,6
-2,4
-1,8
4,14,8
2,13,2 2,6
0,80,9
2,5 3,0
2009 2010 2011 2012 2013 2014F 2015F
38
Public deficit
Public debt
End of period End of period
End of periodEnd of period
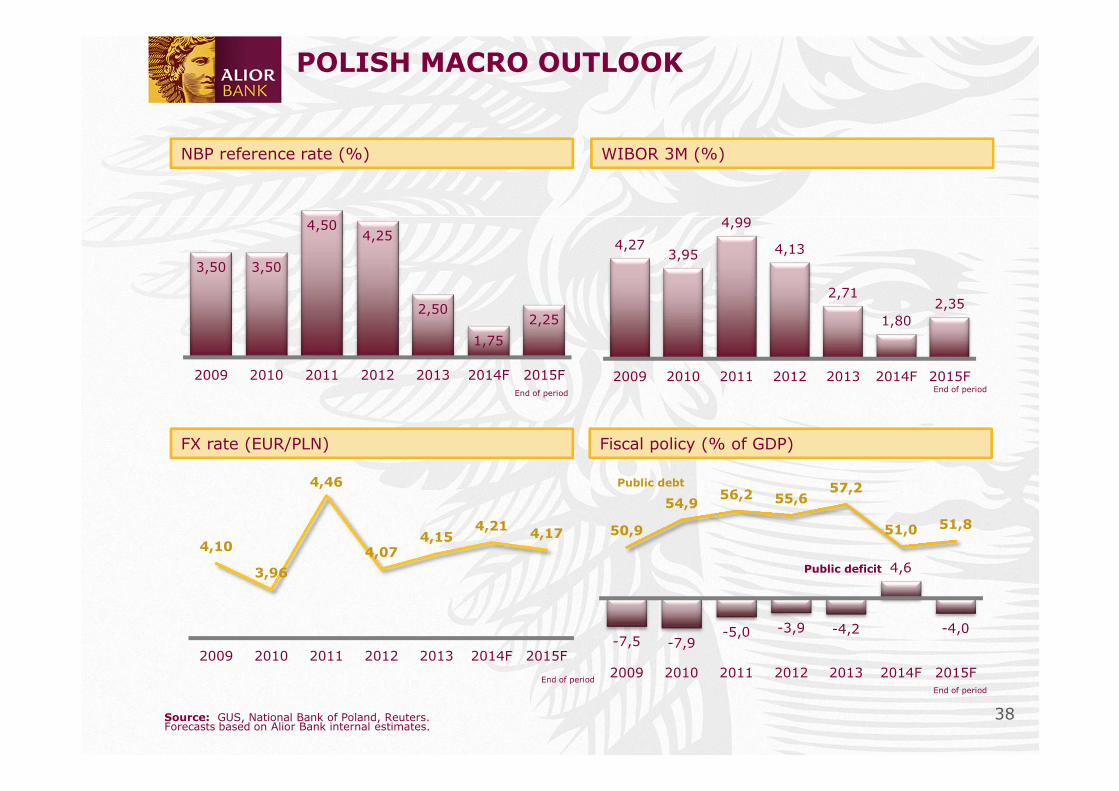
POLISH MACRO OUTLOOK
NBP reference rate (%) WIBOR 3M (%)
FX rate (EUR/PLN) Fiscal policy (% of GDP)
Source: GUS, National Bank of Poland, Reuters. Forecasts based on Alior Bank internal estimates.
3,50 3,50
4,504,25
2,50
1,75
2,25
2009 2010 2011 2012 2013 2014F 2015F
4,273,95
4,99
4,13
2,71
1,802,35
2009 2010 2011 2012 2013 2014F 2015F
4,10
3,96
4,46
4,074,15
4,214,17
2009 2010 2011 2012 2013 2014F 2015F-7,5 -7,9
-5,0 -3,9 -4,2
4,6
-4,0
50,9
54,956,2 55,6
57,2
51,0 51,8
35
40
45
50
55
60
-15
-10
-5
0
5
10
15
20
25
30
2009 2010 2011 2012 2013 2014F 2015F
39
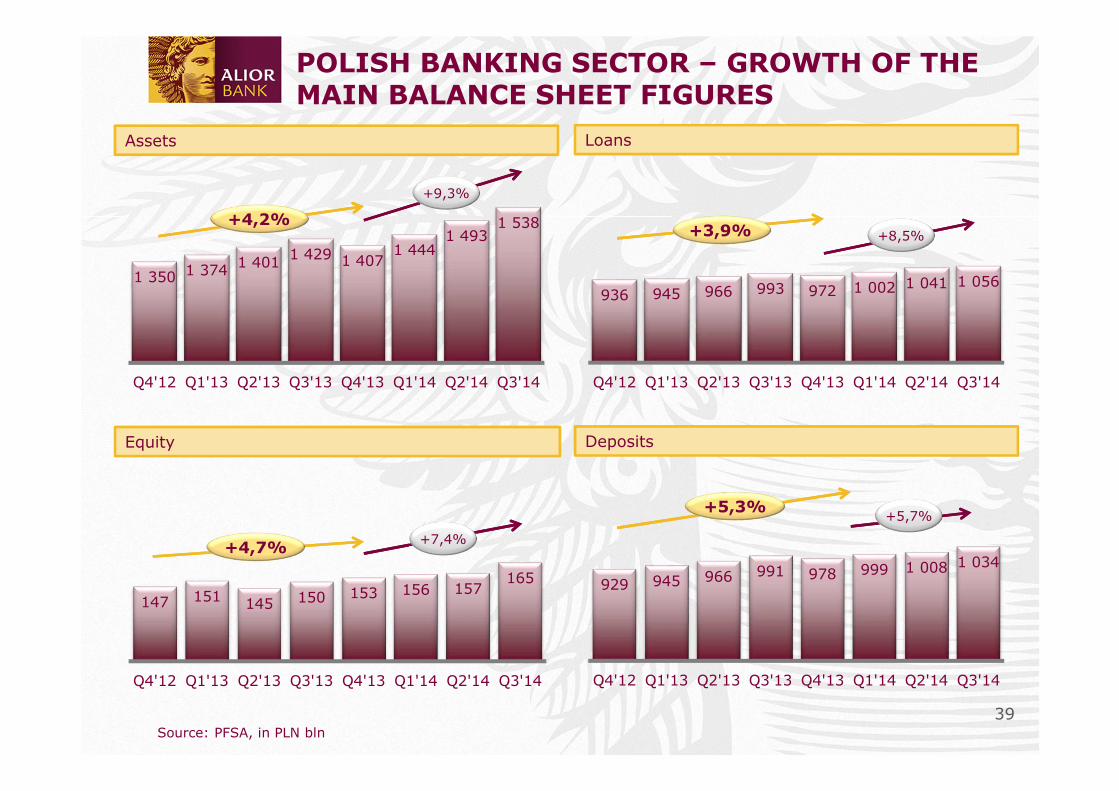
147 151 145 150 153 156 157165
Q4'12 Q1'13 Q2'13 Q3'13 Q4'13 Q1'14 Q2'14 Q3'14
936 945 966 993 972 1 002 1 041 1 056
Q4'12 Q1'13 Q2'13 Q3'13 Q4'13 Q1'14 Q2'14 Q3'14
1 350 1 374 1 401 1 429 1 4071 444
1 4931 538
Q4'12 Q1'13 Q2'13 Q3'13 Q4'13 Q1'14 Q2'14 Q3'14
POLISH BANKING SECTOR – GROWTH OF THE MAIN BALANCE SHEET FIGURES
Assets Loans
Equity Deposits
+4,2%+3,9%
+4,7%
+5,3%
+9,3%
+8,5%
+7,4%
+5,7%
Source: PFSA, in PLN bln
929 945 966 991 978 999 1 008 1 034
Q4'12 Q1'13 Q2'13 Q3'13 Q4'13 Q1'14 Q2'14 Q3'14
40
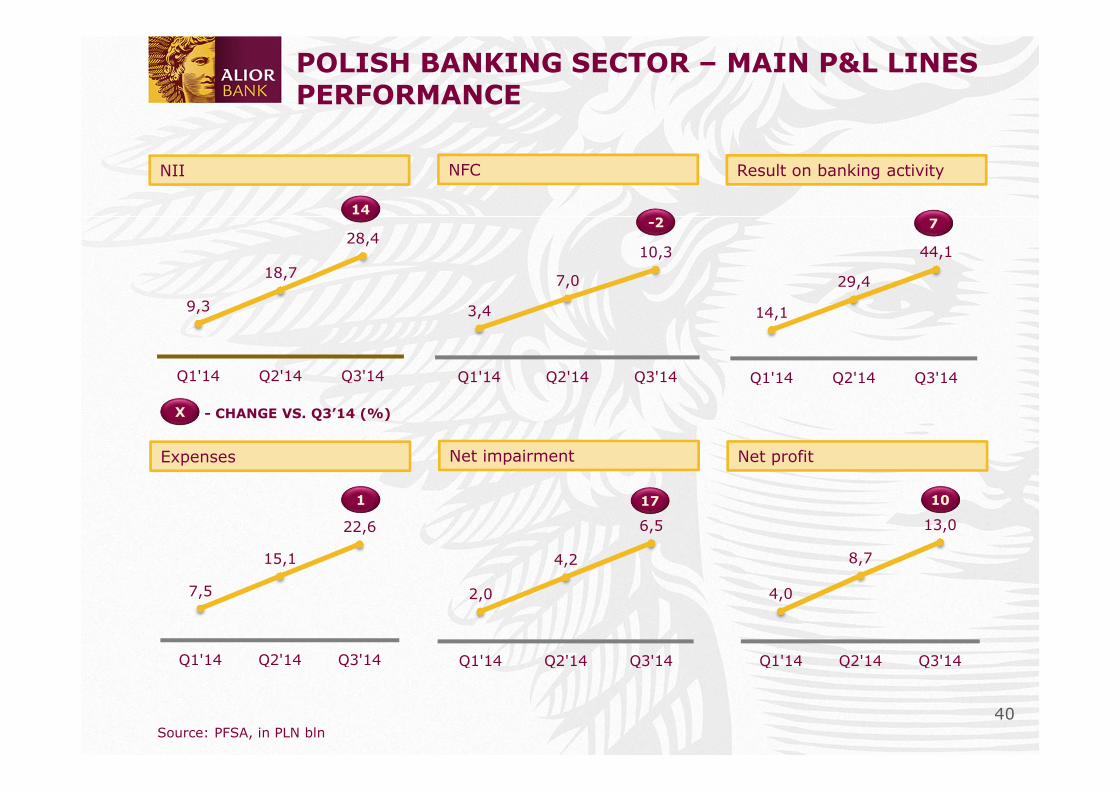
POLISH BANKING SECTOR – MAIN P&L LINES PERFORMANCE
NII NFC Result on banking activity
Expenses Net impairment Net profit
Source: PFSA, in PLN bln
9,3
18,7
28,4
Q1'14 Q2'14 Q3'14
3,4
7,0
10,3
Q1'14 Q2'14 Q3'14
14,1
29,4
44,1
Q1'14 Q2'14 Q3'14
7,5
15,1
22,6
Q1'14 Q2'14 Q3'14
2,0
4,2
6,5
Q1'14 Q2'14 Q3'14
4,0
8,7
13,0
Q1'14 Q2'14 Q3'14
- CHANGE VS. Q3’14 (%)X
14-2 7
1 17 10
41
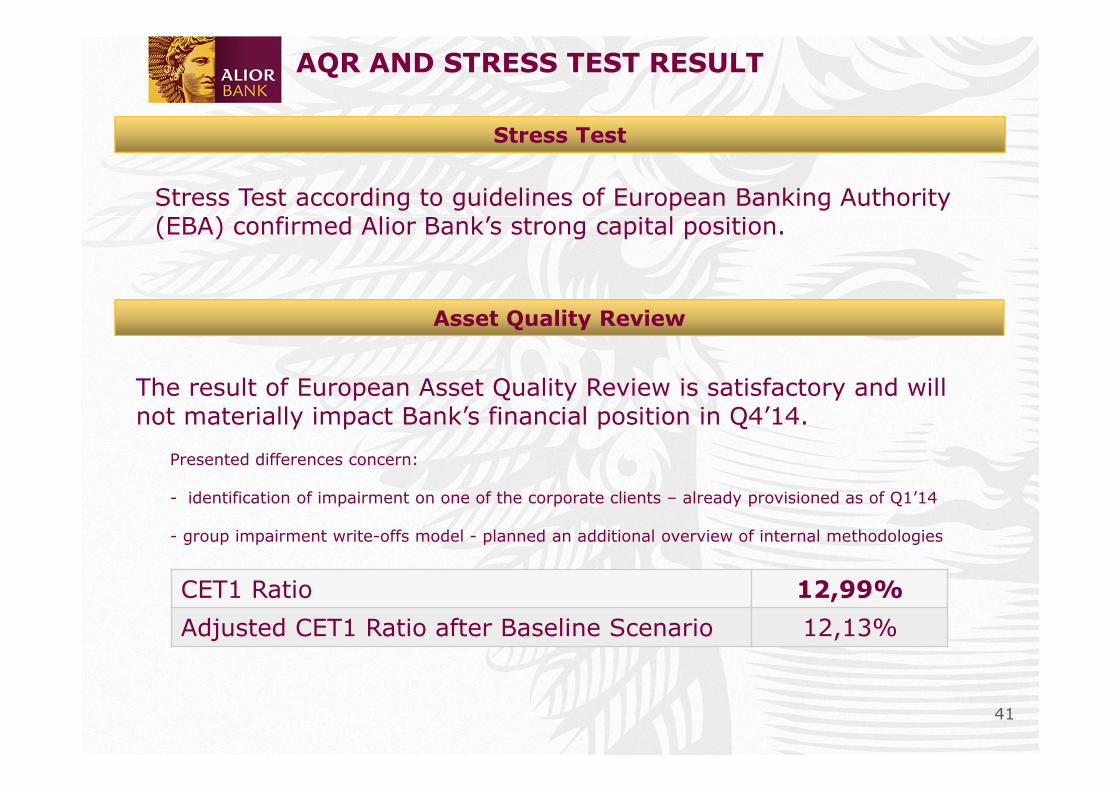
AQR AND STRESS TEST RESULT
Stress Test according to guidelines of European Banking Authority (EBA) confirmed Alior Bank’s strong capital position.
Asset Quality Review
The result of European Asset Quality Review is satisfactory and will not materially impact Bank’s financial position in Q4’14.
Stress Test
CET1 Ratio 12,99%
Adjusted CET1 Ratio after Baseline Scenario 12,13%
Presented differences concern:
- identification of impairment on one of the corporate clients – already provisioned as of Q1’14
- group impairment write-offs model - planned an additional overview of internal methodologies
42
CONTACT DETAILS
Please direct all inquiries to:
+48 22 417 3860
IR unit head: Piotr Bystrzanowski
43
DISCLAIMER
This document has been prepared by Alior Bank S.A. (the “Bank”) solely for use atthe Presentation. Any forward looking statements concerning future economic andfinancial performance of the Company contained in this Presentation are based onFinancial Statement of the Bank for Q3 2014.Bank does not accept any responsibility for using any such information.
The distribution of this document in certain jurisdictions may be restricted by law.This document may not be used for, or in connection with, and does not constitute,any offer to sell, or an invitation to purchase, any securities or other financialinstruments of the Bank in any jurisdiction in which such offer or invitation wouldbe unlawful. Persons in possession of this document are required to informthemselves about and to observe any such restrictions. Any failure to comply withthese restrictions may constitute a violation of the securities laws of any suchjurisdiction.
Information given in this presentation should not be considered as an explicit orimplicit statement or the provision of any type submitted by the Bank or personsacting on behalf of the Bank.
Furthermore, neither the Bank nor persons acting on behalf of the Bank are underany terms of liability for any damage, which may arise, as a result of negligence orother reasons, in connection with the use of this Presentation or any informationcontained therein, nor for injury, which may arise in another way in connection withthe information forming part of this Presentation.