Embed Size (px)
Citation preview
ARKANSAS EDUCATION REPORTVolume 6, Issue 2
OUTSTANDING EDUCATIONAL PERFORMANCE AWARDS: HIGHLIGHTING TOP ACHIEVING ARKANSAS SCHOOLS, 2009
By:
Bentley R. Kirkland Caleb P. Rose James V. Shuls
Nathan C. Jensen Gary W. Ritter
August 26, 2009(Updated: October 30, 2009)
Office for Education Policy University of Arkansas
211 Graduate Education Building Fayetteville, AR 72701 Phone: (479) 575‐3773 Fax: (479) 575‐3196
E‐mail: [email protected]

Outstanding Educational Performance Awards Page 1
TABLE OF CONTENTS
Introduction ................................................................................................................................................. 3
I. OEP Awards: Top “Overall” Schools in Arkansas based on Performance on the Benchmark ....... 4
A. Benchmark Scores in Mathematics, 2009 ........................................................................................... 4
B. Benchmark Scores in Literacy, 2009 .................................................................................................. 6
C. Benchmark Scores Combined (Math and Literacy), 2009 .................................................................. 8
II. OEP Awards: Beating the Odds – Top Schools Serving Low-Income Students ............................ 10
A. Benchmark Scores in Mathematics, 2009 ......................................................................................... 10
B. Benchmark Scores in Literacy, 2009 ................................................................................................ 13
III. OEP Awards: Top Elementary Schools By Region ......................................................................... 16
A. Northwest Region, 2009 ................................................................................................................... 16
B. Northeast Region, 2009 ..................................................................................................................... 18
C. Central Region, 2009 ........................................................................................................................ 20
D. Southwest Region, 2009 ................................................................................................................... 22
E. Southeast Region, 2009 ..................................................................................................................... 24
IV. OEP Awards: Top Middle Schools by Region ................................................................................. 26
A. Northwest Region, 2009 ................................................................................................................... 26
B. Northeast Region, 2009 ..................................................................................................................... 28
C. Central Region, 2009 ........................................................................................................................ 30
D. Southwest Region, 2009 ................................................................................................................... 32
E. Southeast Region, 2009 ..................................................................................................................... 34
V. OEP Awards: Top High Schools Across Arkansas ........................................................................... 37
A. Algebra End-of-Course Exam, 2009 ................................................................................................. 37
B. Geometry End-of-Course Exam, 2009 .............................................................................................. 42
C. Biology End-of-Course Exam, 2009 ................................................................................................. 47
D. Grade 11 Literacy Exam, 2009 ......................................................................................................... 50
E. EOC Summary .................................................................................................................................. 53
VI. OEP Awards: Most Improved Schools between 2008 and 2009 ..................................................... 54
Outstanding Educational Performance Awards Page 2
Appendix .................................................................................................................................................... 55
A. Methods ............................................................................................................................................ 55
B. Compete School List ......................................................................................................................... 56
Outstanding Educational Performance Awards Page 3
INTRODUCTION
Since our founding in 2003, the mission of the Office for Education Policy has been to look at pressing issues through the lens of academic research and disseminate our findings to educators, policymakers, and other stakeholders around Arkansas. Every once in a while, however, we think it is okay to stray from issue analysis and simply share some good news! So, in this Arkansas Education Report (AER) we merely aim to highlight excellent performance and give our congratulations. To that end, we are happy to highlight the top performing schools around the state in an annual AER entitled the Outstanding Educational Performance Awards.
Over a three month period, the OEP Awards will highlight the top performing schools in Arkansas on the Benchmark exam in math and literacy, and End-Of-Course (EOC) exams in Algebra, Geometry, Literacy (Grade 11), and Biology. This report will begin by featuring the top performing elementary and middle schools on Benchmark performance in literacy, math, and combined test score performance.
After we present our overall snapshot of top performing schools, we will release subsequent reports every two weeks focusing on a different subset of schools. In section two of the OEP Awards AER, we will feature schools that are beating the odds (that is, schools that have high percentages of proficient and advanced scores on the Benchmark exam while serving a high percentage of low-income students). In the following weeks, we will focus on top performing elementary schools, middle schools, and high schools in the various regions across the state. Finally, we will conclude our report by focusing on the schools with the greatest improvement in test scores between 2008 and 2009. Our release schedule is:
Top “Overall” Schools in Arkansas (August 26, 2009) Beating the Odds – Top Schools Serving Low Income Students (September 16, 2009) Top Elementary Schools by Region (September 30, 2009) Top Middle Schools by Region (October 14, 2009) Top High Schools Across Arkansas (October 28, 2009) Most Improved Schools between 2008 and 2009 (November 11, 2009)
Stay tuned over the next six weeks to see which schools in your area are recognized for our OEP Award!
Outstanding Educational Performance Awards Page 4
I. OEP AWARDS: TOP “OVERALL” SCHOOLS IN ARKANSAS BASED ON
PERFORMANCE ON THE BENCHMARK
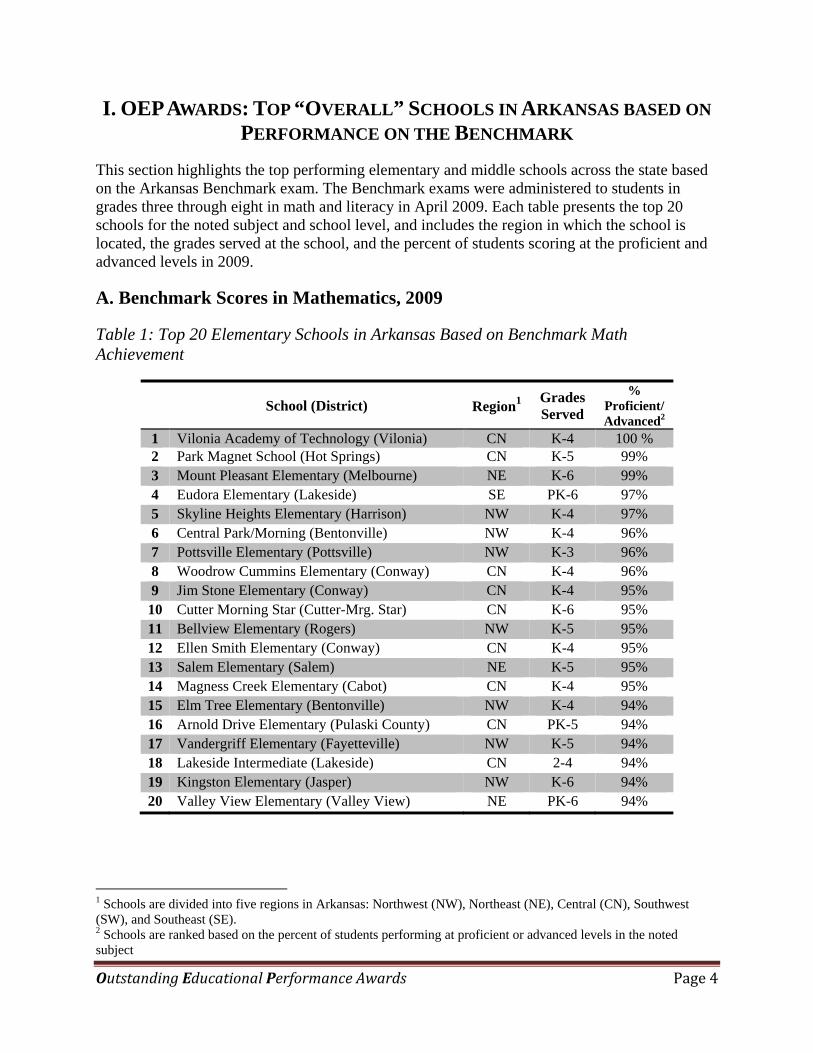
This section highlights the top performing elementary and middle schools across the state based on the Arkansas Benchmark exam. The Benchmark exams were administered to students in grades three through eight in math and literacy in April 2009. Each table presents the top 20 schools for the noted subject and school level, and includes the region in which the school is located, the grades served at the school, and the percent of students scoring at the proficient and advanced levels in 2009.
A. Benchmark Scores in Mathematics, 2009
Table 1: Top 20 Elementary Schools in Arkansas Based on Benchmark Math Achievement
School (District) Region1
Grades Served
% Proficient/Advanced2
1 Vilonia Academy of Technology (Vilonia) CN K-4 100 % 2 Park Magnet School (Hot Springs) CN K-5 99% 3 Mount Pleasant Elementary (Melbourne) NE K-6 99% 4 Eudora Elementary (Lakeside) SE PK-6 97% 5 Skyline Heights Elementary (Harrison) NW K-4 97% 6 Central Park/Morning (Bentonville) NW K-4 96% 7 Pottsville Elementary (Pottsville) NW K-3 96% 8 Woodrow Cummins Elementary (Conway) CN K-4 96% 9 Jim Stone Elementary (Conway) CN K-4 95% 10 Cutter Morning Star (Cutter-Mrg. Star) CN K-6 95% 11 Bellview Elementary (Rogers) NW K-5 95% 12 Ellen Smith Elementary (Conway) CN K-4 95% 13 Salem Elementary (Salem) NE K-5 95% 14 Magness Creek Elementary (Cabot) CN K-4 95% 15 Elm Tree Elementary (Bentonville) NW K-4 94% 16 Arnold Drive Elementary (Pulaski County) CN PK-5 94% 17 Vandergriff Elementary (Fayetteville) NW K-5 94% 18 Lakeside Intermediate (Lakeside) CN 2-4 94% 19 Kingston Elementary (Jasper) NW K-6 94% 20 Valley View Elementary (Valley View) NE PK-6 94%
1 Schools are divided into five regions in Arkansas: Northwest (NW), Northeast (NE), Central (CN), Southwest (SW), and Southeast (SE). 2 Schools are ranked based on the percent of students performing at proficient or advanced levels in the noted subject

Outstanding Educational Performance Awards Page 5
Table 2: Top 20 Middle Schools in Arkansas Based on Benchmark Math Achievement
School (District) Region Grades Served
% Proficient/Advanced
1 Vilonia Academy of Service Learning and Technology (Vilonia)
CN 5-6 96 %
2 Umpire High School (Wickes) SW 7-12 93% 3 Ruth Hale Barker Middle (Bentonville) NW 5-6 90% 4 Ruth Doyle Intermediate (Conway) CN 5-6 90% 5 Old High Middle (Bentonville) NW 5-6 90% 6 Pea Ridge Middle (Pea Ridge) NW 7-9 90% 7 East Hills Middle (Greenwood) NW 5-7 90% 8 McNair Middle (Fayetteville) NW 6-7 89% 9 Spring Hill Middle (Bentonville) NW 5-6 89% 10 Lisa Middle (Lisa Academy) CN 6-8 89% 11 Greenbrier Middle (Greenbrier) CN 5-7 88% 12 Parkers Chapel High (Parkers Chapel) SW 7-12 87 % 13 Harrison Middle (Harrison) NW 5-6 87% 14 Mountain View Middle (Mountain View) NE 6-8 86% 15 Cabot Middle School South (Cabot) CN 5-6 86% 16 Swifton Middle (Jackson County) NE 5-7 86% 17 Southwest Middle (Searcy) NE 5-6 86% 18 Kraus Middle (Clarksville) NW 5-6 86% 19 Lakeside Middle (Lakeside) CN 5-7 85% 20 Washington Jr. High (Bentonville) NW 7-8 85%
In addition to the 40 schools recognized here, there were numerous schools that nearly made the list in mathematics. In fact, 60 elementary schools and 39 middle schools were within five percentage points of the 20th school. Additionally, 324 out of the 508 elementary schools and 113 out of 362 middle schools had at least 75% of students score proficient and advanced.
It is worth noting that many of the schools in the top 20 serve relatively advantaged student populations. To illustrate, while roughly 56% of that state’s students are eligible for free/reduced lunch (FRL), around 30% of the students on the top mathematics lists are eligible for FRL. Along those lines, the schools on the list do tend to be clustered in the state’s more affluent regions. Nonetheless, there are schools serving concentrations of disadvantaged students that are beating the odds and deserve special recognition for their placement on the list. Two schools, Eudora Elementary of the Lakeside School District and Umpire High School of the Wickes School District, each have 100% of students eligible for free and reduced lunch.

Outstanding Educational Performance Awards Page 6
B. Benchmark Scores in Literacy, 2009
Table 3: Top 20 Elementary Schools in Arkansas Based on Benchmark Literacy Achievement
School (District) Region
Grades Served
% Proficient/Advanced
1 Park Magnet School (Hot Springs) CN K-5 97% 2 Vilonia Academy of Technology (Vilonia) CN K-4 94% 3 Mount Pleasant Elementary (Melbourne) NE K-6 94% 4 Bellview Elementary (Rogers) NW K-5 93% 5 Arnold Drive Elementary (Pulaski County) CN PK-5 92% 6 Vandergriff Elementary (Fayetteville) NW K-5 91% 7 Jim Stone Elementary (Conway) CN K-4 90% 8 Ellen Smith Elementary (Conway) CN K-4 90% 9 Valley View Elementary (Valley View) NE PK-6 90% 10 Spring Hill Elementary (Spring Hill) SW K-6 89% 11 Elm Tree Elementary (Bentonville) NW K-4 88% 12 Caldwell Elementary (Benton) CN K-5 88% 13 Richland Elementary (West Memphis) NE K-6 87% 14 Salem Elementary (Bryant) CN K-5 87% 15 Magness Creek Elementary (Cabot) CN K-4 87% 16 Westside Elementary (Searcy) NE K-4 87% 17 Pottsville Elementary (Pottsville) NW K-3 87% 18 Bergman Elementary (Bergman) NW K-4 86% 19 London Elementary (Russellville) NW K-4 86% 20 Hector Elementary (Hector) NW K-6 86%

Outstanding Educational Performance Awards Page 7
Table 4: Top 20 Middle Schools in Arkansas Based on Benchmark Literacy Achievement
School (District) Region
Grades Served
% Proficient/Advanced
1 Umpire High School (Wickes) SW 7-12 93% 2 Lisa Middle (Lisa Academy) CN 6-8 93%
3 Vilonia Academy of Service Learning and Technology (Vilonia) CN 5-6 92%
4 Woodland Jr. High (Fayetteville) NW 8-9 90% 5 Valley View High (Valley View) NE 7-12 88% 6 Southwest Middle (Searcy) NE 5-6 88% 7 Viola High School (Viola) NE 7-12 87% 8 Harrison Middle (Harrison) NW 5-6 86% 9 Washington Jr. High (Bentonville) NW 7-8 86% 10 McNair Middle (Fayetteville) NW 6-7 86% 11 West Side High (West Side) NE 7-12 85% 12 Ahlf Jr. High (Searcy) NE 7-8 85% 13 Pea Ridge Middle (Pea Ridge) NW 7-9 85% 14 Valley Springs Middle (Valley Springs) NW 5-8 85% 15 Lakeside Jr. High (Lakeside) CN 8-9 85% 16 Ruth Doyle Intermediate (Conway) CN 5-6 84% 17 Mountain Home Jr. High (Mountain Home) NW 8-9 84% 18 Vilonia Jr. High (Vilonia) CN 8-9 84% 19 Calico Rock High (Calico Rock) NE 7-12 84% 20 East Hills Middle (Greenwood) NW 5-7 83%
As was the case in math, there were numerous schools that nearly made these lists as well. In fact, 63 elementary schools and 43 middle schools were within five percentage points of the 20th school. Additionally, 177 out of the 508 elementary schools and 107 out of 362 middle schools had at least 75% of students score proficient and advanced.
Again, it is also worth noting that many of the schools in the top 20 serve relatively advantaged student populations. While roughly 56% of that state’s students are eligible for free/reduced lunch (FRL), around 30% of the students on the top literacy lists are eligible for FRL. Along those lines, the schools on this list do tend to be clustered in the state’s more affluent regions. Nonetheless, several schools serving concentrations of disadvantaged students are beating the odds and deserve special recognition for their placement on the list. Two schools, Richland Elementary of the West Memphis School District and Umpire High School of the Wickes School District, each have 100% of students eligible for free and reduced lunch.

Outstanding Educational Performance Awards Page 8
C. Benchmark Scores Combined (Math and Literacy), 2009
Table 5: Top 20 Elementary Schools in Arkansas Based on Benchmark Math and Literacy Achievement
School (District) Region
Grades Served
% Proficient/Advanced
1 Park Magnet (Hot Springs) CN K-5 98% 2 Vilonia Academy of Technology (Vilonia) CN K-4 97% 3 Mount Pleasant Elementary (Melbourne) NE K-6 97% 4 Bellview Elementary (Rogers) NW K-5 94% 5 Arnold Drive Elementary (Pulaski County) CN PK-5 93% 6 Jim Stone Elementary (Conway) CN K-4 93% 7 Vandergriff Elementary (Fayetteville) NW K-5 93% 8 Ellen Smith Elementary (Conway) CN K-4 93% 9 Valley View Elementary (Valley View) NE PK-6 92% 10 Pottsville Elementary (Pottsville) NW K-3 92% 11 Elm Tree Elementary (Bentonville) NW K-4 91% 12 Central Park/Morning (Bentonville) NW K-4 91% 13 Magness Creek Elementary (Cabot) CN K-4 91% 14 Skyline Heights Elementary (Harrison) NW K-4 91% 15 Richland Elementary (West Memphis) NE K-6 90% 16 Caldwell Elementary (Benton) CN K-5 90% 17 Woodrow Cummins Elementary (Conway) CN K-4 90% 18 Salem Elementary (Bryant) CN K-5 90% 19 Lakeside Intermediate (Lakeside) CN 2-4 90% 20 Westside Elementary (Searcy) NE K-4 90%

Outstanding Educational Performance Awards Page 9
Table 6: Top 20 Middle Schools in Arkansas Based on Math and Literacy Achievement
School (District) Region
Grades Served
% Proficient/Advanced
1 Vilonia Academy of Service Learning and Technology (Vilonia) CN 5-6 94%
2 Umpire High (Wickes) SW 7-12 93% 3 Lisa Middle (Lisa Academy) CN 6-8 91% 4 Pea Ridge Middle (Pea Ridge) NW 7-9 87% 5 McNair Middle (Fayetteville) NW 6-7 87% 6 Ruth Doyle Intermediate (Conway) CN 5-6 87% 7 Southwest Middle (Searcy) NE 5-6 87% 8 East Hills Middle (Greenwood) NW 5-7 87% 9 Woodland Jr. High (Fayetteville) NW 8-9 87% 10 Ruth Hale Barker Middle (Bentonville) NW 5-6 86% 11 Harrison Middle (Harrison) NW 5-6 86% 12 Old High Middle (Bentonville) NW 5-6 86% 13 Washington Jr. High (Bentonville) NW 7-8 85% 14 Spring Hill Middle (Bentonville) NW 5-6 85% 15 Valley View High (Valley View) NE 7-12 85% 16 Valley Springs Middle (Valley Springs) NW 5-8 84% 17 Cabot Middle South (Cabot) CN 5-6 84% 18 Cabot Middle North (Cabot) CN 5-6 84% 19 Mountain View Middle (Mountain View) NE 6-8 83% 20 Lakeside Middle (Lakeside) CN 6-8 83%
In addition to the 40 schools recognized here, several schools nearly made the list in both math and literacy. In fact, 52 elementary schools and 36 middle schools were within five percentage points of the 20th school. Additionally, 252 out of the 508 elementary schools and 106 out of 362 middle schools had at least 75% of students score proficient and advanced.
As was the case in math and literacy, many of the schools in the top 20 serve relatively advantaged student populations. Roughly 56% of that state’s students are eligible for free/reduced lunch (FRL), while around 30% of the students on the top combined lists are eligible for FRL. Again, these schools do tend to be clustered in the state’s more affluent regions. Nonetheless, there are schools serving concentrations of disadvantaged students that are beating the odds and deserve special recognition for their placement on the list. All of the students at Richland Elementary of the West Memphis School District and Umpire High School of the Wickes School District are eligible for FRL. To highlight similar schools, the next section will focus on high-performing schools that serve a large population of low-income students.

Outstanding Educational Performance Awards Page 10
II. OEP AWARDS: BEATING THE ODDS – TOP SCHOOLS SERVING
LOW-INCOME STUDENTS
This section highlights the top performing “high-poverty” elementary and middle schools across the state based on the Arkansas Benchmark exam. The Benchmark exams were administered to students in grades three through eight in math and literacy in April 2009. For the purpose of this report, a school is classified as high-poverty if at least two-thirds (66%) of the students were eligible for the Free or Reduced Lunch (FRL) program in the 2008-09 year. Each table presents the top 20 high-poverty schools for the noted subject and school level and includes the percent of students eligible for FRL, the region in which the school is located, the grades served at the school, and the percent of students scoring at the proficient and advanced levels in 2009.
A. Benchmark Scores in Mathematics, 2009
Table 7: Top 20 Elementary “High-Poverty” Schools in Arkansas Based on Benchmark Math Achievement
School (District)
% FRL Region3
Grades Served
% Proficient/Advanced4
1 Eudora Elementary (Lakeside) 100 SE PK-6 97 2 Kingston Elementary (Jasper) 66 NW K-6 94 3 Woodland Heights Elementary (Harrison) 69 NW K-4 94 4 Richland Elementary (West Memphis) 100 NE K-6 93 5 Eagle Heights Elementary (Harrison) 76 NW K-4 92 6 SC Tucker Elementary (Danville) 77 NW K-5 92 7 Hamburg Lower Elementary (Hamburg) 100 SE PK-3 92 8 Oakland Heights Elementary (Russellville) 75 NW K-4 92 9 Leslie Elementary (Searcy County) 83 NW K-6 91 10 Cowsert Elementary (Clinton) 66 NW K-3 91 11 Tuckerman Elementary (Jackson County) 66 NE K-4 91 12 Bragg Elementary (West Memphis) 100 NE K-6 90 13 Cherokee Elementary (Highland) 66 NE K-4 90 14 Midland Elementary (Midland) 67 NE K-6 90 15 Amanda Gist Elementary (Cotter) 66 NW K-6 89 16 Acorn Elementary (Ouachita River) 74 SW K-6 88 17 Lucilia Wood Elementary (Marvell) 99 SE PK-6 88 18 Cross County Primary (Cross County) 78 NE K-3 88 19 Nemo Vista Elementary (Nemo Vista) 69 NW K-6 88 20 Ola Elementary (Two Rivers) 79 NW K-6 87
3 Schools are divided into five regions in Arkansas: Northwest (NW), Northeast (NE), Central (CN), Southwest (SW), and Southeast (SE). 4 Schools are ranked based on the percent of students performing at proficient or advanced levels in the noted subject

Outstanding Educational Performance Awards Page 11
All schools on this list served a student population where at least two-thirds of the students were eligible for free or reduced priced lunches (FRL). In 2008-09, approximately 40% of the state’s elementary schools (201 of 508) served student populations facing this level of economic disadvantage. While roughly 56% of the state’s students were eligible for FRL, the schools in the top 20 list above served more disadvantaged populations, with 79% of the students in these schools eligible for FRL. Along with these top 20 schools, many other schools are beating the odds. In fact, 89 out of the 201 high-poverty elementary schools in the state had 75% of students score proficient or advanced. Several of these schools are not only among the highest achieving schools serving disadvantaged student populations, but are also among the highest performing schools in the state. Two schools deserve special recognition: Eudora Elementary of the Lakeside School District was fourth out of all elementary schools in overall math scores and Kingston Elementary of the Jasper School District was 19th.
Table 8: Top 20 Middle “High-Poverty” Schools in Arkansas Based on Benchmark Math Achievement
School (District) %
FRL Region
Grades Served
% Proficient/Advanced
1 Umpire High (Wickes) 100 SW 7-12 93 2 Swifton Middle (Jackson County) 70 NE 5-7 86 3 Wilson Intermediate (Malvern) 66 CN 5-6 82 4 Central Elementary (Trumann) 69 NE 5-6 82 5 J.D. Leftwich High (Magazine) 68 NW 6-12 81 6 Green Forest Intermediate (Green Forest) 74 NW 4-7 80 7 Norfork High (Norfork) 67 NW 7-12 79 8 DeQueen Middle (DeQueen) 73 SW 6-9 78 9 Acorn High (Ouchita River) 69 SW 7-12 76
10 Marshall High (Searcy County) 69 NW 7-12 76 11 Caddo Hills High (Caddo Hills) 71 SW 7-12 75 12 West Junior (West Memphis) 100 NE 7-9 74 13 KIPP: Delta College (KIPP Delta College Prep) 87 SE 5-8 74 14 Warren Middle (Warren) 73 SE 6-8 72 15 Central Middle (Van Buren) 67 NW 5-6 70 16 Wickes High (Wickes) 100 SW 7-12 70 17 Sloan-Hendrix Middle (Sloan-Hendrix) 70 NE 5-7 70 18 Hazen Elementary (Hazen) 68 SE PK-8 69 19 Cabe Middle (Gurdon) 72 SW 5-8 68 20 Riverview Jr. High (Riverview) 74 NE 7-8 67
In 2008-09, approximately 30% of the state’s middle schools (98 of 362) served student populations in which at least two-thirds of the students were economically disadvantaged. While roughly 56% of the state’s students are eligible for FRL, the schools in the top 20 list above served more disadvantaged student populations, with 75% of the students in these schools

Outstanding Educational Performance Awards Page 12
eligible for FRL. Along with these top 20 schools, many other schools are beating the odds. In fact, 12 other schools boasted math achievement levels within five percentage points of the 20th school. Several of these schools are not only among the highest achieving schools serving disadvantaged student populations, but are also among the highest performing schools in the state. Two schools deserve special recognition: Umpire High of the Wickes School District was second out of all middle schools in overall math scores and Swifton Middle of the Jackson County School District was 16th.
We have been highlighting these schools based on the school-wide average. However, there are several grade levels within schools that stand out for exceptional performance. The next table will highlight the top grades in the high-poverty schools across the state.
Table 9: Top 3 Grades in “High-Poverty” Schools in Arkansas Based on Benchmark Math Achievement
School (District) %
FRL Region
Grades Served
% Proficient/Advanced
3rd Grade 1 Acorn Elementary (Ouachita River) 74 SW K-6 100 2 Portland Elementary (Hamburg) 100 SE PK-6 100 3 Deer Elementary (Deer/Mt. Judea) 73 NW K-6 100
4th Grade 1 Leslie Elementary (Searcy County) 83 NW K-6 100 2 Richland Elementary (West Memphis) 100 NE K-6 98 3 Wedlock Elementary (West Memphis) 100 NE K-6 95
5th Grade 1 Midland Elementary (Midland) 67 NE K-6 94 2 Leslie Elementary (Searcy County) 83 NW K-6 93 3 Richland Elementary (West Memphis) 100 NE K-6 90
6th Grade 1 Kingston Elementary (Jasper) 66 NW K-6 100 2 Amanda Gist Elementary (Cotter) 66 NW K-6 98 3 Western Yell County Elementary (Western Yell Co.) 75 NW K-6 95
7th Grade 1 KIPP: Delta College (KIPP: Delta College Prep) 87 SE 5-8 94 2 Green Forest Intermediate (Green Forest) 74 NW 4-7 87 3 J.D. Leftwich High (Magazine) 68 NW 6-12 86
8th Grade 1 Umpire High (Wickes) 100 SW 7-12 93 2 Norfork High (Norfork) 67 NW 7-12 86 3 St. Joe High (Ozark Mountain) 73 NW 7-12 77
Outstanding Educational Performance Awards Page 13
B. Benchmark Scores in Literacy, 2009
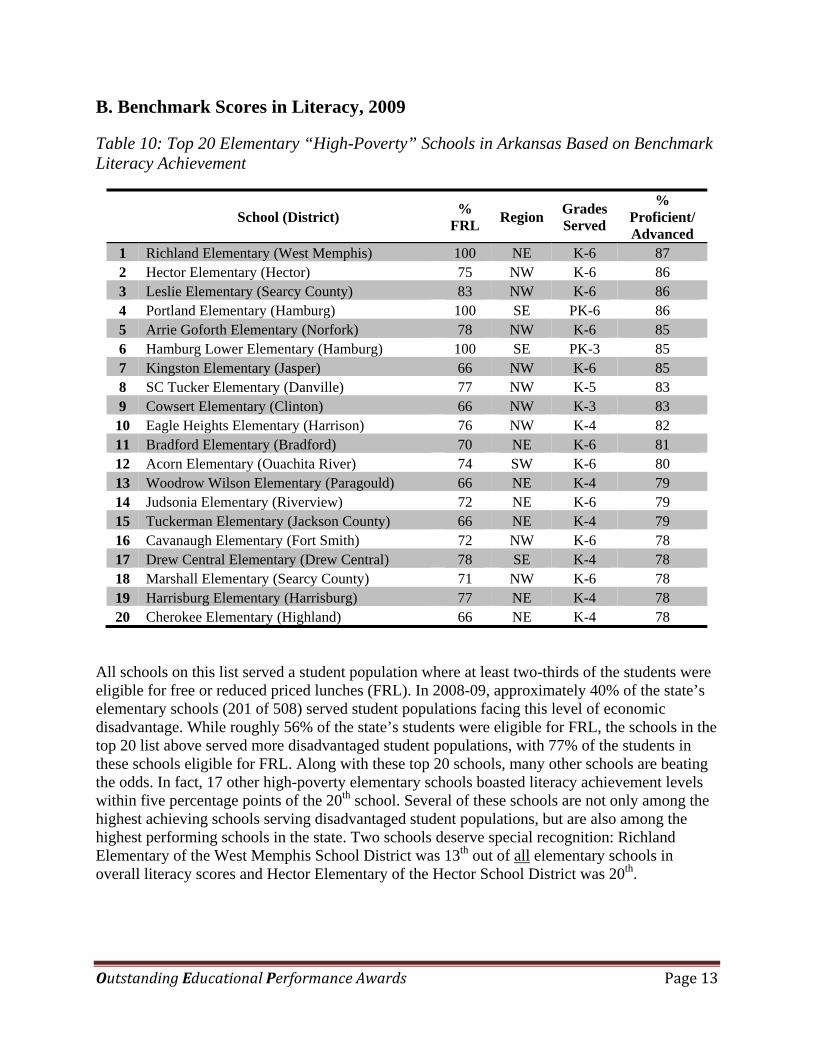
Table 10: Top 20 Elementary “High-Poverty” Schools in Arkansas Based on Benchmark Literacy Achievement
School (District) %
FRL Region
Grades Served
% Proficient/Advanced
1 Richland Elementary (West Memphis) 100 NE K-6 87 2 Hector Elementary (Hector) 75 NW K-6 86 3 Leslie Elementary (Searcy County) 83 NW K-6 86 4 Portland Elementary (Hamburg) 100 SE PK-6 86 5 Arrie Goforth Elementary (Norfork) 78 NW K-6 85 6 Hamburg Lower Elementary (Hamburg) 100 SE PK-3 85 7 Kingston Elementary (Jasper) 66 NW K-6 85 8 SC Tucker Elementary (Danville) 77 NW K-5 83 9 Cowsert Elementary (Clinton) 66 NW K-3 83
10 Eagle Heights Elementary (Harrison) 76 NW K-4 82 11 Bradford Elementary (Bradford) 70 NE K-6 81 12 Acorn Elementary (Ouachita River) 74 SW K-6 80 13 Woodrow Wilson Elementary (Paragould) 66 NE K-4 79 14 Judsonia Elementary (Riverview) 72 NE K-6 79 15 Tuckerman Elementary (Jackson County) 66 NE K-4 79 16 Cavanaugh Elementary (Fort Smith) 72 NW K-6 78 17 Drew Central Elementary (Drew Central) 78 SE K-4 78 18 Marshall Elementary (Searcy County) 71 NW K-6 78 19 Harrisburg Elementary (Harrisburg) 77 NE K-4 78 20 Cherokee Elementary (Highland) 66 NE K-4 78
All schools on this list served a student population where at least two-thirds of the students were eligible for free or reduced priced lunches (FRL). In 2008-09, approximately 40% of the state’s elementary schools (201 of 508) served student populations facing this level of economic disadvantage. While roughly 56% of the state’s students were eligible for FRL, the schools in the top 20 list above served more disadvantaged student populations, with 77% of the students in these schools eligible for FRL. Along with these top 20 schools, many other schools are beating the odds. In fact, 17 other high-poverty elementary schools boasted literacy achievement levels within five percentage points of the 20th school. Several of these schools are not only among the highest achieving schools serving disadvantaged student populations, but are also among the highest performing schools in the state. Two schools deserve special recognition: Richland Elementary of the West Memphis School District was 13th out of all elementary schools in overall literacy scores and Hector Elementary of the Hector School District was 20th.

Outstanding Educational Performance Awards Page 14
Table 11: Top 20 Middle “High-Poverty” Schools in Arkansas Based on Benchmark Literacy Achievement
School (District) %
FRL Region
Grades Served
% Proficient/Advanced
1 Umpire High (Wickes) 100 SW 7-12 93 2 Acorn High (Ouachita River) 69 SW 7-12 81 3 West Junior High (West Memphis) 100 NE 7-9 79 4 Norfork High (Norfork) 67 NW 7-12 77 5 J.D. Leftwich High (Magazine) 68 NW 6-12 77 6 Wickes High (Wickes) 100 SW 7-12 75 7 Cabe Middle (Gurdon) 72 SW 5-8 73 8 Marshall High (Searcy County) 69 NW 7-12 72 9 Lead Hill High (Lead Hill) 68 NW 7-12 72
10 Caddo Hills High (Caddo Hills) 71 SW 7-12 72 11 Riverview Jr. High (Riverview) 74 NE 7-8 71 12 Timbo High (Mountain View) 66 NE 7-12 70 13 KIPP: Delta College (KIPP: Delta College Prep) 87 SE 5-8 70 14 DeQueen Middle (DeQueen) 73 SW 6-9 70 15 Central Elementary (Trumann) 69 NE 5-6 70 16 Izard Co. Middle (Izard Co. Consolidated) 68 NE 5-8 69 17 Cross County High (Cross County) 69 NE 7-12 69 18 Westside High (Westside) 100 NW 7-12 69 19 Hamburg Jr. High (Hamburg) 100 SE 7-9 68 20 Western Yell County High (Western Yell Co.) 70 NW 7-12 68
All schools on this list served a student population where at least two-thirds of the students were eligible for free or reduced priced lunches (FRL). In 2009-09, approximately 30% of the state’s middle schools (98 of 362) served student populations facing this level of economic disadvantage. While roughly 56% of that state’s students were eligible for FRL, the schools in the top 20 list above served more disadvantaged student populations, with 78% of the students in these schools eligible for FRL. Several of these high-poverty middle schools are not only among the highest achieving schools serving disadvantaged student populations, but are also among the highest performing schools in the state. One school deserves special recognition: Umpire High of the Wickes School District was first out of all middle schools in overall literacy scores.
We have been highlighting these schools based on the school-wide average. However, there are several grade levels within schools that stand out for exceptional performance. The next table will highlight the top grades in high-poverty schools across the state.

Outstanding Educational Performance Awards Page 15
Table 12: Top 3 Grades in “High-Poverty” Schools in Arkansas Based on Benchmark Literacy Achievement
School (District) %
FRL Region
Grades Served
% Proficient/Advanced
3rd Grade 1 Deer Elementary (Deer/Mt. Judea) 73 NW K-6 95 2 Judsonia Elementary (Riverview) 72 NE K-6 91 3 Richland Elementary (West Memphis) 100 NE K-6 90
4th Grade 1 Arrie Goforth Elementary (Norfork) 78 NW K-6 100 2 Leslie Elementary (Searcy County) 83 NW K-6 96 3 Richland Elementary (West Memphis) 100 NE K-6 95
5th Grade 1 Marshall Elementary (Searcy County) 71 NW K-6 92 2 Oden Maddox Elementary (Ouachita River) 81 SW K-6 91 3 Arrie Goforth Elementary (Norfork) 78 NW K-6 88
6th Grade 1 Kingston Elementary (Jasper) 66 NW K-6 94 2 Leslie Elementary (Searcy County) 83 NW K-6 89 3 Black Rock Elementary (Lawrence County) 73 NW K-6 83
7th Grade 1 Acorn High (Ouachita River) 69 SW 7-12 88 2 West Junior High (West Memphis) 100 NE 7-9 76 3 KIPP: Delta College (KIPP: Delta College Prep) 87 SE 5-8 72
8th Grade 1 Umpire High (Wickes) 100 SW 7-12 93 2 Norfork High (Norfork) 67 NW 7-12 92 3 Cabe Middle (Gurdon) 72 SW 5-8 88
The first two sections of this report focused on all elementary and middle schools across the state based on the Arkansas Benchmark exams. In the following sections, we will take a closer look at these schools. First, we will highlight top elementary schools in each region of Arkansas, and focus on middle schools in each region in the following section.

Outstanding Educational Performance Awards Page 16
III. OEP AWARDS: TOP ELEMENTARY SCHOOLS BY REGION
This section highlights the top performing elementary schools (and grades within schools) by region based on the Arkansas Benchmark exam. The Benchmark exams were administered to students in grades three through eight in math and literacy in April 2009. Each table presents the top schools for the noted subject and region, and includes the grades served at the school and the percent of students scoring at the proficient and advanced levels in 2009.
A. Northwest Region, 2009
Table 13: Top 5 Elementary Schools in Northwest Arkansas Based on Benchmark Math Achievement
School (District) Grades Served
% Proficient/ Advanced
1 Skyline Heights Elementary (Harrison) K-4 97 2 Central Park at Morning Star (Bentonville) K-4 96 3 Pottsville Elementary (Pottsville) K-3 96 4 Bellview Elementary (Rogers) K-5 95 5 Elm Tree Elementary (Bentonville) K-4 94
Table 14: Top 3 Schools by Grade Level 5 in Northwest Arkansas Based on Benchmark Math Achievement
School (District) Grades Served
% Proficient/Advanced
3rd Grade 1 Deer Elementary (Deer/Mt. Judea) K-6 100 2 Jasper Elementary (Jasper) K-6 100 3 Skyline Heights Elementary (Harrison) K-4 97
4th Grade 1 Leslie Elementary (Searcy County) K-6 100 2 Central Park at Morning Star (Bentonville) K-4 97 3 Skyline Heights (Harrison) K-4 96
5th Grade 1 Bellview Elementary (Rogers) K-5 95 2 Vandergriff Elementary (Fayetteville) K-5 94
5 In this section, we highlight the top performing grade levels for grades three through five in each region. We did not distinguish between elementary or middle school, but simply highlight the top grade levels overall. Therefore, a middle school may be listed if it includes one of these grades. The next section will cover grades six through eight.
Outstanding Educational Performance Awards Page 17
3 Pea Ridge Elementary (Pea Ridge) K-6 94
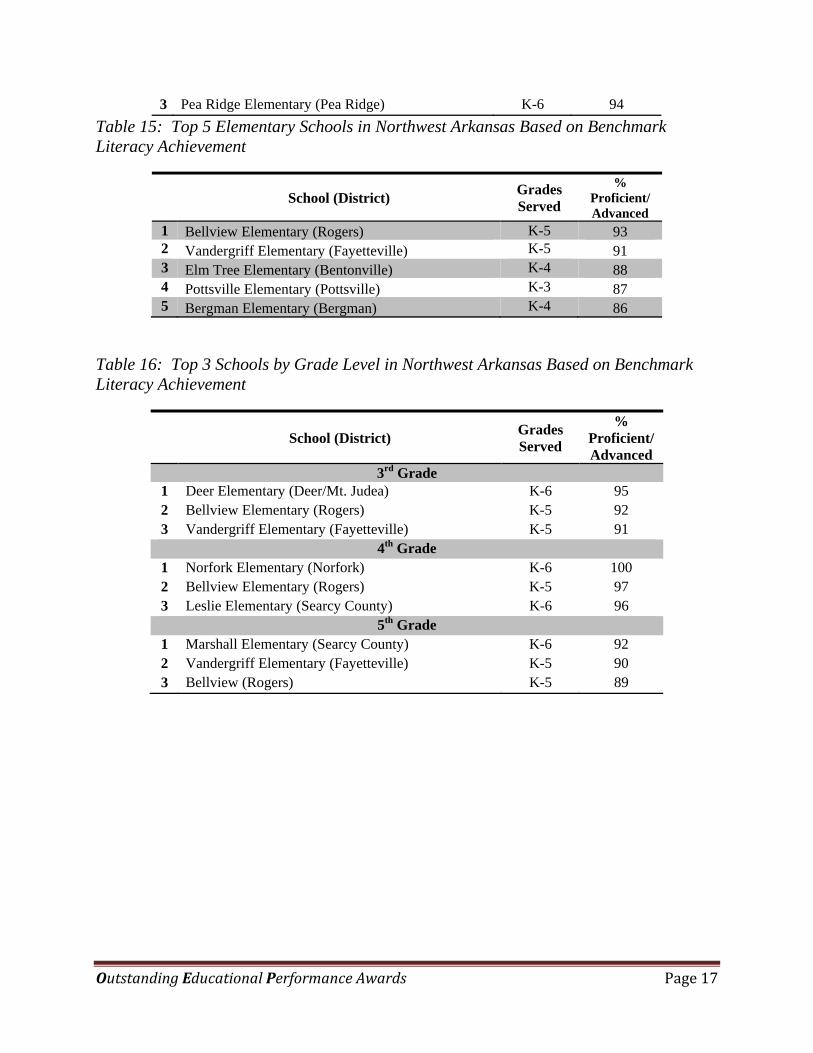
Table 15: Top 5 Elementary Schools in Northwest Arkansas Based on Benchmark Literacy Achievement
School (District) Grades Served
% Proficient/Advanced
1 Bellview Elementary (Rogers) K-5 93 2 Vandergriff Elementary (Fayetteville) K-5 91 3 Elm Tree Elementary (Bentonville) K-4 88 4 Pottsville Elementary (Pottsville) K-3 87 5 Bergman Elementary (Bergman) K-4 86
Table 16: Top 3 Schools by Grade Level in Northwest Arkansas Based on Benchmark Literacy Achievement
School (District) Grades Served
% Proficient/Advanced
3rd Grade 1 Deer Elementary (Deer/Mt. Judea) K-6 95 2 Bellview Elementary (Rogers) K-5 92 3 Vandergriff Elementary (Fayetteville) K-5 91
4th Grade 1 Norfork Elementary (Norfork) K-6 100 2 Bellview Elementary (Rogers) K-5 97 3 Leslie Elementary (Searcy County) K-6 96
5th Grade 1 Marshall Elementary (Searcy County) K-6 92 2 Vandergriff Elementary (Fayetteville) K-5 90 3 Bellview (Rogers) K-5 89

Outstanding Educational Performance Awards Page 18
B. Northeast Region, 2009
Table 17: Top 5 Elementary Schools in Northeast Arkansas Based on Benchmark Math Achievement
School (District) Grades Served
% Proficient/Advanced
1 Mount Pleasant Elementary (Melbourne) K-6 99 2 Salem Elementary (Salem) K-6 95 3 Valley View Elementary (Valley View) PK-6 94 4 Richland Elementary (West Memphis) K-6 93 5 Westside Elementary (Searcy) K-4 93
Table 18: Top 3 Schools by Grade Level in Northeast Arkansas Based on Benchmark Math Achievement
School (District) Grades Served
% Proficient/Advanced
3rd Grade 1 Mount Pleasant Elementary (Melbourne) K-6 100 2 Buffalo Island Central West Elementary (Buffalo Island) PK-6 100 3 Bragg Elementary (West Memphis) K-6 98
4th Grade 1 Mount Pleasant Elementary (Melbourne) K-6 100 2 Buffalo Island Central (Buffalo Island) PK-6 100 3 Richland Elementary (West Memphis) K-6 98
5th Grade 1 Mount Pleasant Elementary (Melbourne) K-6 96 2 Salem Elementary (Salem) K-6 96 3 Valley View Elementary (Valley View) PK-6 94
Outstanding Educational Performance Awards Page 19
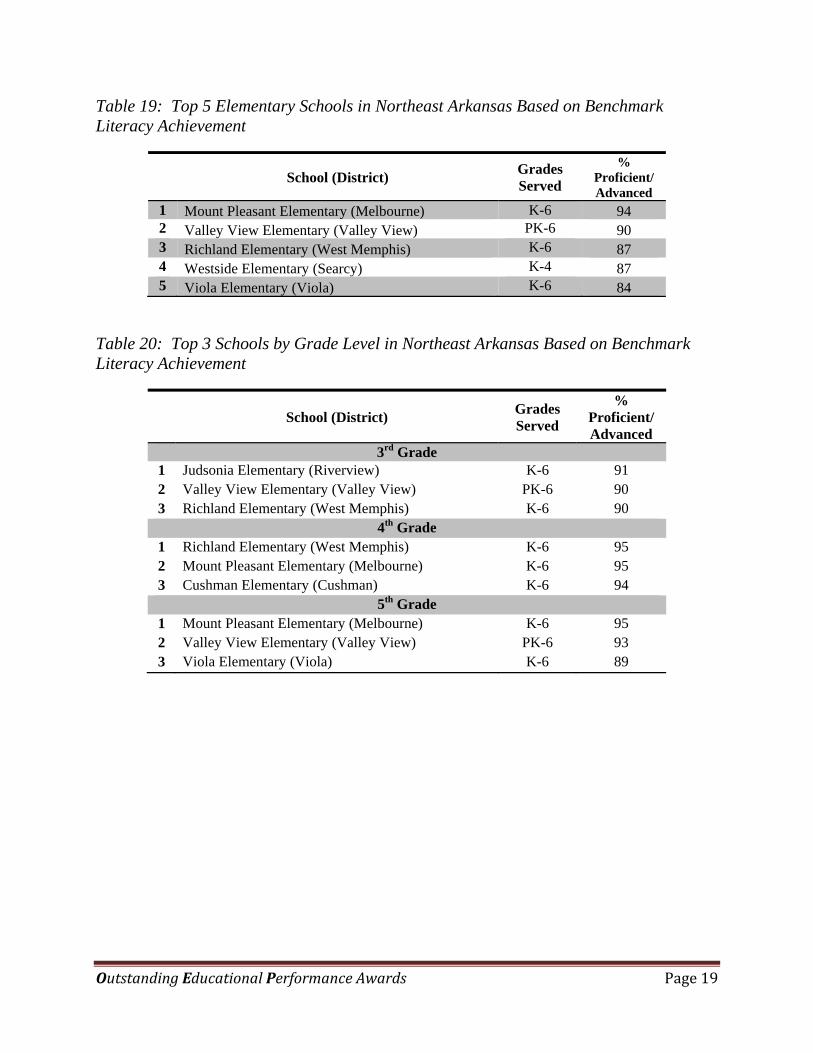
Table 19: Top 5 Elementary Schools in Northeast Arkansas Based on Benchmark Literacy Achievement
School (District) Grades Served
% Proficient/Advanced
1 Mount Pleasant Elementary (Melbourne) K-6 94 2 Valley View Elementary (Valley View) PK-6 90 3 Richland Elementary (West Memphis) K-6 87 4 Westside Elementary (Searcy) K-4 87 5 Viola Elementary (Viola) K-6 84
Table 20: Top 3 Schools by Grade Level in Northeast Arkansas Based on Benchmark Literacy Achievement
School (District) Grades Served
% Proficient/Advanced
3rd Grade 1 Judsonia Elementary (Riverview) K-6 91 2 Valley View Elementary (Valley View) PK-6 90 3 Richland Elementary (West Memphis) K-6 90
4th Grade 1 Richland Elementary (West Memphis) K-6 95 2 Mount Pleasant Elementary (Melbourne) K-6 95 3 Cushman Elementary (Cushman) K-6 94
5th Grade 1 Mount Pleasant Elementary (Melbourne) K-6 95 2 Valley View Elementary (Valley View) PK-6 93 3 Viola Elementary (Viola) K-6 89

Outstanding Educational Performance Awards Page 20
C. Central Region, 2009
Table 21: Top 5 Elementary Schools in Central Arkansas Based on Benchmark Math Achievement
School (District) Grades Served
% Proficient/Advanced
1 Vilonia Academy of Technology (Vilonia) 2-4 100 2 Park Magnet School (Hot Springs) K-5 99 3 Woodrow Cummins Elementary (Conway) K-4 95 4 Jim Stone Elementary (Conway) K-4 95 5 Cutter Morning Star (Cutter Morning Star) K-6 95
Table 22: Top 3 Schools by Grade Level in Central Arkansas Based on Benchmark Math Achievement
School (District) Grades Served
% Proficient/Advanced
3rd Grade 1 Park Magnet School (Hot Springs) K-5 100 2 Paron Elementary (Bryant) K-5 100 3 Lisa Academy NLR Middle (Lisa Academy) K-8 100 4 Vilonia Academy of Technology (Vilonia) 2-4 100 5 Magness Creek Elementary (Cabot) K-4 100
4th Grade 1 Park Magnet School (Hot Springs) K-5 100 2 Vilonia Academy of Technology (Vilonia) 2-4 100 3 Cutter Morning Star (Cutter-Morning Star) K-6 100
5th Grade 1 Park Magnet School (Hot Springs) K-5 97 2 Academy of Service and Technology (Vilonia) 5-6 96 3 Salem Elementary (Bryant) K-5 95

Outstanding Educational Performance Awards Page 21
Table 23: Top 5 Elementary Schools in Central Arkansas Based on Benchmark Literacy Achievement
School (District) Grades Served
% Proficient/Advanced
1 Park Magnet (Hot Springs) K-5 97 2 Vilonia Academy of Technology (Vilonia) 2-4 94 3 Arnold Drive Elementary (Pulaski County) PK-5 92 4 Jim Stone Elementary (Conway) K-4 90 5 Ellen Smith Elementary (Conway) K-4 90
Table 24: Top 3 Schools by Grade Level in Central Arkansas Based on Benchmark Literacy Achievement
School (District) Grades Served
% Proficient/Advanced
3rd Grade 1 Lisa Academy NLR Middle (Lisa Academy) K-8 96 2 Park Magnet (Hot Springs) K-5 93 3 Collegeville Elementary (Bryant) K-5 92
4th Grade 1 Park Magnet (Hot Springs) K-5 100 2 Vilonia Academy of Technology (Vilonia) 2-4 100 3 Arnold Drive Elementary (Pulaski County) PK-5 97
5th Grade 1 Park Magnet (Hot Springs) K-5 100 2 Paron Elementary (Bryant) K-5 100 3 Academy of Service and Technology (Vilonia) 5-6 96

Outstanding Educational Performance Awards Page 22
D. Southwest Region, 2009
Table 25: Top 5 Elementary Schools in Southwest Arkansas Based on Benchmark Math Achievement
School (District) Grades Served
% Proficient/Advanced
1 Central Primary (Arkadelphia) 2-3 92 2 College Hill Elementary (Texarkana) K-4 92 3 Parkers Chapel Elementary (Parkers Chapel) K-6 92 4 Acorn Elementary (Ouachita River) K-6 88 5 Spring Hill Elementary (Spring Hill) K-6 88
Table 26: Top 3 Schools by Grade Level in Southwest Arkansas Based on Benchmark Math Achievement
School (District) Grades Served
% Proficient/Advanced
3rd Grade 1 Acorn Elementary (Ouachita River) K-6 100 2 Emerson Elementary (Emerson-Taylor) K-6 100 3 Winthrop Elementary (Horatio) K-6 100
4th Grade 1 Umpire Elementary (Wickes) PK-6 93 2 Winthrop Elementary (Horatio) K-6 92 3 Spring Hill Elementary (Spring Hill) K-6 92
5th Grade 1 Parkers Chapel Elementary (Parkers Chapel) K-6 98 2 Jo Ann Walters Elementary (Dierks) K-6 85 3 Delight Elementary (Delight) K-6 84

Outstanding Educational Performance Awards Page 23
Table 27: Top 5 Elementary Schools in Southwest Arkansas Based on Benchmark Literacy Achievement
School (District) Grades Served
% Proficient/Advanced
1 Spring Hill Elementary (Spring Hill) K-6 89 2 College Hill Elementary (Texarkana) K-4 85 3 Parkers Chapel Elementary (Parkers Chapel) K-6 84 4 Acorn Elementary (Ouachita River) K-6 80 5 Kirby Elementary (Kirby) K-6 80
Table 28: Top 3 Schools by Grade Level in Southwest Arkansas Based on Benchmark Literacy Achievement
School (District) Grades Served
% Proficient/Advanced
3rd Grade 1 Spring Hill Elementary (Spring Hill) K-6 98 2 Wickes Elementary (Wickes) PK-6 90 3 Delight Elementary (Delight) K-6 88
4th Grade 1 Parkers Chapel Elementary (Parkers Chapel) K-6 93 2 Umpire Elementary (Wickes) PK-6 93 3 Kirby Elementary (Kirby) K-6 89
5th Grade 1 Emerson Elementary (Emerson-Taylor) K-6 92 2 Oden Maddox Elementary (Ouachita River) K-6 91 3 Jo Ann Walters Elementary (Dierks) K-6 85

Outstanding Educational Performance Awards Page 24
E. Southeast Region, 2009
Table 29: Top 5 Elementary Schools in Southeast Arkansas Based on Benchmark Math Achievement
School (District) Grades Served
% Proficient/Advanced
1 Eudora Elementary (Lakeside) PK-3 97 2 Noble Lower Elementary (Hamburg) PK-3 92 3 Lucilia Wood Elementary (Marvell) PK-3 88 4 Drew Central Elementary (Drew Central) K-4 87 5 Portland Elementary (Hamburg) PK-6 86
Table 30: Top 3 Schools by Grade Level in Southeast Arkansas Based on Benchmark Math Achievement
School (District) Grades Served
% Proficient/Advanced
3rd Grade 1 Portland Elementary (Hamburg) PK-6 100 2 Eudora Elementary (Lakeside) PK-3 97 3 Des Arc Elementary (Des Arc) PK-6 93
4th Grade 1 Allbritton Upper Elementary (Hamburg) 4-6 93 2 Des Arc Elementary (Des Arc) PK-6 88 3 Partee Elementary (Brinkley) K-6 83
5th Grade 1 West Side Elementary (Helena/W. Helena) 1-6 86 2 Hermitage Elementary (Hermitage) PK-5 79 3 Drew Central Middle (Drew Central) 5-7 79
Outstanding Educational Performance Awards Page 25
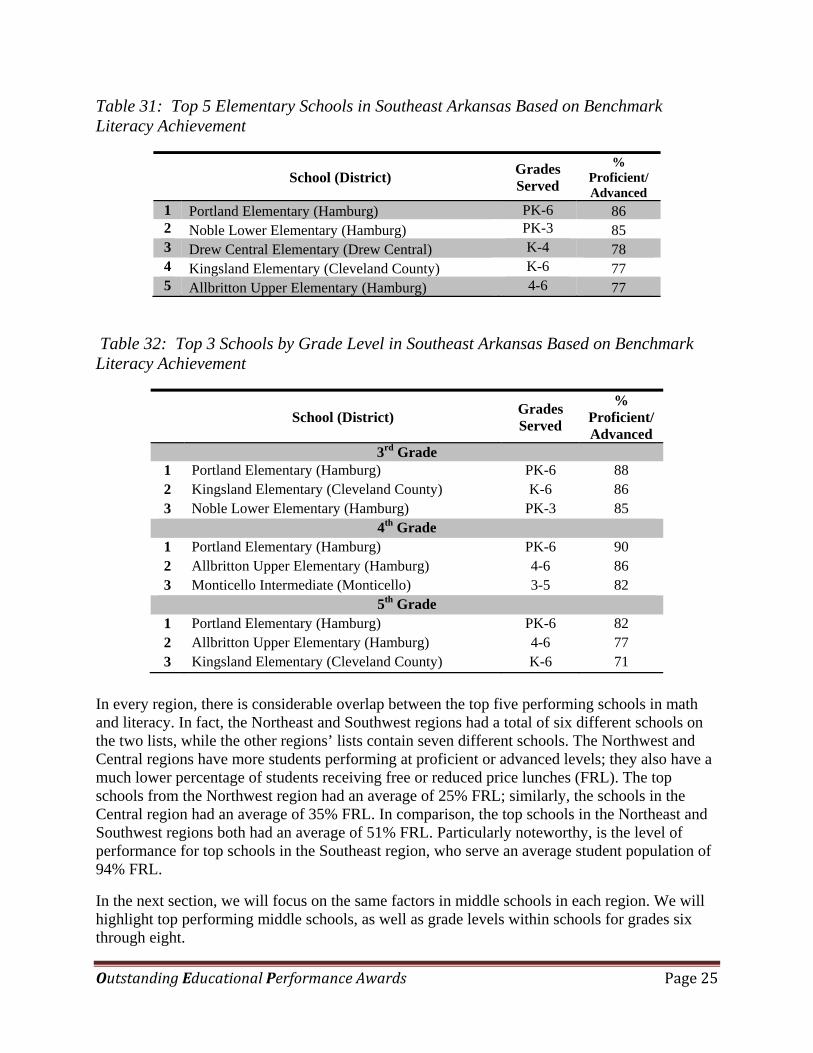
Table 31: Top 5 Elementary Schools in Southeast Arkansas Based on Benchmark Literacy Achievement
School (District) Grades Served
% Proficient/Advanced
1 Portland Elementary (Hamburg) PK-6 86 2 Noble Lower Elementary (Hamburg) PK-3 85 3 Drew Central Elementary (Drew Central) K-4 78 4 Kingsland Elementary (Cleveland County) K-6 77 5 Allbritton Upper Elementary (Hamburg) 4-6 77
Table 32: Top 3 Schools by Grade Level in Southeast Arkansas Based on Benchmark Literacy Achievement
School (District) Grades Served
% Proficient/Advanced
3rd Grade 1 Portland Elementary (Hamburg) PK-6 88 2 Kingsland Elementary (Cleveland County) K-6 86 3 Noble Lower Elementary (Hamburg) PK-3 85
4th Grade 1 Portland Elementary (Hamburg) PK-6 90 2 Allbritton Upper Elementary (Hamburg) 4-6 86 3 Monticello Intermediate (Monticello) 3-5 82
5th Grade 1 Portland Elementary (Hamburg) PK-6 82 2 Allbritton Upper Elementary (Hamburg) 4-6 77 3 Kingsland Elementary (Cleveland County) K-6 71
In every region, there is considerable overlap between the top five performing schools in math and literacy. In fact, the Northeast and Southwest regions had a total of six different schools on the two lists, while the other regions’ lists contain seven different schools. The Northwest and Central regions have more students performing at proficient or advanced levels; they also have a much lower percentage of students receiving free or reduced price lunches (FRL). The top schools from the Northwest region had an average of 25% FRL; similarly, the schools in the Central region had an average of 35% FRL. In comparison, the top schools in the Northeast and Southwest regions both had an average of 51% FRL. Particularly noteworthy, is the level of performance for top schools in the Southeast region, who serve an average student population of 94% FRL.
In the next section, we will focus on the same factors in middle schools in each region. We will highlight top performing middle schools, as well as grade levels within schools for grades six through eight.
Outstanding Educational Performance Awards Page 26
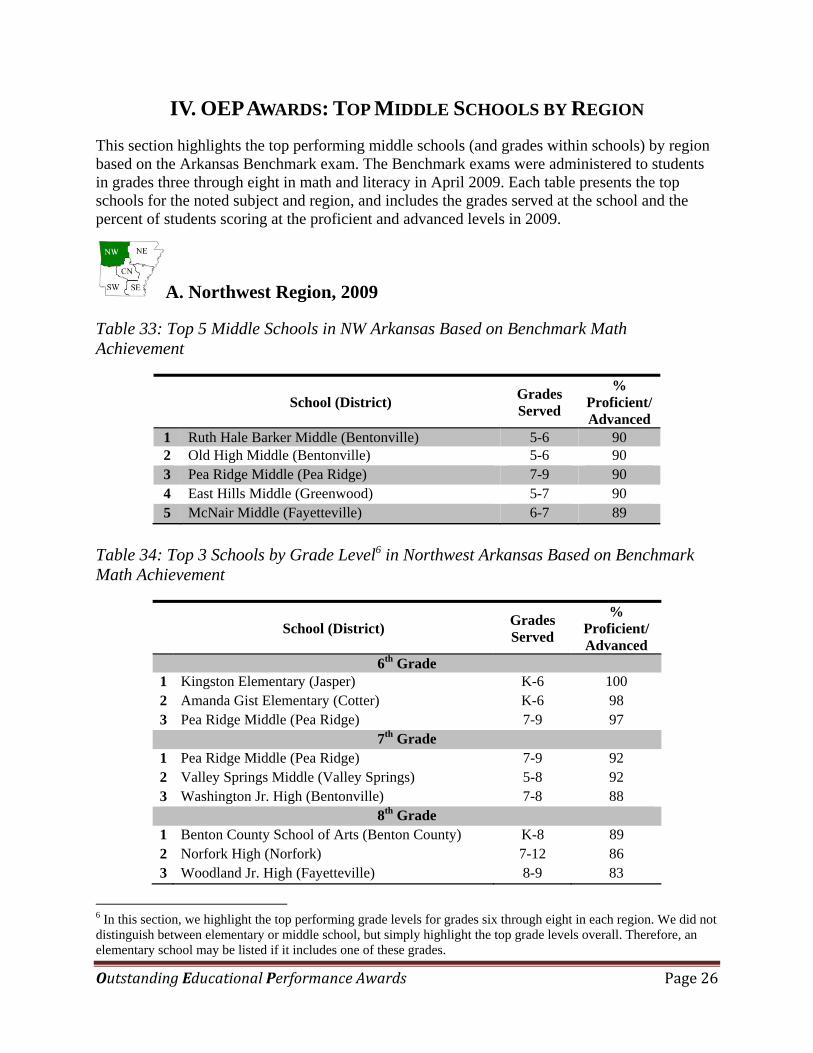
IV. OEP AWARDS: TOP MIDDLE SCHOOLS BY REGION
This section highlights the top performing middle schools (and grades within schools) by region based on the Arkansas Benchmark exam. The Benchmark exams were administered to students in grades three through eight in math and literacy in April 2009. Each table presents the top schools for the noted subject and region, and includes the grades served at the school and the percent of students scoring at the proficient and advanced levels in 2009.
A. Northwest Region, 2009
Table 33: Top 5 Middle Schools in NW Arkansas Based on Benchmark Math Achievement
School (District) Grades Served
% Proficient/ Advanced
1 Ruth Hale Barker Middle (Bentonville) 5-6 90 2 Old High Middle (Bentonville) 5-6 90 3 Pea Ridge Middle (Pea Ridge) 7-9 90 4 East Hills Middle (Greenwood) 5-7 90 5 McNair Middle (Fayetteville) 6-7 89
Table 34: Top 3 Schools by Grade Level6 in Northwest Arkansas Based on Benchmark Math Achievement
School (District) Grades Served
% Proficient/Advanced
6th Grade 1 Kingston Elementary (Jasper) K-6 100 2 Amanda Gist Elementary (Cotter) K-6 98 3 Pea Ridge Middle (Pea Ridge) 7-9 97
7th Grade 1 Pea Ridge Middle (Pea Ridge) 7-9 92 2 Valley Springs Middle (Valley Springs) 5-8 92 3 Washington Jr. High (Bentonville) 7-8 88
8th Grade 1 Benton County School of Arts (Benton County) K-8 89 2 Norfork High (Norfork) 7-12 86 3 Woodland Jr. High (Fayetteville) 8-9 83
6 In this section, we highlight the top performing grade levels for grades six through eight in each region. We did not distinguish between elementary or middle school, but simply highlight the top grade levels overall. Therefore, an elementary school may be listed if it includes one of these grades.

Outstanding Educational Performance Awards Page 27
Table 35: Top 5 Middle Schools in Northwest Arkansas Based on Benchmark Literacy Achievement
School (District) Grades Served
% Proficient/Advanced
1 Woodland Jr. High (Fayetteville) 8-9 90 2 Harrison Middle (Harrison) 5-6 86 3 Washington Jr. High (Bentonville) 7-8 86 4 McNair Middle (Fayetteville) 6-7 86 5 Pea Ridge Middle (Pea Ridge ) 7-9 85
Table 36: Top 3 Schools by Grade Level in Northwest Arkansas Based on Benchmark Literacy Achievement
School (District) Grades Served
% Proficient/Advanced
6th Grade 1 Kingston Elementary (Jasper) K-6 94 2 Leslie Elementary (Searcy County) K-6 89 3 Cook Elementary (Fort Smith) K-6 89
7th Grade 1 Benton County School of Arts (Benton County) K-8 96 2 Valley Springs Middle (Valley Springs) 5-8 93 3 Alpena High School (Alpena) 7-12 85
8th Grade 1 Benton County School of Arts (Benton County) K-8 100 2 Norfork High (Norfork) 7-12 92 3 Washington Jr. High (Bentonville) 7-8 90

Outstanding Educational Performance Awards Page 28
B. Northeast Region, 2009
Table 37: Top 5 Middle Schools in Northeast Arkansas Based on Benchmark Math Achievement
School (District) Grades Served
% Proficient/Advanced
1 Mountain View Middle (Mountain View) 6-8 86 2 Southwest Middle (Searcy) 5-6 86 3 Swifton Middle (Jackson County) 5-7 86 4 Highland Middle (Highland) 5-7 85 5 Tuckerman High (Jackson County) 8-12 84
Table 38: Top 3 Schools by Grade Level in Northeast Arkansas Based on Benchmark Math Achievement
School (District) Grades Served
% Proficient/Advanced
6th Grade 1 Mount Pleasant Elementary (Melbourne) K-6 100 2 Calico Rock Elementary (Calico Rock) K-6 100 3 Rural Special Elementary (Mountain View) K-6 100
7th Grade 1 Calico Rock High (Calico Rock) 7-12 93 2 Viola High (Viola) 7-12 88 3 Valley View High (Valley View) 7-12 86
8th Grade 1 Tuckerman High (Jackson County) 8-12 84 2 Mountain View Middle (Mountain View) 6-8 83 3 Heber Springs Middle (Heber Springs) 6-8 82
Outstanding Educational Performance Awards Page 29
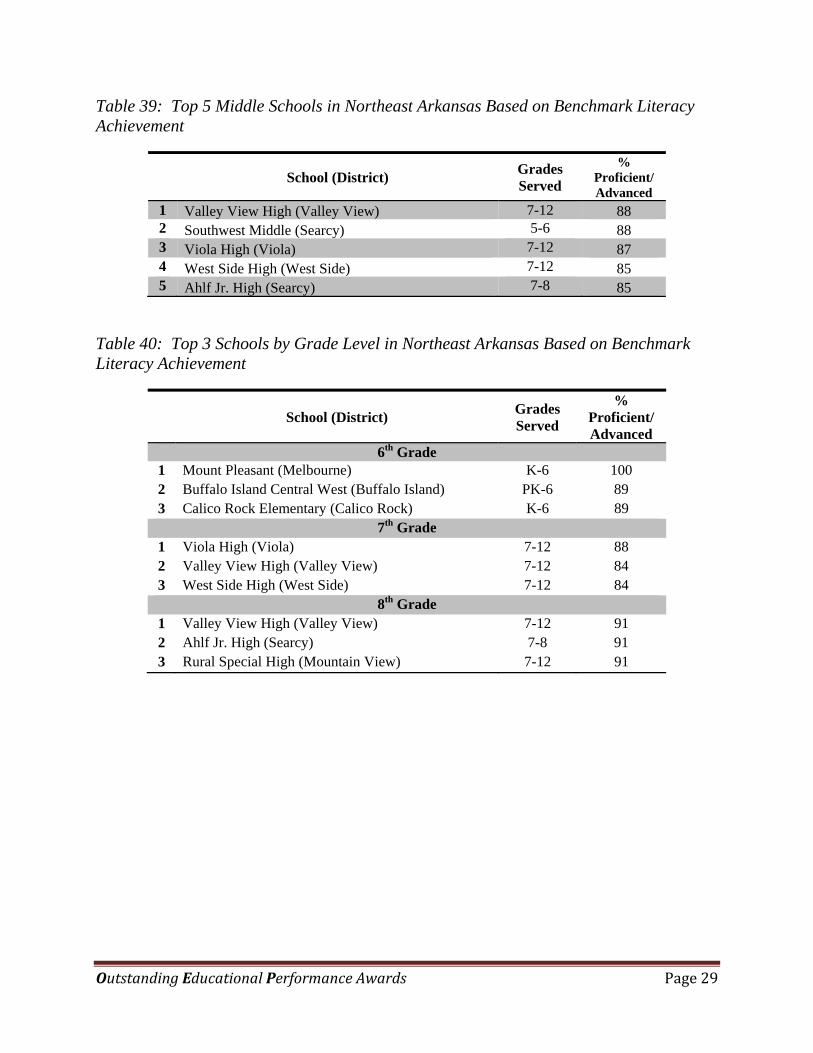
Table 39: Top 5 Middle Schools in Northeast Arkansas Based on Benchmark Literacy Achievement
School (District) Grades Served
% Proficient/Advanced
1 Valley View High (Valley View) 7-12 88 2 Southwest Middle (Searcy) 5-6 88 3 Viola High (Viola) 7-12 87 4 West Side High (West Side) 7-12 85 5 Ahlf Jr. High (Searcy) 7-8 85
Table 40: Top 3 Schools by Grade Level in Northeast Arkansas Based on Benchmark Literacy Achievement
School (District) Grades Served
% Proficient/Advanced
6th Grade 1 Mount Pleasant (Melbourne) K-6 100 2 Buffalo Island Central West (Buffalo Island) PK-6 89 3 Calico Rock Elementary (Calico Rock) K-6 89
7th Grade 1 Viola High (Viola) 7-12 88 2 Valley View High (Valley View) 7-12 84 3 West Side High (West Side) 7-12 84
8th Grade 1 Valley View High (Valley View) 7-12 91 2 Ahlf Jr. High (Searcy) 7-8 91 3 Rural Special High (Mountain View) 7-12 91

Outstanding Educational Performance Awards Page 30
C. Central Region, 2009
Table 41: Top 5 Middle Schools in Central Arkansas Based on Benchmark Math Achievement
School (District) Grades Served
% Proficient/Advanced
1 Academy of Service and Technology (Vilonia) 5-6 96 2 Ruth Doyle Intermediate (Conway) 5-6 90 3 Lisa Middle (Lisa Academy) 6-8 89 4 Greenbrier Middle (Greenbrier) 5-7 88 5 Cabot Middle South (Cabot) 5-6 86
Table 42: Top 3 Schools by Grade Level in Central Arkansas Based on Benchmark Math Achievement
School (District) Grades Served
% Proficient/Advanced
6th Grade 1 Academy of Service and Technology (Vilonia) 5-6 96 2 Lisa Middle (Lisa Academy) 6-8 95 3 Ruth Doyle Intermediate (Conway) 5-6 94
7th Grade 1 Lisa Middle (Lisa Academy) 6-8 93 2 Bismarck Middle (Bismarck) 5-8 91 3 Greenbrier Middle (Greenbrier) 5-7 84
8th Grade 1 Bethel Middle (Bryant) 6-8 82 2 Lakeside Jr. High (Lakeside) 8-9 81 3 Carl Stuart Middle (Conway) 7-8 80

Outstanding Educational Performance Awards Page 31
Table 43: Top 5 Middle Schools in Central Arkansas Based on Benchmark Literacy Achievement
School (District) Grades Served
% Proficient/Advanced
1 Lisa Middle (Lisa Academy) 6-8 93 2 Academy of Service and Technology (Vilonia) 5-6 92 3 Lakeside Jr. High (Lakeside) 8-9 85 4 Ruth Doyle Intermediate (Conway) 5-6 84 5 Vilonia Jr. High (Vilonia) 8-9 84
Table 44: Top 3 Schools by Grade Level in Central Arkansas Based on Benchmark Literacy Achievement
School (District) Grades Served
% Proficient/Advanced
6th Grade 1 Lisa Middle (Lisa Academy) 6-8 93 2 Academy of Service and Technology (Vilonia) 5-6 87 3 Moody Elementary (White Hall) K-6 87
7th Grade 1 Lisa Middle (Lisa Academy) 6-8 94 2 Academics Plus (Academics Plus) 3-8 91 3 Lakeside Middle (Lakeside) 6-8 83
8th Grade 1 Lisa Middle (Lisa Academy) 6-8 90 2 Redfield Jr. High (White Hall) 7-9 90 3 Academics Plus (Academics Plus) 3-8 88
Outstanding Educational Performance Awards Page 32
D. Southwest Region, 2009
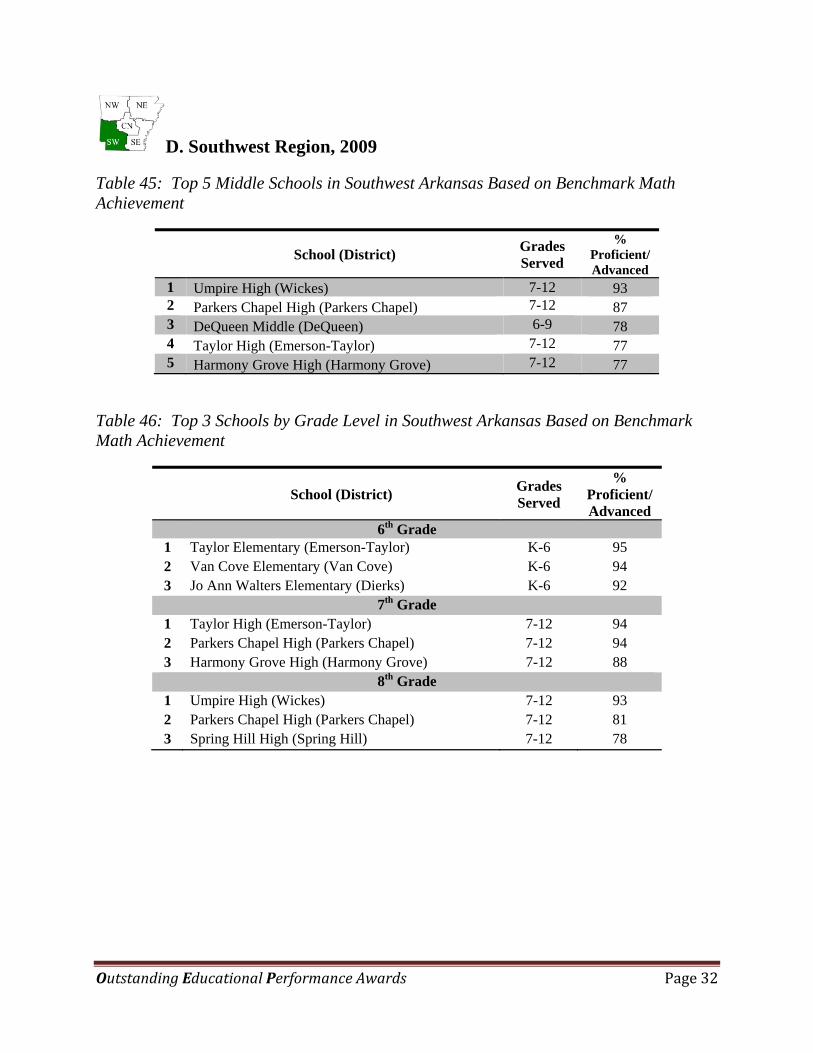
Table 45: Top 5 Middle Schools in Southwest Arkansas Based on Benchmark Math Achievement
School (District) Grades Served
% Proficient/Advanced
1 Umpire High (Wickes) 7-12 93 2 Parkers Chapel High (Parkers Chapel) 7-12 87 3 DeQueen Middle (DeQueen) 6-9 78 4 Taylor High (Emerson-Taylor) 7-12 77 5 Harmony Grove High (Harmony Grove) 7-12 77
Table 46: Top 3 Schools by Grade Level in Southwest Arkansas Based on Benchmark Math Achievement
School (District) Grades Served
% Proficient/Advanced
6th Grade 1 Taylor Elementary (Emerson-Taylor) K-6 95 2 Van Cove Elementary (Van Cove) K-6 94 3 Jo Ann Walters Elementary (Dierks) K-6 92
7th Grade 1 Taylor High (Emerson-Taylor) 7-12 94 2 Parkers Chapel High (Parkers Chapel) 7-12 94 3 Harmony Grove High (Harmony Grove) 7-12 88
8th Grade 1 Umpire High (Wickes) 7-12 93 2 Parkers Chapel High (Parkers Chapel) 7-12 81 3 Spring Hill High (Spring Hill) 7-12 78

Outstanding Educational Performance Awards Page 33
Table 47: Top 5 Middle Schools in Southwest Arkansas Based on Benchmark Literacy Achievement
School (District) Grades Served
% Proficient/Advanced
1 Umpire High (Wickes) 7-12 93 2 Dierks High (Dierks) 7-12 83 3 Taylor High (Emerson-Taylor) 7-12 82 4 Acorn High (Ouachita River) 7-12 81 5 Parkers Chapel (Parkers Chapel) 7-12 79
Table 48: Top 3 Schools by Grade Level in Southwest Arkansas Based on Benchmark Literacy Achievement
School (District) Grades Served
% Proficient/Advanced
6th Grade 1 Spring Hill Elementary (Spring Hill) K-6 90 2 Gary E. Cobb Middle (Genoa Central) 5-8 81 3 Sparkman Elementary (Harmony Grove) K-6 81
7th Grade 1 Acorn High (Ouachita River) 7-12 88 2 Taylor High (Emerson-Taylor) 7-12 82 3 Dierks High (Dierks) 7-12 82
8th Grade 1 Umpire High (Wickes) 7-12 93 2 Cabe Middle (Gurdon) 5-8 88 3 Dierks High (Dierks) 7-12 85

Outstanding Educational Performance Awards Page 34
E. Southeast Region, 2009
Table 49: Top 5 Middle Schools in Southeast Arkansas Based on Benchmark Math Achievement
School (District) Grades Served
% Proficient/Advanced
1 Monticello Middle (Monticello) 6-8 83 2 Star City Middle (Star City) 6-8 81 3 Drew Central Middle (Drew Central) 5-7 76 4 Dewitt/Gillett High (Dewitt) 9-12 75 5 KIPP: Delta College Prep (KIPP: Delta) 5-8 74
Table 50: Top 3 Schools by Grade Level in Southeast Arkansas Based on Benchmark Math Achievement
School (District) Grades Served
% Proficient/Advanced
6th Grade 1 Woodlawn Elementary (Woodlawn) K-6 94 2 Drew Central Middle (Drew Central) 5-7 92 3 Monticello Middle (Monticello) 6-8 90
7th Grade 1 KIPP: Delta College Prep (KIPP: Delta) 5-8 94 2 Monticello Middle (Monticello) 6-8 86 3 Dewitt/Gillett High (Dewitt) 9-12 83
8th Grade 1 Star City Middle (Star City) 6-8 77 2 KIPP: Delta College Prep (KIPP: Delta) 5-8 73 3 Monticello Middle (Monticello) 6-8 72
Outstanding Educational Performance Awards Page 35
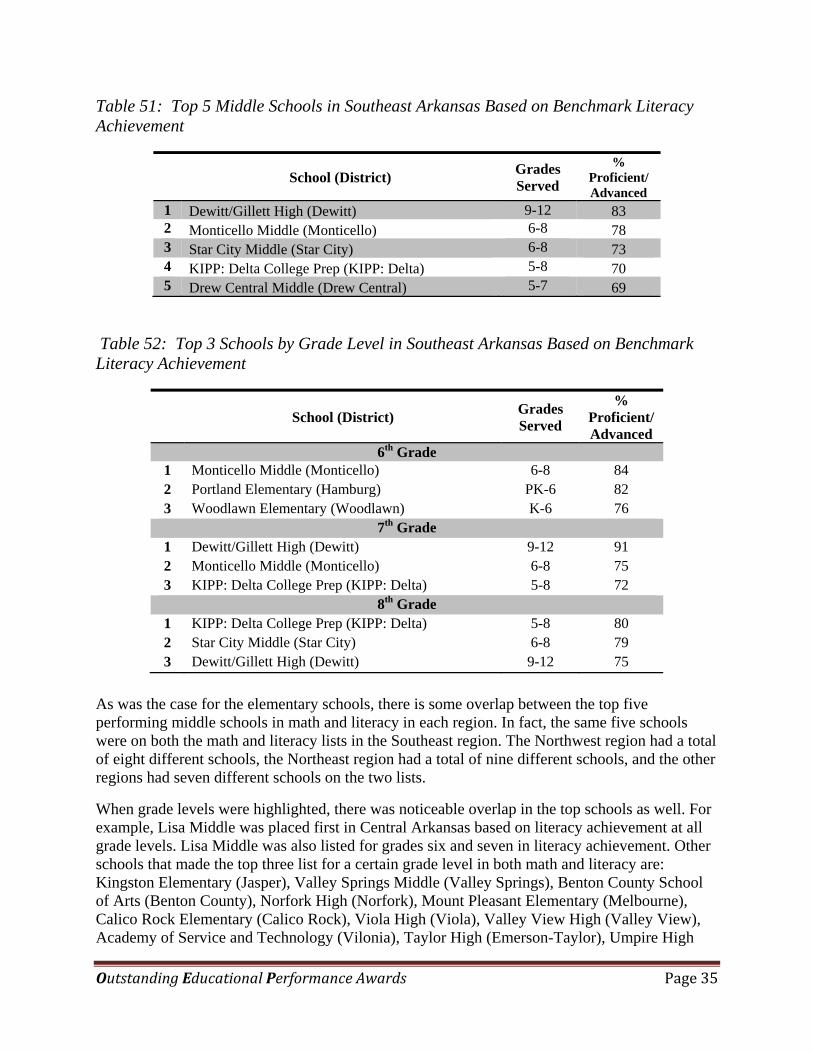
Table 51: Top 5 Middle Schools in Southeast Arkansas Based on Benchmark Literacy Achievement
School (District) Grades Served
% Proficient/Advanced
1 Dewitt/Gillett High (Dewitt) 9-12 83 2 Monticello Middle (Monticello) 6-8 78 3 Star City Middle (Star City) 6-8 73 4 KIPP: Delta College Prep (KIPP: Delta) 5-8 70 5 Drew Central Middle (Drew Central) 5-7 69
Table 52: Top 3 Schools by Grade Level in Southeast Arkansas Based on Benchmark Literacy Achievement
School (District) Grades Served
% Proficient/Advanced
6th Grade 1 Monticello Middle (Monticello) 6-8 84 2 Portland Elementary (Hamburg) PK-6 82 3 Woodlawn Elementary (Woodlawn) K-6 76
7th Grade 1 Dewitt/Gillett High (Dewitt) 9-12 91 2 Monticello Middle (Monticello) 6-8 75 3 KIPP: Delta College Prep (KIPP: Delta) 5-8 72
8th Grade 1 KIPP: Delta College Prep (KIPP: Delta) 5-8 80 2 Star City Middle (Star City) 6-8 79 3 Dewitt/Gillett High (Dewitt) 9-12 75
As was the case for the elementary schools, there is some overlap between the top five performing middle schools in math and literacy in each region. In fact, the same five schools were on both the math and literacy lists in the Southeast region. The Northwest region had a total of eight different schools, the Northeast region had a total of nine different schools, and the other regions had seven different schools on the two lists.
When grade levels were highlighted, there was noticeable overlap in the top schools as well. For example, Lisa Middle was placed first in Central Arkansas based on literacy achievement at all grade levels. Lisa Middle was also listed for grades six and seven in literacy achievement. Other schools that made the top three list for a certain grade level in both math and literacy are: Kingston Elementary (Jasper), Valley Springs Middle (Valley Springs), Benton County School of Arts (Benton County), Norfork High (Norfork), Mount Pleasant Elementary (Melbourne), Calico Rock Elementary (Calico Rock), Viola High (Viola), Valley View High (Valley View), Academy of Service and Technology (Vilonia), Taylor High (Emerson-Taylor), Umpire High

Outstanding Educational Performance Awards Page 36
(Wickes), Woodlawn Elementary (Woodlawn), Monticello Middle (Monticello), KIPP Delta College (KIPP: Delta), Dewitt/Gillett High (Dewitt), and Star City Middle (Star City). These schools had one or more grade levels (grades six, seven, and/or eight) in which their scores were within the top three in math and literacy. Accolades to these schools that are performing well in all areas!
Most of the schools on these lists were middle schools. However, there were some K-6 schools and high schools that made a grade-level list as well. In the next section, we will focus on high schools. We will use the End-of-Course examinations to create a list of overall top high schools in Arkansas, high-poverty high schools that are performing at high levels, and the top high schools in each region.
Outstanding Educational Performance Awards Page 37
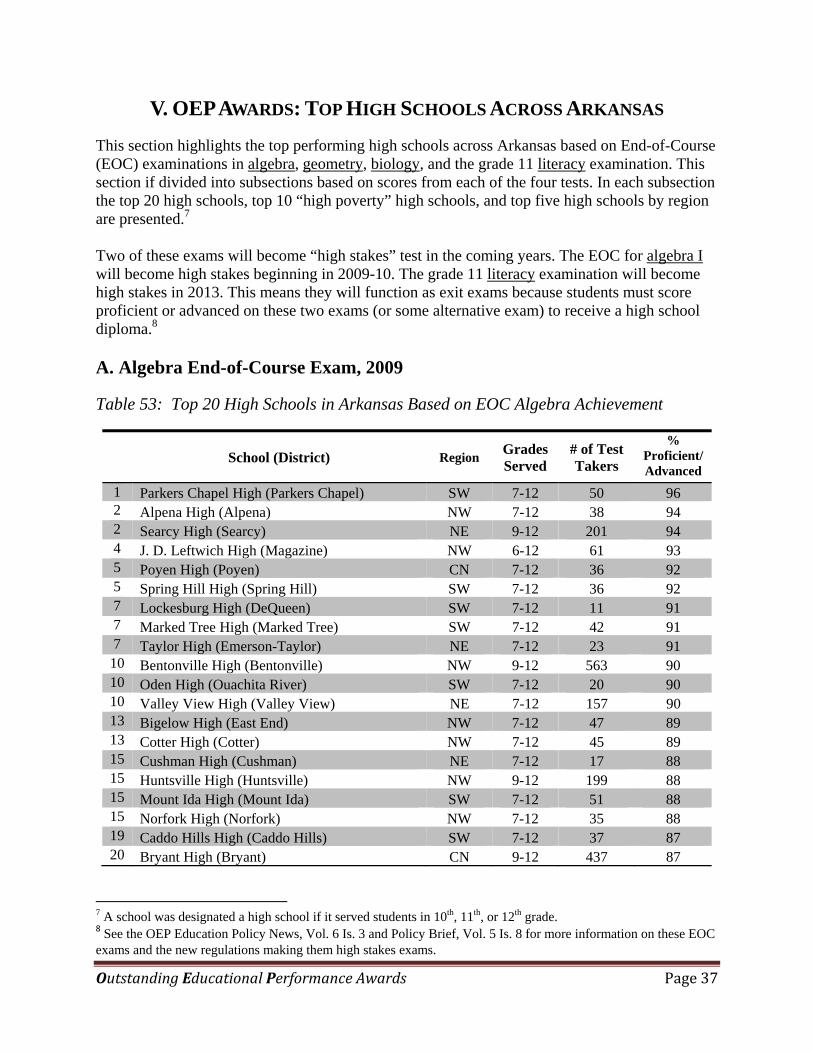
V. OEP AWARDS: TOP HIGH SCHOOLS ACROSS ARKANSAS
This section highlights the top performing high schools across Arkansas based on End-of-Course (EOC) examinations in algebra, geometry, biology, and the grade 11 literacy examination. This section if divided into subsections based on scores from each of the four tests. In each subsection the top 20 high schools, top 10 “high poverty” high schools, and top five high schools by region are presented.7 Two of these exams will become “high stakes” test in the coming years. The EOC for algebra I will become high stakes beginning in 2009-10. The grade 11 literacy examination will become high stakes in 2013. This means they will function as exit exams because students must score proficient or advanced on these two exams (or some alternative exam) to receive a high school diploma.8 A. Algebra End-of-Course Exam, 2009
Table 53: Top 20 High Schools in Arkansas Based on EOC Algebra Achievement
School (District) Region Grades Served
# of Test Takers
% Proficient/ Advanced
1 Parkers Chapel High (Parkers Chapel) SW 7-12 50 96 2 Alpena High (Alpena) NW 7-12 38 94 2 Searcy High (Searcy) NE 9-12 201 94 4 J. D. Leftwich High (Magazine) NW 6-12 61 93 5 Poyen High (Poyen) CN 7-12 36 92 5 Spring Hill High (Spring Hill) SW 7-12 36 92 7 Lockesburg High (DeQueen) SW 7-12 11 91 7 Marked Tree High (Marked Tree) SW 7-12 42 91 7 Taylor High (Emerson-Taylor) NE 7-12 23 91 10 Bentonville High (Bentonville) NW 9-12 563 90 10 Oden High (Ouachita River) SW 7-12 20 90 10 Valley View High (Valley View) NE 7-12 157 90 13 Bigelow High (East End) NW 7-12 47 89 13 Cotter High (Cotter) NW 7-12 45 89 15 Cushman High (Cushman) NE 7-12 17 88 15 Huntsville High (Huntsville) NW 9-12 199 88 15 Mount Ida High (Mount Ida) SW 7-12 51 88 15 Norfork High (Norfork) NW 7-12 35 88 19 Caddo Hills High (Caddo Hills) SW 7-12 37 87 20 Bryant High (Bryant) CN 9-12 437 87
7 A school was designated a high school if it served students in 10th, 11th, or 12th grade. 8 See the OEP Education Policy News, Vol. 6 Is. 3 and Policy Brief, Vol. 5 Is. 8 for more information on these EOC exams and the new regulations making them high stakes exams.
Outstanding Educational Performance Awards Page 38
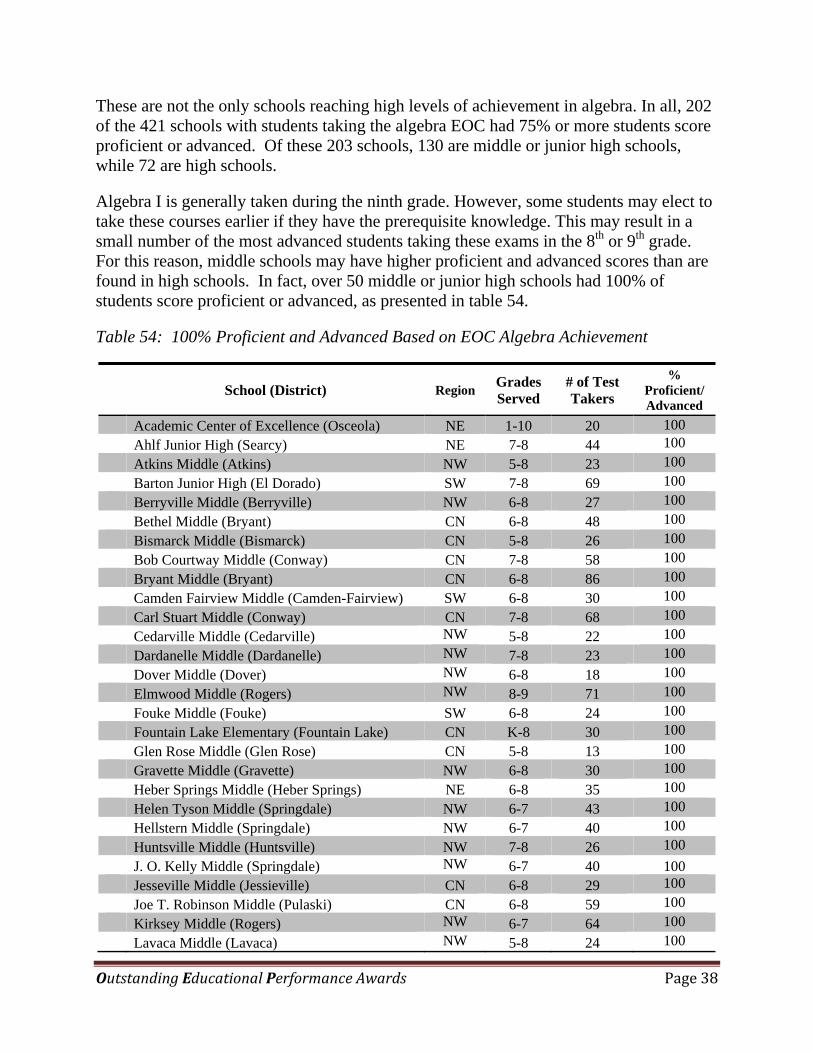
These are not the only schools reaching high levels of achievement in algebra. In all, 202 of the 421 schools with students taking the algebra EOC had 75% or more students score proficient or advanced. Of these 203 schools, 130 are middle or junior high schools, while 72 are high schools.
Algebra I is generally taken during the ninth grade. However, some students may elect to take these courses earlier if they have the prerequisite knowledge. This may result in a small number of the most advanced students taking these exams in the 8th or 9th grade. For this reason, middle schools may have higher proficient and advanced scores than are found in high schools. In fact, over 50 middle or junior high schools had 100% of students score proficient or advanced, as presented in table 54.
Table 54: 100% Proficient and Advanced Based on EOC Algebra Achievement
School (District) Region Grades Served
# of Test Takers
% Proficient/ Advanced
Academic Center of Excellence (Osceola) NE 1-10 20 100 Ahlf Junior High (Searcy) NE 7-8 44 100 Atkins Middle (Atkins) NW 5-8 23 100 Barton Junior High (El Dorado) SW 7-8 69 100 Berryville Middle (Berryville) NW 6-8 27 100 Bethel Middle (Bryant) CN 6-8 48 100 Bismarck Middle (Bismarck) CN 5-8 26 100 Bob Courtway Middle (Conway) CN 7-8 58 100 Bryant Middle (Bryant) CN 6-8 86 100 Camden Fairview Middle (Camden-Fairview) SW 6-8 30 100 Carl Stuart Middle (Conway) CN 7-8 68 100 Cedarville Middle (Cedarville) NW 5-8 22 100 Dardanelle Middle (Dardanelle) NW 7-8 23 100 Dover Middle (Dover) NW 6-8 18 100 Elmwood Middle (Rogers) NW 8-9 71 100 Fouke Middle (Fouke) SW 6-8 24 100 Fountain Lake Elementary (Fountain Lake) CN K-8 30 100 Glen Rose Middle (Glen Rose) CN 5-8 13 100 Gravette Middle (Gravette) NW 6-8 30 100 Heber Springs Middle (Heber Springs) NE 6-8 35 100 Helen Tyson Middle (Springdale) NW 6-7 43 100 Hellstern Middle (Springdale) NW 6-7 40 100 Huntsville Middle (Huntsville) NW 7-8 26 100 J. O. Kelly Middle (Springdale) NW 6-7 40 100 Jesseville Middle (Jessieville) CN 6-8 29 100 Joe T. Robinson Middle (Pulaski) CN 6-8 59 100 Kirksey Middle (Rogers) NW 6-7 64 100 Lavaca Middle (Lavaca) NW 5-8 24 100

Outstanding Educational Performance Awards Page 39
School (District) Region Grades Served
# of Test Takers
% Proficient/ Advanced
Lincoln Junior High (Bentonville) NW 7-8 96 100 Lincoln Middle (Lincoln) NW 6-8 22 100 Lingle Middle (Rogers) NW 6-7 68 100 Lonoke Middle (Lonoke) CN 6-8 30 100 Malvern Junior High (Malvern) CN 7-8 17 100 Mann Magnet Middle (Little Rock) CN 6-8 84 100 McNair Middle (Fayetteville) NW 6-7 43 100 McRae Middle (Prescott) SW 5-8 27 100 Mena Middle (Mena) SW 6-8 37 100 Monticello Middle (Monticello) SE 6-8 43 100 Mountain View Middle (Mountain View) NE 6-8 32 100 Newport Junior High (Newport) NE 7-8 16 100 Owl Creek (Fayetteville) NW K-7 11 100 Paragould Junior High (Paragould) NE 7-8 67 100 Paris Middle School (Paris) NW 5-8 24 100 Prairie Grove Middle (Prairie Grove) NW 5-8 24 100 Randall G. Lynch Middle (Farmington) NW 5-8 27 100 Sheridan Middle (Sheridan) CN 6-8 51 100 Siloam Springs Middle (Siloam) NW 6-8 41 100 Southside Middle (Southside) NE 5-8 43 100 Star City Middle (Star City) SE 6-8 29 100 Stuttgart Junior High (Stuttgart) SE 7-8 21 100 Valley Springs Middle (Valley Springs) NW 5-8 36 100 Warren Middle (Warren) SE 6-8 18 100 Washington Junior High (Bentonville) NW 7-8 85 100 Yellville-Summit Middle (Yellville-Summit) NW 5-8 18 100 Yerger Junior High (Hope) SW 7-8 11 100
Outstanding Educational Performance Awards Page 40
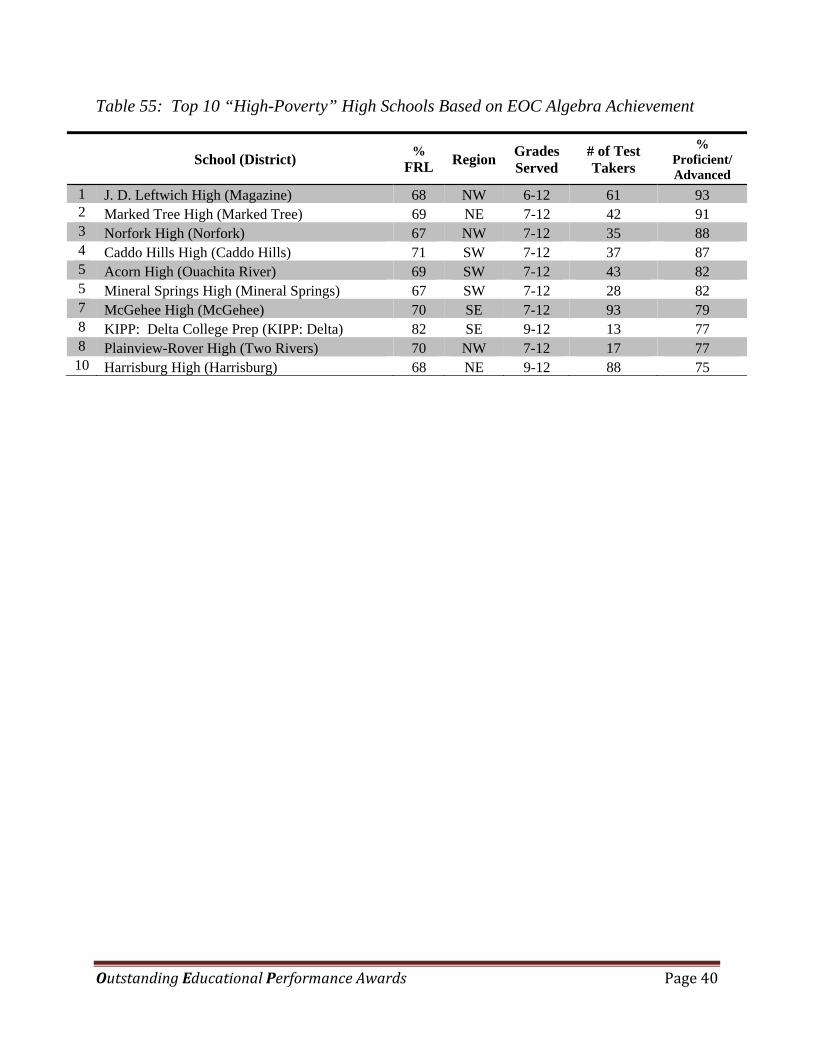
Table 55: Top 10 “High-Poverty” High Schools Based on EOC Algebra Achievement
School (District) %
FRL Region Grades Served
# of Test Takers
% Proficient/ Advanced
1 J. D. Leftwich High (Magazine) 68 NW 6-12 61 93 2 Marked Tree High (Marked Tree) 69 NE 7-12 42 91 3 Norfork High (Norfork) 67 NW 7-12 35 88 4 Caddo Hills High (Caddo Hills) 71 SW 7-12 37 87 5 Acorn High (Ouachita River) 69 SW 7-12 43 82 5 Mineral Springs High (Mineral Springs) 67 SW 7-12 28 82 7 McGehee High (McGehee) 70 SE 7-12 93 79 8 KIPP: Delta College Prep (KIPP: Delta) 82 SE 9-12 13 77 8 Plainview-Rover High (Two Rivers) 70 NW 7-12 17 77 10 Harrisburg High (Harrisburg) 68 NE 9-12 88 75

Outstanding Educational Performance Awards Page 41
Tables 56-60: Top 5 High Schools in Arkansas by Region, EOC Algebra Achievement
NORTHWEST REGION
School (District) # of Test Takers
% Proficient/ Advanced
Alpena High (Alpena)
38 94
J. D. Leftwich High (Magazine)
61 93
Bentonville High (Bentonville)
563 90
Bigelow High (East End)
47 89
Cotter High (Cotter)
45 89
NORTHEAST REGION
School (District) # of Test Takers
% Proficient/ Advanced
Searcy High (Searcy)
201 94
Marked Tree High (Marked Tree)
42 91
Valley View High (Valley View)
157 90
Cushman High (Cushman)
17 88
Mountain View High (Mountain View) 61 85
CENTRAL REGION
School (District) # of Test Takers
% Proficient/ Advanced
Poyen High (Poyen)
36 92
Bryant High (Bryant)
437 86
Sheridan High (Sheridan)
250 86
Bismarck High (Bismarck)
47 86
Ouachita High (Ouachita River)
25 84
SOUTHWEST REGION
School (District) # of Test Takers
% Proficient/ Advanced
Parkers Chapel High (Parkers Chapel)
50 96
Spring Hill High (Spring Hill)
36 92
Lockesburg High (DeQueen)
11 91
Taylor High (Emerson-Taylor)
23 91
Oden High (Ouachita River)
20 90
SOUTHEAST REGION
School (District) # of Test
Takers
% Proficient/ Advanced
Star City High (Star City)
106 81
McGehee High (McGehee)
93 79
Woodlawn High (Woodlawn)
51 79
KIPP: Delta College Prep (KIPP: Delta)
13 77
Stuttgart High (Stuttgart)
117 76

Outstanding Educational Performance Awards Page 42
B. Geometry End-of-Course Exam, 2009
Table 61: Top 20 High Schools in Arkansas, Geometry Achievement
School (District) Region Grades Served
# of Test Takers
% Proficient/ Advanced
1 Benton High (Benton) CN 10-12 232 98 2 KIPP: Delta College Prep (KIPP: Delta) SE 9-12 28 97 3 Paris High (Paris) NW 9-12 67 96 4 Searcy High (Searcy) NE 9-12 243 95 5 Jasper High (Jasper) NW 7-12 43 91 5 McCrory High (McCrory) NE 7-12 32 91 7 Bentonville High (Bentonville) NW 9-12 906 90 7 Dardanelle High (Dardanelle) NW 9-12 111 90 7 Haas Hall Academy (Haas Hall Academy) NW 9-12 39 90 10 Alpena High (Alpena) SE 7-12 45 89 10 Bryant High (Bryant) CN 9-12 415 89 10 Rison High (Cleveland County) NW 7-12 58 89 10 Wonderview High (Wonderview) NW 7-12 37 89 14 Caddo Hills High (Caddo Hills) SW 7-12 34 88 14 Centerpoint High (Centerpoint) SW 6-12 75 88 16 Academics Plus High (Academics Plus) CN 9-12 38 87 16 Des Arc High (Des Arc) SE 7-12 53 87 16 McGehee High (McGehee) NE 7-12 51 87 16 Salem High (Salem) SE 7-12 46 87 20 Norfork High (Norfork) NW 7-12 29 86 20 Parkers Chapel High ( Parkers Chapel) SW 7-12 41 86
These are not the only schools reaching high levels of achievement in geometry. In all, 111 of the 334 schools in which students took the geometry EOC, had 75% or more students score proficient or advanced. Geometry is generally taken during the tenth grade. However, some students may elect to take these courses earlier if they have the prerequisite knowledge. This may result in the most advanced students taking these exams in the 8th or 9th grade. For this reason, middle schools may have higher proficient and advanced scores because they have smaller numbers of advanced students taking the exam. In fact, of the 111 schools with 75% or more of students scoring proficient or advanced, 33 are middle or junior high schools, while 78 are high schools. Only one middle school did not have 75% or more students score proficient or advanced. Indeed, over 30 middle or junior high schools had 100% of students score proficient or advanced. These schools are presented in the following table.

Outstanding Educational Performance Awards Page 43
Table 62: 100% Proficient and Advanced Based on EOC Geometry Achievement
School (District) Region Grades Served
# of Test Takers
% Proficient/ Advanced
Booneville Junior High (Booneville) NW 7-9 25 100 Butterfield Junior High (Van Buren) NW 7-9 62 100 Cabot Junior High North (Cabot) CN 7-9 109 100 Cabot Junior High South (Cabot) CN 7-9 97 100 Carl Stuart Middle (Conway) CN 7-8 13 100 Central Junior High (Springdale) NW 8-9 42 100 Clarksville Junior High (Clarksville) NW 7-9 28 100 Coleman Junior High (Van Buren) NW 7-9 48 100 De Queen Middle (DeQueen) SW 6-9 22 100 Fuller Middle (Pulaski County) CN 6-8 34 100 Greene County Tech Junior High (Greene Co.) NE 8-9 43 100 Harrison Junior High (Harrison) NW 7-9 43 100 Henderson Middle (Little Rock) CN 6-8 11 100 Hot Springs Middle (Hot Springs) CN 6-8 15 100 L. A. Chaffin Junior High (Fort Smith) NW 7-9 60 100 Lake Hamilton Junior High (Lake Hamilton) CN 8-9 55 100 Lakeside Junior High (Lakeside) CN 8-9 79 100 Lakewood Middle (North Little Rock) CN 7-8 57 100 M. O. Ramay Junior High (Fayetteville) NW 8-9 76 100 Mann Magnet Middle (Little Rock) CN 6-8 14 100 Marion Junior High (Marion) NE 8-9 51 100 Nashville Junior High (Nashville) SW 7-9 25 100 Pleasant View Jr. High (Mulberry) NW 7-9 15 100 Pulaski Heights Middle (Little Rock) CN 6-8 14 100 Ramsey Junior High (Fort Smith) NW 7-9 41 100 Raymond E. Wells Junior High (Greenwood) NW 8-9 86 100 Ridgeroad Charter Middle (North Little Rock) CN 7-8 14 100 Russellville Junior High (Russelville) NW 8-9 86 100 Southwest Junior High (Springdale) NW 8-9 30 100 Vilonia Junior High (Vilonia) CN 8-9 41 100 White Hall Junior High (White Hall) CN 7-9 36 100 Woodland Junior High (Fayetteville) NW 8-9 133 100

Outstanding Educational Performance Awards Page 44
Table 63: Top 10 “High-Poverty” High Schools Based on EOC Geometry Achievement
School (District) %
FRL Region Grades Served
# of Test Takers
% Proficient/ Advanced
1 KIPP: Delta College Prep (KIPP: Delta) 82 SE 9-12 28 97 2 Caddo Hills High (Caddo Hills) 71 SW 7-12 34 88 3 McGehee High (McGehee) 70 SE 7-12 51 87 4 Norfork High (Norfork) 67 NW 7-12 29 86 5 Marked Tree High (Marked Tree) 69 NE 7-12 37 76 6 Acorn High (Ouachita River) 69 SW 7-12 36 75 6 Bruno-Pyatt High (Ozark Mountain) 76 NW 7-12 16 75 8 Umpire High (Wickes) 100 SW 7-12 15 74 9 Western Grove High (Ozark Mountain) 72 NW 7-12 15 73 10 Maynard High (Maynard) 68 NE 7-12 65 71

Outstanding Educational Performance Awards Page 45
Table 64-68: Top 5 High Schools in Arkansas by Region, Geometry Achievement
NORTHWEST REGION
School (District) # of Test Takers
% Proficient/ Advanced
Paris High (Paris)
67 96
Jasper High (Jasper)
43 91
Dardanelle High (Dardanelle)
906 90
Bentonville High (Bentonville)
111 90
Haas Hall Academy (Haas Hall)
39 90
NORTHEAST REGION
School (District) # of Test Takers
% Proficient/ Advanced
Searcy High (Searcy)
243 95
McCrory High (McCrory)
32 91
Salem High (Salem)
46 87
Heber Springs High (Heber Springs) 130 85
Viola High (Viola)
27 85
CENTRAL REGION
School (District) # of Test Takers
% Proficient/ Advanced
Benton High (Benton)
232 98
Bryant High (Bryant)
415 89
Academics Plus High (Academics Plus)
38 87
Sheridan High (Sheridan)
259 85
Conway 569 81 Magnet Cove High 71 81
SOUTHWEST REGION
School (District) # of Test Takers
% Proficient/ Advanced
Caddo Hills High (Caddo Hills)
34 88
Centerpoint High (Centerpoint)
75 88
Parkers Chapel High (Parkers Chapel)
41 86
Spring Hill High (Spring Hill)
46 85
Genoa Central High (Genoa)
58 81
SOUTHEAST REGION
School (District) # of Test
Takers
% Proficient/ Advanced
KIPP: Delta College Prep (KIPP: Delta)
28 97
Rison High (Cleveland County)
58 89
McGehee High (McGehee)
53 87
Des Arc High (Des Arc)
51 87
Gillett High (DeWitt)
19 79
Outstanding Educational Performance Awards Page 46
Several schools deserve special recognition for overall math achievement. These high schools were in the state’s top 20 in both algebra and geometry: Parkers Chapel, Alpena, Searcy, Bentonville, Norfork, Caddo Hills, and Bryant. Caddo and Norfork achieved this high standard even while serving populations with more than 66% of students eligible for free or reduced price lunches. Therefore, they also appear on the algebra and geometry “high-poverty” top ten lists. Four other schools appear on both of these “high-poverty” lists: Marked Tree, Acorn, McGehee, and KIPP: Delta College Prep. These schools are not allowing poverty to be an obstacle to high achievement and should be proud of these results.

Outstanding Educational Performance Awards Page 47
C. Biology End-of-Course Exam, 2009
The percentage of students scoring proficient or advanced in biology was significantly lower than the other three examinations. In biology the state mean percentage for proficient and advanced was below 40%. This compares with a mean of over 70% in algebra, over 65% in geometry, and over 50% in literacy. Regardless of the fact that fewer Arkansas students overall reached proficient or advanced on this relatively new state-wide exam, there are many schools whose performance stood out among the rest. Indeed, as in other exams, some of the highest achieving schools educated some of Arkansas’ poorest students. Table 69 presents the top 20 high schools in Arkansas, based on overall biology achievement. We also highlight the top performing “high poverty” schools (schools serving 66% or more students eligible for the free/reduced lunch program), and the top schools in each region.
Table 69: Top 20 High Schools in Arkansas Based on EOC Biology Achievement
School (District) RegionGrades Served
# of Test Takers
% Proficient/ Advanced
1 Haas Hall Academy (Haas Hall Academy) NW 9-12 29 93 2 Taylor High (Emerson-Taylor) SW 7-12 20 85 3 Brookland High (Brookland) NE 9-12 100 75 3 Jessieville High (Jessieville) CN 9-12 74 75 5 Scranton High (Scranton) NW 7-12 27 74 6 South Side High (South Side) NW 7-12 26 73 7 Bentonville High (Bentonville) NW 9-12 839 71 8 Dardanelle High (Dardanelle) NW 9-12 108 69 8 Searcy High (Searcy) NE 9-12 259 69 10 Yellville-Summit High (Yellville-Summit) NW 9-12 76 67 11 Kingston High (Kingston) NW 7-12 12 66 11 Southside High (Southside) NW 10-12 488 66 13 Calico Rock High (Calico Rock) NE 7-12 32 65 14 Conway High East (Conway) CN 9-10 693 64 14 Deer High (Deer/Mt. Judea) NW 7-12 14 64 14 Mountain View High School (Mountain View) NE 7-12 80 64 14 Benton High School (Benton) CN 10-12 289 64 18 Cabot High School (Cabot) CN 10-12 617 63 18 Heritage High School (Rogers) NW 9-12 209 63 20 Cotter High School (Cotter) NW 7-12 50 62 20 Omaha High (Omaha) NW 7-12 29 62
Outstanding Educational Performance Awards Page 48
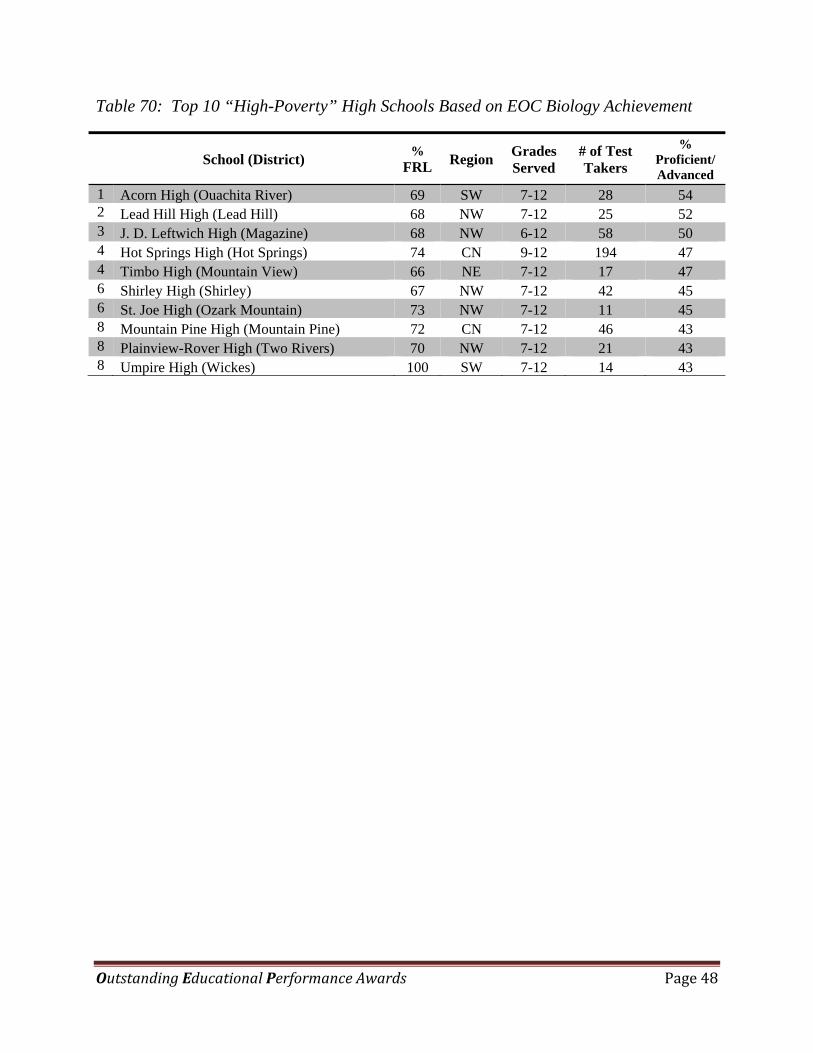
Table 70: Top 10 “High-Poverty” High Schools Based on EOC Biology Achievement
School (District) %
FRL Region Grades Served
# of Test Takers
% Proficient/ Advanced
1 Acorn High (Ouachita River) 69 SW 7-12 28 54 2 Lead Hill High (Lead Hill) 68 NW 7-12 25 52 3 J. D. Leftwich High (Magazine) 68 NW 6-12 58 50 4 Hot Springs High (Hot Springs) 74 CN 9-12 194 47 4 Timbo High (Mountain View) 66 NE 7-12 17 47 6 Shirley High (Shirley) 67 NW 7-12 42 45 6 St. Joe High (Ozark Mountain) 73 NW 7-12 11 45 8 Mountain Pine High (Mountain Pine) 72 CN 7-12 46 43 8 Plainview-Rover High (Two Rivers) 70 NW 7-12 21 43 8 Umpire High (Wickes) 100 SW 7-12 14 43

Outstanding Educational Performance Awards Page 49
Tables 71-75: Top 5 High Schools in Arkansas By Region, Biology Achievement
NORTHWEST REGION
School (District) # of Test Takers
% Proficient/ Advanced
Haas Hall Academy (Haas Hall)
29 93
Scranton High (Scranton)
27 74
South Side High (South Side)
19 73
Bentonville High (Bentonville)
839 71
Dardanelle High (Dardanelle) 108 69
NORTHEAST REGION
School (District) # of Test Takers
% Proficient/ Advanced
Brookland High (Brookland)
100 75
Searcy High (Searcy)
259 69
Calico Rock High (Calico Rock)
32 65
Mountain View High (Mountain View)
80 64
Pocahontas High 139 59 Valley View High 154 59
CENTRAL REGION
School (District) # of Test Takers
% Proficient/ Advanced
Jessieville High 74 75 Conway East High 693 64 Benton High 289 64 Cabot High 617 63 Bauxite High 99 56 Greenbrier High 199 56 Magnet Cove High 66 56 Ouachita High 32 56
SOUTHWEST REGION
School (District) # of Test Takers
% Proficient/ Advanced
Taylor High (Emerson-Taylor)
20 85
Mena High (Mena)
146 60
Acorn High (Ouachita River)
28 54
Horatio High (Horatio)
60 54
Parkers Chapel High (Parkers Chapel)
53 53
SOUTHEAST REGION
School (District) # of Test
Takers
% Proficient/ Advanced
Woodlawn High (Woodlawn)
47 58
Gillet High (DeWitt)
14 50
Des Arc High (Des Arc)
51 49
Rison High (Cleveland County)
49 47
Monticello High (Monticello)
149 46

Outstanding Educational Performance Awards Page 50
D. Grade 11 Literacy Exam, 2009
In literacy, the state mean percentage for proficient and advanced was over 50%. Many schools’ performance stood out among the rest. Indeed, as in other exams, some of the highest achieving schools educated some of Arkansas’ poorest students. Table 76 presents the top 20 high schools in Arkansas based on overall literacy achievement. We also highlight the top performing “high poverty” schools (schools serving 66% or more students eligible for the free/reduced lunch program), and the top schools in each region.
Table 76: Top 20 High Schools in Arkansas Based on Grade 11 Literacy Achievement
School (District) Region Grades Served
# of Test Takers
% Proficient/ Advanced
1 AR School for Math, Sciences, and the Arts CN 11-12 106 99 2 Haas Hall Academy (Haas Hall Academy) NW 9-12 15 94 3 KIPP: Delta College Prep (KIPP: Delta) SE 9-12 23 91 4 Bentonville High (Bentonville) NW 9-12 724 85 4 Weiner High (Weiner) NE 7-12 26 85 6 Lisa Academy High (Lisa Academy) CN 9-12 29 83 6 Taylor High (Emerson-Taylor) SW 7-12 24 83 8 Valley View High (Valley View) NE 7-12 138 81 9 Calico Rock High (Calico Rock) NE 7-12 29 79 9 Searcy High (Searcy) NE 9-12 255 79 9 Valley Springs High (Valley Springs) NW 9-12 76 79
12 Highland High (Highland) NE 8-12 115 78 13 Greenwood High (Greenwood) NW 10-12 242 77 13 Marked Tree High (Marked Tree) NE 7-12 35 77 15 Izard Co. Cons. High (Izard Co. Cons.) NE 9-12 30 76 15 Lakeside High (Lakeside) CN 9-12 211 76 15 Norfork High (Norfork) NW 7-12 40 76 15 Ouachita High (Ouachita) CN 7-12 33 76 19 Benton High (Benton) CN 10-12 283 75 19 Gravette High (Gravette) NW 9-12 111 75 19 Melbourne High (Melbourne NE 7-12 72 75 19 Parkview Magnet High (Little Rock) CN 9-12 106 75

Outstanding Educational Performance Awards Page 51
Table 77: Top 10 “High-Poverty” High Schools in Arkansas Based on Grade 11 Literacy Achievement
School (District) %
FRL RegionGrades Served
# of Test Takers
% Proficient/ Advanced
1 KIPP: Delta College Prep (KIPP: Delta) 82 SE 9-12 23 91 2 Marked Tree High (Marked Tree) 69 NE 7-12 35 77 3 Norfork High (Norfork) 67 NW 7-12 40 76 4 Harrisburg High (Harrisburg) 68 NE 9-12 86 68 5 Fourche Valley High (Two Rivers) 69 NW 7-12 12 67 6 Shirley High (Shirley) 67 NW 7-12 44 66 7 Marshall High (Searcy County) 69 NW 7-12 51 61 8 Mountain Pine High (Mountain Pine) 72 CN 7-12 47 60 9 Bruno-Pyatt High (Ozark Mountain) 76 NW 7-12 21 57 9 Cross County High (Cross County) 69 NE 7-12 44 57 9 Western Grove High (Ozark Mountain) 72 NW 7-12 23 57
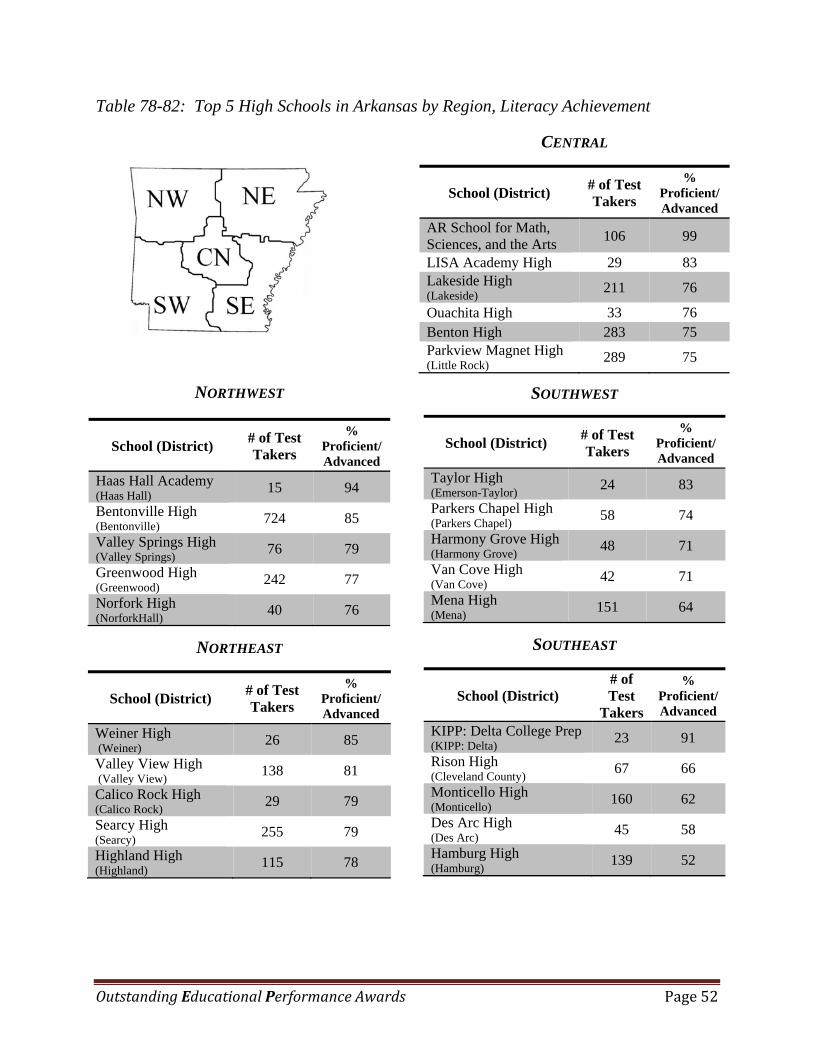
Outstanding Educational Performance Awards Page 52
Table 78-82: Top 5 High Schools in Arkansas by Region, Literacy Achievement
NORTHWEST
School (District) # of Test Takers
% Proficient/ Advanced
Haas Hall Academy (Haas Hall)
15 94
Bentonville High (Bentonville)
724 85
Valley Springs High (Valley Springs)
76 79
Greenwood High (Greenwood)
242 77
Norfork High (NorforkHall)
40 76
NORTHEAST
School (District) # of Test Takers
% Proficient/ Advanced
Weiner High (Weiner)
26 85
Valley View High (Valley View)
138 81
Calico Rock High (Calico Rock)
29 79
Searcy High (Searcy)
255 79
Highland High (Highland) 115 78
CENTRAL
School (District) # of Test Takers
% Proficient/ Advanced
AR School for Math, Sciences, and the Arts
106 99
LISA Academy High 29 83 Lakeside High (Lakeside)
211 76
Ouachita High 33 76 Benton High 283 75 Parkview Magnet High (Little Rock)
289 75
SOUTHWEST
School (District) # of Test Takers
% Proficient/ Advanced
Taylor High (Emerson-Taylor)
24 83
Parkers Chapel High (Parkers Chapel)
58 74
Harmony Grove High (Harmony Grove)
48 71
Van Cove High (Van Cove)
42 71
Mena High (Mena)
151 64
SOUTHEAST
School (District) # of Test
Takers
% Proficient/ Advanced
KIPP: Delta College Prep (KIPP: Delta)
23 91
Rison High (Cleveland County)
67 66
Monticello High (Monticello)
160 62
Des Arc High (Des Arc)
45 58
Hamburg High (Hamburg)
139 52

Outstanding Educational Performance Awards Page 53
E. EOC Summary
There were many schools that demonstrated excellence in academics on each of the examinations. However, only two schools were in the top twenty on all four exams: Bentonville High and Searcy High. Searcy ranked second in algebra, fourth in geometry, eighth in biology, and ninth in literacy. Bentonville ranked tenth in algebra, seventh in geometry, seventh in biology, and fourth in literacy. Also doing a commendable job were the following schools: Benton High, Haas Hall Academy, Norfork High, and Taylor High. These schools were in the top twenty on three of the four examinations.
Six other schools stood out in their respective regions. Searcy High ranked in the top five in the Northeast region on all four examinations, while Valley View High placed in three of the lists. In the Central region, Ouachita High placed in three of the top five lists. On all four examinations, Parkers Chapel High earned a spot in the top five of the Southwest region; Taylor High made it on three. Three schools from the Southeast were in the top five on three of the examinations: KIPP: Delta, Rison High, and Des Arc High.
Overall, the Office for Education Policy is happy to recognize the hard work done by high school students and teachers across the state and we look forward to highlighting even better results for our high school students in 2009-10.
Outstanding Educational Performance Awards Page 54
VI. OEP AWARDS: MOST IMPROVED SCHOOLS BETWEEN 2008 AND
2009
To be released in November.
This section will highlight the schools that have shown
the greatest improvement in performance between
2008 and 2009.

Outstanding Educational Performance Awards Page 55
APPENDIX
A. Methods
The Office for Education Policy strives to make all of our calculations and publications transparent to our readers. Thus, in this appendix we describe our data source, calculations performed on these data for the purposes of our reporting, and our method for determining a school’s classification as an elementary, middle, or high school.
All data used in this report were obtained from the Arkansas Department of Education. Benchmark and End-of-Course exam scores were obtained from the testing section (http://arkansased.org/testing/test_scores.html). Other data, such as the percent of students eligible for free and reduced lunch, were obtained from the Arkansas Department of Education Data Center (http://adedata.arkansas.gov).
All data were analyzed at the school level; however, the ADE provided the percentage of scores at the proficient and advanced level by grade. Therefore, in order to present an accurate school-level percentage of students scoring proficient and advanced across all grades, a weighted average for each school was calculated to account for different levels of enrollment at each grade level. In an effort to highlight schools that were strong in both subject areas, we calculated a simple average of the school level percent proficient and advanced in math and literacy at the elementary and middle school level, and in all End-of-Course subjects at the high school level, to measure overall performance for each school.
Schools are divided into two school types: elementary schools and middle schools. However, elementary schools and middle schools can be labeled differently, as there is not a specific way to name or to structure the grades in a school. Rather than comparing schools based on their name, we attempted to sort the schools by the grades served at each school. For the purpose of this report, we classify schools that serve students in grades K-5 as elementary schools and schools that serve students in grades 6-8 as middle schools.
Of course, not every elementary and middle school fits this rule. For all other grade combinations, we identify the school as elementary or middle based on the grades the school primarily serves. For example, if a school serves grades four through six, we classify that school as an elementary school. Based on our rule, two grades (grades four and five) are at the elementary level, and one grade (grade six) is at the middle school level. A school that has the same number of elementary and middle school grades is classified as a middle school. For example, a school with grades five and six is considered a middle school in this report.
Additionally, you may see a high school on the middle school list. This is because some high schools serve grades seven and eight as well. The Benchmark score for any high school on the middle school list is the average of grades seven and/or eight only. Any school administering End-of-Course examinations is considered as part of the high school section of this report.
The goal of this categorization scheme is to ensure, to the extent possible, that similar schools are compared to each other. Of course, it is difficult to create a perfect “rule.” These guidelines were used to simply provide as much consistency as possible when comparing Benchmark performance.
Outstanding Educational Performance Awards Page 56
B. Compete School List
To view the scores of all schools in Arkansas, visit: http://www.uark.edu/ua/oep/AER/6_2_Outstanding_Educational_Performance_Awards_Appendix.pdf