Embed Size (px)
Citation preview
ARKANSAS EDUCATION REPORT
Volume 17, Issue 1
OUTSTANDING EDUCATIONAL PERFORMANCE AWARDS:
HIGHLIGHTING HIGH-GROWTH ARKANSAS SCHOOLS, 2019
BEATING THE ODDS: HIGH-GROWTH SCHOOLS
BASED ON THE ACT ASPIRE EXAMINATIONS,
SERVING LOW-INCOME COMMUNITIES
November 13, 2019 By:
Charlene A. Reid
Sarah C. McKenzie
Office for Education Policy
University of Arkansas
214 Graduate Education Building
Fayetteville, AR 72701
Phone: (479) 575-3773
Fax: (479) 575-3196
E-mail: [email protected]
Outstanding Educational Performance Awards 2019 Page ii
TABLE OF CONTENTS
Introduction ................................................................................................................................1
IV. 2019 OEP Awards: Beating the Odds – High-Growth schools, based on the ACT Aspire
examinations, serving Low Income Communities...................................................................... 42
J. Elementary Schools “Beating the Odds” ............................................................................ 43
Beating the Odds: Overall ACT Aspire, 2019 .................................................................... 43
Beating the Odds: Math ACT Aspire, 2019 ....................................................................... 44
Beating the Odds: ELA ACT Aspire, 2019 ........................................................................ 48
K. Middle Schools “Beating the Odds” .................................................................................. 52
Beating the Odds: Overall ACT Aspire, 2019 .................................................................... 52
Beating the Odds: Math ACT Aspire, 2019 ....................................................................... 53
Beating the Odds: ELA ACT Aspire, 2019 ........................................................................ 57
L. High Schools “Beating the Odds” ..................................................................................... 61
Beating the Odds: Overall ACT Aspire, 2019 .................................................................... 61
Beating the Odds: Math ACT Aspire, 2019 ....................................................................... 62
Beating the Odds: ELA ACT Aspire, 2019 ........................................................................ 66
Appendix ................................................................................................................................. A1
Outstanding Educational Performance Awards 2019 Page 1
INTRODUCTION
The mission of the Office for Education Policy is to examine educational issues through the lens
of academic research and disseminate our findings to educators, policymakers, and other
stakeholders around Arkansas. Annually, we highlight excellent schools around the state in our
Outstanding Educational Performance Awards, or the OEP awards.
This edition of the OEP Awards highlights schools in Arkansas based on student growth on the
ACT Aspire exams in Mathematics and English Language Arts (ELA). This is a departure from
prior awards, which were based on student proficiency.
We choose to focus on student growth for these OEP awards because we think it is a better
reflection than proficiency rates of how the school is impacting students. Growth is calculated at
the student level, and essentially reflects how much a student improved his or her score from the
prior year compared to what was predicted based on prior achievement history. Proficiency
rates, even those that move beyond the ‘percent proficient’ like our OEP GPA and Arkansas’
weighted achievement score, are more correlated with student demographics than growth scores.
This means that schools can demonstrate high student growth regardless of the characteristics of
the students that they serve.
In the 2018-19 academic year, ACT Aspire examinations were administered to students in grades
3 through 10 in Math, Reading, Writing, English and Science. For the purposes of this report, the
scores obtained in Reading, Writing and English were combined to create a combined ELA
score.
For the purposes of these awards, we are using the content-area growth calculated and reported
by the Arkansas Department of Education (ADE). Note that we used only growth for math and
English Language Arts, excluding the growth score for English Learner progress to English
Language Proficiency). In addition, we identify the highest growth schools by school level as
identified by the ADE under Arkansas’ ESSA Plan: Elementary, Middle, and High school level.
In this report, we present a list of the top 20 schools in the state for Overall growth (average of
Math and ELA growth), Math growth, and ELA growth. In some cases, these “top 20 lists” will
contain more than 20 schools as some schools’ growth scores will be identical. This is not a new
phenomenon, as we also exceeded 20 schools in previous reports when using the OEP GPA as an
indicator for student achievement.
In the following weeks, we will focus on high-growth elementary schools, middle schools, and
high schools in the various regions across the state. We will conclude this edition of the report by
highlighting schools that are beating the odds (that is, schools that have high levels of student
growth while serving a high percentage of low-income students).
We are pleased to be able to highlight how students are growing academically in schools across
the state, and hope the information will spark discussion among stakeholders about how to
ensure all schools are growing the knowledge of Arkansas students.
Outstanding Educational Performance Awards 2019 Page 42
IV. 2019 OEP AWARDS: BEATING THE ODDS – HIGH-GROWTH
SCHOOLS, BASED ON THE ACT ASPIRE EXAMINATIONS, SERVING LOW
INCOME COMMUNITIES
This section highlights high-growth schools across Arkansas based on the ACT Aspire
examinations in Math and English Language Arts (ELA) for the 2018-2019 academic year. For
these awards, we consider schools that serve free or reduced lunch to at least 66% of the student
body.
High-poverty schools are ranked by school level (Elementary, Middle, or High) based on Overall
Growth (Math and ELA combined), as well as for growth in each content area independently.
High-poverty schools are also ranked within each region of the state. Tables include the region in
which the school is located, the number of test takers and the growth score of that school in the
relevant content area.
Outstanding Educational Performance Awards 2019 Page 43
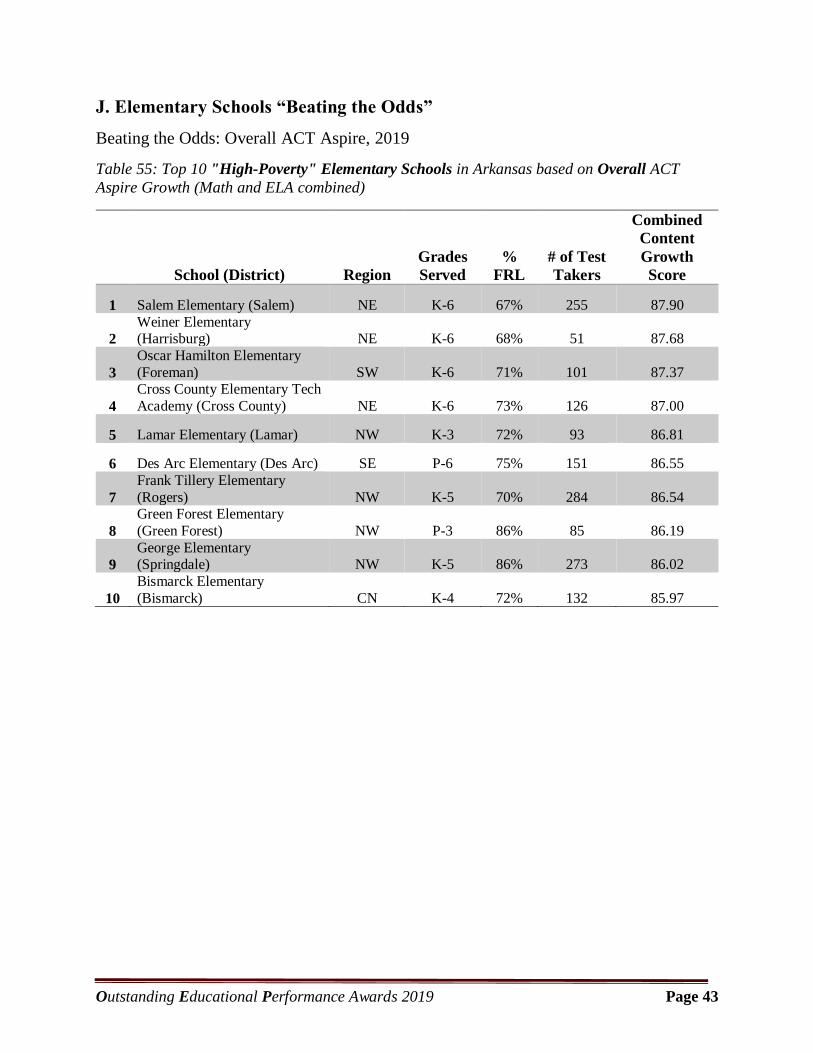
J. Elementary Schools “Beating the Odds”
Beating the Odds: Overall ACT Aspire, 2019
Table 55: Top 10 "High-Poverty" Elementary Schools in Arkansas based on Overall ACT
Aspire Growth (Math and ELA combined)
School (District) Region
Grades
Served
%
FRL
# of Test
Takers
Combined
Content
Growth
Score
1 Salem Elementary (Salem) NE K-6 67% 255 87.90
2
Weiner Elementary (Harrisburg) NE K-6 68% 51 87.68
3
Oscar Hamilton Elementary
(Foreman) SW K-6 71% 101 87.37
4
Cross County Elementary Tech
Academy (Cross County) NE K-6 73% 126 87.00
5 Lamar Elementary (Lamar) NW K-3 72% 93 86.81
6 Des Arc Elementary (Des Arc) SE P-6 75% 151 86.55
7
Frank Tillery Elementary
(Rogers) NW K-5 70% 284 86.54
8
Green Forest Elementary
(Green Forest) NW P-3 86% 85 86.19
9
George Elementary (Springdale) NW K-5 86% 273 86.02
10
Bismarck Elementary
(Bismarck) CN K-4 72% 132 85.97
Outstanding Educational Performance Awards 2019 Page 44
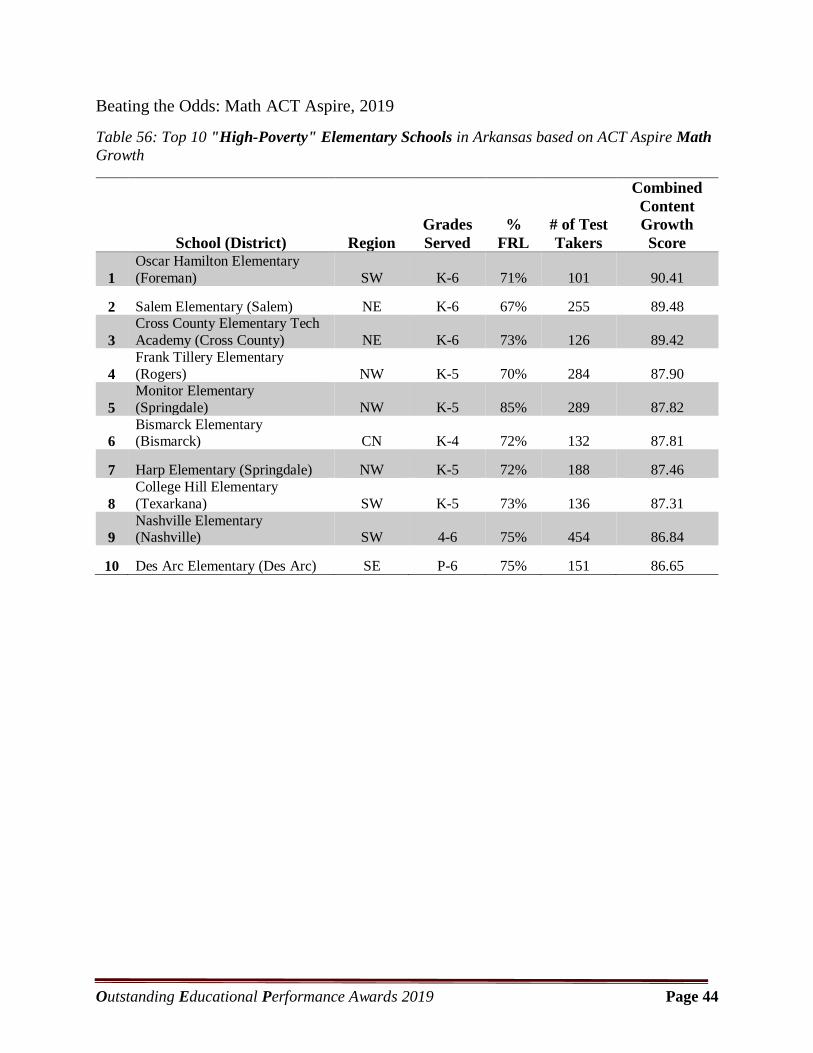
Beating the Odds: Math ACT Aspire, 2019
Table 56: Top 10 "High-Poverty" Elementary Schools in Arkansas based on ACT Aspire Math
Growth
School (District) Region
Grades
Served
%
FRL
# of Test
Takers
Combined
Content
Growth
Score
1
Oscar Hamilton Elementary
(Foreman) SW K-6 71% 101 90.41
2 Salem Elementary (Salem) NE K-6 67% 255 89.48
3
Cross County Elementary Tech
Academy (Cross County) NE K-6 73% 126 89.42
4
Frank Tillery Elementary
(Rogers) NW K-5 70% 284 87.90
5
Monitor Elementary
(Springdale) NW K-5 85% 289 87.82
6
Bismarck Elementary (Bismarck) CN K-4 72% 132 87.81
7 Harp Elementary (Springdale) NW K-5 72% 188 87.46
8
College Hill Elementary
(Texarkana) SW K-5 73% 136 87.31
9
Nashville Elementary (Nashville) SW 4-6 75% 454 86.84
10 Des Arc Elementary (Des Arc) SE P-6 75% 151 86.65
Outstanding Educational Performance Awards 2019 Page 45
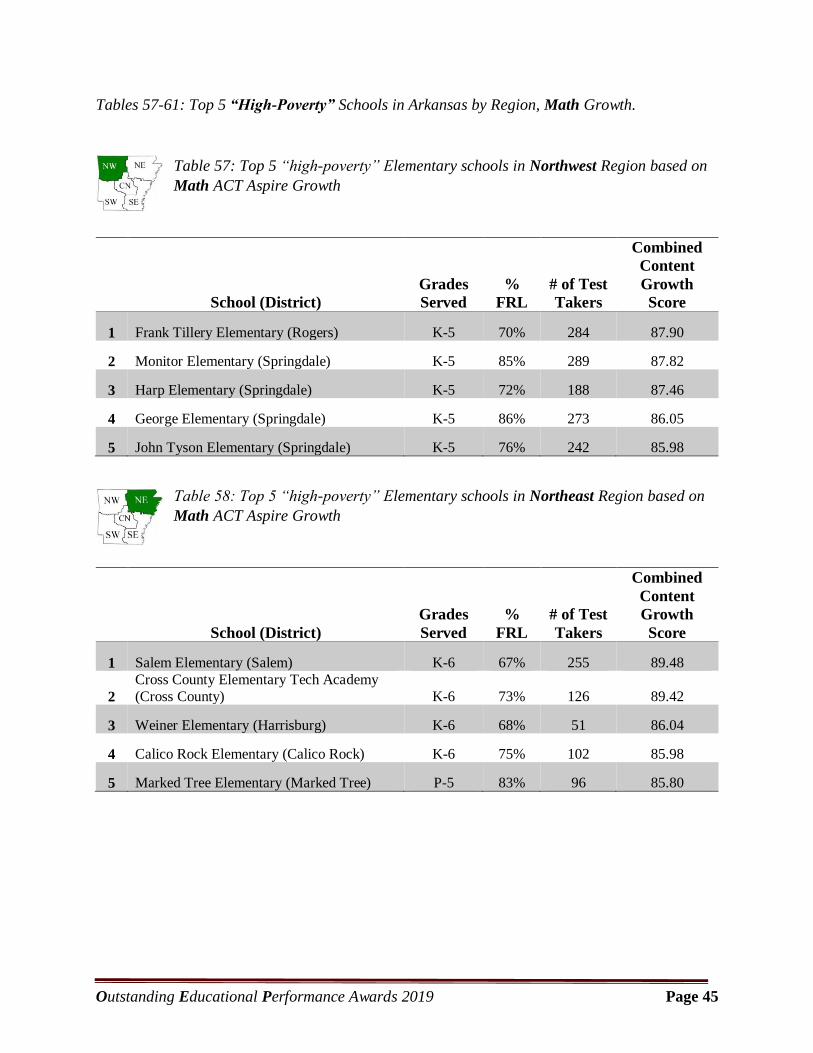
Tables 57-61: Top 5 “High-Poverty” Schools in Arkansas by Region, Math Growth.
Table 57: Top 5 “high-poverty” Elementary schools in Northwest Region based on
Math ACT Aspire Growth
School (District)
Grades
Served
%
FRL
# of Test
Takers
Combined
Content
Growth
Score
1 Frank Tillery Elementary (Rogers) K-5 70% 284 87.90
2 Monitor Elementary (Springdale) K-5 85% 289 87.82
3 Harp Elementary (Springdale) K-5 72% 188 87.46
4 George Elementary (Springdale) K-5 86% 273 86.05
5 John Tyson Elementary (Springdale) K-5 76% 242 85.98
Table 58: Top 5 “high-poverty” Elementary schools in Northeast Region based on
Math ACT Aspire Growth
School (District)
Grades
Served
%
FRL
# of Test
Takers
Combined
Content
Growth
Score
1 Salem Elementary (Salem) K-6 67% 255 89.48
2
Cross County Elementary Tech Academy
(Cross County) K-6 73% 126 89.42
3 Weiner Elementary (Harrisburg) K-6 68% 51 86.04
4 Calico Rock Elementary (Calico Rock) K-6 75% 102 85.98
5 Marked Tree Elementary (Marked Tree) P-5 83% 96 85.80
Outstanding Educational Performance Awards 2019 Page 46
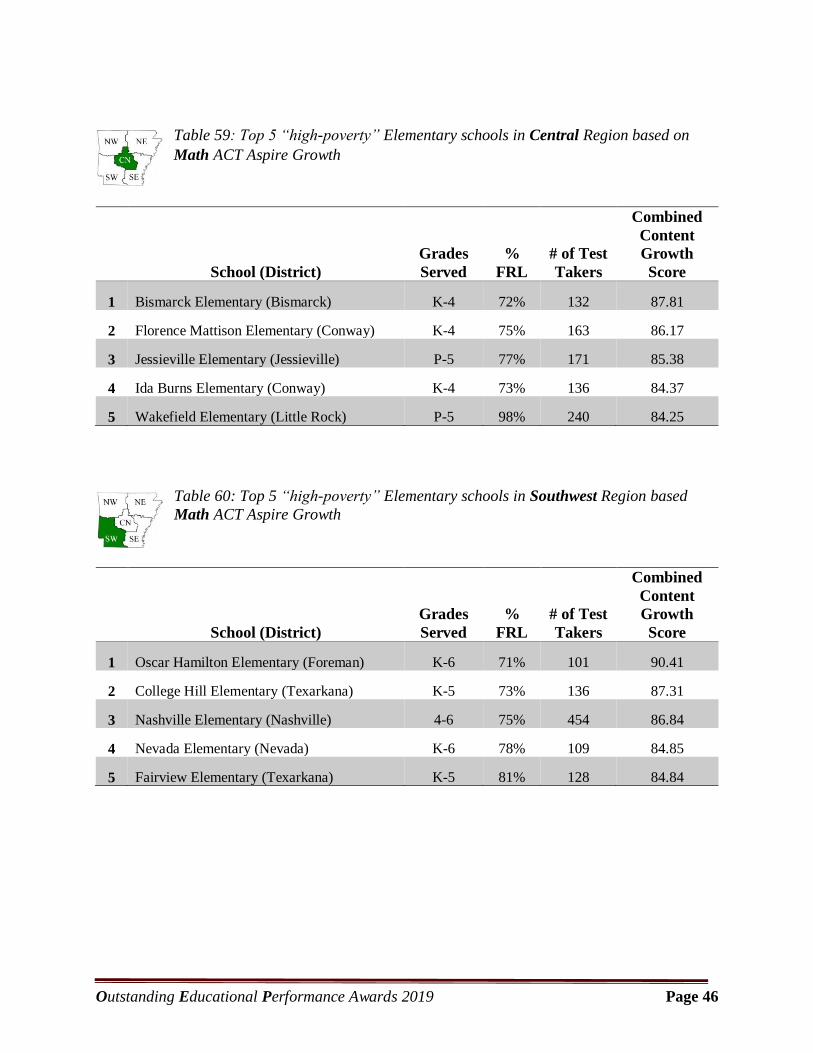
Table 59: Top 5 “high-poverty” Elementary schools in Central Region based on
Math ACT Aspire Growth
School (District)
Grades
Served
%
FRL
# of Test
Takers
Combined
Content
Growth
Score
1 Bismarck Elementary (Bismarck) K-4 72% 132 87.81
2 Florence Mattison Elementary (Conway) K-4 75% 163 86.17
3 Jessieville Elementary (Jessieville) P-5 77% 171 85.38
4 Ida Burns Elementary (Conway) K-4 73% 136 84.37
5 Wakefield Elementary (Little Rock) P-5 98% 240 84.25
Table 60: Top 5 “high-poverty” Elementary schools in Southwest Region based
Math ACT Aspire Growth
School (District)
Grades
Served
%
FRL
# of Test
Takers
Combined
Content
Growth
Score
1 Oscar Hamilton Elementary (Foreman) K-6 71% 101 90.41
2 College Hill Elementary (Texarkana) K-5 73% 136 87.31
3 Nashville Elementary (Nashville) 4-6 75% 454 86.84
4 Nevada Elementary (Nevada) K-6 78% 109 84.85
5 Fairview Elementary (Texarkana) K-5 81% 128 84.84
Outstanding Educational Performance Awards 2019 Page 47
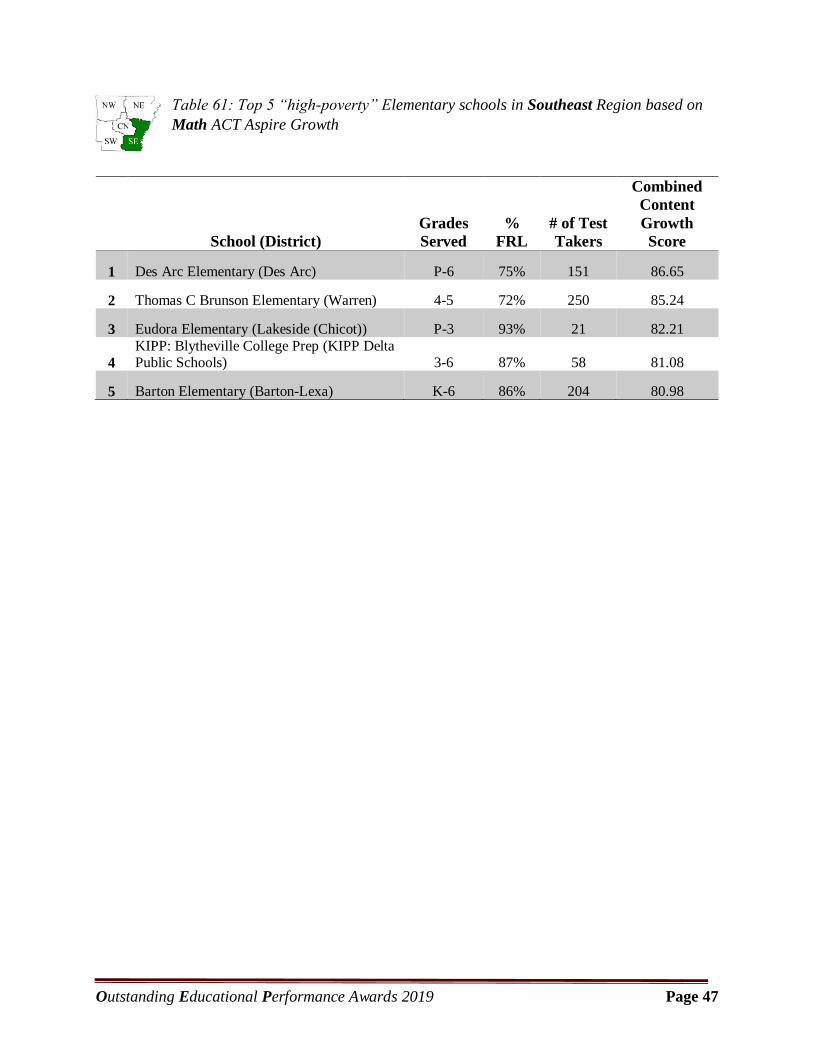
Table 61: Top 5 “high-poverty” Elementary schools in Southeast Region based on
Math ACT Aspire Growth
School (District)
Grades
Served
%
FRL
# of Test
Takers
Combined
Content
Growth
Score
1 Des Arc Elementary (Des Arc) P-6 75% 151 86.65
2 Thomas C Brunson Elementary (Warren) 4-5 72% 250 85.24
3 Eudora Elementary (Lakeside (Chicot)) P-3 93% 21 82.21
4
KIPP: Blytheville College Prep (KIPP Delta Public Schools) 3-6 87% 58 81.08
5 Barton Elementary (Barton-Lexa) K-6 86% 204 80.98
Outstanding Educational Performance Awards 2019 Page 48
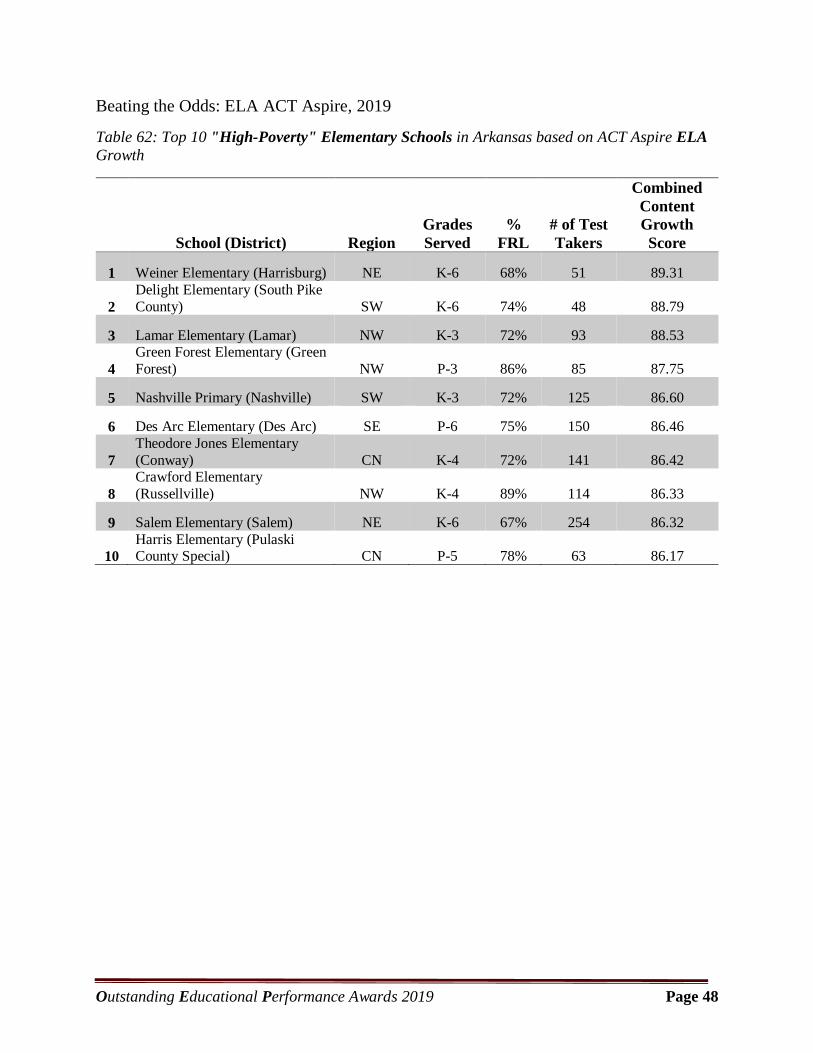
Beating the Odds: ELA ACT Aspire, 2019
Table 62: Top 10 "High-Poverty" Elementary Schools in Arkansas based on ACT Aspire ELA
Growth
School (District) Region
Grades
Served
%
FRL
# of Test
Takers
Combined
Content
Growth
Score
1 Weiner Elementary (Harrisburg) NE K-6 68% 51 89.31
2
Delight Elementary (South Pike
County) SW K-6 74% 48 88.79
3 Lamar Elementary (Lamar) NW K-3 72% 93 88.53
4
Green Forest Elementary (Green
Forest) NW P-3 86% 85 87.75
5 Nashville Primary (Nashville) SW K-3 72% 125 86.60
6 Des Arc Elementary (Des Arc) SE P-6 75% 150 86.46
7
Theodore Jones Elementary
(Conway) CN K-4 72% 141 86.42
8
Crawford Elementary
(Russellville) NW K-4 89% 114 86.33
9 Salem Elementary (Salem) NE K-6 67% 254 86.32
10
Harris Elementary (Pulaski County Special) CN P-5 78% 63 86.17
Outstanding Educational Performance Awards 2019 Page 49
Tables 63-67: Top 5 “High-Poverty” Schools in Arkansas by Region, ELA Growth.
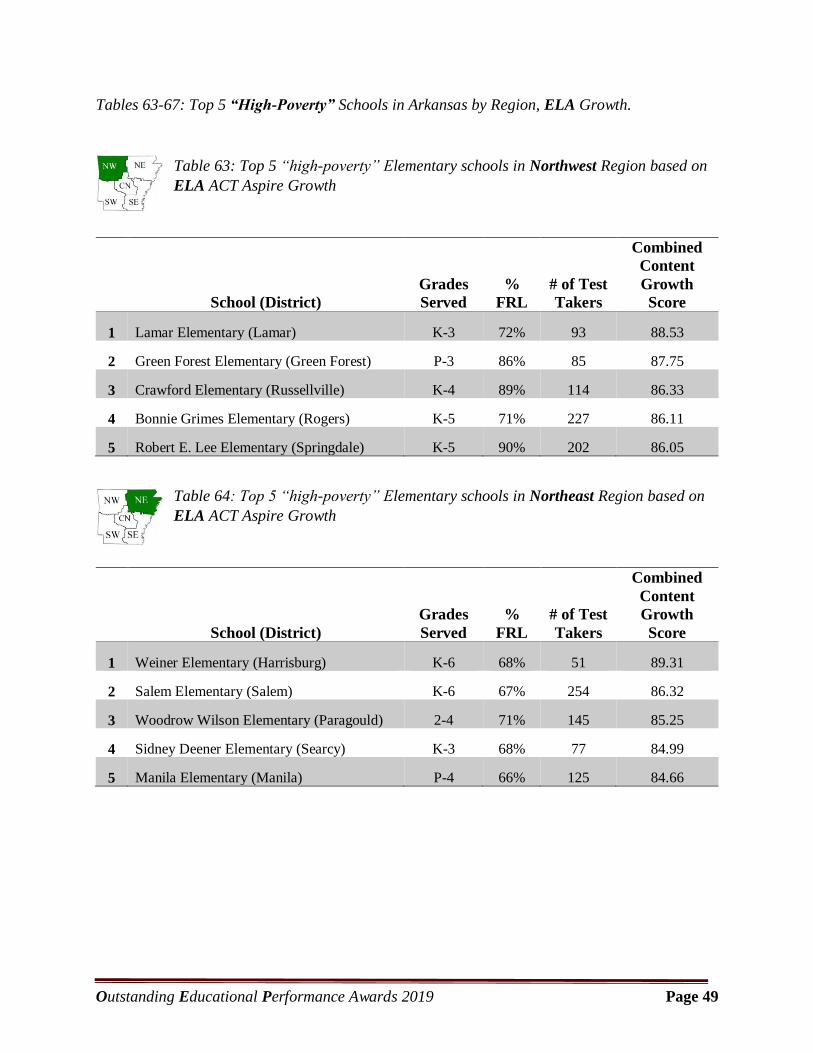
Table 63: Top 5 “high-poverty” Elementary schools in Northwest Region based on
ELA ACT Aspire Growth
School (District)
Grades
Served
%
FRL
# of Test
Takers
Combined
Content
Growth
Score
1 Lamar Elementary (Lamar) K-3 72% 93 88.53
2 Green Forest Elementary (Green Forest) P-3 86% 85 87.75
3 Crawford Elementary (Russellville) K-4 89% 114 86.33
4 Bonnie Grimes Elementary (Rogers) K-5 71% 227 86.11
5 Robert E. Lee Elementary (Springdale) K-5 90% 202 86.05
Table 64: Top 5 “high-poverty” Elementary schools in Northeast Region based on
ELA ACT Aspire Growth
School (District)
Grades
Served
%
FRL
# of Test
Takers
Combined
Content
Growth
Score
1 Weiner Elementary (Harrisburg) K-6 68% 51 89.31
2 Salem Elementary (Salem) K-6 67% 254 86.32
3 Woodrow Wilson Elementary (Paragould) 2-4 71% 145 85.25
4 Sidney Deener Elementary (Searcy) K-3 68% 77 84.99
5 Manila Elementary (Manila) P-4 66% 125 84.66
Outstanding Educational Performance Awards 2019 Page 50
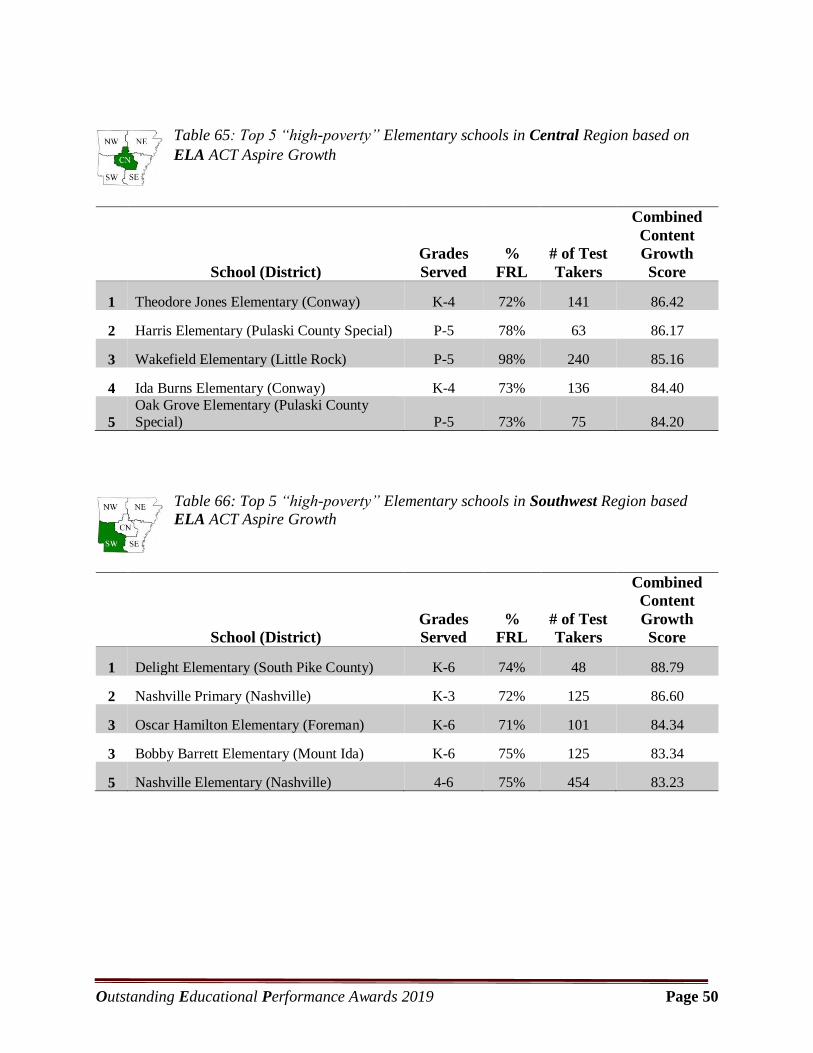
Table 65: Top 5 “high-poverty” Elementary schools in Central Region based on
ELA ACT Aspire Growth
School (District)
Grades
Served
%
FRL
# of Test
Takers
Combined
Content
Growth
Score
1 Theodore Jones Elementary (Conway) K-4 72% 141 86.42
2 Harris Elementary (Pulaski County Special) P-5 78% 63 86.17
3 Wakefield Elementary (Little Rock) P-5 98% 240 85.16
4 Ida Burns Elementary (Conway) K-4 73% 136 84.40
5
Oak Grove Elementary (Pulaski County
Special) P-5 73% 75 84.20
Table 66: Top 5 “high-poverty” Elementary schools in Southwest Region based
ELA ACT Aspire Growth
School (District)
Grades
Served
%
FRL
# of Test
Takers
Combined
Content
Growth
Score
1 Delight Elementary (South Pike County) K-6 74% 48 88.79
2 Nashville Primary (Nashville) K-3 72% 125 86.60
3 Oscar Hamilton Elementary (Foreman) K-6 71% 101 84.34
3 Bobby Barrett Elementary (Mount Ida) K-6 75% 125 83.34
5 Nashville Elementary (Nashville) 4-6 75% 454 83.23
Outstanding Educational Performance Awards 2019 Page 51
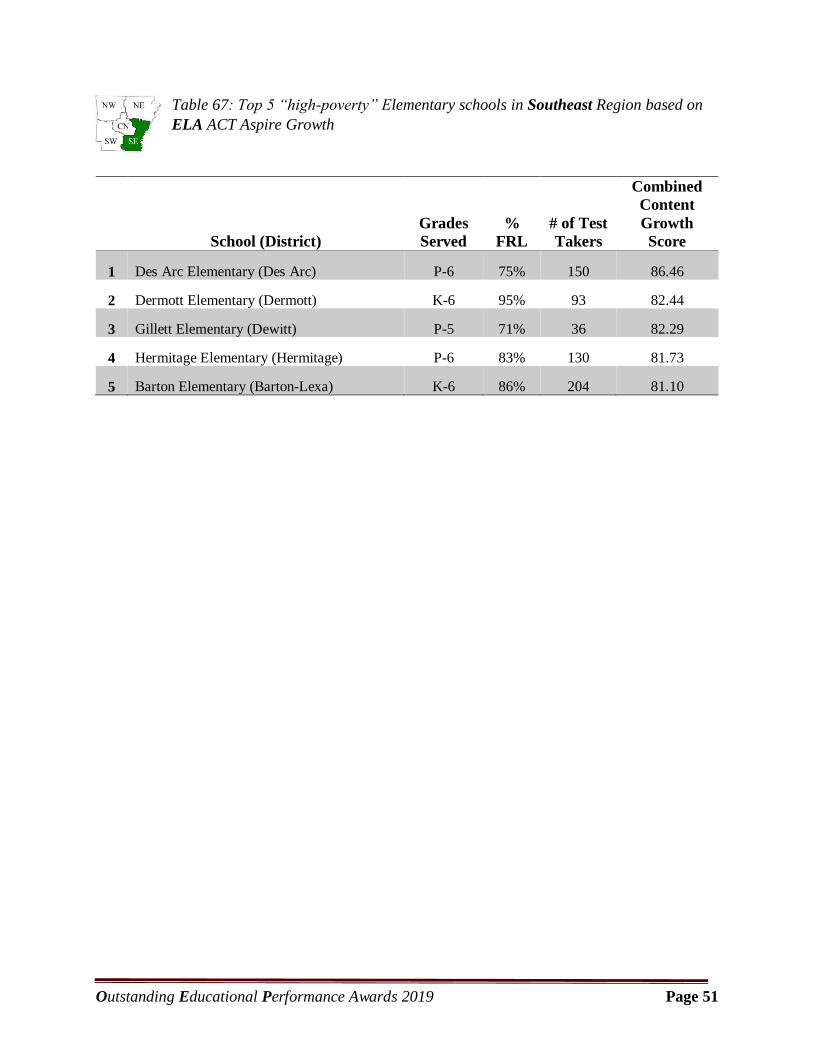
Table 67: Top 5 “high-poverty” Elementary schools in Southeast Region based on
ELA ACT Aspire Growth
School (District)
Grades
Served
%
FRL
# of Test
Takers
Combined
Content
Growth
Score
1 Des Arc Elementary (Des Arc) P-6 75% 150 86.46
2 Dermott Elementary (Dermott) K-6 95% 93 82.44
3 Gillett Elementary (Dewitt) P-5 71% 36 82.29
4 Hermitage Elementary (Hermitage) P-6 83% 130 81.73
5 Barton Elementary (Barton-Lexa) K-6 86% 204 81.10
Outstanding Educational Performance Awards 2019 Page 52
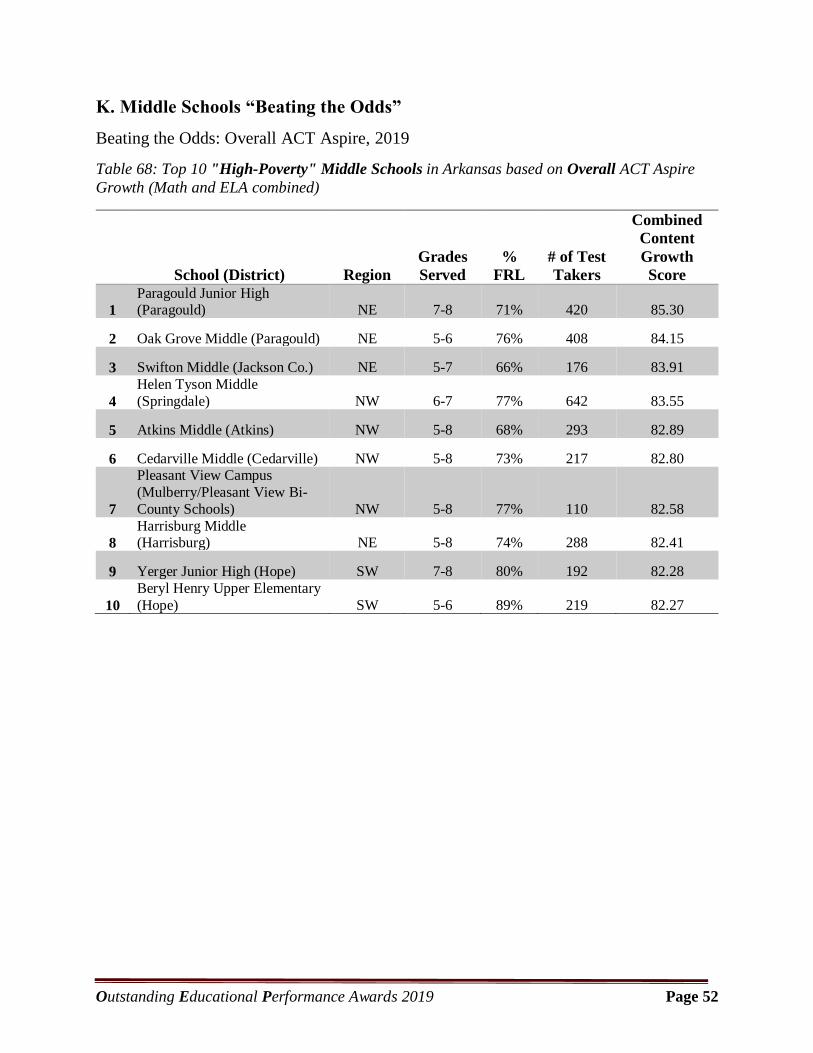
K. Middle Schools “Beating the Odds”
Beating the Odds: Overall ACT Aspire, 2019
Table 68: Top 10 "High-Poverty" Middle Schools in Arkansas based on Overall ACT Aspire
Growth (Math and ELA combined)
School (District) Region
Grades
Served
%
FRL
# of Test
Takers
Combined
Content
Growth
Score
1
Paragould Junior High (Paragould) NE 7-8 71% 420 85.30
2 Oak Grove Middle (Paragould) NE 5-6 76% 408 84.15
3 Swifton Middle (Jackson Co.) NE 5-7 66% 176 83.91
4
Helen Tyson Middle
(Springdale) NW 6-7 77% 642 83.55
5 Atkins Middle (Atkins) NW 5-8 68% 293 82.89
6 Cedarville Middle (Cedarville) NW 5-8 73% 217 82.80
7
Pleasant View Campus
(Mulberry/Pleasant View Bi-
County Schools) NW 5-8 77% 110 82.58
8
Harrisburg Middle (Harrisburg) NE 5-8 74% 288 82.41
9 Yerger Junior High (Hope) SW 7-8 80% 192 82.28
10
Beryl Henry Upper Elementary
(Hope) SW 5-6 89% 219 82.27
Outstanding Educational Performance Awards 2019 Page 53
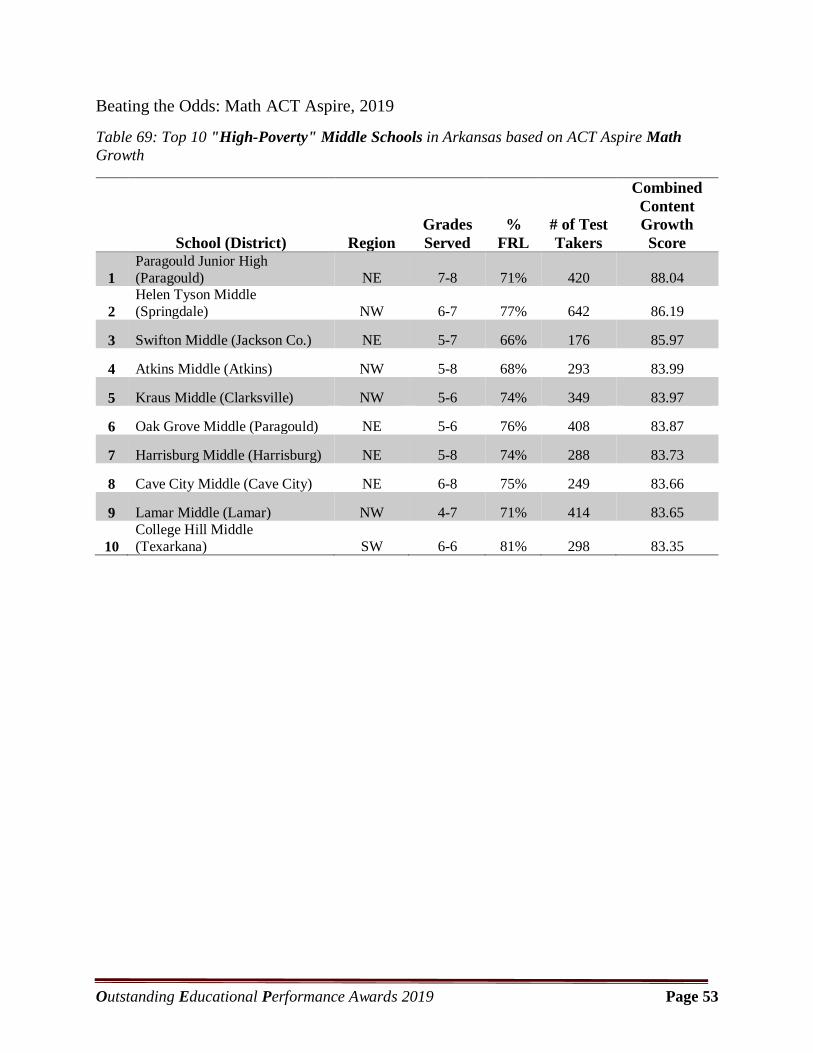
Beating the Odds: Math ACT Aspire, 2019
Table 69: Top 10 "High-Poverty" Middle Schools in Arkansas based on ACT Aspire Math
Growth
School (District) Region
Grades
Served
%
FRL
# of Test
Takers
Combined
Content
Growth
Score
1
Paragould Junior High
(Paragould) NE 7-8 71% 420 88.04
2
Helen Tyson Middle
(Springdale) NW 6-7 77% 642 86.19
3 Swifton Middle (Jackson Co.) NE 5-7 66% 176 85.97
4 Atkins Middle (Atkins) NW 5-8 68% 293 83.99
5 Kraus Middle (Clarksville) NW 5-6 74% 349 83.97
6 Oak Grove Middle (Paragould) NE 5-6 76% 408 83.87
7 Harrisburg Middle (Harrisburg) NE 5-8 74% 288 83.73
8 Cave City Middle (Cave City) NE 6-8 75% 249 83.66
9 Lamar Middle (Lamar) NW 4-7 71% 414 83.65
10
College Hill Middle
(Texarkana) SW 6-6 81% 298 83.35
Outstanding Educational Performance Awards 2019 Page 54
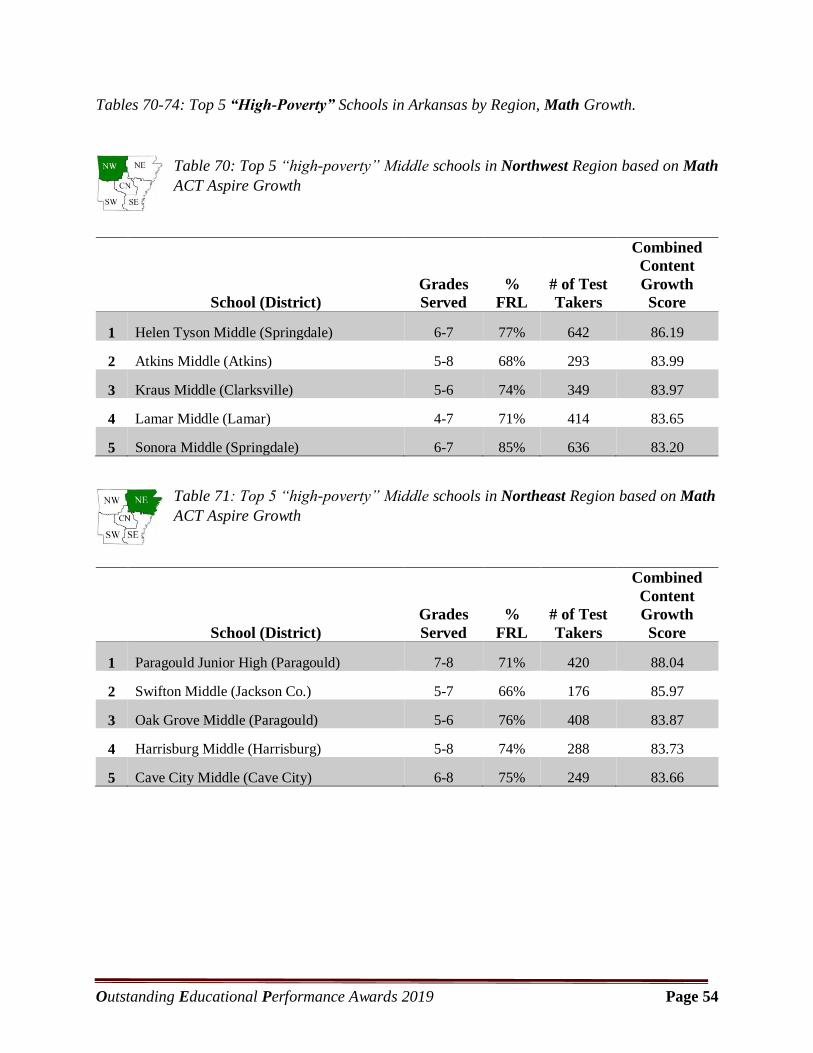
Tables 70-74: Top 5 “High-Poverty” Schools in Arkansas by Region, Math Growth.
Table 70: Top 5 “high-poverty” Middle schools in Northwest Region based on Math
ACT Aspire Growth
School (District)
Grades
Served
%
FRL
# of Test
Takers
Combined
Content
Growth
Score
1 Helen Tyson Middle (Springdale) 6-7 77% 642 86.19
2 Atkins Middle (Atkins) 5-8 68% 293 83.99
3 Kraus Middle (Clarksville) 5-6 74% 349 83.97
4 Lamar Middle (Lamar) 4-7 71% 414 83.65
5 Sonora Middle (Springdale) 6-7 85% 636 83.20
Table 71: Top 5 “high-poverty” Middle schools in Northeast Region based on Math
ACT Aspire Growth
School (District)
Grades
Served
%
FRL
# of Test
Takers
Combined
Content
Growth
Score
1 Paragould Junior High (Paragould) 7-8 71% 420 88.04
2 Swifton Middle (Jackson Co.) 5-7 66% 176 85.97
3 Oak Grove Middle (Paragould) 5-6 76% 408 83.87
4 Harrisburg Middle (Harrisburg) 5-8 74% 288 83.73
5 Cave City Middle (Cave City) 6-8 75% 249 83.66
Outstanding Educational Performance Awards 2019 Page 55
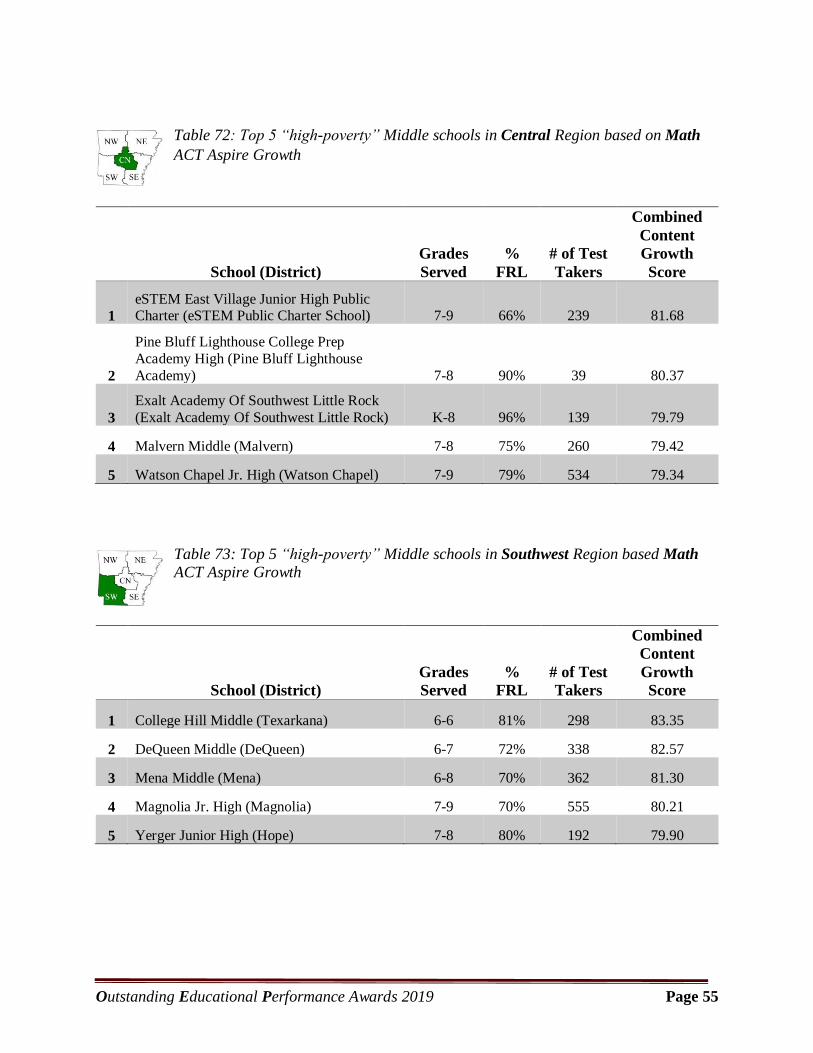
Table 72: Top 5 “high-poverty” Middle schools in Central Region based on Math
ACT Aspire Growth
School (District)
Grades
Served
%
FRL
# of Test
Takers
Combined
Content
Growth
Score
1
eSTEM East Village Junior High Public Charter (eSTEM Public Charter School) 7-9 66% 239 81.68
2
Pine Bluff Lighthouse College Prep
Academy High (Pine Bluff Lighthouse
Academy) 7-8 90% 39 80.37
3
Exalt Academy Of Southwest Little Rock
(Exalt Academy Of Southwest Little Rock) K-8 96% 139 79.79
4 Malvern Middle (Malvern) 7-8 75% 260 79.42
5 Watson Chapel Jr. High (Watson Chapel) 7-9 79% 534 79.34
Table 73: Top 5 “high-poverty” Middle schools in Southwest Region based Math
ACT Aspire Growth
School (District)
Grades
Served
%
FRL
# of Test
Takers
Combined
Content
Growth
Score
1 College Hill Middle (Texarkana) 6-6 81% 298 83.35
2 DeQueen Middle (DeQueen) 6-7 72% 338 82.57
3 Mena Middle (Mena) 6-8 70% 362 81.30
4 Magnolia Jr. High (Magnolia) 7-9 70% 555 80.21
5 Yerger Junior High (Hope) 7-8 80% 192 79.90
Outstanding Educational Performance Awards 2019 Page 56
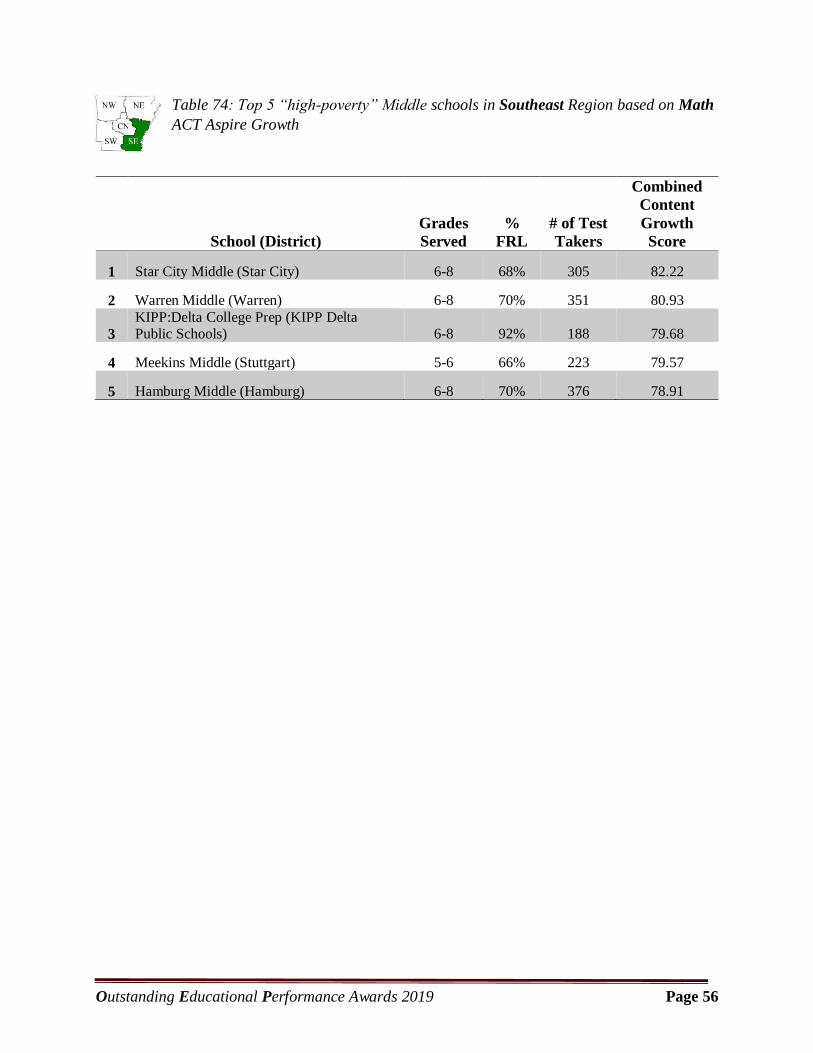
Table 74: Top 5 “high-poverty” Middle schools in Southeast Region based on Math
ACT Aspire Growth
School (District)
Grades
Served
%
FRL
# of Test
Takers
Combined
Content
Growth
Score
1 Star City Middle (Star City) 6-8 68% 305 82.22
2 Warren Middle (Warren) 6-8 70% 351 80.93
3
KIPP:Delta College Prep (KIPP Delta Public Schools) 6-8 92% 188 79.68
4 Meekins Middle (Stuttgart) 5-6 66% 223 79.57
5 Hamburg Middle (Hamburg) 6-8 70% 376 78.91
Outstanding Educational Performance Awards 2019 Page 57
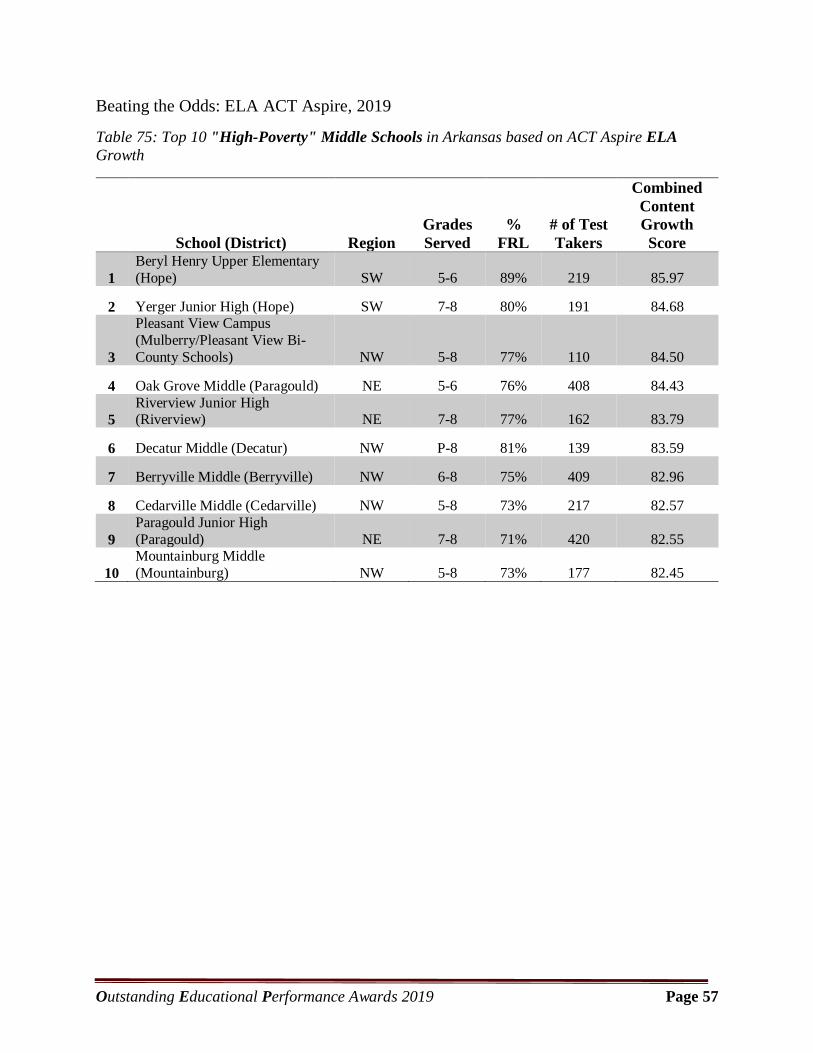
Beating the Odds: ELA ACT Aspire, 2019
Table 75: Top 10 "High-Poverty" Middle Schools in Arkansas based on ACT Aspire ELA
Growth
School (District) Region
Grades
Served
%
FRL
# of Test
Takers
Combined
Content
Growth
Score
1
Beryl Henry Upper Elementary
(Hope) SW 5-6 89% 219 85.97
2 Yerger Junior High (Hope) SW 7-8 80% 191 84.68
3
Pleasant View Campus
(Mulberry/Pleasant View Bi-
County Schools) NW 5-8 77% 110 84.50
4 Oak Grove Middle (Paragould) NE 5-6 76% 408 84.43
5
Riverview Junior High (Riverview) NE 7-8 77% 162 83.79
6 Decatur Middle (Decatur) NW P-8 81% 139 83.59
7 Berryville Middle (Berryville) NW 6-8 75% 409 82.96
8 Cedarville Middle (Cedarville) NW 5-8 73% 217 82.57
9
Paragould Junior High
(Paragould) NE 7-8 71% 420 82.55
10
Mountainburg Middle
(Mountainburg) NW 5-8 73% 177 82.45
Outstanding Educational Performance Awards 2019 Page 58
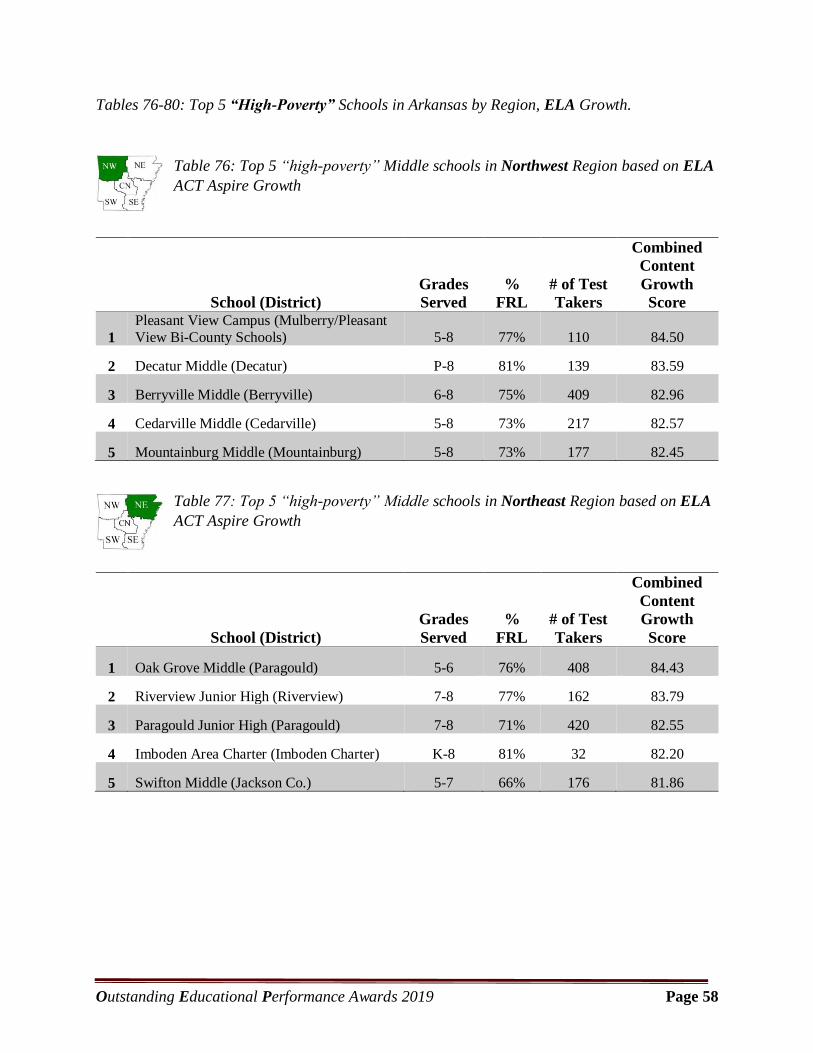
Tables 76-80: Top 5 “High-Poverty” Schools in Arkansas by Region, ELA Growth.
Table 76: Top 5 “high-poverty” Middle schools in Northwest Region based on ELA
ACT Aspire Growth
School (District)
Grades
Served
%
FRL
# of Test
Takers
Combined
Content
Growth
Score
1
Pleasant View Campus (Mulberry/Pleasant
View Bi-County Schools) 5-8 77% 110 84.50
2 Decatur Middle (Decatur) P-8 81% 139 83.59
3 Berryville Middle (Berryville) 6-8 75% 409 82.96
4 Cedarville Middle (Cedarville) 5-8 73% 217 82.57
5 Mountainburg Middle (Mountainburg) 5-8 73% 177 82.45
Table 77: Top 5 “high-poverty” Middle schools in Northeast Region based on ELA
ACT Aspire Growth
School (District)
Grades
Served
%
FRL
# of Test
Takers
Combined
Content
Growth
Score
1 Oak Grove Middle (Paragould) 5-6 76% 408 84.43
2 Riverview Junior High (Riverview) 7-8 77% 162 83.79
3 Paragould Junior High (Paragould) 7-8 71% 420 82.55
4 Imboden Area Charter (Imboden Charter) K-8 81% 32 82.20
5 Swifton Middle (Jackson Co.) 5-7 66% 176 81.86

Outstanding Educational Performance Awards 2019 Page 59
Table 78: Top 5 “high-poverty” Middle schools in Central Region based on ELA
ACT Aspire Growth
School (District)
Grades
Served
%
FRL
# of Test
Takers
Combined
Content
Growth
Score
1
Exalt Academy Of Southwest Little Rock (Exalt Academy Of Southwest Little Rock) K-8 96% 119 81.86
2
Pine Bluff Lighthouse College Prep
Academy High (Pine Bluff Lighthouse
Academy) 7-8 90% 39 81.60
3 Mills Middle (Pulaski County Special) 6-8 75% 347 81.35
4 Jessieville Middle (Jessieville) 6-8 71% 188 81.34
5 Malvern Middle (Malvern) 7-8 75% 260 80.92
Table 79: Top 5 “high-poverty” Middle schools in Southwest Region based ELA
ACT Aspire Growth
School (District)
Grades
Served
%
FRL
# of Test
Takers
Combined
Content
Growth
Score
1 Beryl Henry Upper Elementary (Hope) 5-6 89% 219 85.97
2 Yerger Junior High (Hope) 7-8 80% 191 84.68
3 Nashville Junior High (Nashville) 7-9 72% 420 82.20
4 Hope Academy Of Public Service (Hope) 5-9 85% 240 82.06
5 North Heights Jr. High (Texarkana) 7-8 72% 464 81.63
Outstanding Educational Performance Awards 2019 Page 60
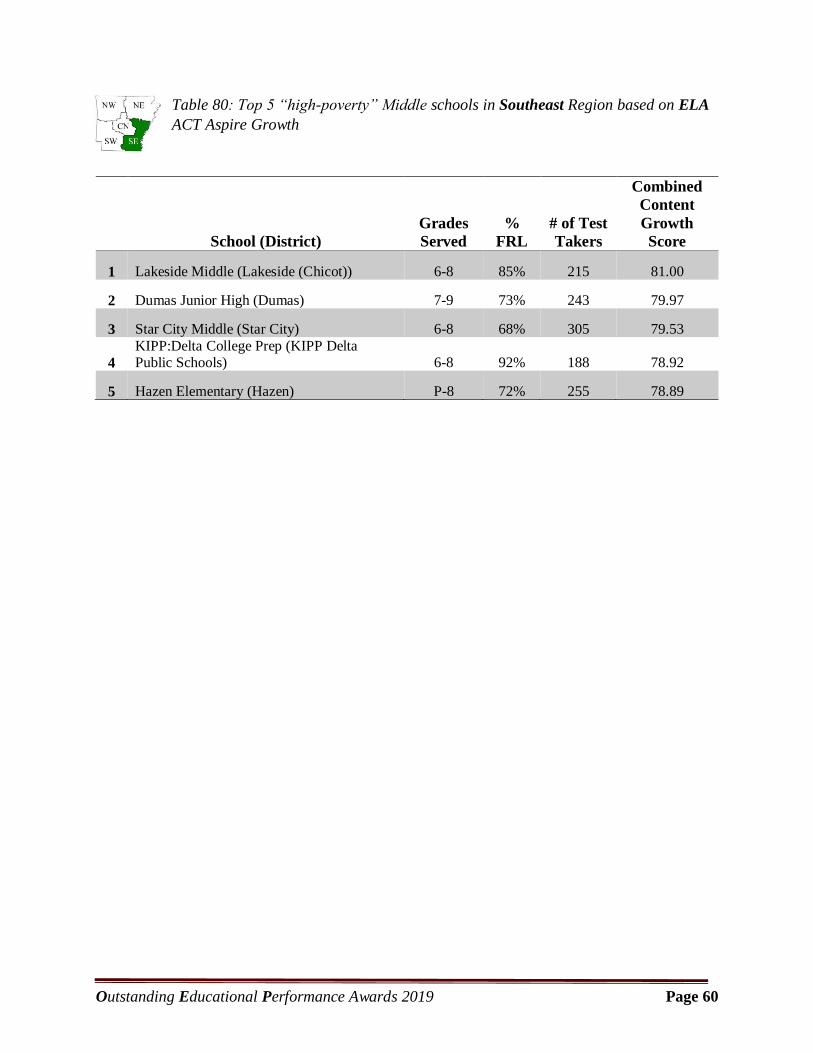
Table 80: Top 5 “high-poverty” Middle schools in Southeast Region based on ELA
ACT Aspire Growth
School (District)
Grades
Served
%
FRL
# of Test
Takers
Combined
Content
Growth
Score
1 Lakeside Middle (Lakeside (Chicot)) 6-8 85% 215 81.00
2 Dumas Junior High (Dumas) 7-9 73% 243 79.97
3 Star City Middle (Star City) 6-8 68% 305 79.53
4
KIPP:Delta College Prep (KIPP Delta Public Schools) 6-8 92% 188 78.92
5 Hazen Elementary (Hazen) P-8 72% 255 78.89
Outstanding Educational Performance Awards 2019 Page 61
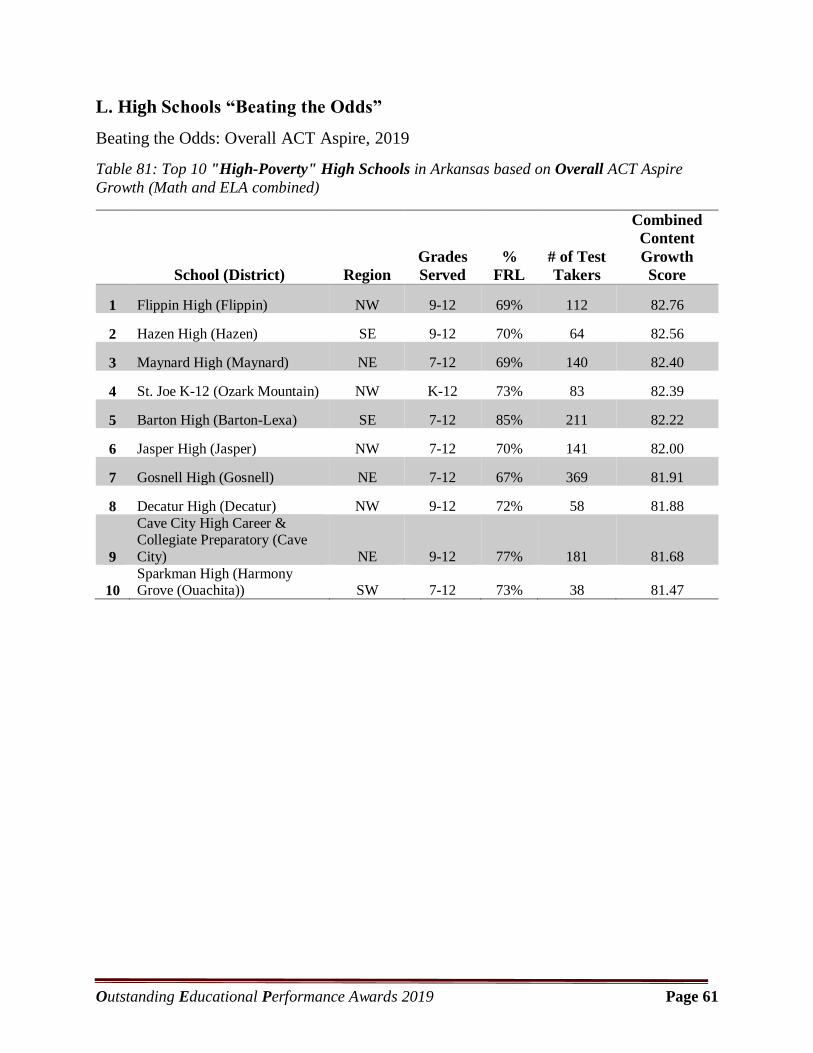
L. High Schools “Beating the Odds”
Beating the Odds: Overall ACT Aspire, 2019
Table 81: Top 10 "High-Poverty" High Schools in Arkansas based on Overall ACT Aspire
Growth (Math and ELA combined)
School (District) Region
Grades
Served
%
FRL
# of Test
Takers
Combined
Content
Growth
Score
1 Flippin High (Flippin) NW 9-12 69% 112 82.76
2 Hazen High (Hazen) SE 9-12 70% 64 82.56
3 Maynard High (Maynard) NE 7-12 69% 140 82.40
4 St. Joe K-12 (Ozark Mountain) NW K-12 73% 83 82.39
5 Barton High (Barton-Lexa) SE 7-12 85% 211 82.22
6 Jasper High (Jasper) NW 7-12 70% 141 82.00
7 Gosnell High (Gosnell) NE 7-12 67% 369 81.91
8 Decatur High (Decatur) NW 9-12 72% 58 81.88
9
Cave City High Career & Collegiate Preparatory (Cave
City) NE 9-12 77% 181 81.68
10
Sparkman High (Harmony Grove (Ouachita)) SW 7-12 73% 38 81.47
Outstanding Educational Performance Awards 2019 Page 62
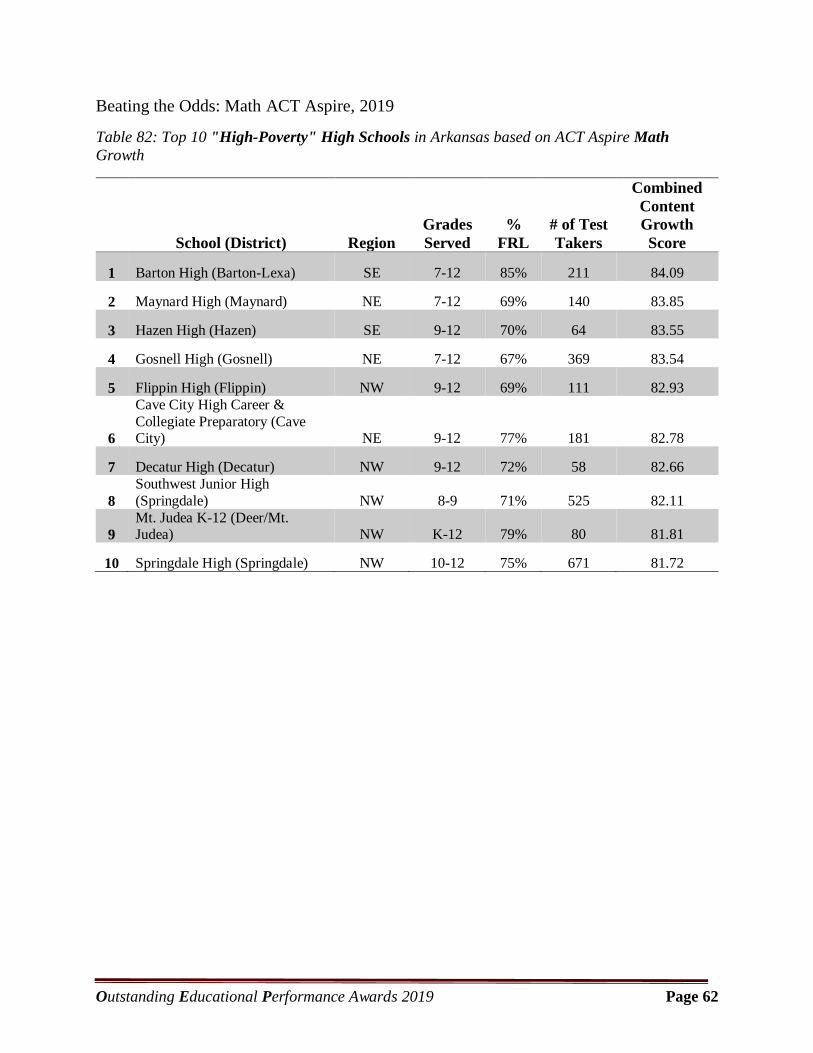
Beating the Odds: Math ACT Aspire, 2019
Table 82: Top 10 "High-Poverty" High Schools in Arkansas based on ACT Aspire Math
Growth
School (District) Region
Grades
Served
%
FRL
# of Test
Takers
Combined
Content
Growth
Score
1 Barton High (Barton-Lexa) SE 7-12 85% 211 84.09
2 Maynard High (Maynard) NE 7-12 69% 140 83.85
3 Hazen High (Hazen) SE 9-12 70% 64 83.55
4 Gosnell High (Gosnell) NE 7-12 67% 369 83.54
5 Flippin High (Flippin) NW 9-12 69% 111 82.93
6
Cave City High Career &
Collegiate Preparatory (Cave City) NE 9-12 77% 181 82.78
7 Decatur High (Decatur) NW 9-12 72% 58 82.66
8
Southwest Junior High
(Springdale) NW 8-9 71% 525 82.11
9
Mt. Judea K-12 (Deer/Mt. Judea) NW K-12 79% 80 81.81
10 Springdale High (Springdale) NW 10-12 75% 671 81.72
Outstanding Educational Performance Awards 2019 Page 63
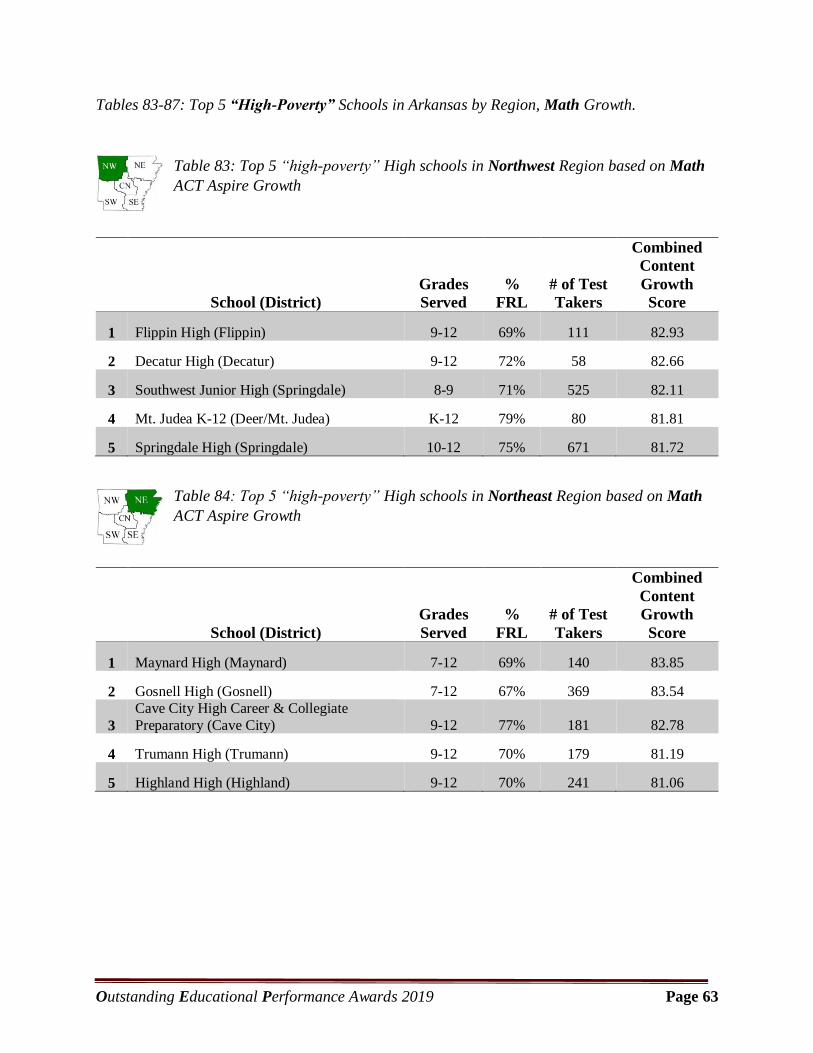
Tables 83-87: Top 5 “High-Poverty” Schools in Arkansas by Region, Math Growth.
Table 83: Top 5 “high-poverty” High schools in Northwest Region based on Math
ACT Aspire Growth
School (District)
Grades
Served
%
FRL
# of Test
Takers
Combined
Content
Growth
Score
1 Flippin High (Flippin) 9-12 69% 111 82.93
2 Decatur High (Decatur) 9-12 72% 58 82.66
3 Southwest Junior High (Springdale) 8-9 71% 525 82.11
4 Mt. Judea K-12 (Deer/Mt. Judea) K-12 79% 80 81.81
5 Springdale High (Springdale) 10-12 75% 671 81.72
Table 84: Top 5 “high-poverty” High schools in Northeast Region based on Math
ACT Aspire Growth
School (District)
Grades
Served
%
FRL
# of Test
Takers
Combined
Content
Growth
Score
1 Maynard High (Maynard) 7-12 69% 140 83.85
2 Gosnell High (Gosnell) 7-12 67% 369 83.54
3
Cave City High Career & Collegiate
Preparatory (Cave City) 9-12 77% 181 82.78
4 Trumann High (Trumann) 9-12 70% 179 81.19
5 Highland High (Highland) 9-12 70% 241 81.06
Outstanding Educational Performance Awards 2019 Page 64
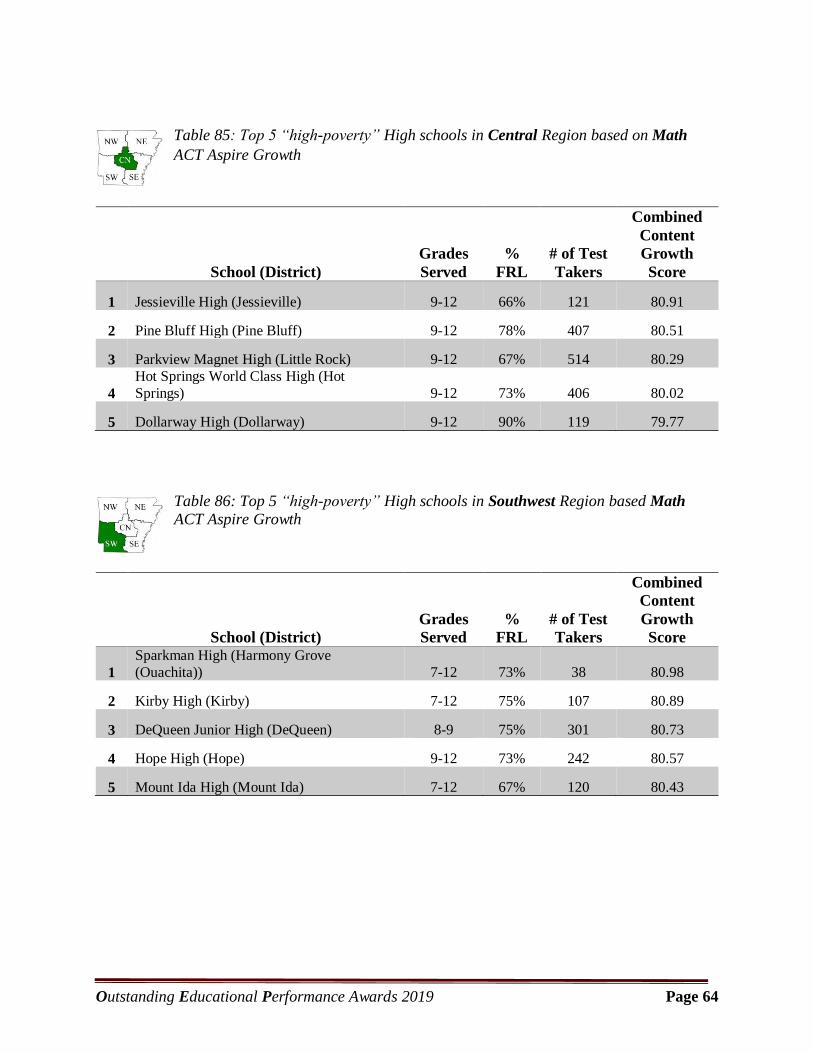
Table 85: Top 5 “high-poverty” High schools in Central Region based on Math
ACT Aspire Growth
School (District)
Grades
Served
%
FRL
# of Test
Takers
Combined
Content
Growth
Score
1 Jessieville High (Jessieville) 9-12 66% 121 80.91
2 Pine Bluff High (Pine Bluff) 9-12 78% 407 80.51
3 Parkview Magnet High (Little Rock) 9-12 67% 514 80.29
4
Hot Springs World Class High (Hot
Springs) 9-12 73% 406 80.02
5 Dollarway High (Dollarway) 9-12 90% 119 79.77
Table 86: Top 5 “high-poverty” High schools in Southwest Region based Math
ACT Aspire Growth
School (District)
Grades
Served
%
FRL
# of Test
Takers
Combined
Content
Growth
Score
1
Sparkman High (Harmony Grove
(Ouachita)) 7-12 73% 38 80.98
2 Kirby High (Kirby) 7-12 75% 107 80.89
3 DeQueen Junior High (DeQueen) 8-9 75% 301 80.73
4 Hope High (Hope) 9-12 73% 242 80.57
5 Mount Ida High (Mount Ida) 7-12 67% 120 80.43
Outstanding Educational Performance Awards 2019 Page 65
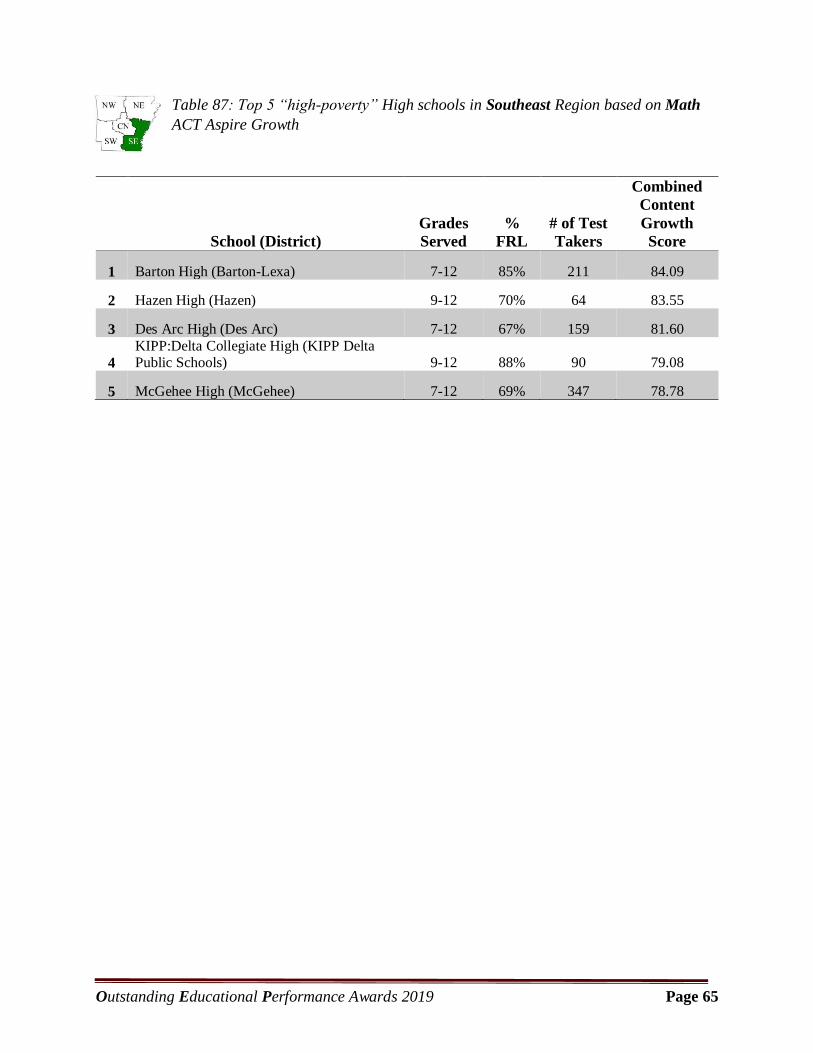
Table 87: Top 5 “high-poverty” High schools in Southeast Region based on Math
ACT Aspire Growth
School (District)
Grades
Served
%
FRL
# of Test
Takers
Combined
Content
Growth
Score
1 Barton High (Barton-Lexa) 7-12 85% 211 84.09
2 Hazen High (Hazen) 9-12 70% 64 83.55
3 Des Arc High (Des Arc) 7-12 67% 159 81.60
4
KIPP:Delta Collegiate High (KIPP Delta Public Schools) 9-12 88% 90 79.08
5 McGehee High (McGehee) 7-12 69% 347 78.78
Outstanding Educational Performance Awards 2019 Page 66
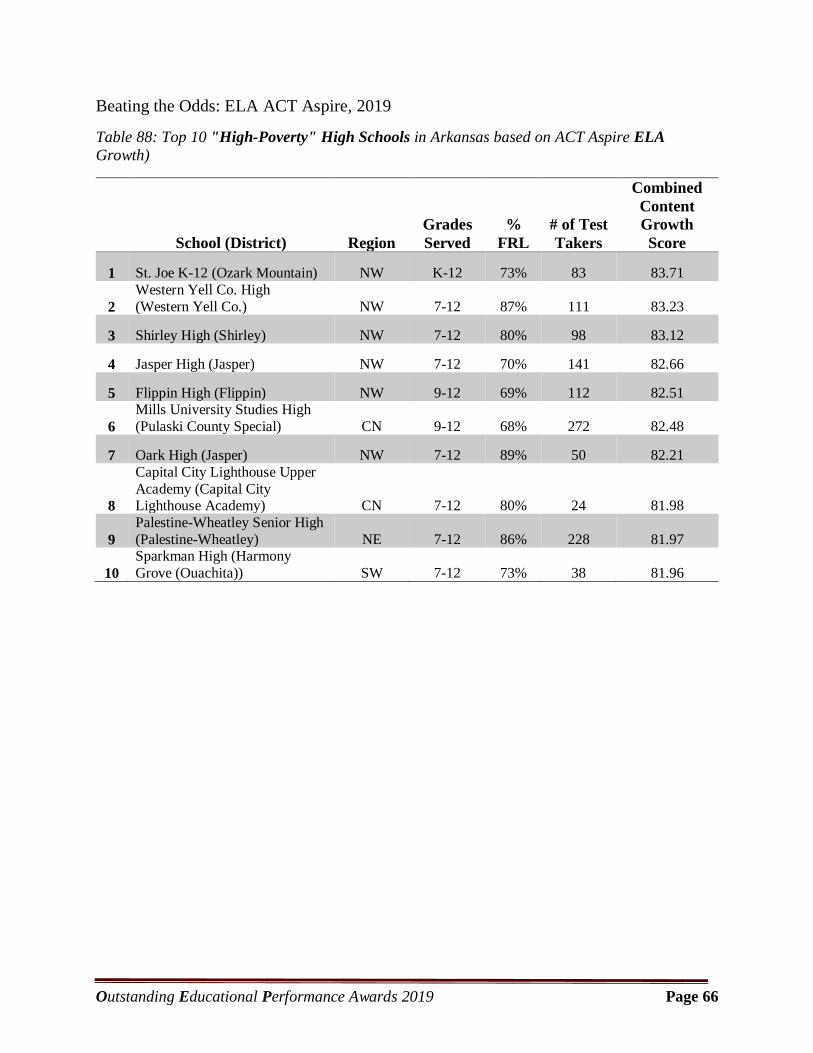
Beating the Odds: ELA ACT Aspire, 2019
Table 88: Top 10 "High-Poverty" High Schools in Arkansas based on ACT Aspire ELA
Growth)
School (District) Region
Grades
Served
%
FRL
# of Test
Takers
Combined
Content
Growth
Score
1 St. Joe K-12 (Ozark Mountain) NW K-12 73% 83 83.71
2
Western Yell Co. High
(Western Yell Co.) NW 7-12 87% 111 83.23
3 Shirley High (Shirley) NW 7-12 80% 98 83.12
4 Jasper High (Jasper) NW 7-12 70% 141 82.66
5 Flippin High (Flippin) NW 9-12 69% 112 82.51
6
Mills University Studies High
(Pulaski County Special) CN 9-12 68% 272 82.48
7 Oark High (Jasper) NW 7-12 89% 50 82.21
8
Capital City Lighthouse Upper
Academy (Capital City Lighthouse Academy) CN 7-12 80% 24 81.98
9
Palestine-Wheatley Senior High
(Palestine-Wheatley) NE 7-12 86% 228 81.97
10
Sparkman High (Harmony
Grove (Ouachita)) SW 7-12 73% 38 81.96
Outstanding Educational Performance Awards 2019 Page 67
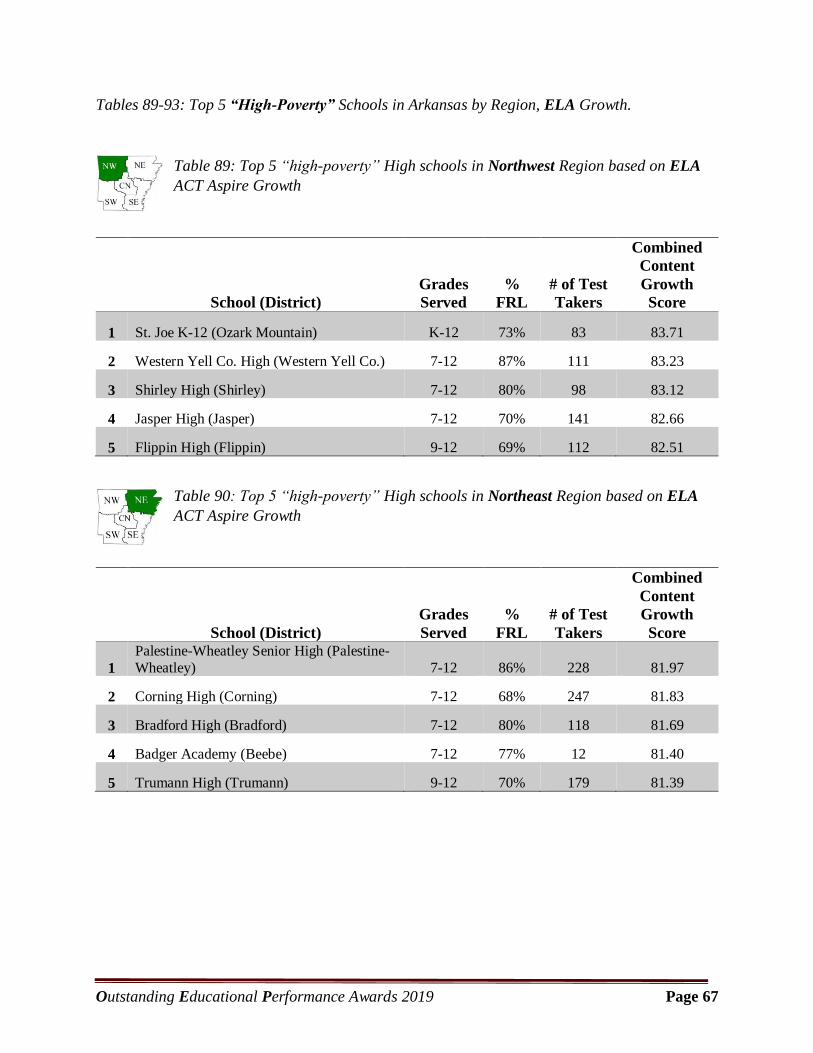
Tables 89-93: Top 5 “High-Poverty” Schools in Arkansas by Region, ELA Growth.
Table 89: Top 5 “high-poverty” High schools in Northwest Region based on ELA
ACT Aspire Growth
School (District)
Grades
Served
%
FRL
# of Test
Takers
Combined
Content
Growth
Score
1 St. Joe K-12 (Ozark Mountain) K-12 73% 83 83.71
2 Western Yell Co. High (Western Yell Co.) 7-12 87% 111 83.23
3 Shirley High (Shirley) 7-12 80% 98 83.12
4 Jasper High (Jasper) 7-12 70% 141 82.66
5 Flippin High (Flippin) 9-12 69% 112 82.51
Table 90: Top 5 “high-poverty” High schools in Northeast Region based on ELA
ACT Aspire Growth
School (District)
Grades
Served
%
FRL
# of Test
Takers
Combined
Content
Growth
Score
1
Palestine-Wheatley Senior High (Palestine-
Wheatley) 7-12 86% 228 81.97
2 Corning High (Corning) 7-12 68% 247 81.83
3 Bradford High (Bradford) 7-12 80% 118 81.69
4 Badger Academy (Beebe) 7-12 77% 12 81.40
5 Trumann High (Trumann) 9-12 70% 179 81.39
Outstanding Educational Performance Awards 2019 Page 68
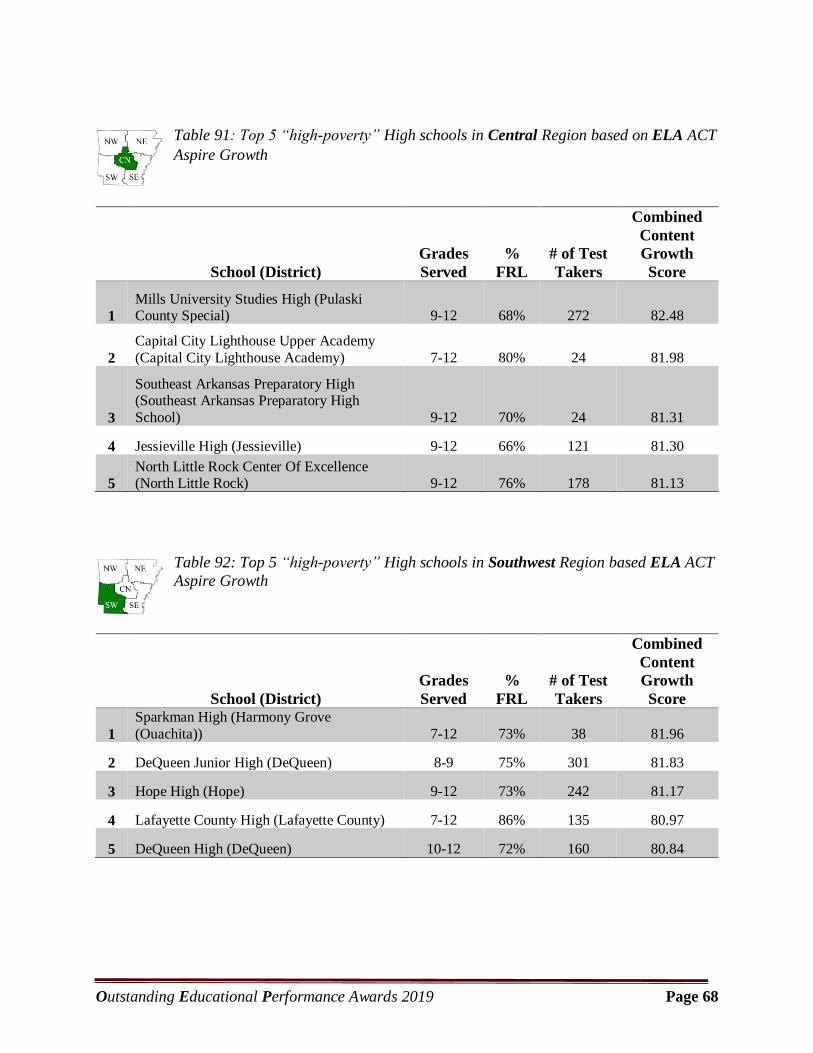
Table 91: Top 5 “high-poverty” High schools in Central Region based on ELA ACT
Aspire Growth
School (District)
Grades
Served
%
FRL
# of Test
Takers
Combined
Content
Growth
Score
1
Mills University Studies High (Pulaski County Special) 9-12 68% 272 82.48
2
Capital City Lighthouse Upper Academy
(Capital City Lighthouse Academy) 7-12 80% 24 81.98
3
Southeast Arkansas Preparatory High (Southeast Arkansas Preparatory High
School) 9-12 70% 24 81.31
4 Jessieville High (Jessieville) 9-12 66% 121 81.30
5
North Little Rock Center Of Excellence (North Little Rock) 9-12 76% 178 81.13
Table 92: Top 5 “high-poverty” High schools in Southwest Region based ELA ACT
Aspire Growth
School (District)
Grades
Served
%
FRL
# of Test
Takers
Combined
Content
Growth
Score
1
Sparkman High (Harmony Grove
(Ouachita)) 7-12 73% 38 81.96
2 DeQueen Junior High (DeQueen) 8-9 75% 301 81.83
3 Hope High (Hope) 9-12 73% 242 81.17
4 Lafayette County High (Lafayette County) 7-12 86% 135 80.97
5 DeQueen High (DeQueen) 10-12 72% 160 80.84

Outstanding Educational Performance Awards 2019 Page 69
Table 93: Top 5 “high-poverty” High schools in Southeast Region based on ELA
ACT Aspire Growth
School (District)
Grades
Served
%
FRL
# of Test
Takers
Combined
Content
Growth
Score
1 Hazen High (Hazen) 9-12 70% 64 81.56
2 Clarendon High (Clarendon) 7-12 90% 102 81.45
3
KIPP:Delta Collegiate High (KIPP Delta Public Schools) 9-12 88% 90 81.27
4 Des Arc High (Des Arc) 7-12 67% 159 80.49
5 Barton High (Barton-Lexa) 7-12 85% 211 80.36
Outstanding Educational Performance Awards 2019 Page A1
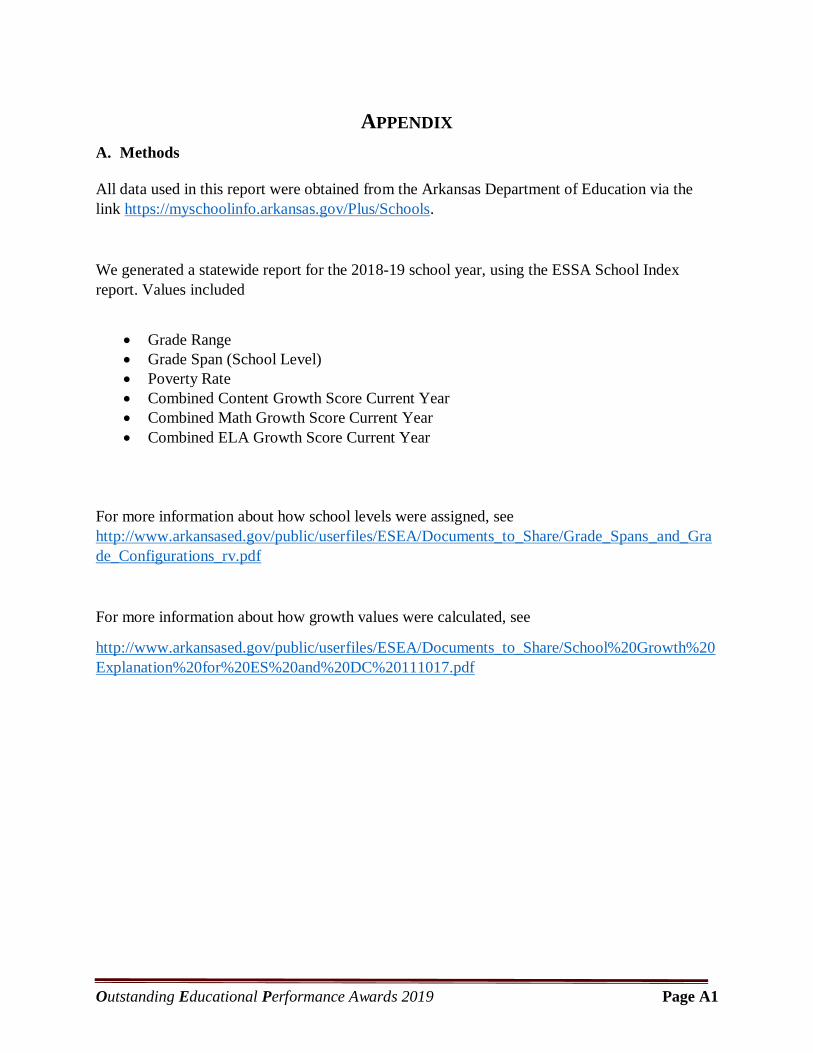
APPENDIX
A. Methods
All data used in this report were obtained from the Arkansas Department of Education via the
link https://myschoolinfo.arkansas.gov/Plus/Schools.
We generated a statewide report for the 2018-19 school year, using the ESSA School Index
report. Values included
Grade Range
Grade Span (School Level)
Poverty Rate
Combined Content Growth Score Current Year
Combined Math Growth Score Current Year
Combined ELA Growth Score Current Year
For more information about how school levels were assigned, see
http://www.arkansased.gov/public/userfiles/ESEA/Documents_to_Share/Grade_Spans_and_Gra
de_Configurations_rv.pdf
For more information about how growth values were calculated, see
http://www.arkansased.gov/public/userfiles/ESEA/Documents_to_Share/School%20Growth%20
Explanation%20for%20ES%20and%20DC%20111017.pdf