Embed Size (px)
Citation preview
Arizona Primary Care
Needs Assessment April 2016
Arizona Department of Health Services, Bureau of Health Systems Development
Arizona Primary Care Needs Assessment • • •
Page 1 of 41
Arizona Primary Care Needs Assessment April 2016
Summary The Arizona Primary Care Office (PCO), within the Arizona Department of Health Services, compiled a variety of data related to health outcomes and access to primary care. The data was analyzed to identify the state’s communities with the greatest unmet health care needs, and will be used to target future shortage designation, community development and workforce program efforts. The data was also used to develop Primary Care Area Profiles for each of Arizona’s 126 Primary Care Areas – a valuable tool for statewide stakeholders in their community-level health planning and grant writing. This report summarizes key findings from this needs assessment.
For More Information Contact: Patricia Tarango, MS Bureau of Health Systems Development Arizona Department of Health Services 150 N 18th Ave Suite 300, Phoenix, Arizona 85007
602-542-1436 [email protected]
Funding Source Funding to support the development of this publication was provided by the Health Resources and Services Administration (HRSA) of the U.S. Department of Health and Human Services (HHS) (State Primary Care Office Cooperative Agreement). The report’s content and conclusions are those of the authors and should not be construed as the official position or policy of, nor should any endorsements be inferred by HRSA, HHS or the U.S. Government.
Contributors • • •
Patricia Tarango, MS Chief, Bureau of Health Systems Development,
AZ Dept of Health Services
Tracy Lenartz, MPH Lenartz Consulting
Contractor – AZ Dept of Health Services
Christy Zavala, MPH
Distinguished Consulting Contractor –
AZ Dept of Health Services
Cielo Mohapatra, MSIOP Community Development Manager, Bureau of Health
Systems Development, AZ Dept of Health Services
Ana Roscetti, MPH Workforce Section
Manager, Bureau of Health Systems Development,
AZ Dept of Health Services
Alexandria Drake, MPH Epidemiologist,
Health Disparities Center, AZ Dept of Health Services
Rodney Cluff Contractor –
AZ Dept of Health Services
Arizona Primary Care Needs Assessment • • •
Page 2 of 41
Table of Contents Overview .................................................................................................................................................................. 3
Primary Care Areas................................................................................................................................................. 5
A Statewide Focus on Health Improvement ..................................................................................................... 8
Shortage Designations ........................................................................................................................................... 9
Needs Assessment - Demographics .................................................................................................................. 13
Poverty ................................................................................................................................................................ 13
Education ............................................................................................................................................................ 14
Unemployment .................................................................................................................................................. 14
Needs Assessment – Health Status and Outcomes ........................................................................................ 15
Median Age at Death ........................................................................................................................................ 15
Birth Outcomes .................................................................................................................................................. 15
Mortality ............................................................................................................................................................. 16
Needs Assessment – Primary and Preventive Care ........................................................................................ 18
Usual Source of Care ......................................................................................................................................... 18
Preventive Care .................................................................................................................................................. 18
Needs Assessment – Access to Care .................................................................................................................. 20
Uninsurance ....................................................................................................................................................... 20
Health Workforce Shortages ............................................................................................................................ 20
Language Access ................................................................................................................................................ 21
Current Efforts - Health Disparities ................................................................................................................. 22
Current Efforts – Workforce Programs ............................................................................................................ 24
Current Efforts – Community Development .................................................................................................. 29
Current Efforts – Shortage Designations ........................................................................................................ 32
Next Steps ............................................................................................................................................................. 33
Conclusion ............................................................................................................................................................ 34
Appendix A: Primary Care Area Profile Sample ........................................................................................... 35
Appendix B: Arizona Primary Care Areas List .............................................................................................. 38
References ............................................................................................................................................................. 41

Arizona Primary Care Needs Assessment • • •
Page 3 of 41
Overview
ARIZONA PRIMARY CARE OFFICE BACKGROUND
The Bureau of Health Systems Development (BHSD) within the Arizona Department of Health Services (ADHS) functions as the Primary Care Office (PCO) for the State of Arizona. The mission of the Arizona PCO is to optimize the health of Arizona’s residents by developing and strengthening systems services to expand access to primary care and other services with emphasis on the health needs of underserved people and areas. BHSD receives Primary Care Office Cooperative Agreement funds from the Health Resources and Services Administration (HRSA) of the U.S. Department of Health and Human Services (HHS) to support its work in increasing access to care for the underserved through:
• Developing and implementing strategies for strengthening primary care/health care delivery system, and providing technical assistance to statewide partners in these efforts
• Administering programs to increase the number of providers/ improve services in underserved areas
• Identifying areas that need improved health services, and assisting those communities with federal and state shortage designations
PRIMARY CARE NEEDS ASSESSMENT
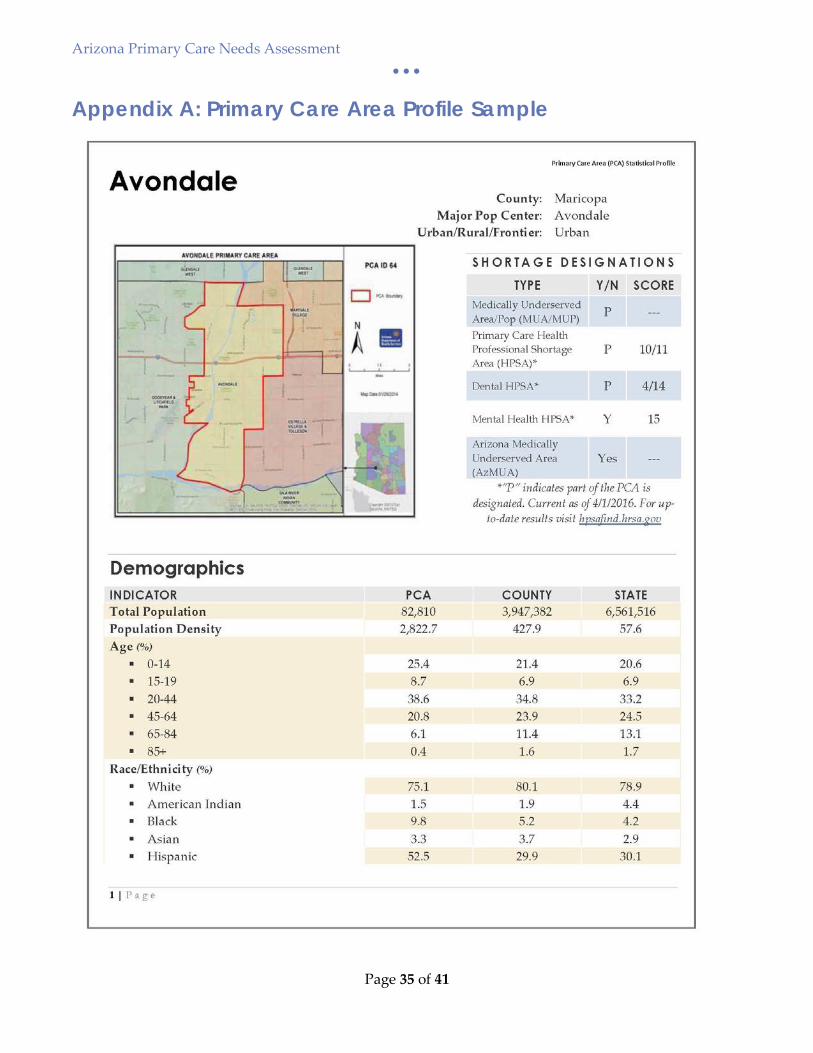
A required deliverable of the HRSA Primary Care Office Cooperative Agreement is a statewide primary care needs assessment. The Arizona PCO decided to focus efforts of this project on developing a tangible tool that can be shared with stakeholders. While BHSD has been publishing Primary Care Area (PCA) Statistical Profiles for decades, the report format and content were in need of an update. The result of this project is a new user-friendly Statistical Profile for each of Arizona’s 126 PCAs with a score-card component that allows stakeholder to visualize in a glance how their community fares compared to state averages.
The Profile incorporates indicators most frequently requested by stakeholders in a survey that yielded over 100 responses. The Profile highlights indicators in the following categories: Shortage Designations, Demographics, Health Status and Outcomes, Primary and Preventive Care, and Access to Care. Sources of data include American Community Survey 2010-2014, ADHS Vital Statistics 2013, ADHS Hospital Discharge Database, 2013 Arizona Behavioral Risk Factor Surveillance System Survey, 2015 NPI Provider Data, and 2016 Medicaid and Medicare data.
An example of a profile is included in Appendix A. All Primary Care Area Profiles will be published to the ADHS PCA webpage in the coming month. A Data Sources and Definitions document will also be published and linked to the profiles.
Arizona Primary Care Needs Assessment • • •
Page 4 of 41
This report summarizes key findings from this needs assessment, including identification of Arizona’s communities with the greatest unmet health care needs, disparities and health workforce shortages.
Arizona Primary Care Needs Assessment • • •
Page 5 of 41
Primary Care Areas
HISTORY
For nearly 10 years, the Arizona PCO has utilized the state’s Primary Care Areas (PCAs) as a state rational service area plan (SRSA plan) for federal shortage designations. The creation and maintenance of Primary Care Areas is required by Arizona state statute related to the designation of Arizona Medically Underserved Areas. It is logical to use these same geographic boundaries for both state and federally-designated shortage areas.
Arizona PCAs, which reflect similarities in demographics and primary care services utilization patterns per state statute, had not been updated since the 1990’s. In 2013, the Arizona PCO launched a project to update PCA boundaries out of both necessity (the state has undergone a vast amount of growth since the last revision, leaving several PCAs no longer reflective of true community boundaries) and a desire for the entire Arizona Department of Health Services (ADHS) to adopt a common geographic unit for health statistical analysis.
The ADHS GIS Coordinator developed new methodology for PCAs that stayed true to the original shortage designation purpose of PCAs/RSAs, but also retained a population large enough to do spatial and statistical analysis for other public health purposes. The GIS Coordinator created a specific methodology using GIS spatial analysis software. Implementing a software-driven methodology was a mindful decision, ensuring the ability to rerun the exact same methodology with the release of each decennial census. Several versions of this methodology were reviewed by the Arizona PCO before agreeing upon the final version. In December 2013, the final PCA methodology (and resulting proposed boundaries) was presented to statewide stakeholders via webinar. Stakeholders were given the opportunity to offer feedback during an open comment period, with no opposing statements received.
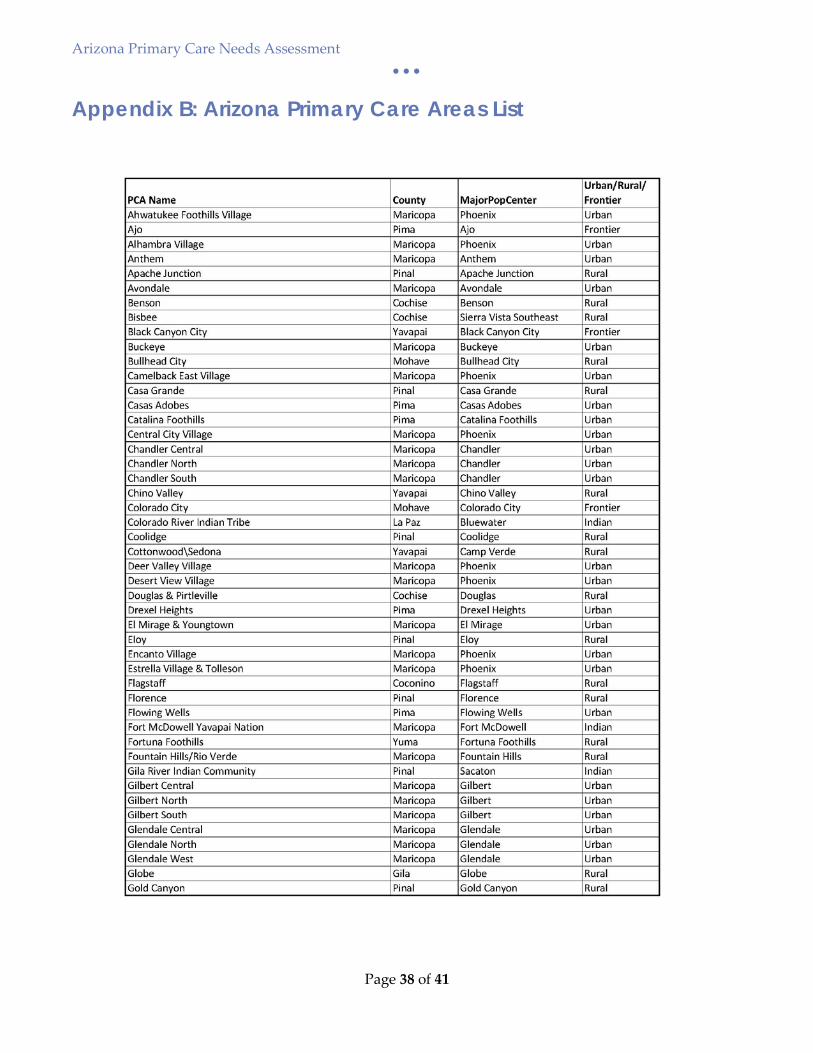
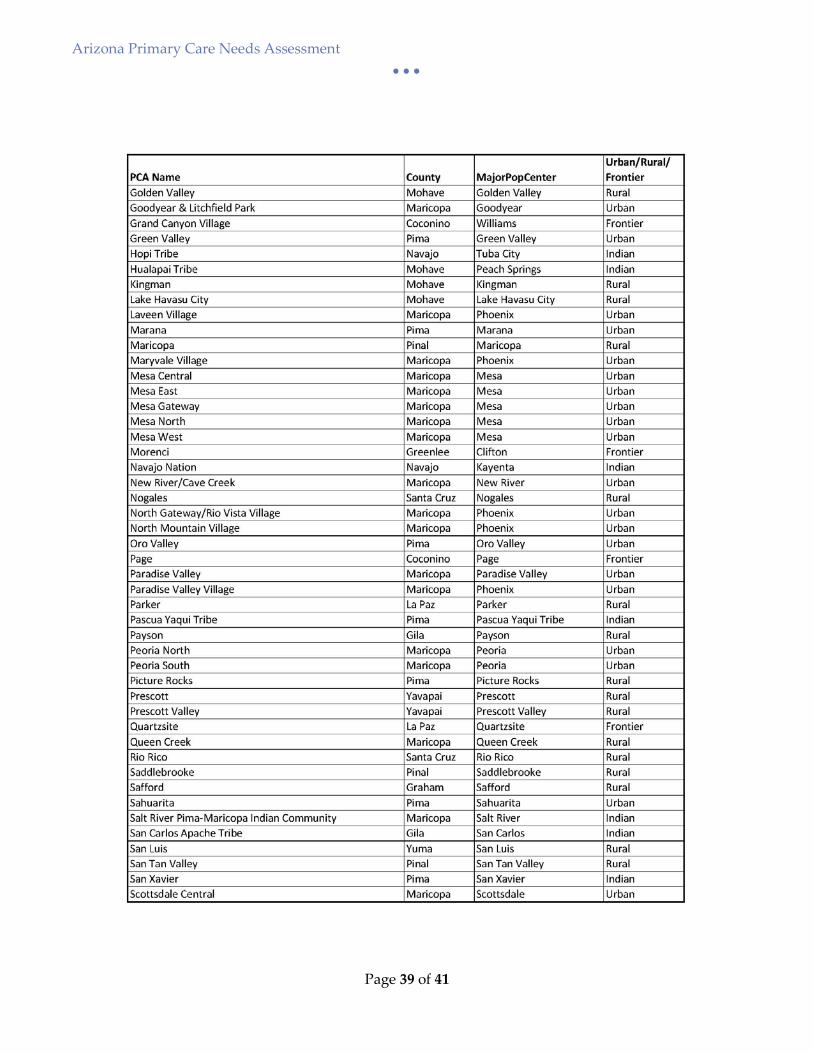
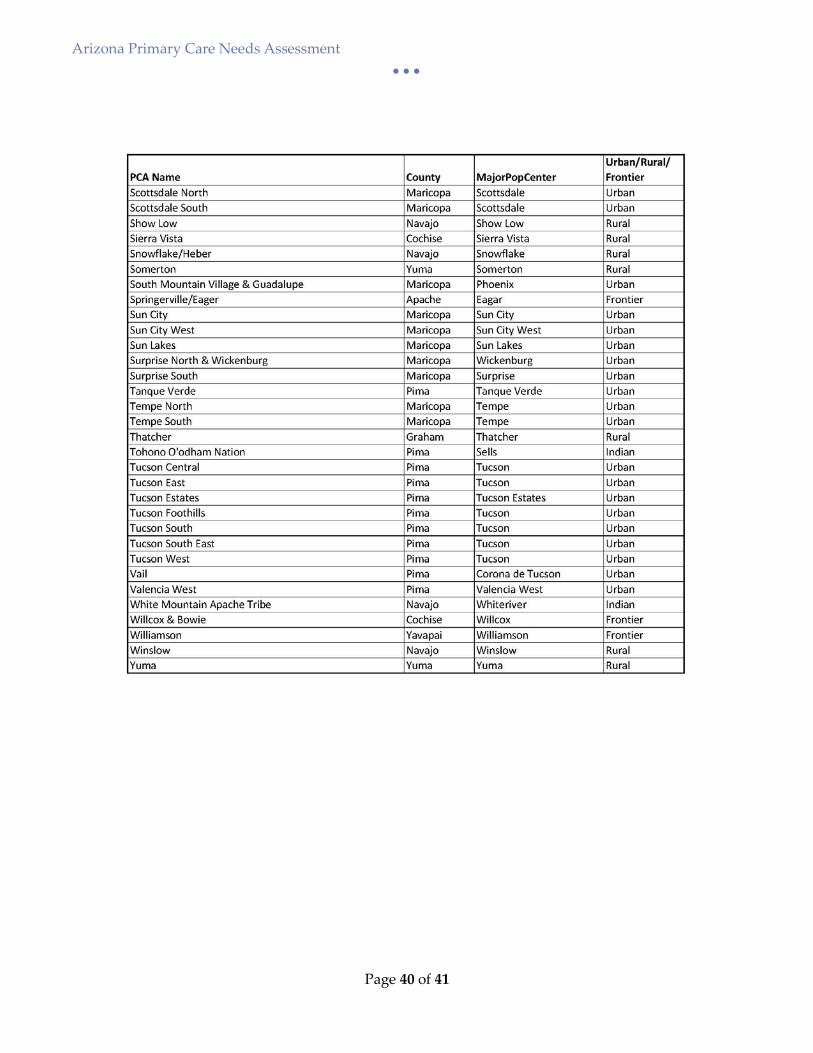
The revised PCA boundaries were formally adopted in 2014 and utilized for the 2014 Arizona Medically Underserved Area Biennial Report. The PCAs are also being used by the ADHS Bureau of Public Health Statistics in a Community Profile Dashboard interactive mapping tool. This consistency in geographic units across the Department provides significant benefits to our stakeholders – reducing confusion and improving the ability to analyze and trend various data indicators. See Appendix B for a list of Arizona’s current PCAs, along with the county, population center and urban/rural/frontier designation for each.
METHODOLOGY
A specific methodology process, rules and exceptions were developed to guide the creation of PCAs, which are built from 2010 US Census Tracts. All PCAs have a population greater than 10,000 but less
Arizona Primary Care Needs Assessment • • •
Page 6 of 41
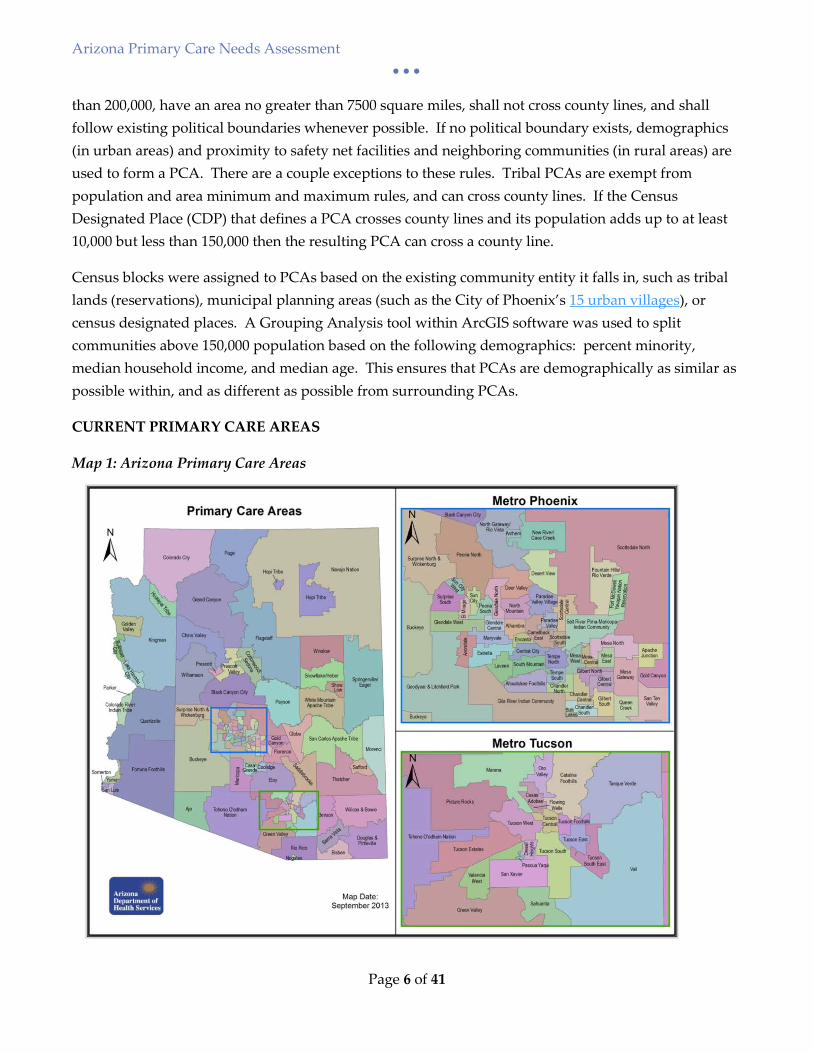
than 200,000, have an area no greater than 7500 square miles, shall not cross county lines, and shall follow existing political boundaries whenever possible. If no political boundary exists, demographics (in urban areas) and proximity to safety net facilities and neighboring communities (in rural areas) are used to form a PCA. There are a couple exceptions to these rules. Tribal PCAs are exempt from population and area minimum and maximum rules, and can cross county lines. If the Census Designated Place (CDP) that defines a PCA crosses county lines and its population adds up to at least 10,000 but less than 150,000 then the resulting PCA can cross a county line.
Census blocks were assigned to PCAs based on the existing community entity it falls in, such as tribal lands (reservations), municipal planning areas (such as the City of Phoenix’s 15 urban villages), or census designated places. A Grouping Analysis tool within ArcGIS software was used to split communities above 150,000 population based on the following demographics: percent minority, median household income, and median age. This ensures that PCAs are demographically as similar as possible within, and as different as possible from surrounding PCAs.
CURRENT PRIMARY CARE AREAS
Map 1: Arizona Primary Care Areas
Arizona Primary Care Needs Assessment • • •
Page 7 of 41
There are currently 126 PCAs (55 of them in Metro Phoenix and 20 in Metro Tucson). The average PCA has a population of 50,730 and an area of 905 square miles. At 199,814 Maryvale PCA has the largest population and Fort McDowell Yavapai is the smallest with a population of 971. Map 1 shows current PCA boundaries. Boundaries will be reassessed with the existing methodology upon release of the next decennial census.
Arizona Primary Care Needs Assessment • • •
Page 8 of 41
A Statewide Focus on Health Improvement
In the fall of 2013, the Arizona Department of Health Services (ADHS) made the strategic decision to become an accredited state public health department as deemed by the national Public Health Accreditation Board. In order to meet accreditation standards, ADHS conducted and published the State Health Assessment (SHA). This lengthy process conducted an analysis using both quantitative and qualitative data to determine the public health status of the state which provided guidance in priority setting, planning and in identifying health outcomes with the greatest potential for improvement while including Arizona’s unique population and community input. This work resulted in the identification of the top fifteen Leading Public Health Issues in Arizona. Two of which were access to well care and access to health insurance coverage.
The completion of the SHA led to the engagement of stakeholders for the development of the State Health Improvement Plan (SHIP). The SHIP established fifteen work groups to identify evidence based strategies to address each of the fifteen leading public health issues. The Arizona PCO staff provided leadership, data and issue briefs on the topics of access to well care and access to health insurance coverage.
The Arizona PCO partnered with the Bureau of Women’s and Children’s Health to contribute to the health insurance and access to care section and the Native American Listening Session of the Arizona Maternal and Child Health Needs Assessment 2015.
The Arizona Primary Care Needs Assessment builds on the State Health Assessment, Maternal and Child Health Needs Assessment and the State Health Improvement Plan by providing more concise information and data that impact access to care. This information can be used to inform community and health care organizations on where the need is in Arizona and can guide planning when developing programs, services and local policy.
Arizona Primary Care Needs Assessment • • •
Page 9 of 41
Shortage Designations
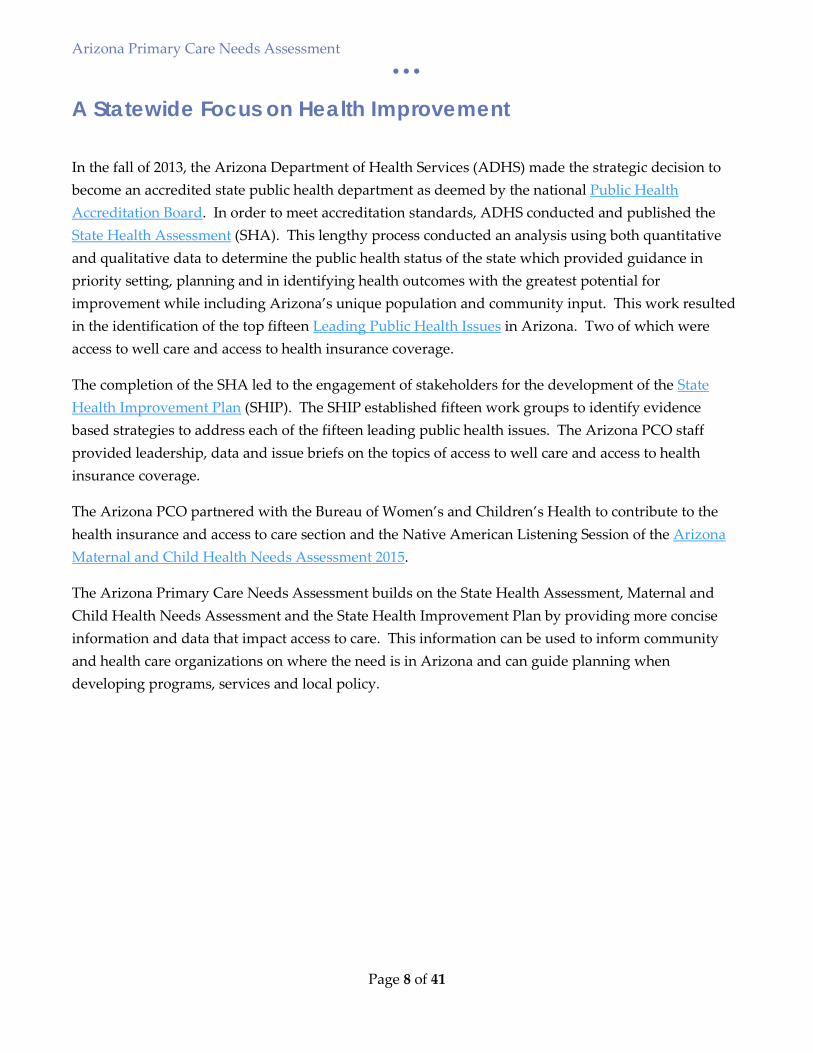
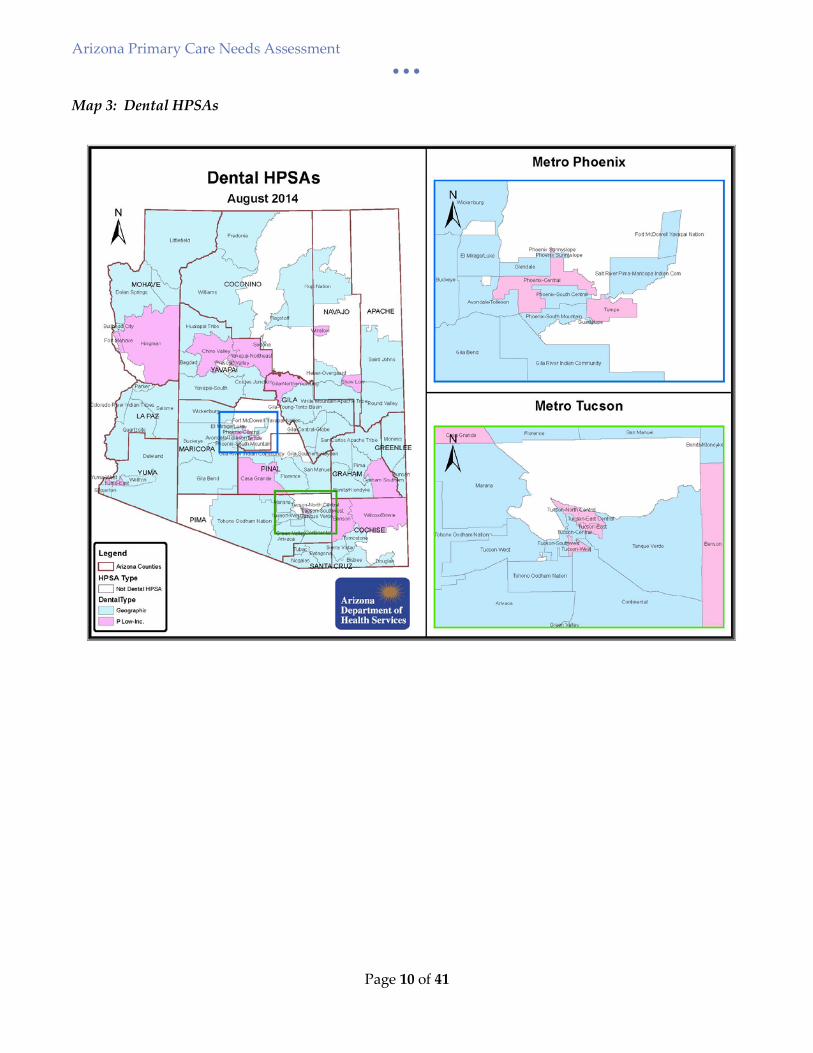
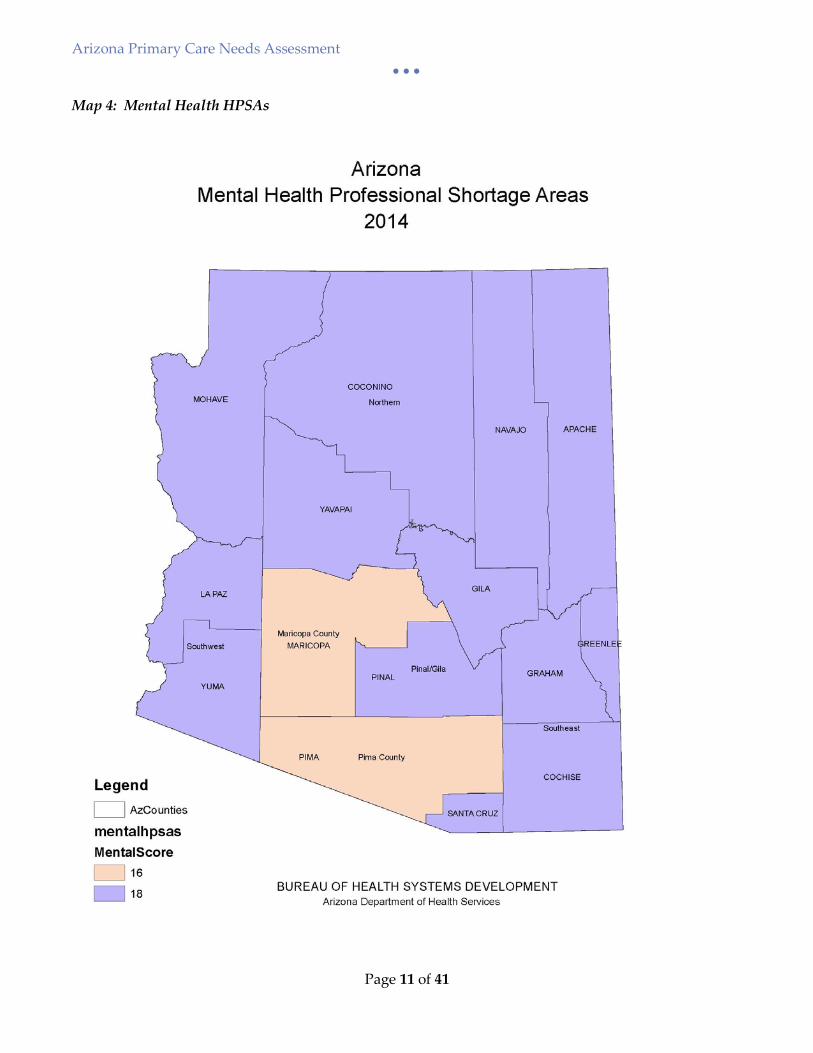
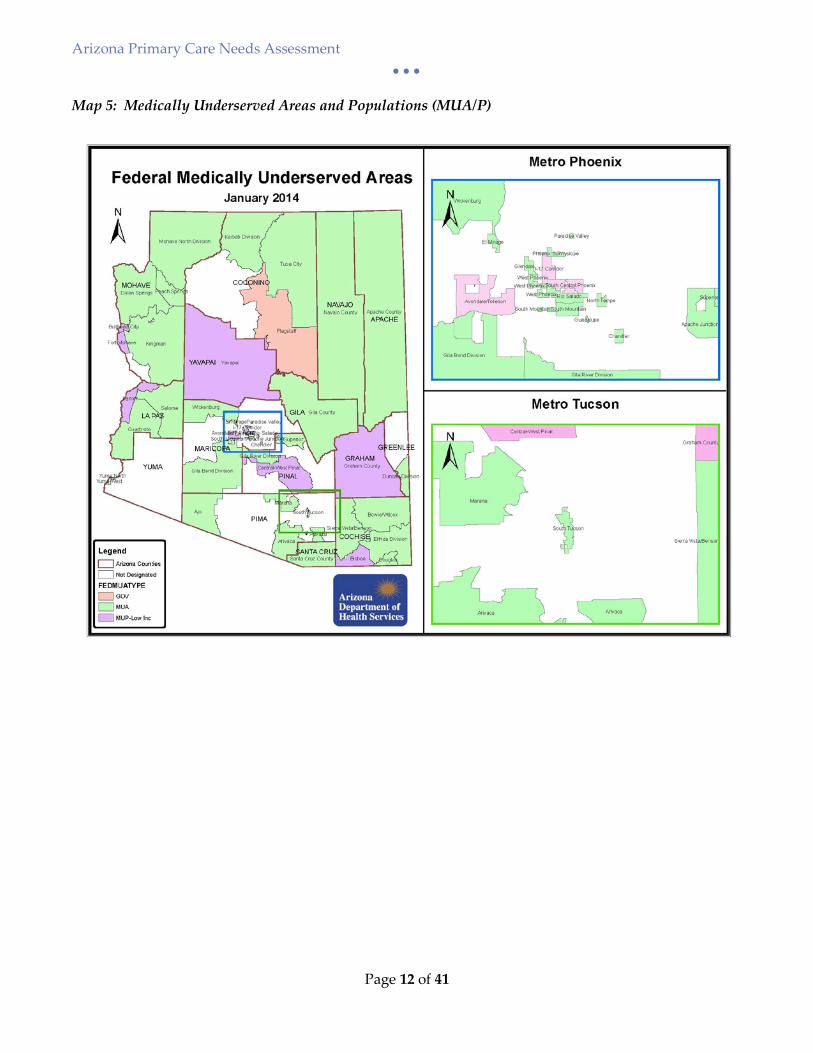
Arizona is a rapidly growing state, but its healthcare workforce has not kept pace with the population growth. This is evident by a total of 439 federally designated Health Professional Shortage Areas (HPSAs). This includes 160 primary care, 177 dental, and 102 mental health HPSA designations. There are also 37 Medically Underserved Area and 9 Medically Underserved Population designations in the state.i Arizona needs a total of 1,036 full-time providers (416 primary care, 416 dentists, and 204 psychiatrists) to practice in underserved areas to eliminate these designations.ii A large portion of Arizonans are impacted by provider shortages, with approximately 2.8 million residents living in primary care HPSAs and 2.3 million in dental HPSAs. The entire state of Arizona is covered by current mental health HSPAs, illustrating a dire need for behavioral health professionals in the state. This lack of access to medical professionals providing chronic disease management, preventive and integrated care leads to poor health outcomes in underserved communities. The maps below illustrate current shortage areas by discipline.
Map 2: Primary Care HPSAs
Arizona Primary Care Needs Assessment • • •
Page 10 of 41
Map 3: Dental HPSAs
Arizona Primary Care Needs Assessment • • •
Page 11 of 41
Map 4: Mental Health HPSAs
Arizona Primary Care Needs Assessment • • •
Page 12 of 41
Map 5: Medically Underserved Areas and Populations (MUA/P)
Arizona Primary Care Needs Assessment • • •
Page 13 of 41
Needs Assessment – Demographics
Arizona is a rapidly growing diverse state of over 6.5 million, with 51% of its current population belonging to a racial or ethnic minority groupiii. Arizona’s expected population growth of 78% between 2012 and 2050. It has the country’s 3rd highest overall poverty rate (21%) and 7th highest unemployment rateiv.
Arizona is unique in that the majority of its population is centered in two counties: Maricopa (Phoenix metro area) and Pima (Tucson metro area). Population density ranges from over 5,000 people per square mile in six of the Phoenix-area PCAs, to less than 6 people per square mile in many of our tribal and frontier PCAs.
Statewide, 30% of the population is Hispanic, but in some central Phoenix PCAs and Southern Arizona border communities that rate ranges from 50-93%. There are twenty-four federally-recognized American Indian tribes in Arizona. The majority of Arizona’s American Indian population (which is 4.4% of the state’s overall population) resides on tribal reservations, which makes up a quarter of the state’s land. 4.2% of Arizona’s population is Black, with higher representations in Phoenix and Tucson-area PCAs. Asians make up 2.9% of the state’s population, with higher representations (5-10%) in Phoenix suburbs Chandler, Tempe, Gilbert, and Scottsdale.
The PCA Profile project assessed Arizona’s communities on a variety of demographic factors such as these that impact people’s access to care. A few are highlighted below. All demographic data was obtained from American Community Survey 2010-2014 Population Estimates.
POVERTY
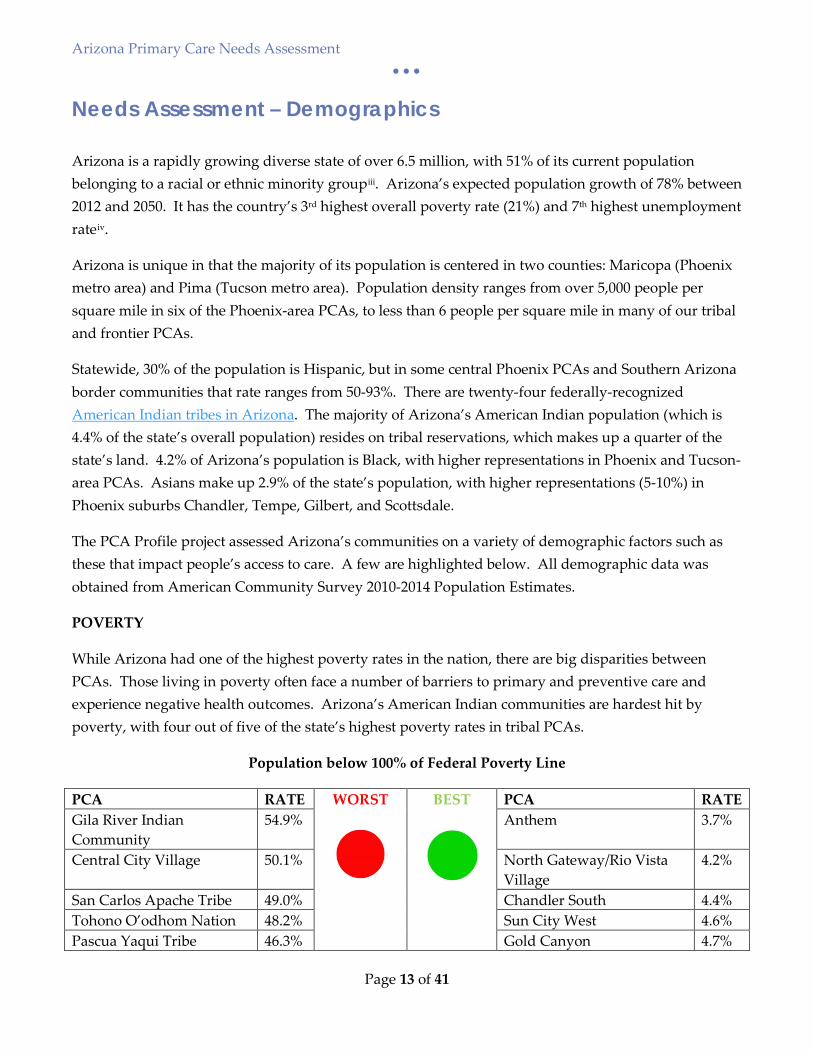
While Arizona had one of the highest poverty rates in the nation, there are big disparities between PCAs. Those living in poverty often face a number of barriers to primary and preventive care and experience negative health outcomes. Arizona’s American Indian communities are hardest hit by poverty, with four out of five of the state’s highest poverty rates in tribal PCAs.
Population below 100% of Federal Poverty Line
PCA RATE WORST BEST PCA RATE Gila River Indian Community
54.9% Anthem 3.7%
Central City Village 50.1% North Gateway/Rio Vista Village
4.2%
San Carlos Apache Tribe 49.0% Chandler South 4.4% Tohono O’odhom Nation 48.2% Sun City West 4.6% Pascua Yaqui Tribe 46.3% Gold Canyon 4.7%
Arizona Primary Care Needs Assessment • • •
Page 14 of 41
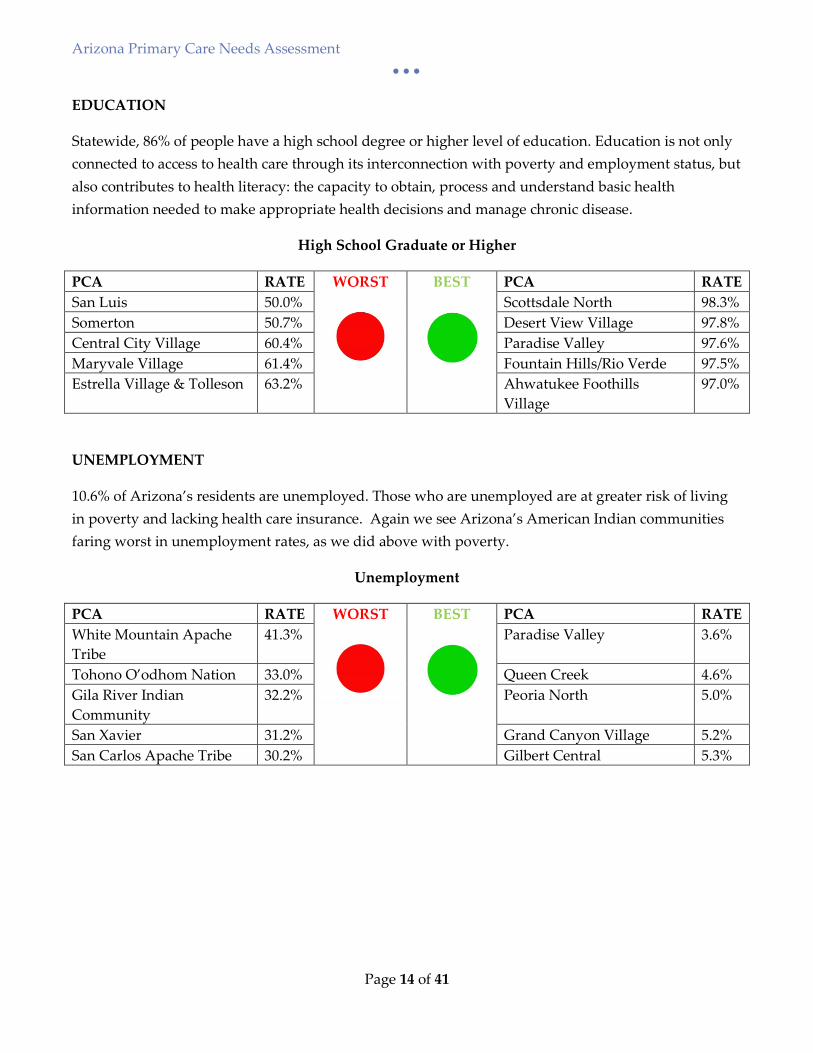
EDUCATION
Statewide, 86% of people have a high school degree or higher level of education. Education is not only connected to access to health care through its interconnection with poverty and employment status, but also contributes to health literacy: the capacity to obtain, process and understand basic health information needed to make appropriate health decisions and manage chronic disease.
High School Graduate or Higher
PCA RATE WORST BEST PCA RATE San Luis 50.0% Scottsdale North 98.3% Somerton 50.7% Desert View Village 97.8% Central City Village 60.4% Paradise Valley 97.6% Maryvale Village 61.4% Fountain Hills/Rio Verde 97.5% Estrella Village & Tolleson 63.2% Ahwatukee Foothills
Village 97.0%
UNEMPLOYMENT
10.6% of Arizona’s residents are unemployed. Those who are unemployed are at greater risk of living in poverty and lacking health care insurance. Again we see Arizona’s American Indian communities faring worst in unemployment rates, as we did above with poverty.
Unemployment
PCA RATE WORST BEST PCA RATE White Mountain Apache Tribe
41.3% Paradise Valley 3.6%
Tohono O’odhom Nation 33.0% Queen Creek 4.6% Gila River Indian Community
32.2% Peoria North 5.0%
San Xavier 31.2% Grand Canyon Village 5.2% San Carlos Apache Tribe 30.2% Gilbert Central 5.3%
Arizona Primary Care Needs Assessment • • •
Page 15 of 41
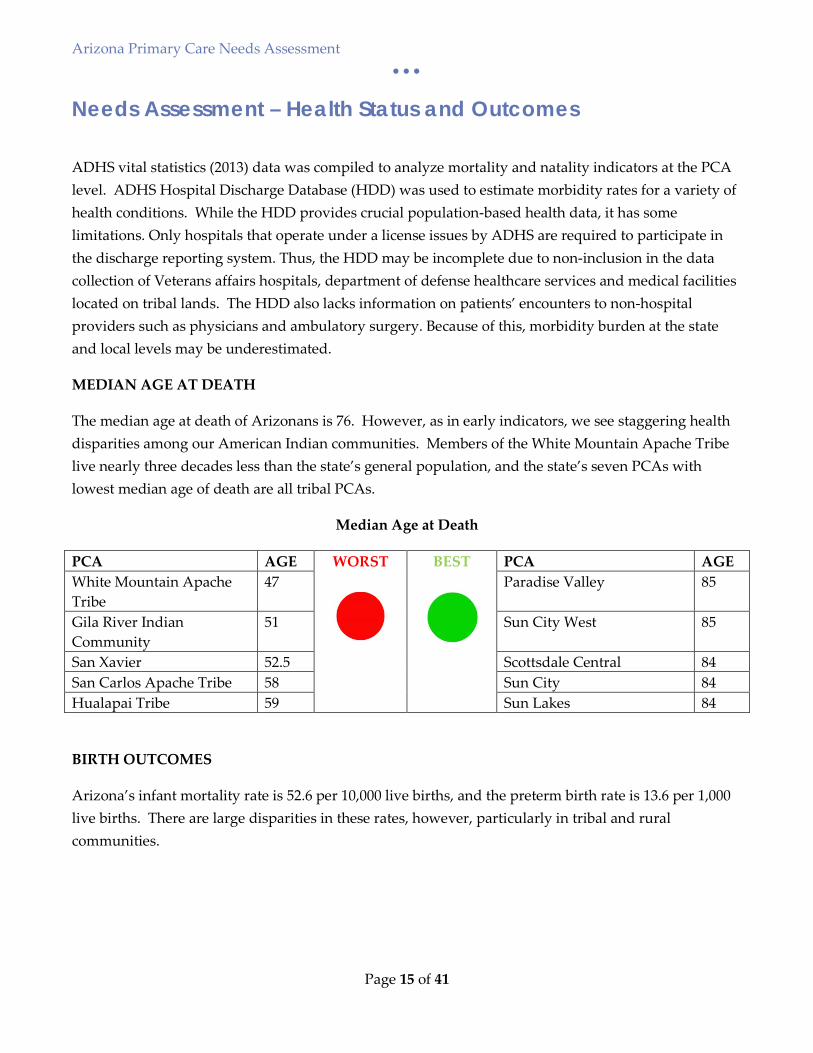
Needs Assessment – Health Status and Outcomes
ADHS vital statistics (2013) data was compiled to analyze mortality and natality indicators at the PCA level. ADHS Hospital Discharge Database (HDD) was used to estimate morbidity rates for a variety of health conditions. While the HDD provides crucial population-based health data, it has some limitations. Only hospitals that operate under a license issues by ADHS are required to participate in the discharge reporting system. Thus, the HDD may be incomplete due to non-inclusion in the data collection of Veterans affairs hospitals, department of defense healthcare services and medical facilities located on tribal lands. The HDD also lacks information on patients’ encounters to non-hospital providers such as physicians and ambulatory surgery. Because of this, morbidity burden at the state and local levels may be underestimated.
MEDIAN AGE AT DEATH
The median age at death of Arizonans is 76. However, as in early indicators, we see staggering health disparities among our American Indian communities. Members of the White Mountain Apache Tribe live nearly three decades less than the state’s general population, and the state’s seven PCAs with lowest median age of death are all tribal PCAs.
Median Age at Death
PCA AGE WORST BEST PCA AGE White Mountain Apache Tribe
47 Paradise Valley 85
Gila River Indian Community
51 Sun City West 85
San Xavier 52.5 Scottsdale Central 84 San Carlos Apache Tribe 58 Sun City 84 Hualapai Tribe 59 Sun Lakes 84
BIRTH OUTCOMES
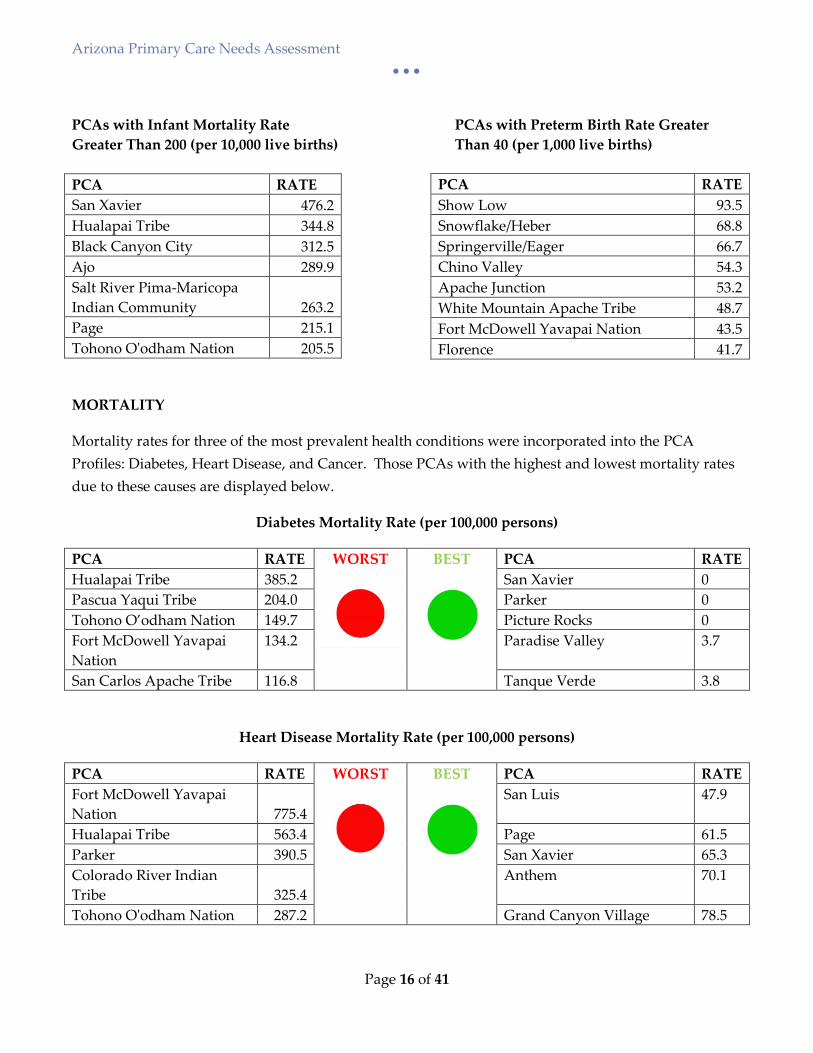
Arizona’s infant mortality rate is 52.6 per 10,000 live births, and the preterm birth rate is 13.6 per 1,000 live births. There are large disparities in these rates, however, particularly in tribal and rural communities.
Arizona Primary Care Needs Assessment • • •
Page 16 of 41
PCAs with Infant Mortality Rate PCAs with Preterm Birth Rate Greater Greater Than 200 (per 10,000 live births) Than 40 (per 1,000 live births) PCA RATE San Xavier 476.2 Hualapai Tribe 344.8 Black Canyon City 312.5 Ajo 289.9 Salt River Pima-Maricopa Indian Community 263.2 Page 215.1 Tohono O'odham Nation 205.5
MORTALITY
Mortality rates for three of the most prevalent health conditions were incorporated into the PCA Profiles: Diabetes, Heart Disease, and Cancer. Those PCAs with the highest and lowest mortality rates due to these causes are displayed below.
Diabetes Mortality Rate (per 100,000 persons)
PCA RATE WORST BEST PCA RATE Hualapai Tribe 385.2 San Xavier 0 Pascua Yaqui Tribe 204.0 Parker 0 Tohono O’odham Nation 149.7 Picture Rocks 0 Fort McDowell Yavapai Nation
134.2 Paradise Valley 3.7
San Carlos Apache Tribe 116.8 Tanque Verde 3.8
Heart Disease Mortality Rate (per 100,000 persons)
PCA RATE WORST BEST PCA RATE Fort McDowell Yavapai Nation 775.4
San Luis 47.9
Hualapai Tribe 563.4 Page 61.5 Parker 390.5 San Xavier 65.3 Colorado River Indian Tribe 325.4
Anthem 70.1
Tohono O'odham Nation 287.2 Grand Canyon Village 78.5
PCA RATE Show Low 93.5 Snowflake/Heber 68.8 Springerville/Eager 66.7 Chino Valley 54.3 Apache Junction 53.2 White Mountain Apache Tribe 48.7 Fort McDowell Yavapai Nation 43.5 Florence 41.7
Arizona Primary Care Needs Assessment • • •
Page 17 of 41
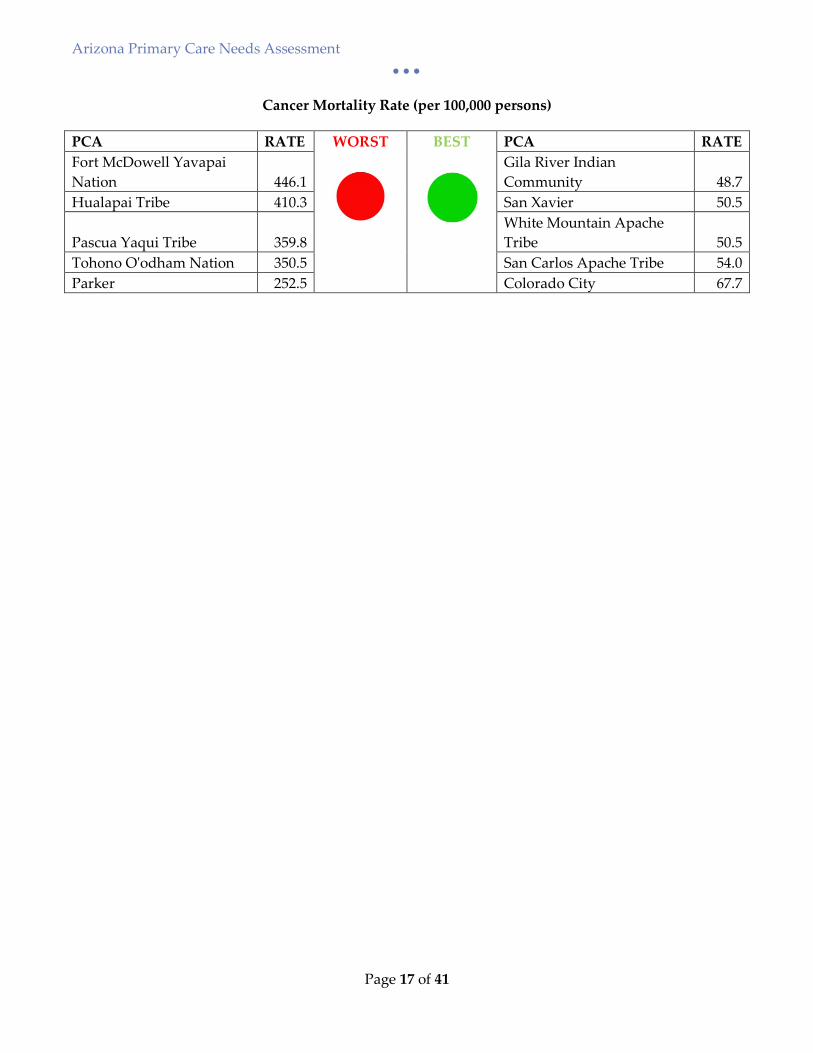
Cancer Mortality Rate (per 100,000 persons)
PCA RATE WORST BEST PCA RATE Fort McDowell Yavapai Nation 446.1
Gila River Indian Community 48.7
Hualapai Tribe 410.3 San Xavier 50.5
Pascua Yaqui Tribe 359.8 White Mountain Apache Tribe 50.5
Tohono O'odham Nation 350.5 San Carlos Apache Tribe 54.0 Parker 252.5 Colorado City 67.7
Arizona Primary Care Needs Assessment • • •
Page 18 of 41
Needs Assessment – Primary and Preventive Care
Arizona Behavioral Risk Factor Surveillance Survey (BRFSS) 2013 data was used for all but one of the indicators in this section. Sample size does not allow for analysis of responses at the PCA level, so only county and state rates are displayed in the PCA Profiles. The Arizona PCO hopes to explore other sources of data related to primary and preventive care for future annual updates of the Profiles. Collaboration is underway with the Arizona State Immunization Information System (ASIIS) to include immunization data in future PCA profiles.
USUAL SOURCE OF CARE
Statewide, 68% of BRFSS respondents indicated they had “usual source of health care”. Apache and Coconino counties fell short of this state average at 46% and 59% respectively. A similar number (66%) of those surveyed had visited the dentist in the past year, but in a handful of counties (Greenlee, La Paz, Mohave, Gila and Yuma) that rate was below 55%.
PREVENTIVE CARE
Annual flu vaccine is an important preventive health measure among individuals age 65 and up. 60% of BRFSS respondents in this age group reported having a flu shot in the past year. But in southeastern Arizona (Greenlee, Graham, Cochise and Santa Cruz counties), this rate was only 39%. This is particularly concerning in Cochise County, which has a larger proportion of its population in the 65+ age groups than the state average.
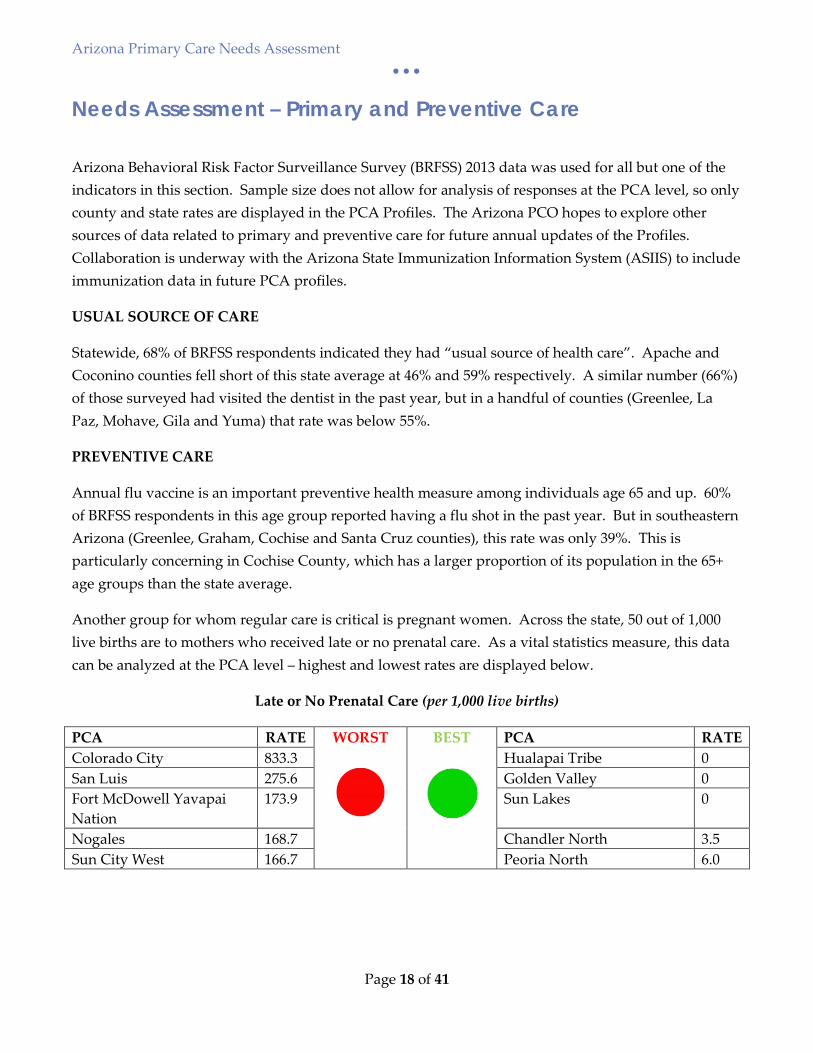
Another group for whom regular care is critical is pregnant women. Across the state, 50 out of 1,000 live births are to mothers who received late or no prenatal care. As a vital statistics measure, this data can be analyzed at the PCA level – highest and lowest rates are displayed below.
Late or No Prenatal Care (per 1,000 live births)
PCA RATE WORST BEST PCA RATE Colorado City 833.3 Hualapai Tribe 0 San Luis 275.6 Golden Valley 0 Fort McDowell Yavapai Nation
173.9 Sun Lakes 0
Nogales 168.7 Chandler North 3.5 Sun City West 166.7 Peoria North 6.0
Arizona Primary Care Needs Assessment • • •
Page 19 of 41
RISK BEHAVIORS
Populations with high incidence of health risk behaviors are often in greater need of primary and preventive health care. Obesity is one indicator of poor nutrition and physical inactivity, and correlated with increased risk of chronic disease and other negative health outcomes. The statewide obesity rate is 27%. The northern Arizona counties of Apache and Navajo have obesity rates of 38% and 34% respectively.
Arizona Primary Care Needs Assessment • • •
Page 20 of 41
Needs Assessment – Access to Care
Underserved populations and areas can face a variety of barriers to accessing comprehensive primary care. Below are some of the most common.
UNINSURANCE
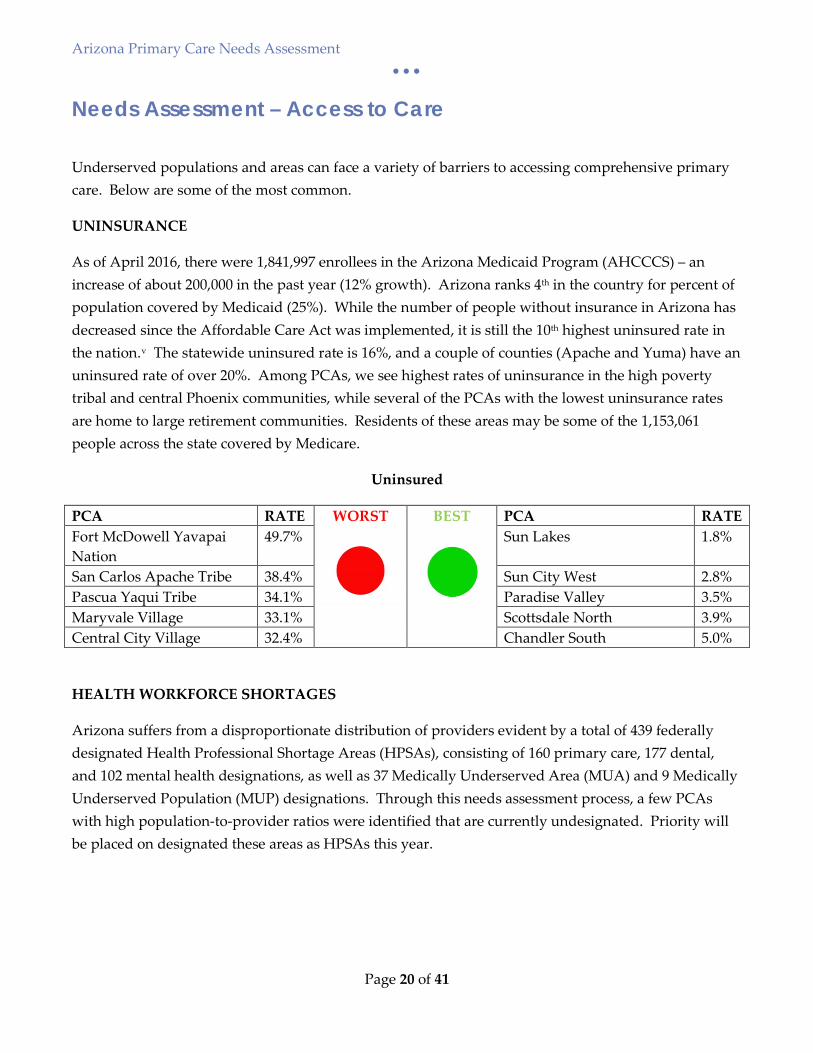
As of April 2016, there were 1,841,997 enrollees in the Arizona Medicaid Program (AHCCCS) – an increase of about 200,000 in the past year (12% growth). Arizona ranks 4th in the country for percent of population covered by Medicaid (25%). While the number of people without insurance in Arizona has decreased since the Affordable Care Act was implemented, it is still the 10th highest uninsured rate in the nation.v The statewide uninsured rate is 16%, and a couple of counties (Apache and Yuma) have an uninsured rate of over 20%. Among PCAs, we see highest rates of uninsurance in the high poverty tribal and central Phoenix communities, while several of the PCAs with the lowest uninsurance rates are home to large retirement communities. Residents of these areas may be some of the 1,153,061 people across the state covered by Medicare.
Uninsured
PCA RATE WORST BEST PCA RATE Fort McDowell Yavapai Nation
49.7% Sun Lakes 1.8%
San Carlos Apache Tribe 38.4% Sun City West 2.8% Pascua Yaqui Tribe 34.1% Paradise Valley 3.5% Maryvale Village 33.1% Scottsdale North 3.9% Central City Village 32.4% Chandler South 5.0%
HEALTH WORKFORCE SHORTAGES
Arizona suffers from a disproportionate distribution of providers evident by a total of 439 federally designated Health Professional Shortage Areas (HPSAs), consisting of 160 primary care, 177 dental, and 102 mental health designations, as well as 37 Medically Underserved Area (MUA) and 9 Medically Underserved Population (MUP) designations. Through this needs assessment process, a few PCAs with high population-to-provider ratios were identified that are currently undesignated. Priority will be placed on designated these areas as HPSAs this year.
Arizona Primary Care Needs Assessment • • •
Page 21 of 41
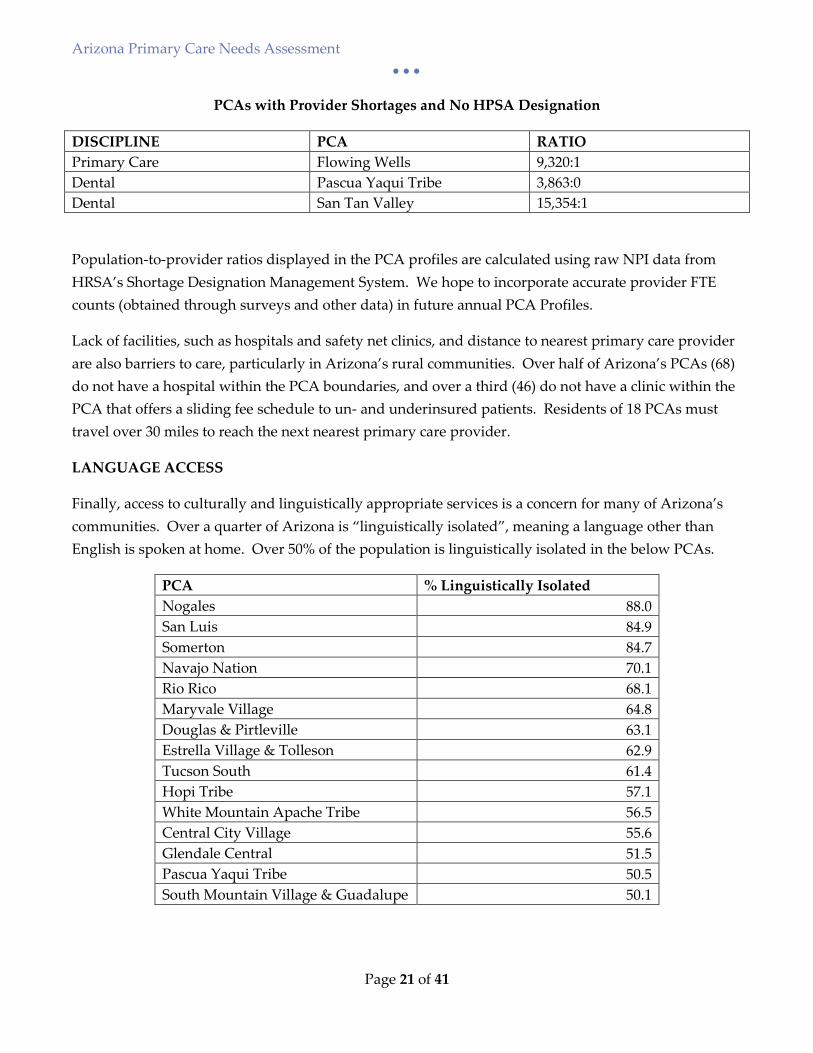
PCAs with Provider Shortages and No HPSA Designation
DISCIPLINE PCA RATIO Primary Care Flowing Wells 9,320:1 Dental Pascua Yaqui Tribe 3,863:0 Dental San Tan Valley 15,354:1
Population-to-provider ratios displayed in the PCA profiles are calculated using raw NPI data from HRSA’s Shortage Designation Management System. We hope to incorporate accurate provider FTE counts (obtained through surveys and other data) in future annual PCA Profiles.
Lack of facilities, such as hospitals and safety net clinics, and distance to nearest primary care provider are also barriers to care, particularly in Arizona’s rural communities. Over half of Arizona’s PCAs (68) do not have a hospital within the PCA boundaries, and over a third (46) do not have a clinic within the PCA that offers a sliding fee schedule to un- and underinsured patients. Residents of 18 PCAs must travel over 30 miles to reach the next nearest primary care provider.
LANGUAGE ACCESS
Finally, access to culturally and linguistically appropriate services is a concern for many of Arizona’s communities. Over a quarter of Arizona is “linguistically isolated”, meaning a language other than English is spoken at home. Over 50% of the population is linguistically isolated in the below PCAs.
PCA % Linguistically Isolated Nogales 88.0 San Luis 84.9 Somerton 84.7 Navajo Nation 70.1 Rio Rico 68.1 Maryvale Village 64.8 Douglas & Pirtleville 63.1 Estrella Village & Tolleson 62.9 Tucson South 61.4 Hopi Tribe 57.1 White Mountain Apache Tribe 56.5 Central City Village 55.6 Glendale Central 51.5 Pascua Yaqui Tribe 50.5 South Mountain Village & Guadalupe 50.1
Arizona Primary Care Needs Assessment • • •
Page 22 of 41
Current Efforts - Health Disparities
Even a brief summary of this needs assessment makes it startlingly clear that great health disparities exist in Arizona, particularly among American Indian populations, rural communities, and other racial and ethnic minority groups. The Arizona Health Disparities Center is working to reduce these disparities.
ARIZONA HEALTH DISPARITIES CENTER
The Arizona Department of Health Services (ADHS) Arizona Health Disparities Center (AHDC), which is housed within the same bureau as the Arizona PCO (Bureau of Health Systems Development), serves as the federal designee for the Department of Health and Human Services, Office of Minority Health. The AHDC’s mission is to promote and protect the health and well-being of the minority and vulnerable populations of Arizona by enhancing the capacity of the public health system to effectively serve minority populations and reduce health disparities. The AHDC works to coordinate statewide efforts and implement work activities specific to minority health and health disparities. Additionally, the AHDC serves as a vehicle within the ADHS and among partners to promote policies that address and reduce health disparities.
The AHDC builds upon a cross-sectional team approach and intra-agency effort integration, and seeks to build the capacity of the State through education, training, advocacy and coalition building to address minority health and health disparities. The AHDC provides technical assistance on Culturally and Linguistically Appropriate Services Standards, cultural competency, health literacy, and other health disparities-related areas. Since the establishment of the AHDC, the ADHS has been at the forefront in assuring health disparities as a priority in the development of program plans, services and policies. ADHS program strategic plans have cited reducing health disparities as one of its guiding principles and focus areas. The AHDC has been able to leverage this opportunity to be actively involved at various decision-making levels throughout ADHS and serve on national, regional and local initiatives and advisory boards.
The AHDC has been a State Partnership Initiative to Address Health Disparities grant recipient (OMH projects) since 2006. Over the years, the AHDC has worked with diverse organizations to address minority health and reduce health disparities in Arizona through a variety of channels. Ongoing efforts include the below initiatives.
HEALTHY SMILE HEALTHY LIFE PROJECT
The AHCD is implementing an evidence-based approach to address oral health disparities affecting the urban American Indian and Hispanic communities in central Phoenix, Maricopa County, Arizona. Its
Arizona Primary Care Needs Assessment • • •
Page 23 of 41
Healthy Smile Healthy Life (HSHL) project intends to raise awareness of oral health among American Indian and Hispanic community leaders and members; enhance oral health education, screenings, fluoride varnishes and referral services for the American Indian and Hispanic children (0-17 years old), pregnant women and new mothers and integrate dental care and primary care to deliver care coordination services in a patient-centered medical and dental home in central Phoenix. The AHDC released the Oral Health Data Profile in February 2016. The profile provides a snapshot of oral health status in central Phoenix. This baseline data serves as the foundation of the AHDC HSHL project and will help to show were oral health efforts could be focused. The profile will be updated yearly over the course of the 5-year grant. Changes in trends from year to year will be tracked in order to assess the efficiency of the project efforts. Currently, the AHDC is working with its partners to develop oral health educational materials and to make outreach efforts to promote the importance of oral health targeting urban American Indians and Hispanic/Latinos.
CLAS STANDARDS TRAINING
The AHDC is dedicated to increasing the awareness, understanding and use of the National Standards for Culturally and Linguistically Appropriate Services (CLAS) in Health and Health Care throughout Arizona. CLAS Standards are intended to advance health equity, improve quality and help eliminate health care disparities. The AHDC hosts two types of CLAS Standards training: online and in-person. The AHDC also provides technical assistance on implementation of CLAS Standards. In addition, the AHDC leads the Arizona Health Alliance for Language Access Rights (AHALAR), an active workgroup to improve access to interpretative and translation services, resources and information available to populations with Limited English Proficiency (LEP) in Arizona.
Arizona Primary Care Needs Assessment • • •
Page 24 of 41
Current Efforts – Workforce Programs
SUMMARY OF PROGRAMS
The Arizona PCO administers or provides technical assistance as the primary state point of contact for the following workforce programs aimed at increasing access to primary care, dental and behavioral health care services in underserved areas and populations:
Arizona State Loan Repayment Program (SLRP): The SLRP provides loan repayment incentives for primary care providers, dentists, mental health providers and pharmacists to provide primary care services in urban or rural, public, non-profit practices located in federally designated Health Professional Shortage Areas (HPSAs). Program funds are used to repay qualifying educational loans in return for the provision of primary care services for a minimum of two years. Eligible disciplines include: MDs/DOs, Dentists, PAs, NPs, nurse mid-wives, behavioral health providers, and pharmacists. Eligible specialties include: Family Medicine, Internal Medicine, OB/GYN, Pediatrics, Geriatrics, Psychiatry, Adult Medicine, Women’s Health, Pharmacy, or General Dentistry.
Rural Private Primary Care Provider Loan Repayment Program (RPPCPLRP): The RPPCPLRP provides loan repayment incentives for primary care providers, dentists, mental health providers and pharmacists to provide primary care services in a rural, private practice located in a HPSA or an AzMUA (Arizona Medically Underserved Area). Program funds are used to repay qualifying educational loans in return for the provision of primary care services for a minimum of two years. Eligible disciplines include: MD/DO, Dentists, PAs, NPs, and nurse mid-wives. Eligible specialties include: Family Medicine, Internal Medicine, OB/GYN, Pediatrics, Geriatrics, Psychiatry, Adult Medicine, Women’s Health, Pharmacy or General Dentistry.
National Health Service Corps Program (NHSC): The National Health Services Corps (NHSC) recruits and places primary health care professionals at eligible NHSC certified sites within federally designated HPSAs. NHSC recruits primary care physicians, nurse practitioners, physician assistants, certified nurse-midwives, dentists, dental hygienists, and mental health professionals. These providers serve in community-based systems of care in return for scholarship or loan repayment assistance.
Arizona J-1 Visa Waiver Program (Conrad 30): The Arizona J-1 Visa Waiver program supports J-1 visa waiver requests on behalf of foreign medical graduates who have obtained a J-1 visa for graduate medical studies in the United States. The program supports up to 30 requests per year for both primary care and specialist services. Program participants are required to serve a minimum of three years in a federally designated Health Professional Shortage Area, Medically Underserved Area or serving a Medically Underserved Population.
Arizona Primary Care Needs Assessment • • •
Page 25 of 41
Arizona National Interest Waiver Program (NIW): The Arizona NIW program supports Arizona sponsored J-1 participants who provide primary care or specialty services in underserved areas of Arizona located in a federally designated Health Professional Shortage Area, Medically Underserved Area or serving a Medically Underserved Population. Program participants are required to serve an aggregate service of five years.
Nurse Corps Loan Repayment Program (Nurse Corps LRP): The NURSE Corps LRP assists in the recruitment and retention of professional Registered Nurses (RNs) and advanced practice RNs (i.e., nurse practitioners, certified registered nurse anesthetists, certified nurse midwives, clinical nurse specialists). The program offers substantial financial assistance to eligible RNs to repay a portion of their qualifying nursing educational loans in exchange for full-time service either at a health care facility with a critical shortage of nurses or at an accredited eligible school of nursing in the case of nurse faculty.
Nurse Corps Scholarship Program (Nurse Corps SP): The NURSE Corps SP enables students accepted or enrolled in a diploma, associate, baccalaureate or graduate nursing programs (including RN to BSN Bridge Program) to receive funding for tuition, fees and other educational costs in exchange for service after graduation working at an eligible Critical Shortage Facility located in a federally designated Health Professional Shortage Area (HPSA) in Arizona..
CURRENT PARTICIPATION
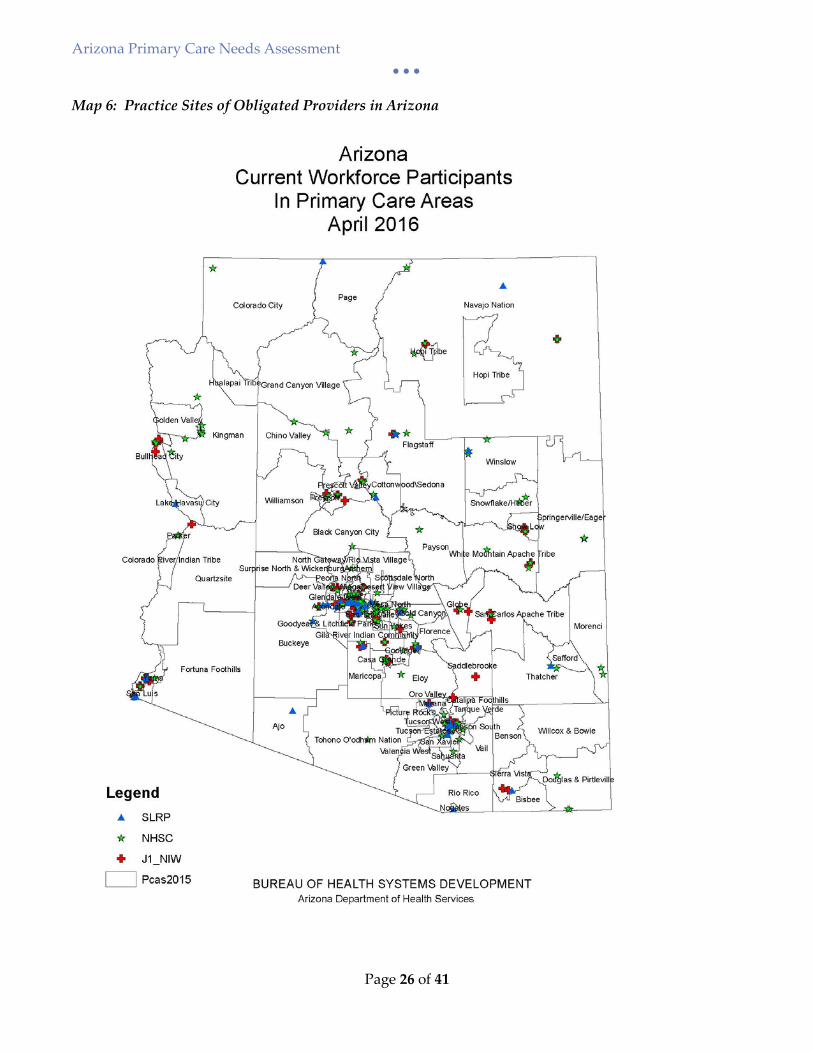
There are currently 520 obligated providers in Arizona (336 NHSC, 43 SLRP, 51 Nurse Corps and 90 J1). Site locations of currently obligated providers are shown on Map 6 below. The total number of eligible workforce practice sites in federally designated Health Professional Shortage Areas/Medically Underserved Areas in the State is 594 of which 430 are NHSC approved sites, 90 J1 sites, 37 Nurse Corps sites, and 37 State Loan Repayment Program sites. The Arizona PCO continues to utilize effective tools and resources and leverages new and existing partnerships to help improve recruitment and retention in the State.
Arizona Primary Care Needs Assessment • • •
Page 26 of 41
Map 6: Practice Sites of Obligated Providers in Arizona
Arizona Primary Care Needs Assessment • • •
Page 27 of 41
STATE LOAN REPAYMENT PROGRAM EXPANSION
The Arizona PCO has focused heavily on the expansion of the State Loan Repayment Program (SLRP). Efforts in changing the SLRP legislation began in July of 2014 and continued until the eventual passing of Senate Bill 1194 on February 24, 2015 that expanded the program effective July 3, 2015. Senate Bill 1194 allows the program to implement the following changes with the goal of alleviating the workforce shortages:
• expands the eligible disciplines to include physicians in geriatrics and psychiatry, behavioral health providers, and pharmacists;
• enhances the award amounts providers may be eligible to receive, up to $65K for a two year commitment for physicians and dentists and up to $50K for advance practice providers, behavioral health providers and pharmacists; and
• removes the four year service participation cap allowing providers the opportunity to renew year to year as long as they continue to qualify for the program.
With the new legislation, the program is required to give priority to providers who are residents of Arizona, and those serving in rural and high HPSA score areas. In addition, the new legislation allowed the program authority to update administrative rules through an exempt rulemaking process. This process began in March of 2015. The new rules – which are clear, transparent and consistent with state and federal requirements – were implemented April 1, 2016. The administrative rules provide for a more effective program administration and utilization of funding ensuring that providers working in rural and high need areas of the State get priority for loan repayment funds as required by the new statute. Since Senate Bill 1194 became effective in July 2015, the program has had an increased demand of up to 300% and as a result, the program reached its full capacity on September 15, 2015 just three months into the state Fiscal Year 2016.
OUTREACH AND TECHNICAL ASSISTANCE
The Arizona PCO, in partnership with the Arizona Alliance for Community Health Centers (Arizona Primary Care Association), hosted the 2016 Recruitment and Retention Forum on March 31, 2016 at the Black Canyon Conference Center in Phoenix, AZ. The forum had 80 attendees consisting of representatives from federally qualified health centers (FQHC), FQHC-Look Alike, IHS, tribal 638, rural health clinics, critical access hospitals, State Office of Rural Health, 3RNet, primary care training programs, AHEC, hospitals, NHSC sites, and other non-profit facilities. The forum provided a platform to share information on strategies that can be utilized to help improve recruitment and retention of providers in Arizona including various provider incentives programs, shortage designations, recruitment tools, trainings and untapped resources.
Arizona Primary Care Needs Assessment • • •
Page 28 of 41
The Arizona PCO, again in partnership with the Arizona PCA, hosted the 4th National Health Service Corps (NHSC) Scholars Conference on February 9, 2016 in conjunction with the Arizona Alliance for Community Health Centers Annual Meeting. Thirteen (13) scholars were in attendance. The scholars conference aims to support NHSC scholars attending school in Arizona by providing comprehensive information relevant to their future service commitment in the HPSA that include understanding HPSA designations, locations of HPSAs eligible for NHSC scholar placement, loan repayment incentives, interviewing skills training, resume writing, and other available state and federal support and resources that can facilitate their future practice site selection and help with their successful completion of their NHSC scholar service commitment. The Scholars conference also provided opportunities for scholars to network with senior leadership of FQHCs and receive first-hand information of current or potential openings.
Arizona Primary Care Needs Assessment • • •
Page 29 of 41
Current Efforts – Community Development
SUMMARY OF COMMUNITY DEVELOPMENT PROGRAM
The Arizona PCO’s Community Development Program (CDP) offers technical assistance and resources to statewide stakeholders to support efforts to increase access to comprehensive primary care for underserved areas and populations. This includes providing education on Section 330 Community Health Center application requirements, as well as developing and distributing data tools to support health planning, needs assessment and grant writing. The Arizona PCO compiles all necessary data and runs individualized Need for Assistance (NFA) worksheets for organizations applying for Community Health Center New Access Point funding. The Arizona PCO has also historically published annual Primary Care Area Statistical Profiles and ran specialized “Special Area Profiles” with the same data set to meet the needs of our stakeholders. The new PCA Profiles developed as part of this Primary Care Needs Assessment make these resources even more user-friendly and offer enhanced data.
The Arizona PCO continues to support expansion of primary healthcare throughout the state by providing data tools as described above and letters of support for funding opportunities to a variety of stakeholders: Federally Qualified Health Centers (FQHCs) and FQHC Look-Alikes, behavioral health agencies, rural health clinics, hospitals, special health care districts, tribal communities, universities and colleges, and community based organizations. We work closely with our partners Arizona Alliance for Community Health Centers (the Arizona PCA) and University of Arizona Center for Rural Health (the Arizona Rural Health Office) in these efforts.
EXPANSION OF AFFORDABLE, COMPREHENSIVE PRIMARY CARE IN ARIZONA
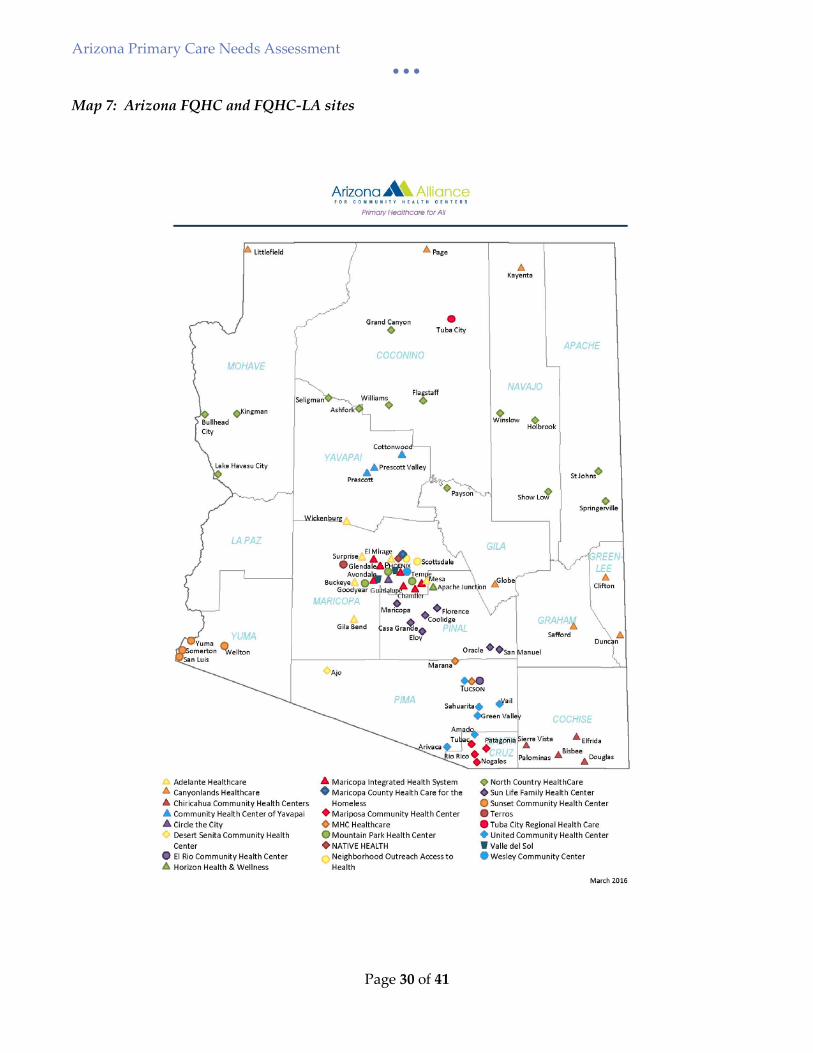
There are currently 149 FQHC and FQHC Look-Alike sites in Arizona (see Map 7). This safety net continues to expand, as over the past year Arizona was awarded a total of 8 new FQHC site awards of over $3.5 million to serve approximately 42,389 new patients statewide. The Arizona PCO provided 12 letters of support to health centers and other entities for various primary care-related funding opportunities in the past year, as well as hundreds of Need for Assistance Worksheets, statistical profiles, maps and other data requests.
The Arizona PCO also maintains a directory of primary care, dental and mental health providers that utilize a Sliding Fee Schedule (SFS). Many of these sites are FQHCs, FQHC Look-Alikes or Rural Health Clinics. Others are private or non-profit clinics with providers participating in Workforce Programs that require implementation of a SFS. This information is available to the public through an interactive map with address search function.
Arizona Primary Care Needs Assessment • • •
Page 30 of 41
Map 7: Arizona FQHC and FQHC-LA sites
Arizona Primary Care Needs Assessment • • •
Page 31 of 41
COMMUNITY PROFILES DASHBOARD
Another helpful tool for planning and conducting needs assessments related to primary care is the ADHS Community Profiles Dashboard – an interactive mapping tool that displays demographic, mortality, morbidity and natality data by PCA and County. The Arizona PCO assisted the ADHS Bureau of Public Health Statistics two years ago in planning for this robust new tool by administering a survey and webinar to gather statewide stakeholder feedback on desired indicators and functionality. The new PCA Profiles complement the Community Profiles Dashboard by offering users a document view of the Dashboard data and additional indicators stakeholders desired.
Arizona Primary Care Needs Assessment • • •
Page 32 of 41
Current Efforts – Shortage Designations
The Arizona Shortage Designation Program (SDP) continues to provide technical assistance to communities around the state to better understand the shortage designation process and to ensure accurate designation of underserved areas. Shortage Designation 101 presentations have been delivered to a variety of audiences in the past year including National Health Service Corps Scholars, Community Health Centers, Rural Health Clinics, hospitals and tribal communities.
HEALTH PROFESSIONAL SHORTAGE AREA (HPSA) DESIGNATION UPDATES
Over the coming year, the Arizona PCO will be updating all existing primary care, dental and mental health HPSA designations to match the new Primary Care Area boundaries. This major undertaking will ensure all eligible communities are designated and designations are reflective of Arizona’s current communities.
PROACTIVE FACILITY HPSA RESCORE
FQHCs, FQHC Look-Alikes and Rural Health Clinics are eligible for automatic facility HPSA designations. While the designation is automatic, the HPSA score is not updated unless specifically requested. The Arizona PCO is in the process of working with HRSA to rescore each of these facility HPSAs. When implemented a few years ago, this proactive approach resulted in significant increase in HPSA scores for these clinics. We anticipate additional score increases through this year’s process, making our state’s safety net providers more competitive for national workforce programs.
The Arizona PCO also coordinates with Indian Health Service (IHS) and state corrections to ensure all facility HPSA scores are as current as possible.
COLLABORATION WITH OFFICE OF ORAL HEALTH
The ADHS Office of Oral Health received an oral health workforce grant in 2015. The Arizona PCO is pleased to collaborate with the Office of Oral Health in this project through surveying dentists statewide, assessing shortages, applying for new dental HPSA designations where warranted, and raising awareness of shortage designations with oral health stakeholders such as the Dental Association and licensing board.
Arizona Primary Care Needs Assessment • • •
Page 33 of 41
Next Steps
PROMOTION OF NEW PRIMARY CARE AREA PROFILES
The Arizona PCO is excited to offer statewide stakeholders this new and improved tool for community-level health planning efforts. The data included in the profiles is frequently requested by partners who are writing grants or conducting needs assessments of their own. The new PCA Profiles will be loaded to the ADHS website in the coming month, and the PCO will then begin a campaign to share and promote these valuable data tools. This will include publicizing the profiles in the ADHS Director’s blog, sharing notices with the Arizona Alliance of Community Health Centers and Arizona Center for Rural Health, and holding a webinar to highlight the Profiles and other useful ADHS tools for our statewide stakeholders.
PCA PROFILES: PHASE TWO
The Arizona PCO plans to update the PCA Profiles annually and publish to the web. This will allow users to track data trends over time. Future improvements to the profiles will be explored, such as inclusion of new data indicators (i.e. immunization data), capability to expand and print the PCA map in full page view, linking the Profiles to the ADHS Community Profile Dashboard mapping tool, and potential to make the profiles themselves more interactive.
ENHANCED PROVIDER DATA COLLECTION
Accurate primary care, dental and mental health provider data is critical for shortage designations, but is also extremely useful to statewide partners who work to expand access to care to underserved communities. The Arizona PCO has plans to implement over the coming year a two-pronged approach to achieve more efficient and accurate provider data collection: (1) build relationships with partner organizations that can share existing provider data or incorporate additional provider questions into existing data collection efforts, and (2) create a robust Provider Database that has ability to integrate multiple data sources. Potential partners include the health professional associations and licensing boards, Health Information Exchange, state Medicaid agency, Arizona Center for Rural Health, and Arizona Alliance of Community Health Centers. The ultimate goal of this project is to build a data collection process that is sustainable, provides current (within 24 months) provider data, and facilitates accurate statewide shortage designations and timely health workforce issue briefs.
Arizona Primary Care Needs Assessment • • •
Page 34 of 41
Conclusion
Arizona’s unique geography and population demographics pose as barriers to health care access. Arizona is projected to continue to have tremendous population growth. Arizona has taken proactive approaches to identify need in the state the data illustrates the ongoing need to improve access to care and address health disparities especially to underserved communities of the state.
The modernization of the Arizona PCAs through the use of a software-driven methodology assures consistency in the geographical units with benefits for both the Arizona Department of Health Services and stakeholders. The completion of this needs assessment did identify a few PCAs with high population-to-provider ratios that are not currently designated as Health Professional Shortage Areas. These areas will be a priority for designation this year. The Arizona PCO plans on disseminating and sharing of the needs assessment with stakeholders through webinars and presentations at upcoming conferences such as the Arizona Rural Health Conference, Arizona Alliance for Community Health Centers Annual Conference and the Arizona Scholars Conference in efforts to enhance use of data for planning to meet unmet need in Arizona.
Arizona Primary Care Needs Assessment • • •
Page 35 of 41
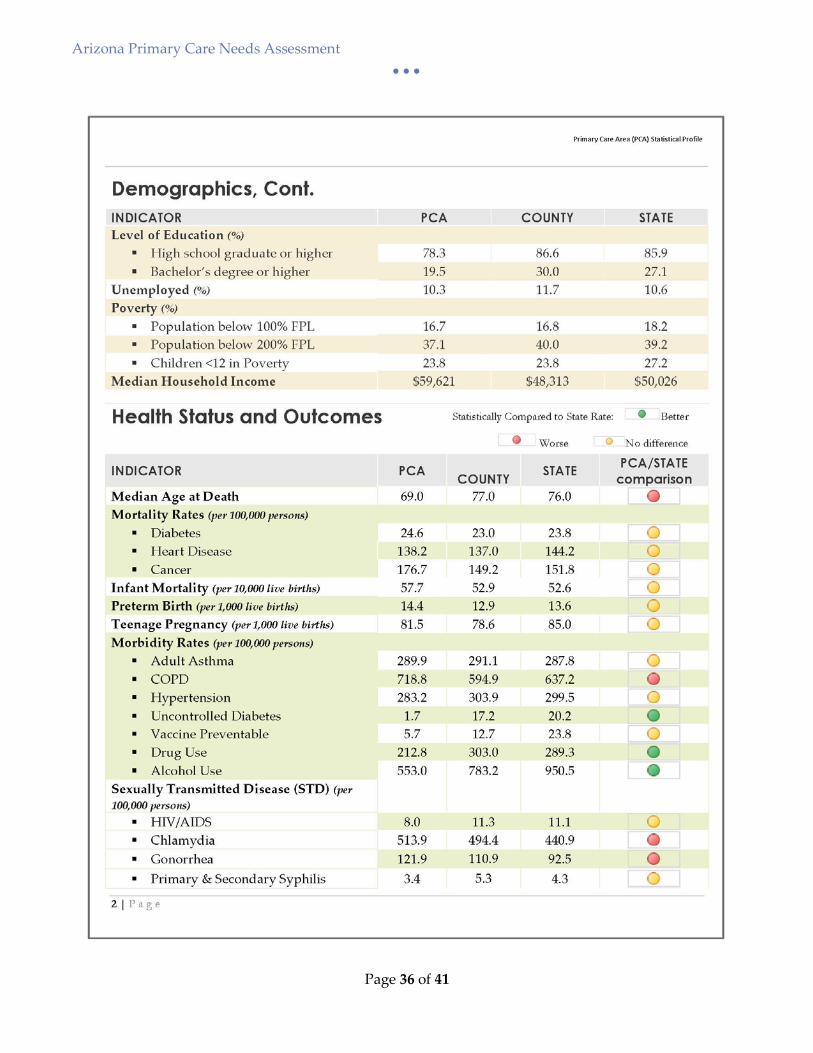
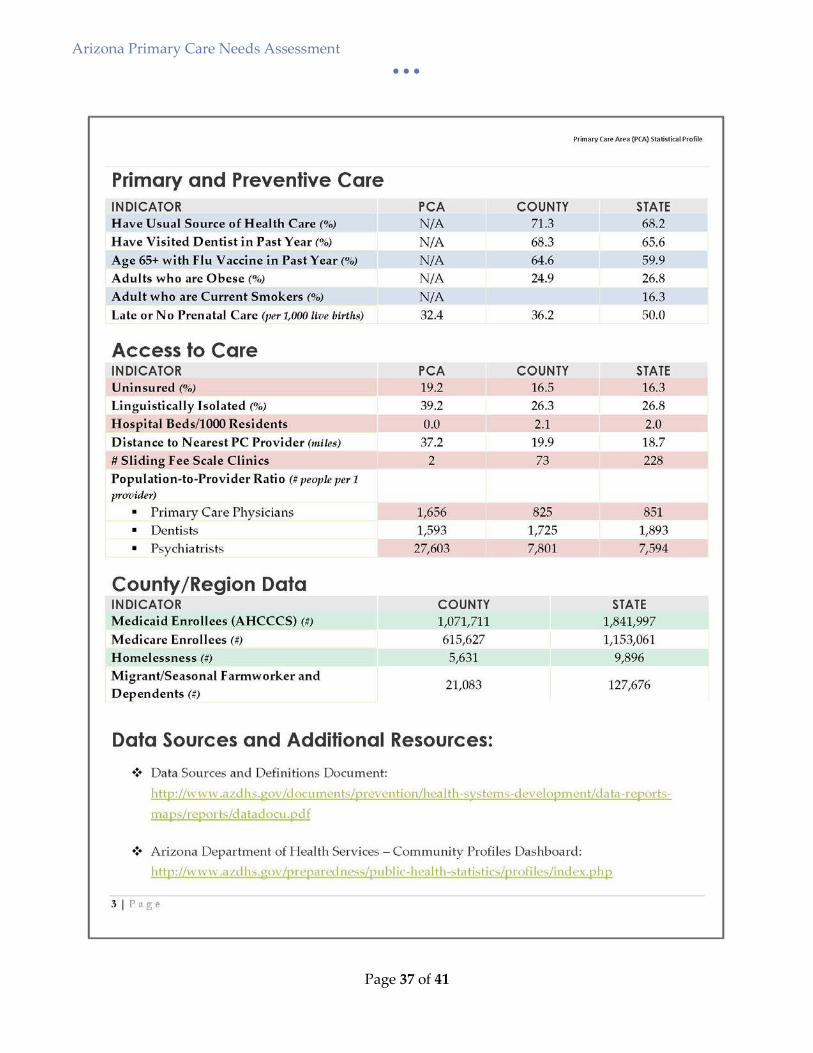
Appendix A: Primary Care Area Profile Sample
Arizona Primary Care Needs Assessment • • •
Page 36 of 41
Arizona Primary Care Needs Assessment • • •
Page 37 of 41
Arizona Primary Care Needs Assessment • • •
Page 38 of 41
Appendix B: Arizona Primary Care Areas List
Arizona Primary Care Needs Assessment • • •
Page 39 of 41
Arizona Primary Care Needs Assessment • • •
Page 40 of 41
Arizona Primary Care Needs Assessment • • •
Page 41 of 41
REFERENCES i HRSA in Your State, http://datawarehouse.hrsa.gov/topics/HrsaInYour/FactSheetState.aspx?geocd=04, retrieved April 2016 ii HRSA Data Warehouse, 2015 iii 2010-2014 American Community Survey iv Kaiser Family Foundation, 2015 v Kaiser Family Foundation, 2015