Embed Size (px)
Citation preview
Abortions in Arizona
2012 Abortion Report
8/1/2013
Health and Wellness for all Arizonans
Janice K. Brewer, Governor State of Arizona
Will Humble, Director
Arizona Department of Health Services
MISSION
To promote, protect, and improve the health and wellness of individuals and communities in Arizona.
Prepared by: The Bureau of Public Health Statistics Arizona Department of Health Services
150 N 18th Ave, Suite 550 Phoenix, AZ 85007
http://www.azdhs.gov/plan/crr/ar/index.htm
Acknowledgements: The Department acknowledges all the facilities who reported abortion data during the reporting period This publication can be made available in alternative format. Please contact the Bureau of Public Health Statistics at (602) 542-1242 (voice) or 1-800-367-8939 (TDD). Permission to quote from or reproduce materials from this publication is granted if the source is acknowledged.
Page | i
Table of Contents Page
Executive Summary .......................................................................................................... 1
1. Introduction ................................................................................................................. 2
1.1 Overview of the Arizona Abortion Reporting Requirements ............................... 2
1.2 Trends in Abortions in Arizona and the United States ......................................... 4
2. Methodology .............................................................................................................. 6
2.1 Data Sources ......................................................................................................... 6
2.2 Measures .............................................................................................................. 6
2.3 Analytic Procedures .............................................................................................. 8
3. Results ........................................................................................................................ 9
3.1 Characteristics of Women Receiving Abortions ................................................... 10
3.2 Abortions by Gestational Age ............................................................................... 27
3.3 Abortions by Patient County of Residence ........................................................... 29
3.4 Complications Resulting from an Abortion .......................................................... 35
3.5 Petitions Filed with the Arizona Administrative Office of the Courts ................. 37
4. Conclusion .................................................................................................................. 38
Appendix
A. Abortion Reporting Forms ................................................................................... 39
B. Glossary .............................................................................................................. 43
C. Endnotes ............................................................................................................... 45
Page | ii
List of Tables
Page
1. Number, rate, and ratio of reported abortions – selected states, United States, 2000 – 2009 ................................................................................................................ 2
2. Abortions in 2012 by month and resident status ......................................................... 9
3. Age-distribution of resident women receiving abortions in Arizona, 2012................ 11
4. Proportions, rates, and ratios of abortions by age group, Arizona residents,
2000 – 2012................................................................................................................. 12
5. Proportions, rates, and ratios of abortions by race and ethnicity, Arizona residents,
2002 – 2012................................................................................................................. 16
6. Pregnancy history of resident women obtaining abortions in Arizona, 2012 ............. 19
7. Method of abortion used by resident women in Arizona, 2012 .................................. 22
8. Maternal characteristics and corresponding medical conditions cited for obtaining an
abortion, Arizona residents, 2012 ............................................................................... 25
9. Maternal characteristics and fetal medical conditions cited for obtaining an abortion,
Arizona residents, 2012 .............................................................................................. 26
10. Distribution of gestational age at time of abortion, Arizona residents, 2012 ............. 27
11. Age distribution of resident women receiving abortions by gestational age at time of
abortion, 2012 ............................................................................................................. 28
12. Method of abortion and gestational age, Arizona residents, 2012 .............................. 29
13. Abortions, live births, rates, and ratios for resident females age 15 – 44 by patient
county of residence, 2012 ....................................................................................... 30
14. Number of abortions, rates, and ratios for resident females age 15 – 44 by patient
county of residence, 2002 – 2012 ............................................................................... 32
15. Abortions by patient county of residence and age group, Arizona, 2012 ................... 33
16. Abortions by patient county of residence and race and ethnicity, Arizona, 2012 ...... 34
17. Complications resulting from an abortion for resident women, Arizona, 2012 ......... 36
18. Petitions filed with the Arizona Administrative Office of the Courts ........................ 37
Page | iii
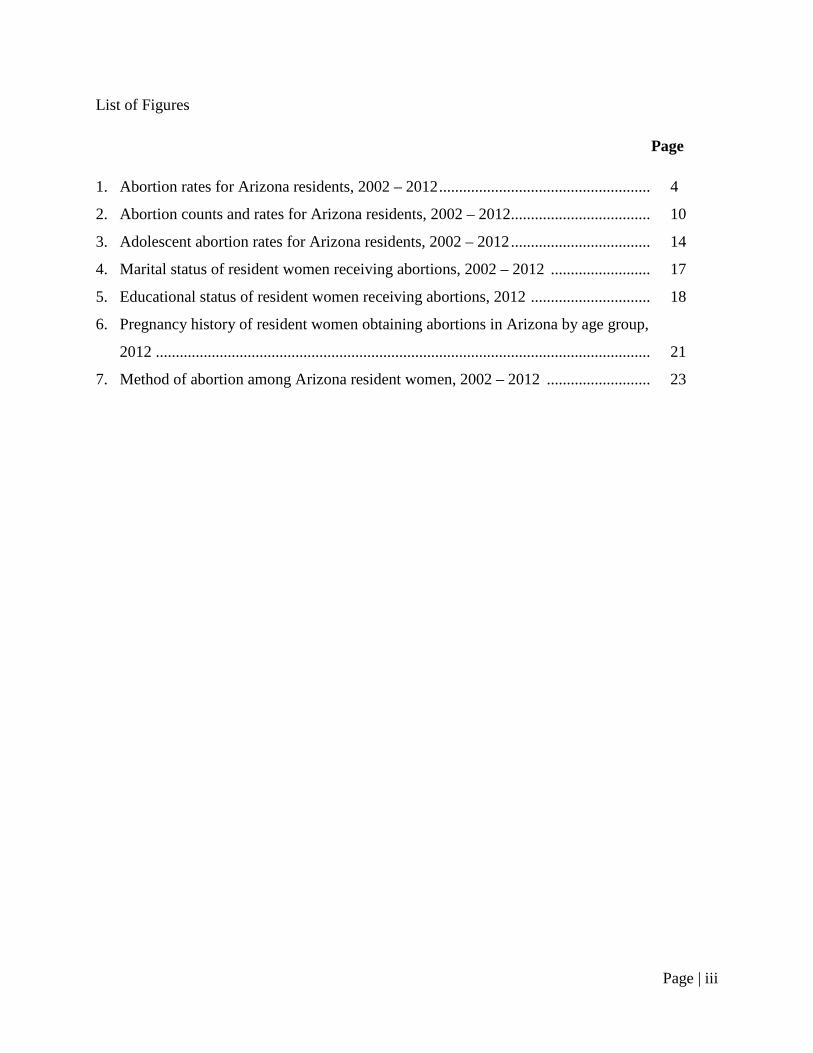
List of Figures
Page
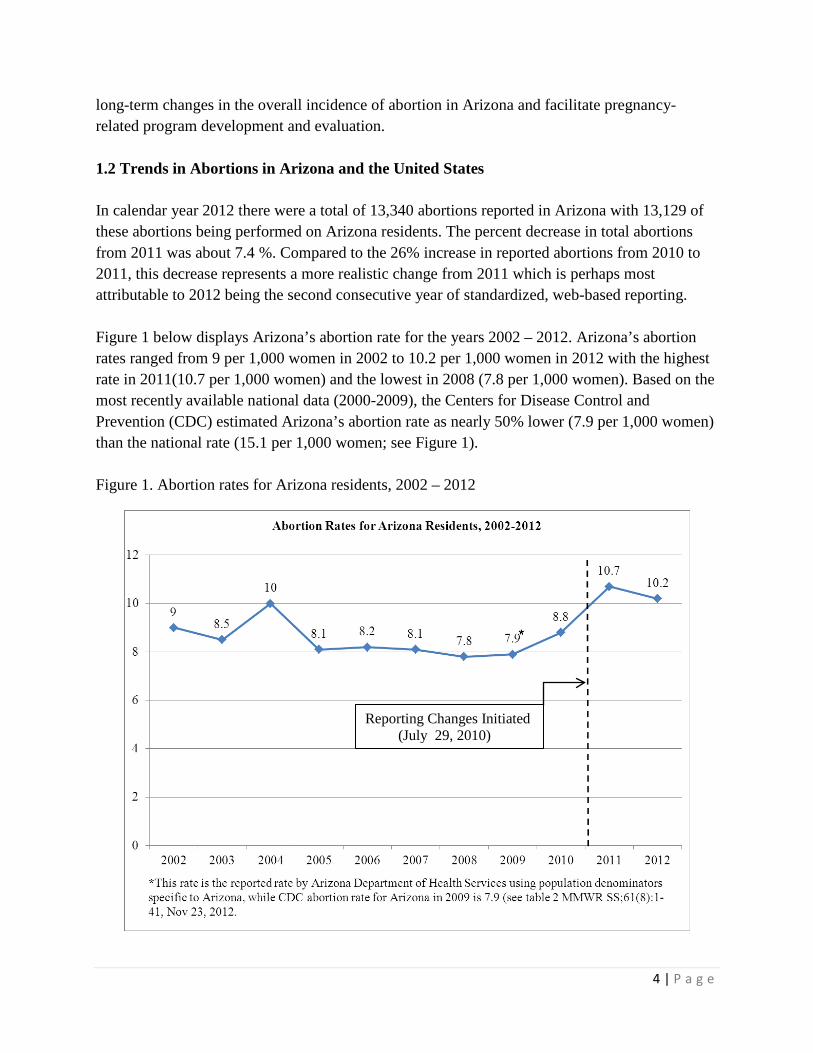
1. Abortion rates for Arizona residents, 2002 – 2012 ..................................................... 4
2. Abortion counts and rates for Arizona residents, 2002 – 2012 ................................... 10
3. Adolescent abortion rates for Arizona residents, 2002 – 2012 ................................... 14
4. Marital status of resident women receiving abortions, 2002 – 2012 ......................... 17
5. Educational status of resident women receiving abortions, 2012 .............................. 18
6. Pregnancy history of resident women obtaining abortions in Arizona by age group,
2012 ............................................................................................................................ 21
7. Method of abortion among Arizona resident women, 2002 – 2012 .......................... 23
1 | P a g e
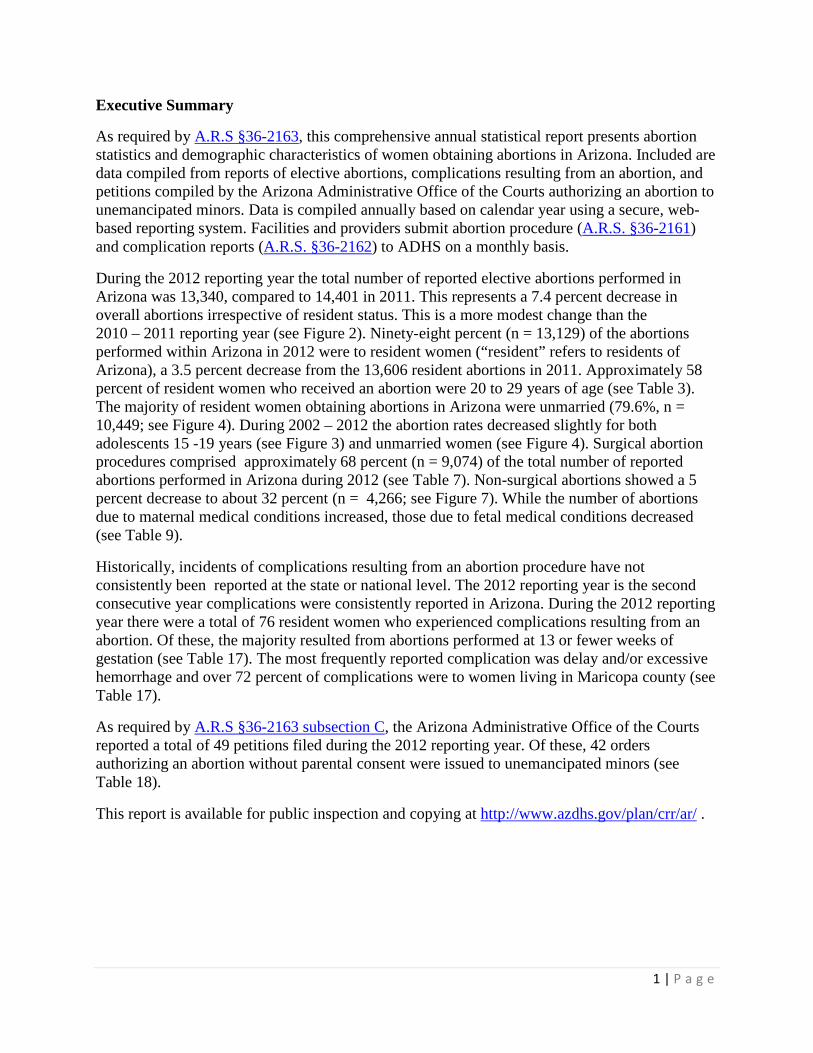
Executive Summary
As required by A.R.S §36-2163, this comprehensive annual statistical report presents abortion statistics and demographic characteristics of women obtaining abortions in Arizona. Included are data compiled from reports of elective abortions, complications resulting from an abortion, and petitions compiled by the Arizona Administrative Office of the Courts authorizing an abortion to unemancipated minors. Data is compiled annually based on calendar year using a secure, web-based reporting system. Facilities and providers submit abortion procedure (A.R.S. §36-2161) and complication reports (A.R.S. §36-2162) to ADHS on a monthly basis.
During the 2012 reporting year the total number of reported elective abortions performed in Arizona was 13,340, compared to 14,401 in 2011. This represents a 7.4 percent decrease in overall abortions irrespective of resident status. This is a more modest change than the 2010 – 2011 reporting year (see Figure 2). Ninety-eight percent (n = 13,129) of the abortions performed within Arizona in 2012 were to resident women (“resident” refers to residents of Arizona), a 3.5 percent decrease from the 13,606 resident abortions in 2011. Approximately 58 percent of resident women who received an abortion were 20 to 29 years of age (see Table 3). The majority of resident women obtaining abortions in Arizona were unmarried (79.6%, n = 10,449; see Figure 4). During 2002 – 2012 the abortion rates decreased slightly for both adolescents 15 -19 years (see Figure 3) and unmarried women (see Figure 4). Surgical abortion procedures comprised approximately 68 percent (n = 9,074) of the total number of reported abortions performed in Arizona during 2012 (see Table 7). Non-surgical abortions showed a 5 percent decrease to about 32 percent (n = 4,266; see Figure 7). While the number of abortions due to maternal medical conditions increased, those due to fetal medical conditions decreased (see Table 9).
Historically, incidents of complications resulting from an abortion procedure have not consistently been reported at the state or national level. The 2012 reporting year is the second consecutive year complications were consistently reported in Arizona. During the 2012 reporting year there were a total of 76 resident women who experienced complications resulting from an abortion. Of these, the majority resulted from abortions performed at 13 or fewer weeks of gestation (see Table 17). The most frequently reported complication was delay and/or excessive hemorrhage and over 72 percent of complications were to women living in Maricopa county (see Table 17).
As required by A.R.S §36-2163 subsection C, the Arizona Administrative Office of the Courts reported a total of 49 petitions filed during the 2012 reporting year. Of these, 42 orders authorizing an abortion without parental consent were issued to unemancipated minors (see Table 18).
This report is available for public inspection and copying at http://www.azdhs.gov/plan/crr/ar/ .
2 | P a g e
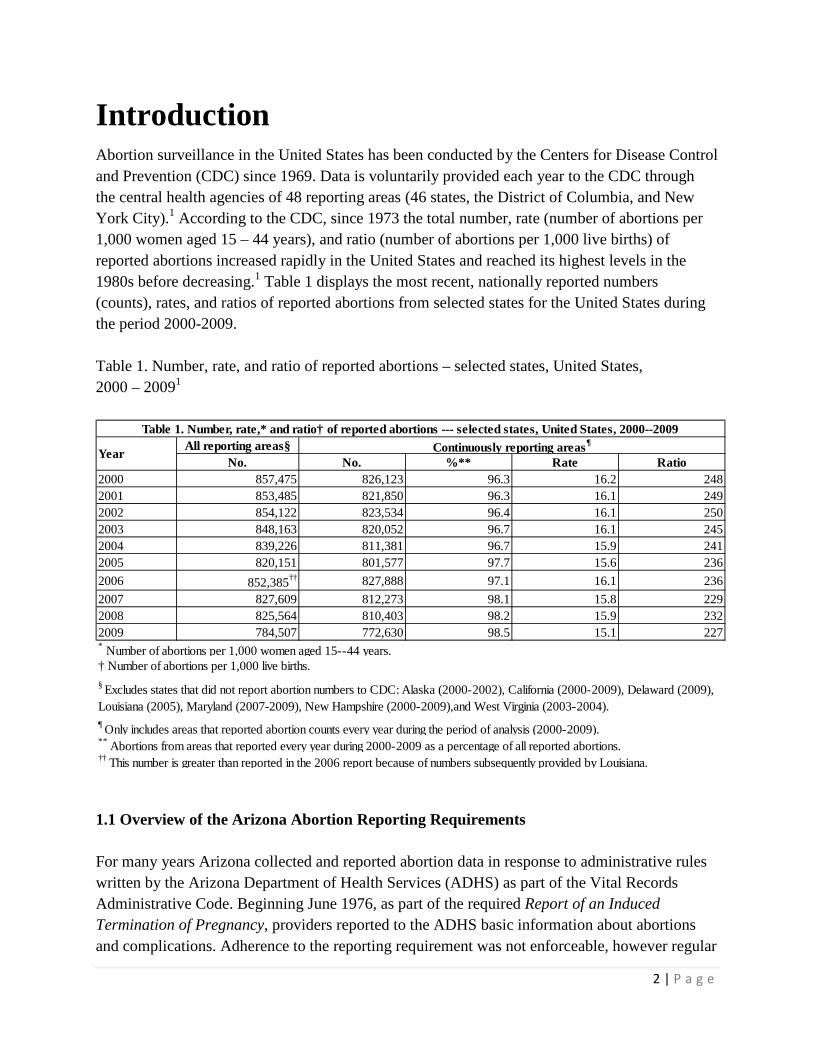
Introduction Abortion surveillance in the United States has been conducted by the Centers for Disease Control and Prevention (CDC) since 1969. Data is voluntarily provided each year to the CDC through the central health agencies of 48 reporting areas (46 states, the District of Columbia, and New York City).1 According to the CDC, since 1973 the total number, rate (number of abortions per 1,000 women aged 15 – 44 years), and ratio (number of abortions per 1,000 live births) of reported abortions increased rapidly in the United States and reached its highest levels in the 1980s before decreasing.1 Table 1 displays the most recent, nationally reported numbers (counts), rates, and ratios of reported abortions from selected states for the United States during the period 2000-2009. Table 1. Number, rate, and ratio of reported abortions – selected states, United States, 2000 – 20091
1.1 Overview of the Arizona Abortion Reporting Requirements For many years Arizona collected and reported abortion data in response to administrative rules written by the Arizona Department of Health Services (ADHS) as part of the Vital Records Administrative Code. Beginning June 1976, as part of the required Report of an Induced Termination of Pregnancy, providers reported to the ADHS basic information about abortions and complications. Adherence to the reporting requirement was not enforceable, however regular
All reporting areas§No. No. %** Rate Ratio
2000 857,475 826,123 96.3 16.2 2482001 853,485 821,850 96.3 16.1 2492002 854,122 823,534 96.4 16.1 2502003 848,163 820,052 96.7 16.1 2452004 839,226 811,381 96.7 15.9 2412005 820,151 801,577 97.7 15.6 2362006 852,385†† 827,888 97.1 16.1 2362007 827,609 812,273 98.1 15.8 2292008 825,564 810,403 98.2 15.9 2322009 784,507 772,630 98.5 15.1 227
¶ Only includes areas that reported abortion counts every year during the period of analysis (2000-2009).** Abortions from areas that reported every year during 2000-2009 as a percentage of all reported abortions.†† This number is greater than reported in the 2006 report because of numbers subsequently provided by Louisiana.
Table 1. Number, rate,* and ratio† of reported abortions --- selected states, United States, 2000--2009
Year Continuously reporting areas¶
* Number of abortions per 1,000 women aged 15--44 years.† Number of abortions per 1,000 live births.§ Excludes states that did not report abortion numbers to CDC: Alaska (2000-2002), California (2000-2009), Delaward (2009), Louisiana (2005), Maryland (2007-2009), New Hampshire (2000-2009),and West Virginia (2003-2004).
3 | P a g e
reminders along with a standard reporting format were sent to clinics that provide abortion services. ADHS received these forms and used the data to prepare tables for inclusion in the annual Health Status and Vital Statistics (HSVS) report.* Additionally, the data collected improved the estimation of total pregnancies and counts of births. The enactment of SB1304 in 2010 statutorily required the reporting of abortions and treatment of complications associated with abortions.2 The Arizona Abortion Report, 2010 contained a combination of data collected prior to and after the passage of the law. Beginning July 29, 2010, abortion data is reported using a secure, web-based reporting system. The new reporting system was designed to meet the requirements of the new law. Training, facilitated by ADHS, was offered to all known providers within the state. An Abortion Reporting website was established for additional assistance and related resources. Additionally, the law requires the Arizona Administrative Office of the Courts (AOC) to report the number of petitions filed with Arizona courts for authorization to perform an abortion on an unemancipated minor without parental consent in accordance with Arizona Revised Statutes §36-2152, subsections B and D. The collection of AOC data also began July 29, 2010. The data submitted by providers and the Administrative Office of the Courts does not include personally identifiable information (i.e., name, birthdate, social security number, etc.) and only authorized entities can enter and submit data through the secure, password protected portal. The Abortions in Arizona, 2011 report set the standard format for the report and differed from the 2010 report in several ways: 1) the complete 2011 calendar year of data was utilized and uniformly reported; 2) where feasible, the report was formatted and categorized to meet both legislative requirements and the CDC reporting standards for comparability; 3) it included specific terms associated with abortion and a description of the strengths and limitations of the report; 4) it included a revised reporting methodology and detailed how race and ethnicity was enumerated, and finally 5) the report discussed public health implications related to abortion. The Abortions in Arizona, 2012 report represents the second consecutive year of data collection using the web-based reporting system, a standardized format, and presents updated statistics and information. Previous reports presented Arizona data to coincide with CDC’s national report. However, because of the 3-year gap between the national and state report, several data tables were adjusted to reflect year ranges more relevant to Arizona (i.e., 1 year, 5 years, and 10 years). Tables presenting descriptive data associated with medical-related abortions were added to highlight the incidence and impact on other areas of public health. Several systemic upgrades were implemented to ensure more accurate data collection. The upgrades took effect at the close of the 2012 data year. The abortion surveillance system facilitates the ADHS’ ability to monitor
* ADHS. Health Status and Vital Statistics (HSVS) Report. Previous reports present year data tables that coincide with the CDC’s national report correspondent with section 1D of each annual report for the table of characteristics.
4 | P a g e
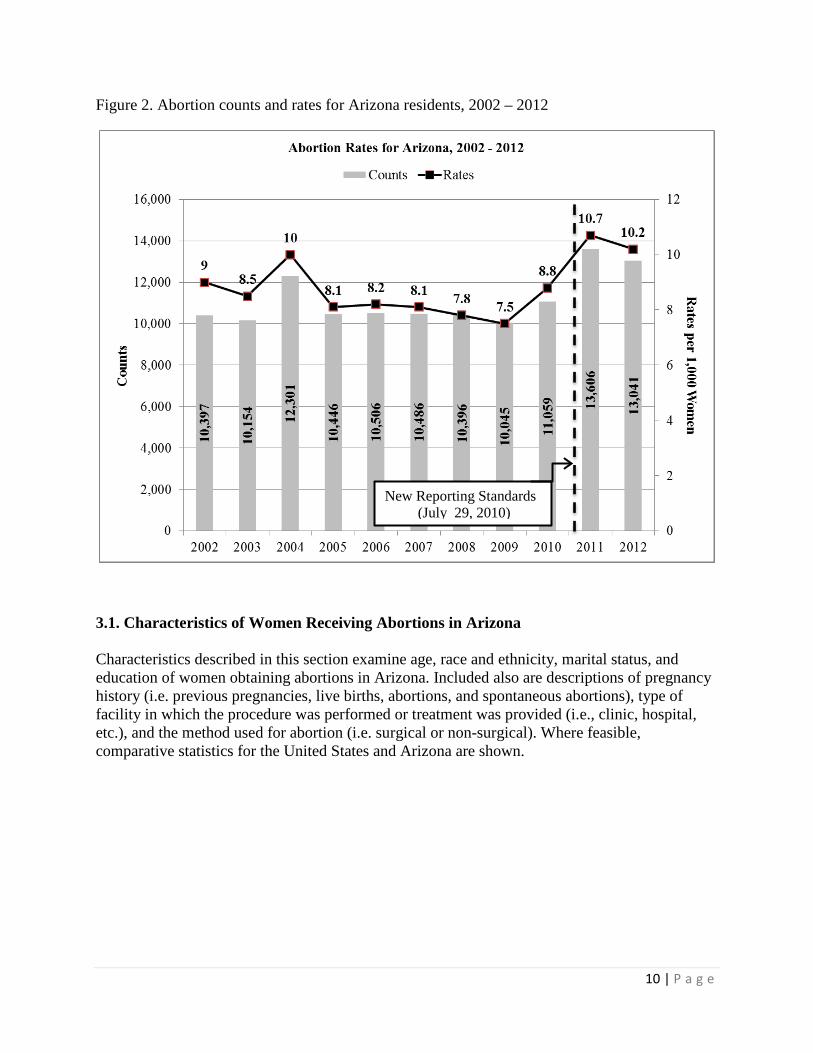
long-term changes in the overall incidence of abortion in Arizona and facilitate pregnancy-related program development and evaluation. 1.2 Trends in Abortions in Arizona and the United States In calendar year 2012 there were a total of 13,340 abortions reported in Arizona with 13,129 of these abortions being performed on Arizona residents. The percent decrease in total abortions from 2011 was about 7.4 %. Compared to the 26% increase in reported abortions from 2010 to 2011, this decrease represents a more realistic change from 2011 which is perhaps most attributable to 2012 being the second consecutive year of standardized, web-based reporting. Figure 1 below displays Arizona’s abortion rate for the years 2002 – 2012. Arizona’s abortion rates ranged from 9 per 1,000 women in 2002 to 10.2 per 1,000 women in 2012 with the highest rate in 2011(10.7 per 1,000 women) and the lowest in 2008 (7.8 per 1,000 women). Based on the most recently available national data (2000-2009), the Centers for Disease Control and Prevention (CDC) estimated Arizona’s abortion rate as nearly 50% lower (7.9 per 1,000 women) than the national rate (15.1 per 1,000 women; see Figure 1). Figure 1. Abortion rates for Arizona residents, 2002 – 2012
Reporting Changes Initiated (July 29, 2010)
5 | P a g e
Independent estimates available from the Guttmacher Institute show abortion rates for Arizona that are consistently higher than the rates generated by the ADHS. Differences in the ADHS and Guttmacher Institute estimates are likely due to differences in methodology. For example, the Guttmacher Institute uses numerous active follow-up techniques to increase the completeness of the data obtained through its periodic national survey of abortion providers.1 Keeping this perspective in mind, the following report estimates the incidence of abortion in Arizona for the 2012 calendar year.
6 | P a g e
Methodology Collection of accurate abortion data reveals the level of unwanted and/or unintended pregnancies related to other pregnancy outcomes and preconception health/planning in a population. Abortion also relates to maternal morbidity and mortality1(p.8). The data and information presented in this report result from the statutory requirements established by Arizona Revised Statutes §36-2163. The term abortion replaces induced termination of pregnancy (ITOP) and termination where appropriate throughout this report. The term resident refers to residents of Arizona. 2.1. Data Sources The primary data source for this report is the web-based reporting system for Arizona providers. The data does not include personally identifiable information (PII) and only authorized entities may enter and submit data through a secure password protected portal. A second data source, the Arizona Administrative Office of the Courts, provides aggregate data for the number of petitions filed with Arizona courts for authorization to perform an abortion on an unemancipated minor as prescribed in Arizona Revised Statutes §36-2152. It is plausible that abortions performed on unemancipated minors were included in the data collected using the web-based reporting system. A third data source are abortion reports received from other states for Arizona residents who obtained an abortion in a state other than Arizona. The reports are provided as a courtesy from other states. Reports received prior to the data close out date are included in the current reporting year. 2.2. Measures Measures reported here are mostly consistent with CDC categorizations and definitions. Aggregate abortion counts are reported for the following variables:
• Age in years of the woman (<15, 15–17, 18–19, 20–24, 25–29, 30–34, 35–39, 40-44, ≥ 45);
• Gestational age in weeks at the time of abortion (≤ 6, 7–20 by individual week, ≥21); • Race (White, Black, American Indian/Alaska Native, Asian, Native Hawaiian/Pacific
Islander, Multiple Race); • Ethnicity (Hispanic or non-Hispanic); • Method type (surgical, non-surgical/medication-induced); • Marital status (married and unmarried); • Number of previous live births (0, 1, 2, 3, or ≥4); • Number of previous abortions (0, 1, 2, 3, or ≥4); • Maternal residence (state, AZ county of residence, border and non-border region).
7 | P a g e
Some important measures for abortions are: a) the total count (number) of abortions in a given population, b) the percentage (proportion) of abortions obtained within a given sub-population, c) the abortion rate (number of abortions per 1,000 women aged 15–44 years or other specific group within a given population), and d) the abortion ratio (count of abortions per 1,000 live births within a given population).1
Total counts and percentages provide an overview of abortions while abortion rates are a more useful measures as they adjust for differences in sub-populations and sub-population size. Abortion ratios reflect the relative number of pregnancies in a population that end in abortion compared to live births. Abortion ratios are affected by the proportion of unintended pregnancies in a population and unintended pregnancies ending in abortion.1
U.S. Census Bureau and Arizona Vital Statistics estimates of the Arizona resident female population were used as the denominator for calculating abortion rates. Overall abortion rates were calculated from the population of women aged 15 – 44 years. To calculate abortion ratios, live birth data were obtained from Arizona natality files.
It is important to detail how race and ethnicity in this report were handled. The variables for race and ethnicity are based on specifications established by the Office of Management and Budget (OMB) and the Arizona State Demographer in cooperation with specifications developed by ADHS Vital Statistics. Consistent with OMB methodology3, the web-based reporting system allows for multiple race categorizations consistent with Census enumerations. For instance, women obtaining abortions were asked about their ethnicity (namely, as Hispanic or Latino and/or Non-Hispanic or non-Latino) and separately about their race according to five standard race categories (i.e. White, Black, American Indian/Alaska Native, Asian, and Native Hawaiian/Pacific Islander). Additionally, if one of the OMB categories does not apply, selecting “Other” allows providers to input specific race designations.
A multiple race category was added to enumerate women who identify with more than one race. The selection of more than one race resulted in numerous combinations. Collecting multiple race posed a challenge resulting in an accumulation of approximately 23 percent of the abortion records containing multiple race designations. As denominators for multiple races are not readily available, utilizing multiple race and ethnicity categories complicates estimation of abortion rates for groups who report multiple races4. To meet the requirements of OMB reporting standards for compiling statistics on these sub-groups, records designating ethnicity as Hispanic or Latino, irrespective of race, were reported as Hispanic. When single race and ethnicity were reported, those categories were included and when multiple races were reported, multiple races were coded to a single “multiple race” category.
An examination of characteristics of women obtaining abortions by border region is included in this report. Arizona encompasses several federally recognized sovereign American Indian nations and shares its southern border with Mexico. For the purpose of this report, women
8 | P a g e
reporting their county of residence as Cochise, Pima, Santa Cruz, and Yuma were categorized as ‘border region’ comprising the United States and Mexico border region (consistent with the U.S. Mexico Border Health Commission5 definition). The remaining counties are considered ‘non-border’ regions. 2.3. Analytic Procedures Where applicable, both univariate and bivariate statistics are presented. Counts, percentages, and rates were calculated using SAS v.9.3 software (2008). While abortion rates in general are reported for women of child-bearing age (15 – 44 years), age-specific rates were estimated using U.S. Census and Arizona Vital Statistics denominators for age-groups 10 – 14 years, 15 – 17 years, 18 – 19 years, 20 – 24 years, 25 – 29 years, 30 – 34 years, 35 – 39 years, and 40 – 44 years.
9 | P a g e
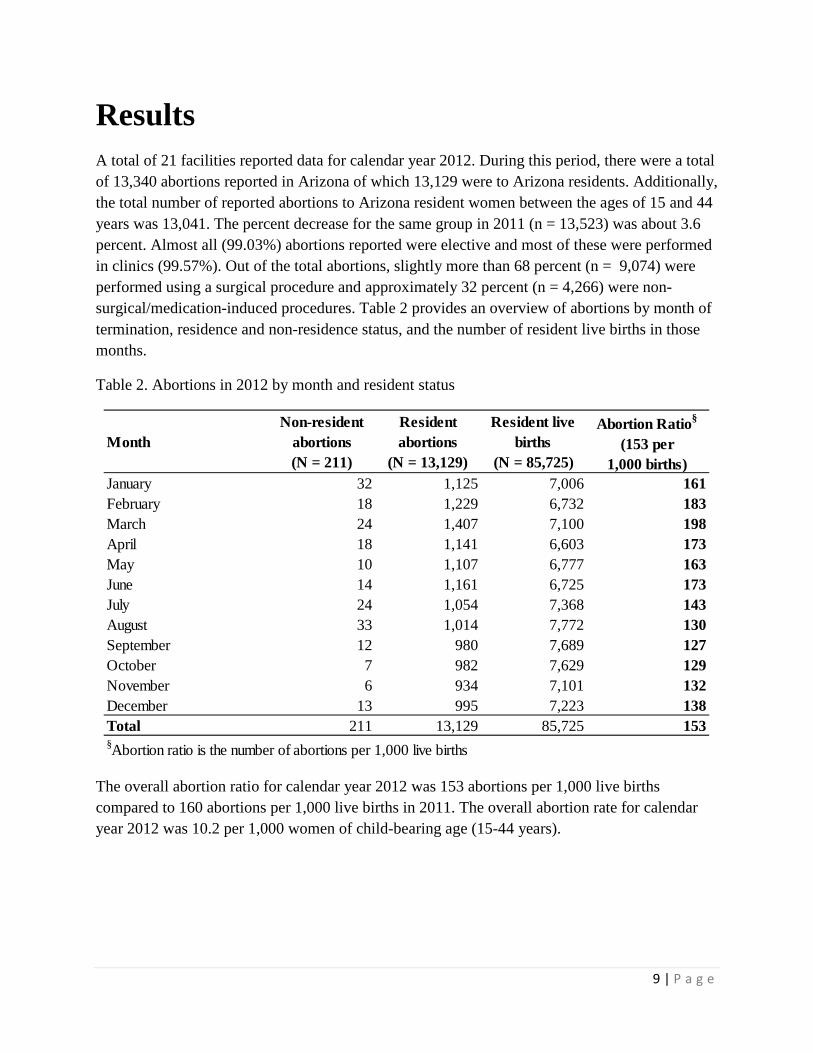
Results A total of 21 facilities reported data for calendar year 2012. During this period, there were a total of 13,340 abortions reported in Arizona of which 13,129 were to Arizona residents. Additionally, the total number of reported abortions to Arizona resident women between the ages of 15 and 44 years was 13,041. The percent decrease for the same group in 2011 (n = 13,523) was about 3.6 percent. Almost all (99.03%) abortions reported were elective and most of these were performed in clinics (99.57%). Out of the total abortions, slightly more than 68 percent (n = 9,074) were performed using a surgical procedure and approximately 32 percent (n = 4,266) were non-surgical/medication-induced procedures. Table 2 provides an overview of abortions by month of termination, residence and non-residence status, and the number of resident live births in those months.
Table 2. Abortions in 2012 by month and resident status
The overall abortion ratio for calendar year 2012 was 153 abortions per 1,000 live births compared to 160 abortions per 1,000 live births in 2011. The overall abortion rate for calendar year 2012 was 10.2 per 1,000 women of child-bearing age (15-44 years).
MonthNon-resident
abortions (N = 211)
Resident abortions
(N = 13,129)
Resident live births
(N = 85,725)
Abortion Ratio§
(153 per 1,000 births)
January 32 1,125 7,006 161February 18 1,229 6,732 183March 24 1,407 7,100 198April 18 1,141 6,603 173May 10 1,107 6,777 163June 14 1,161 6,725 173July 24 1,054 7,368 143August 33 1,014 7,772 130September 12 980 7,689 127October 7 982 7,629 129November 6 934 7,101 132December 13 995 7,223 138Total 211 13,129 85,725 153§Abortion ratio is the number of abortions per 1,000 live births
10 | P a g e
Figure 2. Abortion counts and rates for Arizona residents, 2002 – 2012
3.1. Characteristics of Women Receiving Abortions in Arizona Characteristics described in this section examine age, race and ethnicity, marital status, and education of women obtaining abortions in Arizona. Included also are descriptions of pregnancy history (i.e. previous pregnancies, live births, abortions, and spontaneous abortions), type of facility in which the procedure was performed or treatment was provided (i.e., clinic, hospital, etc.), and the method used for abortion (i.e. surgical or non-surgical). Where feasible, comparative statistics for the United States and Arizona are shown.
New Reporting Standards (July 29, 2010)
11 | P a g e
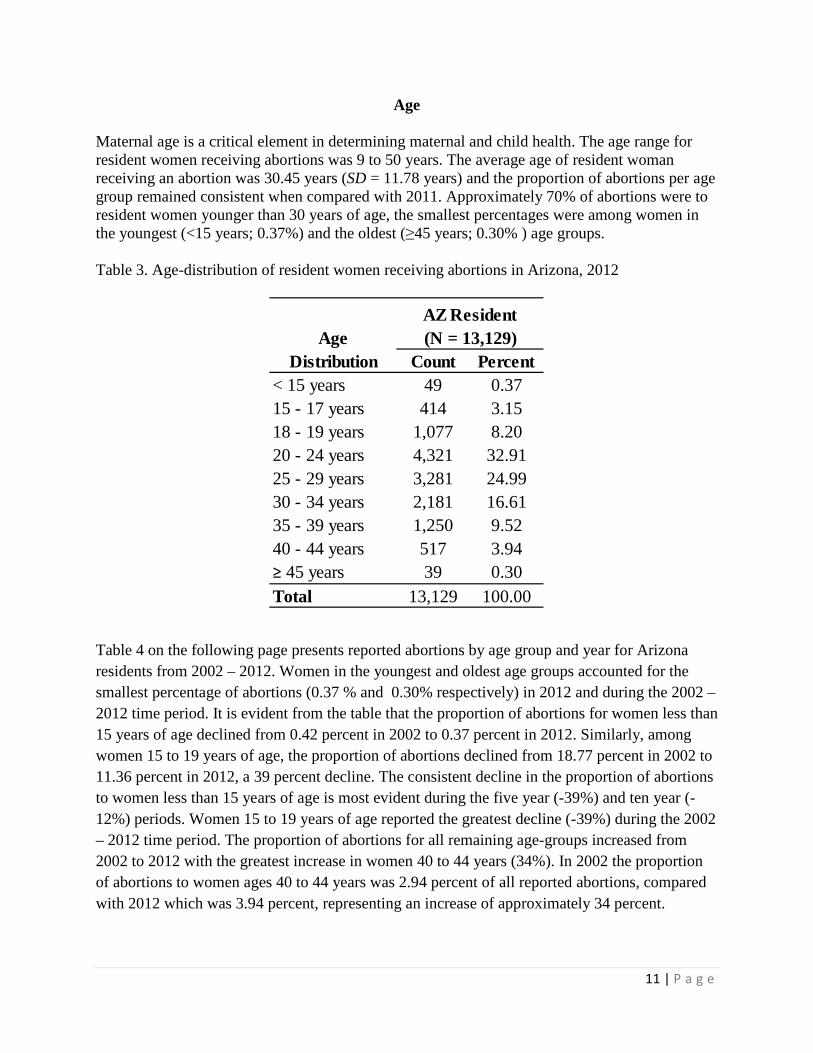
Age Maternal age is a critical element in determining maternal and child health. The age range for resident women receiving abortions was 9 to 50 years. The average age of resident woman receiving an abortion was 30.45 years (SD = 11.78 years) and the proportion of abortions per age group remained consistent when compared with 2011. Approximately 70% of abortions were to resident women younger than 30 years of age, the smallest percentages were among women in the youngest (<15 years; 0.37%) and the oldest (≥45 years; 0.30% ) age groups. Table 3. Age-distribution of resident women receiving abortions in Arizona, 2012
Table 4 on the following page presents reported abortions by age group and year for Arizona residents from 2002 – 2012. Women in the youngest and oldest age groups accounted for the smallest percentage of abortions (0.37 % and 0.30% respectively) in 2012 and during the 2002 – 2012 time period. It is evident from the table that the proportion of abortions for women less than 15 years of age declined from 0.42 percent in 2002 to 0.37 percent in 2012. Similarly, among women 15 to 19 years of age, the proportion of abortions declined from 18.77 percent in 2002 to 11.36 percent in 2012, a 39 percent decline. The consistent decline in the proportion of abortions to women less than 15 years of age is most evident during the five year (-39%) and ten year (-12%) periods. Women 15 to 19 years of age reported the greatest decline (-39%) during the 2002 – 2012 time period. The proportion of abortions for all remaining age-groups increased from 2002 to 2012 with the greatest increase in women 40 to 44 years (34%). In 2002 the proportion of abortions to women ages 40 to 44 years was 2.94 percent of all reported abortions, compared with 2012 which was 3.94 percent, representing an increase of approximately 34 percent.
Count Percent< 15 years 49 0.3715 - 17 years 414 3.1518 - 19 years 1,077 8.2020 - 24 years 4,321 32.9125 - 29 years 3,281 24.9930 - 34 years 2,181 16.6135 - 39 years 1,250 9.5240 - 44 years 517 3.94≥ 45 years 39 0.30Total 13,129 100.00
Age Distribution
AZ Resident (N = 13,129)
12 | P a g e
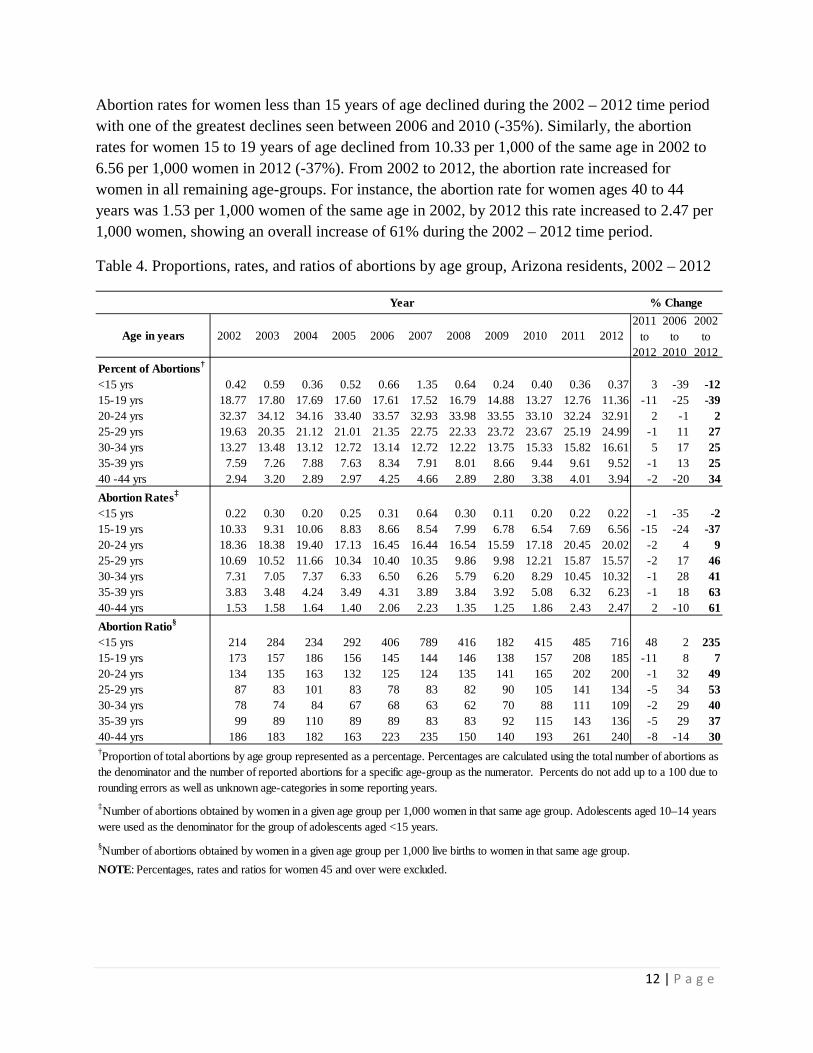
Abortion rates for women less than 15 years of age declined during the 2002 – 2012 time period with one of the greatest declines seen between 2006 and 2010 (-35%). Similarly, the abortion rates for women 15 to 19 years of age declined from 10.33 per 1,000 of the same age in 2002 to 6.56 per 1,000 women in 2012 (-37%). From 2002 to 2012, the abortion rate increased for women in all remaining age-groups. For instance, the abortion rate for women ages 40 to 44 years was 1.53 per 1,000 women of the same age in 2002, by 2012 this rate increased to 2.47 per 1,000 women, showing an overall increase of 61% during the 2002 – 2012 time period.
Table 4. Proportions, rates, and ratios of abortions by age group, Arizona residents, 2002 – 2012
Age in years 2002 2003 2004 2005 2006 2007 2008 2009 2010 2011 20122011
to 2012
2006 to
2010
2002 to
2012Percent of Abortions†
<15 yrs 0.42 0.59 0.36 0.52 0.66 1.35 0.64 0.24 0.40 0.36 0.37 3 -39 -1215-19 yrs 18.77 17.80 17.69 17.60 17.61 17.52 16.79 14.88 13.27 12.76 11.36 -11 -25 -3920-24 yrs 32.37 34.12 34.16 33.40 33.57 32.93 33.98 33.55 33.10 32.24 32.91 2 -1 225-29 yrs 19.63 20.35 21.12 21.01 21.35 22.75 22.33 23.72 23.67 25.19 24.99 -1 11 2730-34 yrs 13.27 13.48 13.12 12.72 13.14 12.72 12.22 13.75 15.33 15.82 16.61 5 17 2535-39 yrs 7.59 7.26 7.88 7.63 8.34 7.91 8.01 8.66 9.44 9.61 9.52 -1 13 2540 -44 yrs 2.94 3.20 2.89 2.97 4.25 4.66 2.89 2.80 3.38 4.01 3.94 -2 -20 34Abortion Rates‡
<15 yrs 0.22 0.30 0.20 0.25 0.31 0.64 0.30 0.11 0.20 0.22 0.22 -1 -35 -215-19 yrs 10.33 9.31 10.06 8.83 8.66 8.54 7.99 6.78 6.54 7.69 6.56 -15 -24 -3720-24 yrs 18.36 18.38 19.40 17.13 16.45 16.44 16.54 15.59 17.18 20.45 20.02 -2 4 925-29 yrs 10.69 10.52 11.66 10.34 10.40 10.35 9.86 9.98 12.21 15.87 15.57 -2 17 4630-34 yrs 7.31 7.05 7.37 6.33 6.50 6.26 5.79 6.20 8.29 10.45 10.32 -1 28 4135-39 yrs 3.83 3.48 4.24 3.49 4.31 3.89 3.84 3.92 5.08 6.32 6.23 -1 18 6340-44 yrs 1.53 1.58 1.64 1.40 2.06 2.23 1.35 1.25 1.86 2.43 2.47 2 -10 61Abortion Ratio§
<15 yrs 214 284 234 292 406 789 416 182 415 485 716 48 2 23515-19 yrs 173 157 186 156 145 144 146 138 157 208 185 -11 8 720-24 yrs 134 135 163 132 125 124 135 141 165 202 200 -1 32 4925-29 yrs 87 83 101 83 78 83 82 90 105 141 134 -5 34 5330-34 yrs 78 74 84 67 68 63 62 70 88 111 109 -2 29 4035-39 yrs 99 89 110 89 89 83 83 92 115 143 136 -5 29 3740-44 yrs 186 183 182 163 223 235 150 140 193 261 240 -8 -14 30
Year % Change
‡Number of abortions obtained by women in a given age group per 1,000 women in that same age group. Adolescents aged 10–14 years were used as the denominator for the group of adolescents aged <15 years.
†Proportion of total abortions by age group represented as a percentage. Percentages are calculated using the total number of abortions as the denominator and the number of reported abortions for a specific age-group as the numerator. Percents do not add up to a 100 due to rounding errors as well as unknown age-categories in some reporting years.
§Number of abortions obtained by women in a given age group per 1,000 live births to women in that same age group.NOTE: Percentages, rates and ratios for women 45 and over were excluded.
13 | P a g e
As noted earlier, the abortion ratio compares the count of elective abortions to the count of live births and is expressed as abortions per 1,000 live births. It is evident from Table 4 that the abortion ratio for women less than 15 years of age increased from 214 per 1,000 live births in 2002 to 716 per 1,000 live births in 2012 – an increase of 235 percent. Similarly, the abortion ratio for women 15 to 19 years of age in 2002 was 173 per 1,000 live births, increasing to 185 per 1,000 live births in 2012 (7%). Abortion ratios for women 40 to 44 years of age also increased between 2002 (186 per 1,000 live births) and 2012 (240 per 1,000 live births).
Focusing on changes from 2011 to 2012, the abortion ratio decreased for all age groups excluding females less than 15 years old. The abortion ratio for females less than 15 years old showed a 48 percent increase from 2011 to 2012. Considering the abortion rate for females in this age group remained relatively stable from 2011 to 2012, and the number of abortions to females in this age group was the same in both 2011 and 2012 (n = 49), the increase in the abortion ratio reflects the fact that the number of births to females less than 15 years of age decreased from 2011 (n = 101) to 2012 (n = 67).
14 | P a g e
Adolescents
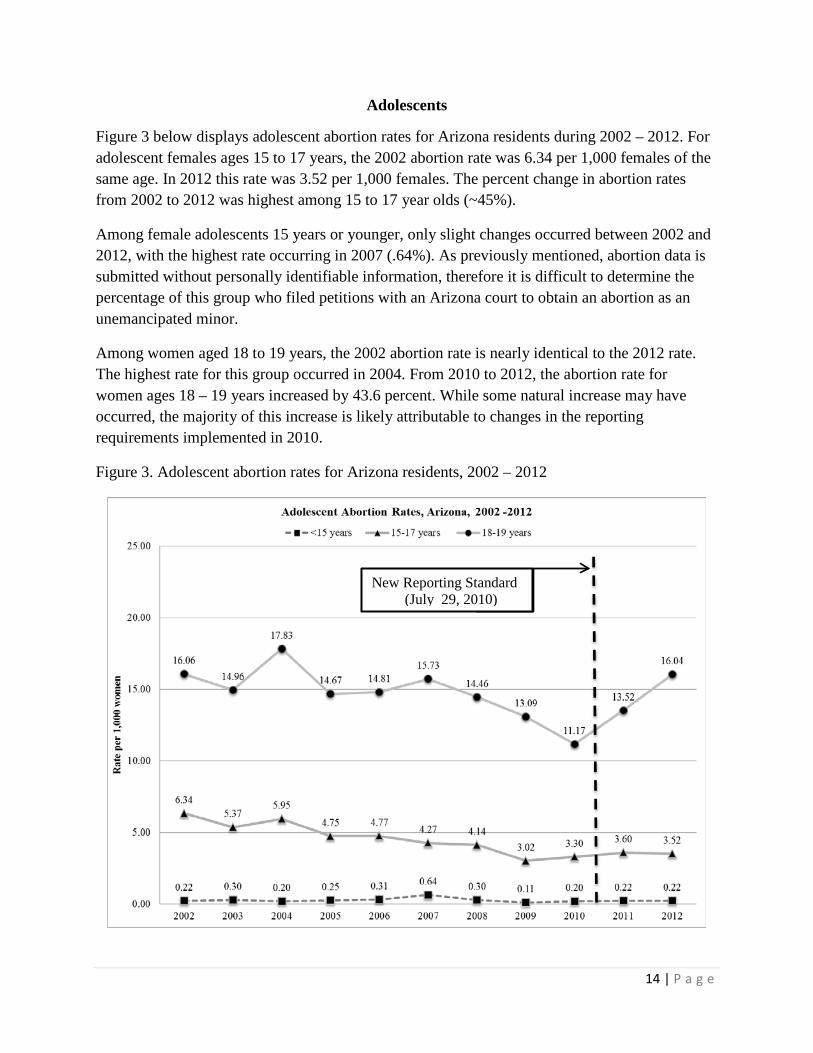
Figure 3 below displays adolescent abortion rates for Arizona residents during 2002 – 2012. For adolescent females ages 15 to 17 years, the 2002 abortion rate was 6.34 per 1,000 females of the same age. In 2012 this rate was 3.52 per 1,000 females. The percent change in abortion rates from 2002 to 2012 was highest among 15 to 17 year olds (~45%).
Among female adolescents 15 years or younger, only slight changes occurred between 2002 and 2012, with the highest rate occurring in 2007 (.64%). As previously mentioned, abortion data is submitted without personally identifiable information, therefore it is difficult to determine the percentage of this group who filed petitions with an Arizona court to obtain an abortion as an unemancipated minor.
Among women aged 18 to 19 years, the 2002 abortion rate is nearly identical to the 2012 rate. The highest rate for this group occurred in 2004. From 2010 to 2012, the abortion rate for women ages 18 – 19 years increased by 43.6 percent. While some natural increase may have occurred, the majority of this increase is likely attributable to changes in the reporting requirements implemented in 2010.
Figure 3. Adolescent abortion rates for Arizona residents, 2002 – 2012
New Reporting Standard (July 29, 2010)
15 | P a g e
Race and Ethnicity
Multiple race categories were reported in nearly 23 percent (n = 2,965) of reported abortions, and in approximately 35 percent (n = 4,586) of cases, there was no indication of any race(s). Of the total 13,041 abortions to resident women aged 15 to 44 years in 2012, approximately 26 percent (n = 3,373) of the abortions were for resident Hispanic women, followed by approximately 14.5 percent (n = 1,891) for non-Hispanic White women. African American resident women accounted for less than one percent (n = 113) of reported abortions, followed by Asian or Pacific Island resident women (n = 75), and American Indian resident women (n = 38).
Table 5 on the following page provides an overview of the trends in abortions by race and ethnicity from 2002 to 2012. The 2012 abortion rates for women who were not Hispanic and/or Latino should be interpreted with caution due to problems in race categorization noted above. In general, abortions to Hispanic and/or Latino women (as a proportion of abortions among all race groups) remained similar throughout this time period. Some of the figures specific to race and ethnicity changed significantly beginning in 2010, potentially reflecting changes in the way these variables were reported in the electronic reporting system.
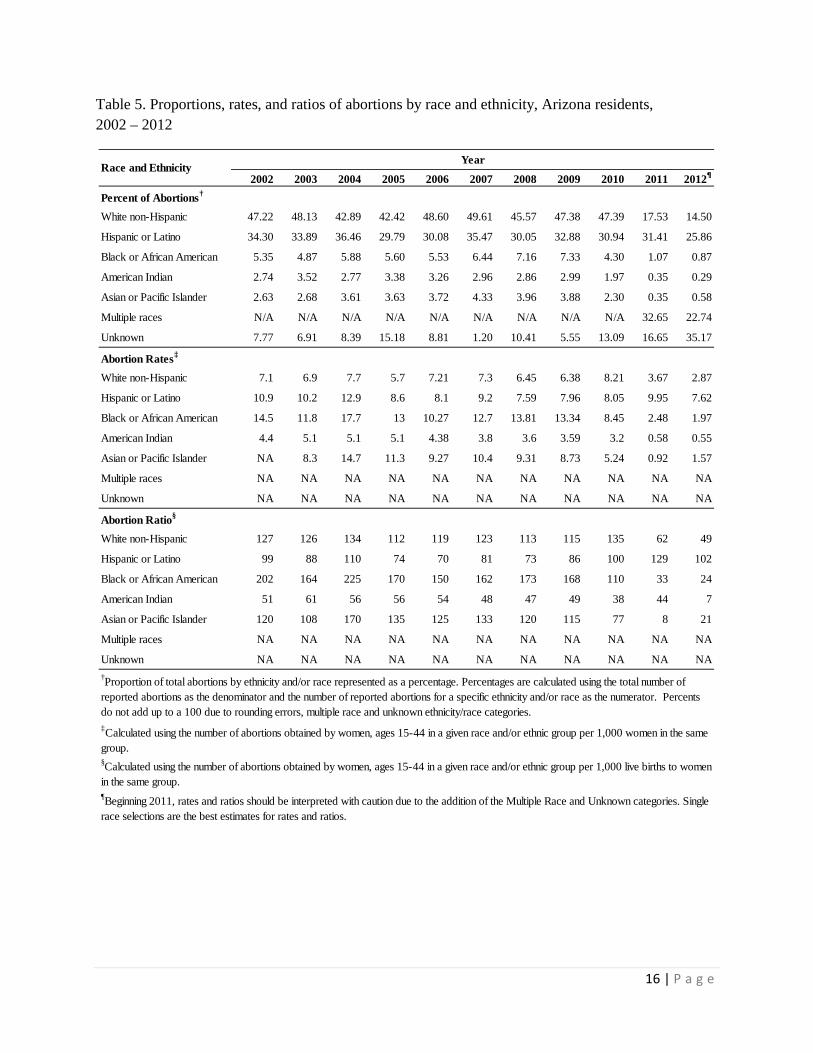
16 | P a g e
Table 5. Proportions, rates, and ratios of abortions by race and ethnicity, Arizona residents, 2002 – 2012
2002 2003 2004 2005 2006 2007 2008 2009 2010 2011 2012¶
Percent of Abortions†
White non-Hispanic 47.22 48.13 42.89 42.42 48.60 49.61 45.57 47.38 47.39 17.53 14.50
Hispanic or Latino 34.30 33.89 36.46 29.79 30.08 35.47 30.05 32.88 30.94 31.41 25.86
Black or African American 5.35 4.87 5.88 5.60 5.53 6.44 7.16 7.33 4.30 1.07 0.87
American Indian 2.74 3.52 2.77 3.38 3.26 2.96 2.86 2.99 1.97 0.35 0.29
Asian or Pacific Islander 2.63 2.68 3.61 3.63 3.72 4.33 3.96 3.88 2.30 0.35 0.58
Multiple races N/A N/A N/A N/A N/A N/A N/A N/A N/A 32.65 22.74
Unknown 7.77 6.91 8.39 15.18 8.81 1.20 10.41 5.55 13.09 16.65 35.17
Abortion Rates‡
White non-Hispanic 7.1 6.9 7.7 5.7 7.21 7.3 6.45 6.38 8.21 3.67 2.87
Hispanic or Latino 10.9 10.2 12.9 8.6 8.1 9.2 7.59 7.96 8.05 9.95 7.62
Black or African American 14.5 11.8 17.7 13 10.27 12.7 13.81 13.34 8.45 2.48 1.97
American Indian 4.4 5.1 5.1 5.1 4.38 3.8 3.6 3.59 3.2 0.58 0.55
Asian or Pacific Islander NA 8.3 14.7 11.3 9.27 10.4 9.31 8.73 5.24 0.92 1.57
Multiple races NA NA NA NA NA NA NA NA NA NA NA
Unknown NA NA NA NA NA NA NA NA NA NA NA
Abortion Ratio§
White non-Hispanic 127 126 134 112 119 123 113 115 135 62 49
Hispanic or Latino 99 88 110 74 70 81 73 86 100 129 102
Black or African American 202 164 225 170 150 162 173 168 110 33 24
American Indian 51 61 56 56 54 48 47 49 38 44 7
Asian or Pacific Islander 120 108 170 135 125 133 120 115 77 8 21
Multiple races NA NA NA NA NA NA NA NA NA NA NA
Unknown NA NA NA NA NA NA NA NA NA NA NA
Race and EthnicityYear
†Proportion of total abortions by ethnicity and/or race represented as a percentage. Percentages are calculated using the total number of reported abortions as the denominator and the number of reported abortions for a specific ethnicity and/or race as the numerator. Percents do not add up to a 100 due to rounding errors, multiple race and unknown ethnicity/race categories.‡Calculated using the number of abortions obtained by women, ages 15-44 in a given race and/or ethnic group per 1,000 women in the same group.§Calculated using the number of abortions obtained by women, ages 15-44 in a given race and/or ethnic group per 1,000 live births to women in the same group.¶Beginning 2011, rates and ratios should be interpreted with caution due to the addition of the Multiple Race and Unknown categories. Single race selections are the best estimates for rates and ratios.
17 | P a g e
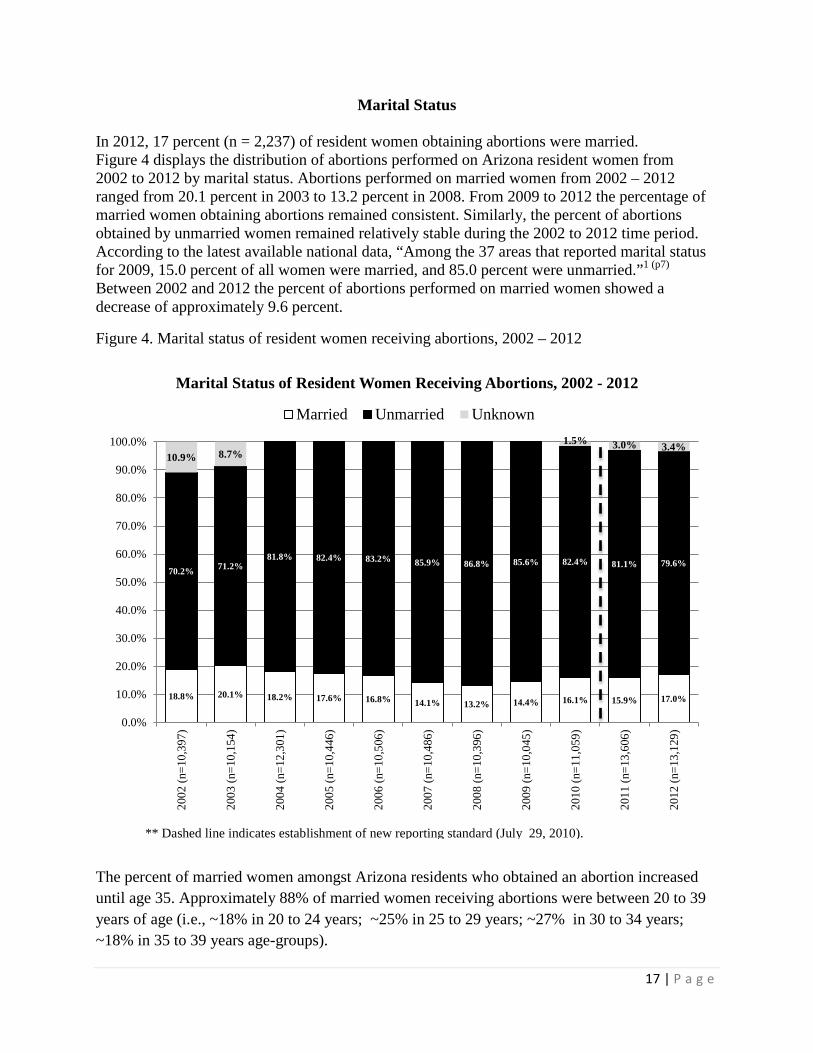
Marital Status In 2012, 17 percent (n = 2,237) of resident women obtaining abortions were married. Figure 4 displays the distribution of abortions performed on Arizona resident women from 2002 to 2012 by marital status. Abortions performed on married women from 2002 – 2012 ranged from 20.1 percent in 2003 to 13.2 percent in 2008. From 2009 to 2012 the percentage of married women obtaining abortions remained consistent. Similarly, the percent of abortions obtained by unmarried women remained relatively stable during the 2002 to 2012 time period. According to the latest available national data, “Among the 37 areas that reported marital status for 2009, 15.0 percent of all women were married, and 85.0 percent were unmarried.”1 (p7) Between 2002 and 2012 the percent of abortions performed on married women showed a decrease of approximately 9.6 percent.
Figure 4. Marital status of resident women receiving abortions, 2002 – 2012
The percent of married women amongst Arizona residents who obtained an abortion increased until age 35. Approximately 88% of married women receiving abortions were between 20 to 39 years of age (i.e., ~18% in 20 to 24 years; ~25% in 25 to 29 years; ~27% in 30 to 34 years; ~18% in 35 to 39 years age-groups).
18.8% 20.1% 18.2% 17.6% 16.8% 14.1% 13.2% 14.4% 16.1% 15.9% 17.0%
70.2% 71.2% 81.8% 82.4% 83.2% 85.9% 86.8% 85.6% 82.4% 81.1% 79.6%
10.9% 8.7% 1.5% 3.0% 3.4%
0.0%
10.0%
20.0%
30.0%
40.0%
50.0%
60.0%
70.0%
80.0%
90.0%
100.0%
2002
(n=1
0,39
7)
2003
(n=1
0,15
4)
2004
(n=1
2,30
1)
2005
(n=1
0,44
6)
2006
(n=1
0,50
6)
2007
(n=1
0,48
6)
2008
(n=1
0,39
6)
2009
(n=1
0,04
5)
2010
(n=1
1,05
9)
2011
(n=1
3,60
6)
2012
(n=1
3,12
9)
Marital Status of Resident Women Receiving Abortions, 2002 - 2012
Married Unmarried Unknown
** Dashed line indicates establishment of new reporting standard (July 29, 2010).
18 | P a g e
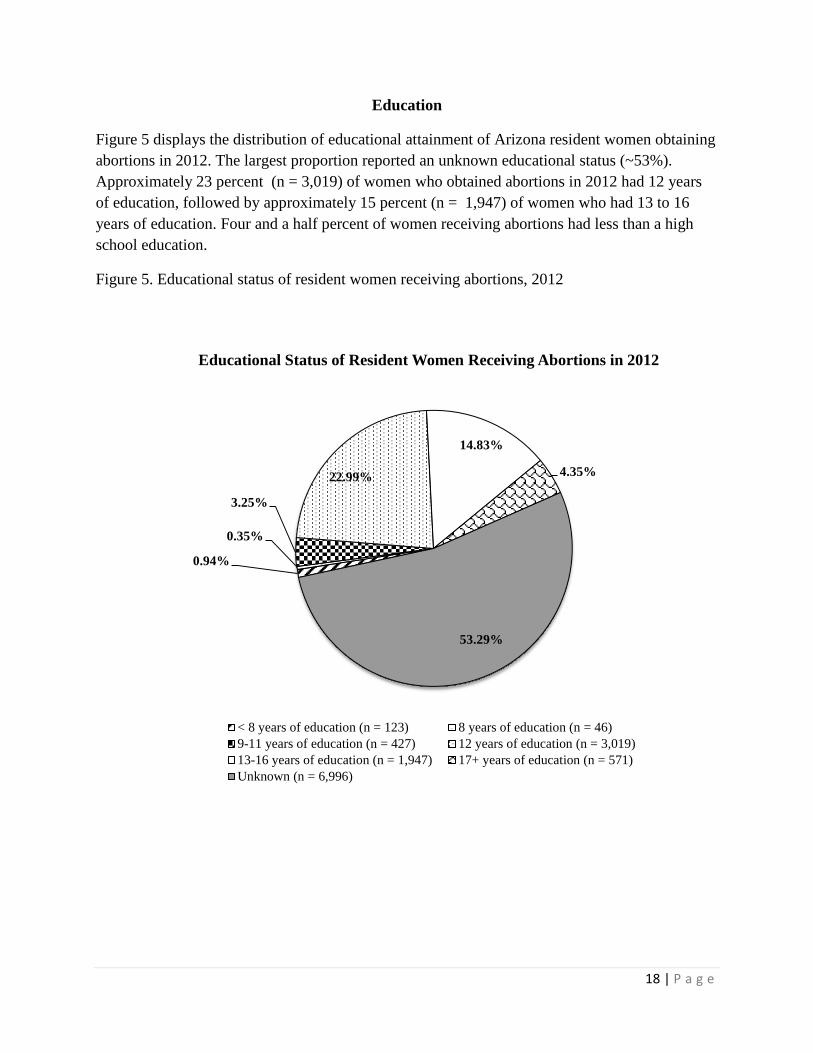
Education
Figure 5 displays the distribution of educational attainment of Arizona resident women obtaining abortions in 2012. The largest proportion reported an unknown educational status (~53%). Approximately 23 percent (n = 3,019) of women who obtained abortions in 2012 had 12 years of education, followed by approximately 15 percent (n = 1,947) of women who had 13 to 16 years of education. Four and a half percent of women receiving abortions had less than a high school education.
Figure 5. Educational status of resident women receiving abortions, 2012
0.94%
0.35%
3.25%
22.99%
14.83%
4.35%
53.29%
Educational Status of Resident Women Receiving Abortions in 2012
< 8 years of education (n = 123) 8 years of education (n = 46)9-11 years of education (n = 427) 12 years of education (n = 3,019)13-16 years of education (n = 1,947) 17+ years of education (n = 571)Unknown (n = 6,996)
19 | P a g e
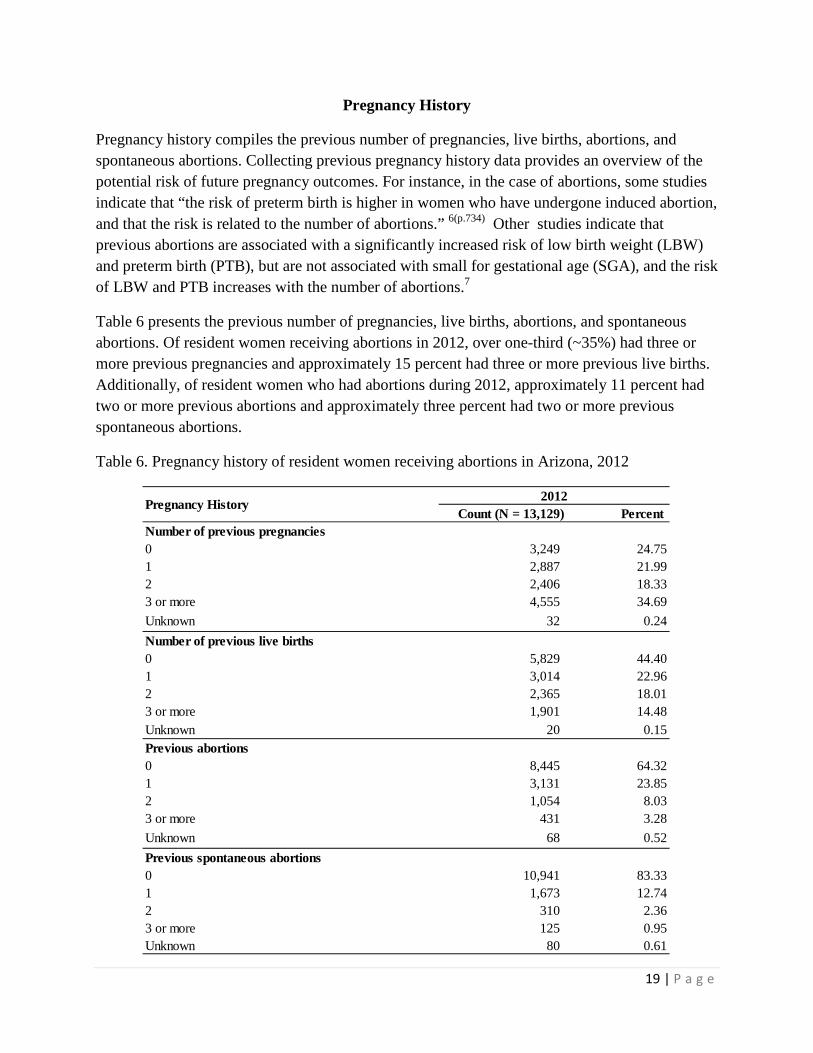
Pregnancy History
Pregnancy history compiles the previous number of pregnancies, live births, abortions, and spontaneous abortions. Collecting previous pregnancy history data provides an overview of the potential risk of future pregnancy outcomes. For instance, in the case of abortions, some studies indicate that “the risk of preterm birth is higher in women who have undergone induced abortion, and that the risk is related to the number of abortions.” 6(p.734) Other studies indicate that previous abortions are associated with a significantly increased risk of low birth weight (LBW) and preterm birth (PTB), but are not associated with small for gestational age (SGA), and the risk of LBW and PTB increases with the number of abortions.7
Table 6 presents the previous number of pregnancies, live births, abortions, and spontaneous abortions. Of resident women receiving abortions in 2012, over one-third (~35%) had three or more previous pregnancies and approximately 15 percent had three or more previous live births. Additionally, of resident women who had abortions during 2012, approximately 11 percent had two or more previous abortions and approximately three percent had two or more previous spontaneous abortions.
Table 6. Pregnancy history of resident women receiving abortions in Arizona, 2012
Count (N = 13,129) Percent Number of previous pregnancies0 3,249 24.751 2,887 21.992 2,406 18.333 or more 4,555 34.69Unknown 32 0.24Number of previous live births0 5,829 44.401 3,014 22.962 2,365 18.013 or more 1,901 14.48Unknown 20 0.15Previous abortions0 8,445 64.321 3,131 23.852 1,054 8.033 or more 431 3.28Unknown 68 0.52Previous spontaneous abortions0 10,941 83.331 1,673 12.742 310 2.363 or more 125 0.95Unknown 80 0.61
Pregnancy History 2012

20 | P a g e
Of those women who had abortions in 2012, 7,361 (~56%) had neither a previous abortion or a spontaneous abortion (data not shown). Approximately 7.6 percent (n = 1,003) had at least one or more previous abortions and had one or more previous spontaneous abortions. Further, 8.2 percent (n = 1,082) had a previous spontaneous abortion but did not have a previous elective abortion and about 33 percent (n = 3,574) had a previous abortion but did not have a previous spontaneous abortion.
21 | P a g e
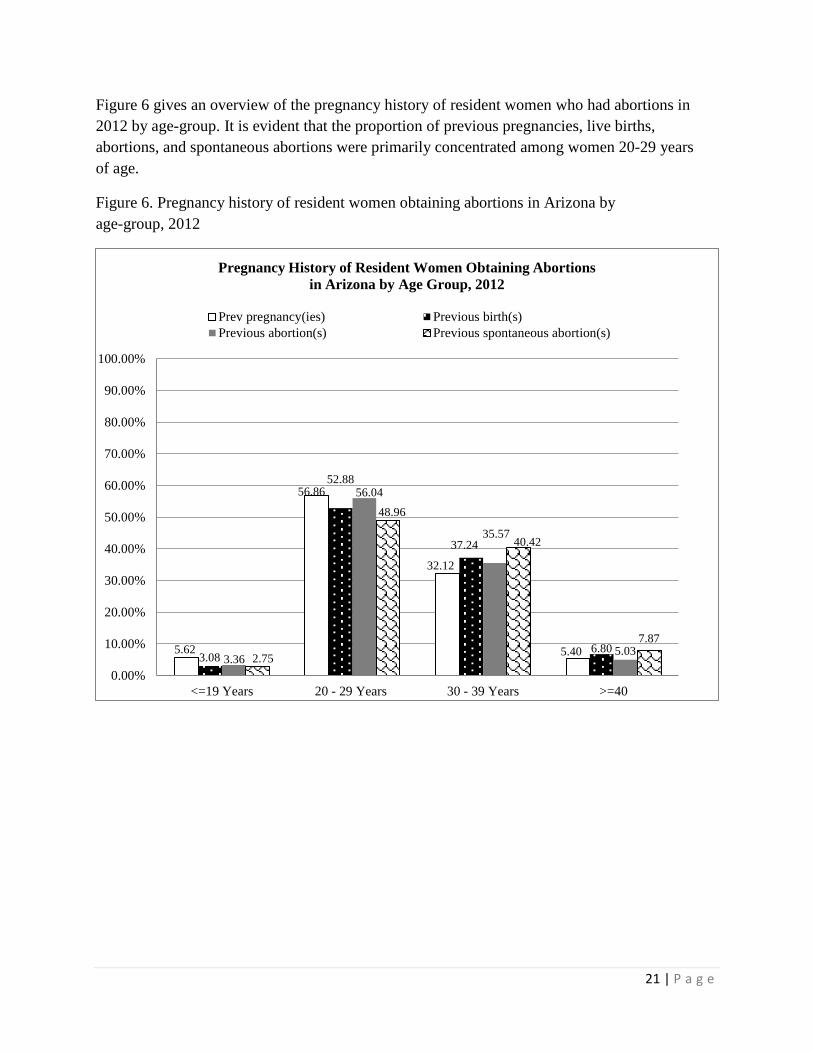
Figure 6 gives an overview of the pregnancy history of resident women who had abortions in 2012 by age-group. It is evident that the proportion of previous pregnancies, live births, abortions, and spontaneous abortions were primarily concentrated among women 20-29 years of age.
Figure 6. Pregnancy history of resident women obtaining abortions in Arizona by age-group, 2012
5.62
56.86
32.12
5.40 3.08
52.88
37.24
6.80 3.36
56.04
35.57
5.03 2.75
48.96
40.42
7.87
0.00%
10.00%
20.00%
30.00%
40.00%
50.00%
60.00%
70.00%
80.00%
90.00%
100.00%
<=19 Years 20 - 29 Years 30 - 39 Years >=40
Pregnancy History of Resident Women Obtaining Abortions in Arizona by Age Group, 2012
Prev pregnancy(ies) Previous birth(s)Previous abortion(s) Previous spontaneous abortion(s)
22 | P a g e
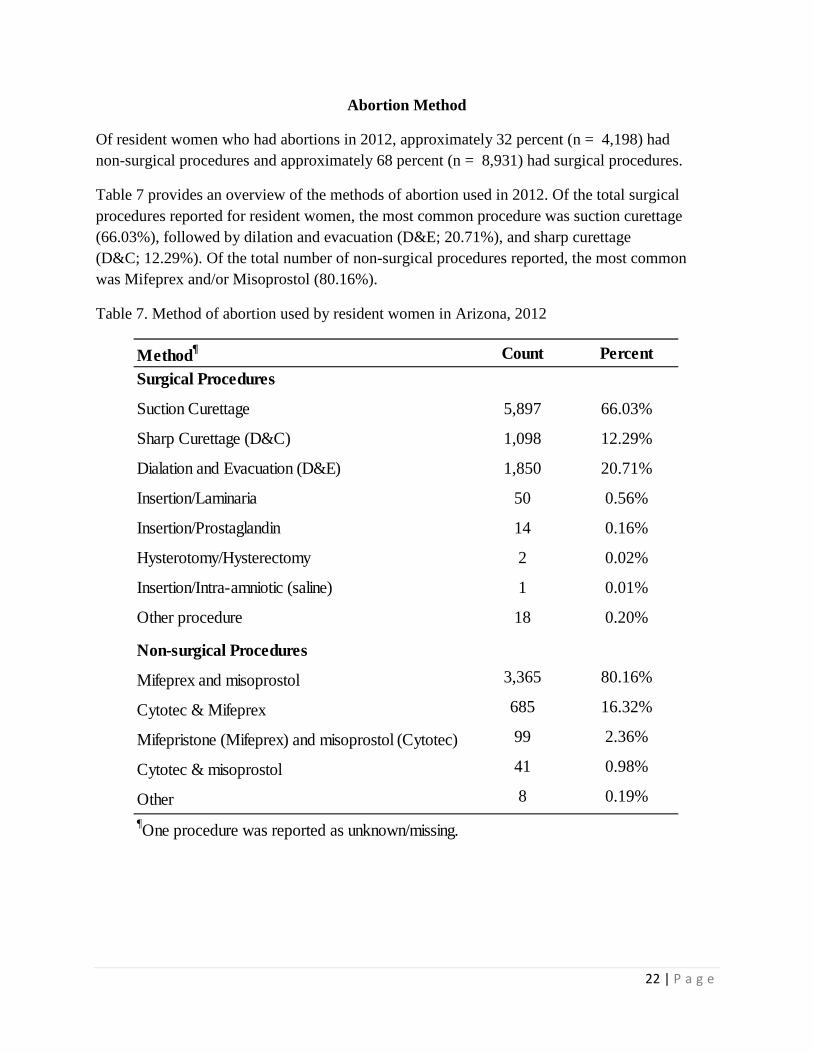
Abortion Method
Of resident women who had abortions in 2012, approximately 32 percent (n = 4,198) had non-surgical procedures and approximately 68 percent (n = 8,931) had surgical procedures.
Table 7 provides an overview of the methods of abortion used in 2012. Of the total surgical procedures reported for resident women, the most common procedure was suction curettage (66.03%), followed by dilation and evacuation (D&E; 20.71%), and sharp curettage (D&C; 12.29%). Of the total number of non-surgical procedures reported, the most common was Mifeprex and/or Misoprostol (80.16%).
Table 7. Method of abortion used by resident women in Arizona, 2012
Method¶ Count PercentSurgical Procedures
Suction Curettage 5,897 66.03%
Sharp Curettage (D&C) 1,098 12.29%
Dialation and Evacuation (D&E) 1,850 20.71%
Insertion/Laminaria 50 0.56%
Insertion/Prostaglandin 14 0.16%
Hysterotomy/Hysterectomy 2 0.02%
Insertion/Intra-amniotic (saline) 1 0.01%
Other procedure 18 0.20%
Non-surgical Procedures
Mifeprex and misoprostol 3,365 80.16%
Cytotec & Mifeprex 685 16.32%
Mifepristone (Mifeprex) and misoprostol (Cytotec) 99 2.36%
Cytotec & misoprostol 41 0.98%
Other 8 0.19%¶One procedure was reported as unknown/missing.
23 | P a g e
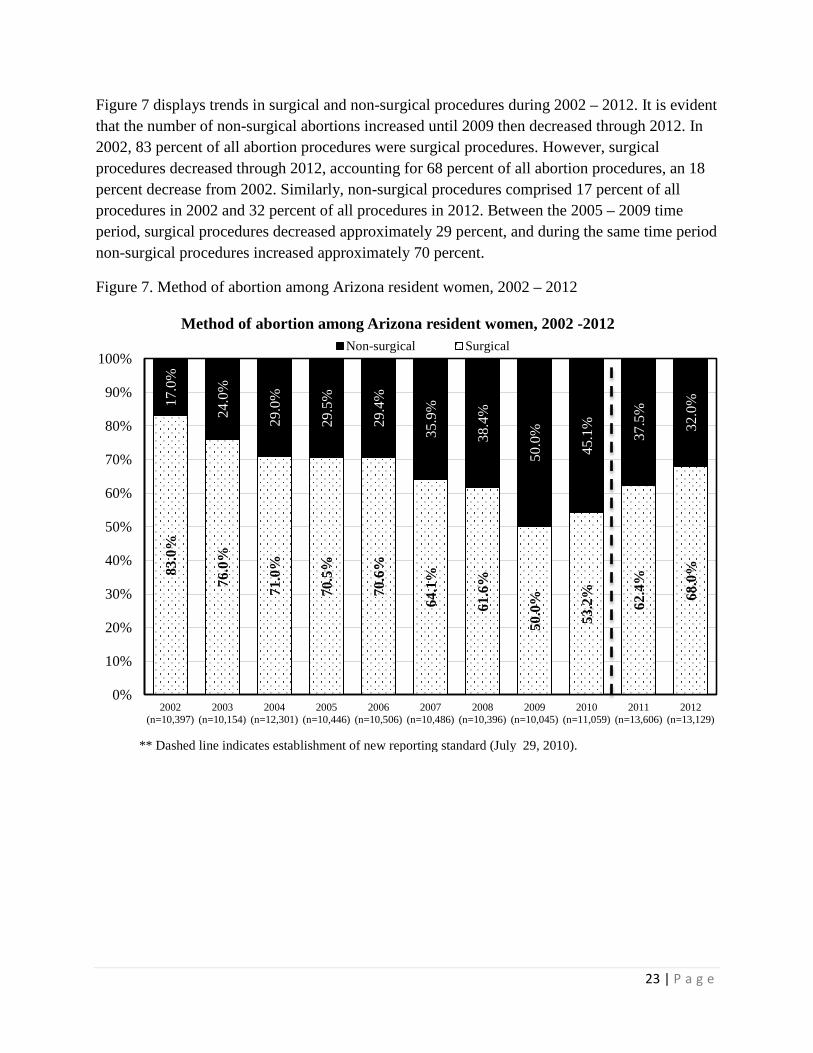
Figure 7 displays trends in surgical and non-surgical procedures during 2002 – 2012. It is evident that the number of non-surgical abortions increased until 2009 then decreased through 2012. In 2002, 83 percent of all abortion procedures were surgical procedures. However, surgical procedures decreased through 2012, accounting for 68 percent of all abortion procedures, an 18 percent decrease from 2002. Similarly, non-surgical procedures comprised 17 percent of all procedures in 2002 and 32 percent of all procedures in 2012. Between the 2005 – 2009 time period, surgical procedures decreased approximately 29 percent, and during the same time period non-surgical procedures increased approximately 70 percent.
Figure 7. Method of abortion among Arizona resident women, 2002 – 2012
83.0
%
76.0
%
71.0
%
70.5
%
70.6
%
64.1
%
61.6
%
50.0
%
53.2
%
62.4
%
68.0
%
17.0
%
24.0
%
29.0
%
29.5
%
29.4
%
35.9
%
38.4
%
50.0
%
45.1
%
37.5
%
32.0
%
0%
10%
20%
30%
40%
50%
60%
70%
80%
90%
100%
2002(n=10,397)
2003(n=10,154)
2004(n=12,301)
2005(n=10,446)
2006(n=10,506)
2007(n=10,486)
2008(n=10,396)
2009(n=10,045)
2010(n=11,059)
2011(n=13,606)
2012(n=13,129)
Method of abortion among Arizona resident women, 2002 -2012 Non-surgical Surgical
** Dashed line indicates establishment of new reporting standard (July 29, 2010).
24 | P a g e
Facility and Reason for Termination
Of the 13,129 abortions reported for Arizona residents, 13,072 (99.57%) were performed in clinics and 54 in hospitals ( .41%). The majority of abortions were elective (99.02%), with 129 (0.98%) cases reported as taking place for medical reasons. Of the 129 cases that indicated abortion for medical reasons, 84 percent (n = 108) were surgical procedures, 16 percent (n = 21) were non-surgical, 64 percent (n = 82) were performed in clinics, and 36 percent (n = 47) were performed in hospitals. About 94 percent (n = 121) of the medically necessary abortions were performed on women age 20 or older.
Both maternal and fetal medical conditions resulting in complications to pregnancy may result in a decision to abort. Data related to medical conditions and complications occurring during the abortion procedure are collected on the abortion procedure report. Providers report both complications during an abortion procedure and complications occurring after, or as result of, an abortion procedure. Data relating to complications occurring after or as a result of an abortion are collected separately (see A.R.S. 36-2162) and are presented in a later section of this report.
During 2012, 34 resident women experiencing medical complications obtained an abortion citing a medical condition as the reason for termination. The age range of women in this group was from 17 to 44 years while the greatest number of procedures were to unmarried women 17 – 25 years of age. Approximately 53 percent (52.94%, n = 18) of these abortions were between 14 and 20 weeks gestation and over 67 percent of procedures performed were surgical. About 88 percent (n = 30) of women in this group were residents of Maricopa county.
Table 8 on the following page presents maternal characteristics and corresponding medical conditions cited for obtaining an abortion.
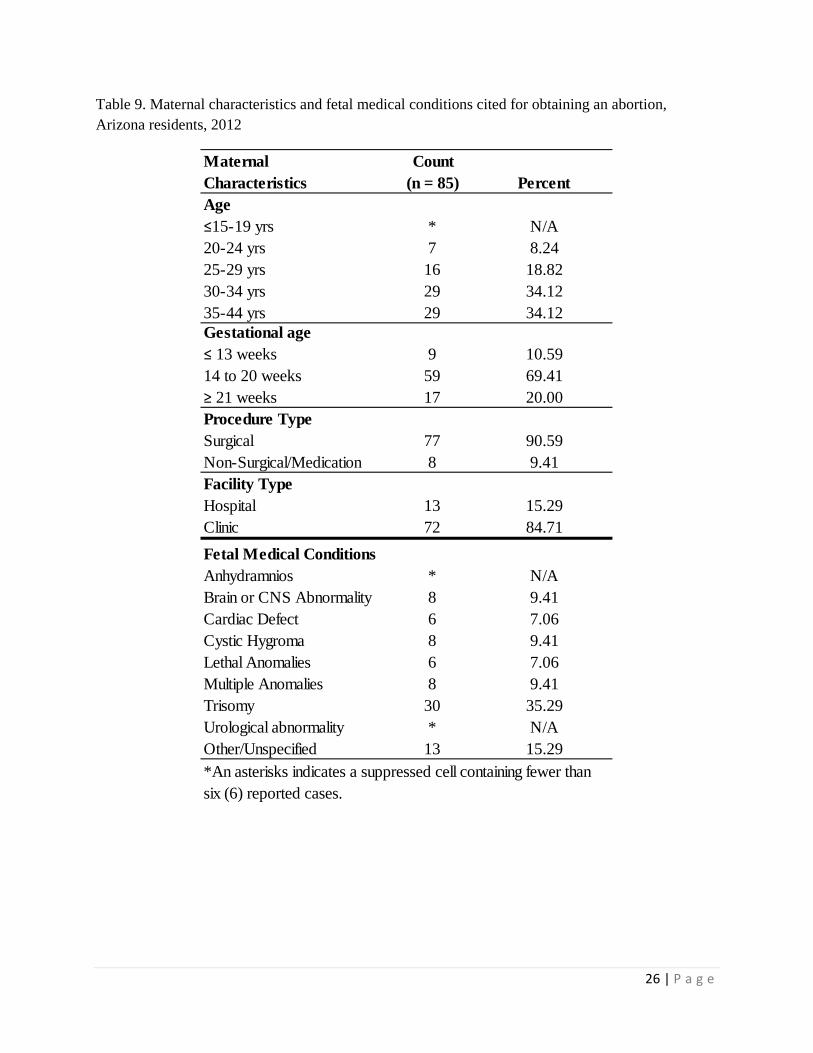
Additionally, 85 women obtained an abortion due to fetal medical conditions. The majority of these were related to birth defects. The age range of women in this group was 16 to 44 years with the greatest number of procedures to married women 25 – 39 years of age. Approximately 69 percent (69.4%, n = 59) of these procedures were performed between 14 and 20 weeks gestation and over 90 percent (90.59%, n = 77) were surgical procedures. Unlike maternal medical conditions, the majority of procedures (84.71%, n = 72) were performed in clinics with slightly more than 56 percent (n = 48) to residents of Maricopa county.
Table 9 on the following page presents maternal characteristics and fetal medical conditions cited as reasons for obtaining an abortion.
Conditions reported once were categorized as “Other” and consisted of the following conditions: cleft lip/palate, conjoined twins, fetal anomaly, hydrops, karyotype abnormality, oligohydramnios, omphalocele, osteogenesis imperfect, phocomelia, skeletal anomaly, teratoma, and twin abnormality.
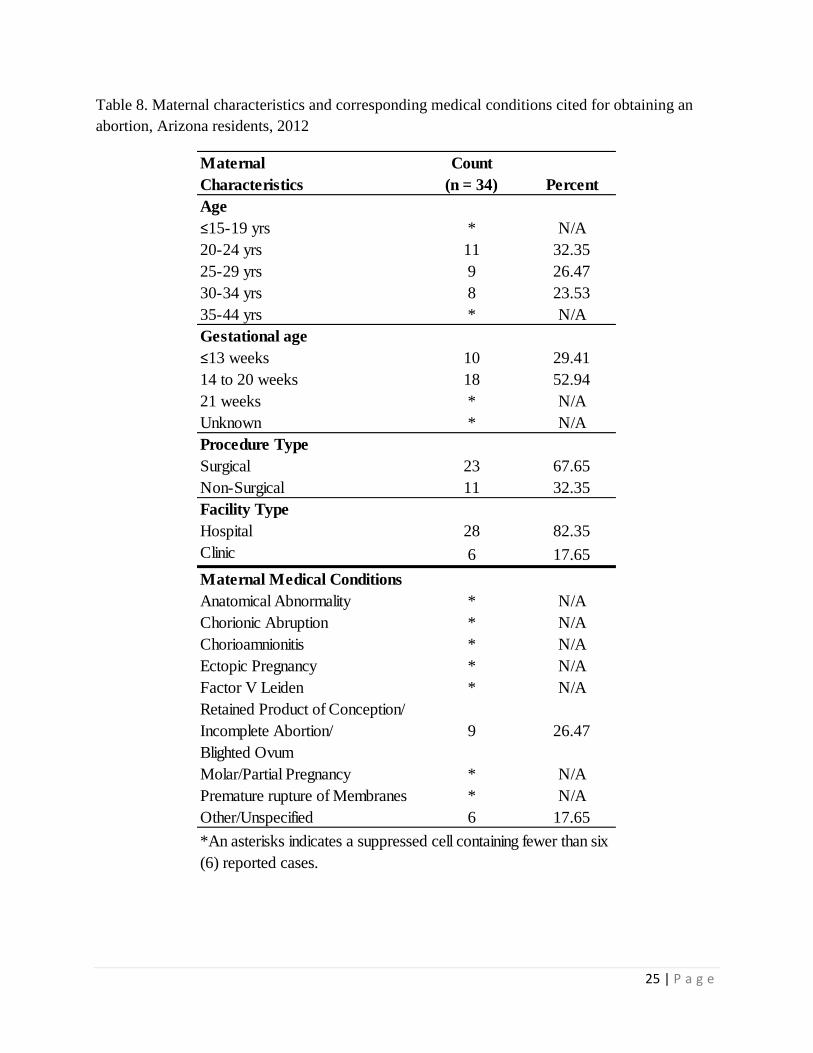
25 | P a g e
Table 8. Maternal characteristics and corresponding medical conditions cited for obtaining an abortion, Arizona residents, 2012
Maternal Characteristics
Count (n = 34) Percent
Age ≤15-19 yrs * N/A20-24 yrs 11 32.3525-29 yrs 9 26.4730-34 yrs 8 23.5335-44 yrs * N/AGestational age ≤13 weeks 10 29.4114 to 20 weeks 18 52.9421 weeks * N/AUnknown * N/AProcedure TypeSurgical 23 67.65Non-Surgical 11 32.35Facility TypeHospital 28 82.35Clinic 6 17.65Maternal Medical ConditionsAnatomical Abnormality * N/AChorionic Abruption * N/AChorioamnionitis * N/AEctopic Pregnancy * N/AFactor V Leiden * N/ARetained Product of Conception/ Incomplete Abortion/ Blighted Ovum
9 26.47
Molar/Partial Pregnancy * N/APremature rupture of Membranes * N/AOther/Unspecified 6 17.65*An asterisks indicates a suppressed cell containing fewer than six (6) reported cases.
26 | P a g e
Table 9. Maternal characteristics and fetal medical conditions cited for obtaining an abortion, Arizona residents, 2012
Maternal Characteristics
Count (n = 85) Percent
Age ≤15-19 yrs * N/A20-24 yrs 7 8.2425-29 yrs 16 18.8230-34 yrs 29 34.1235-44 yrs 29 34.12Gestational age ≤ 13 weeks 9 10.5914 to 20 weeks 59 69.41≥ 21 weeks 17 20.00Procedure TypeSurgical 77 90.59Non-Surgical/Medication 8 9.41Facility TypeHospital 13 15.29Clinic 72 84.71Fetal Medical ConditionsAnhydramnios * N/ABrain or CNS Abnormality 8 9.41Cardiac Defect 6 7.06Cystic Hygroma 8 9.41Lethal Anomalies 6 7.06Multiple Anomalies 8 9.41Trisomy 30 35.29Urological abnormality * N/AOther/Unspecified 13 15.29*An asterisks indicates a suppressed cell containing fewer than six (6) reported cases.
27 | P a g e
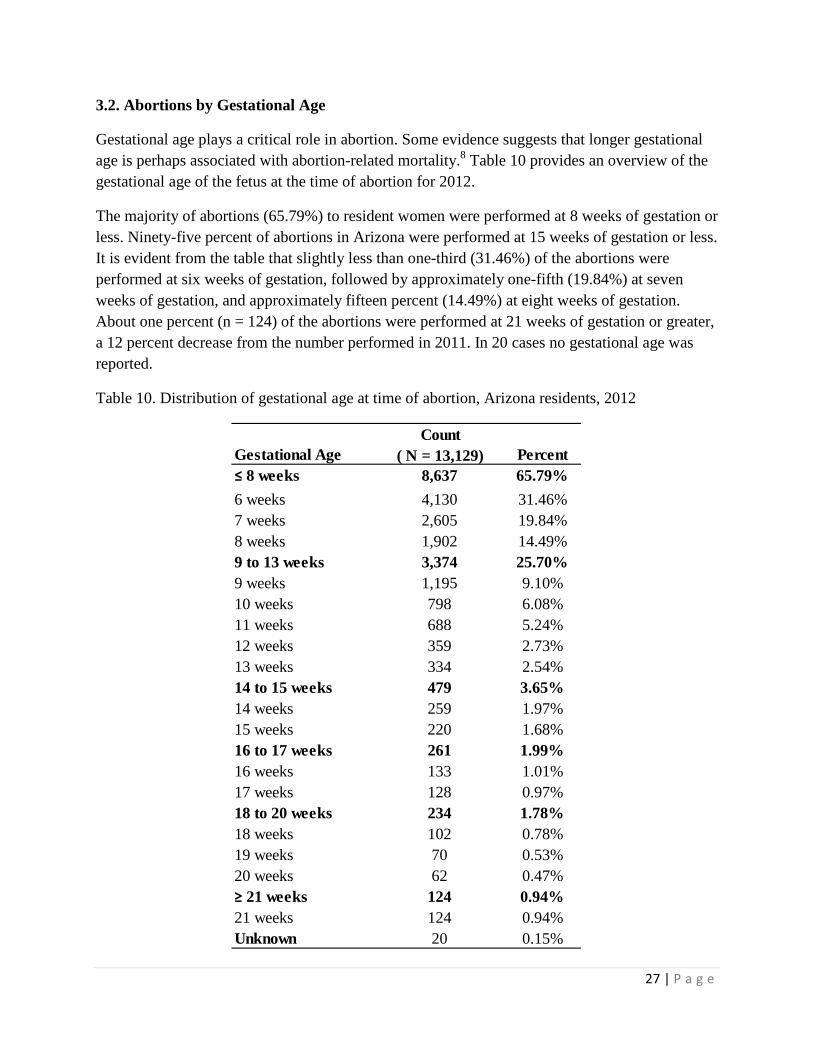
3.2. Abortions by Gestational Age
Gestational age plays a critical role in abortion. Some evidence suggests that longer gestational age is perhaps associated with abortion-related mortality.8 Table 10 provides an overview of the gestational age of the fetus at the time of abortion for 2012.
The majority of abortions (65.79%) to resident women were performed at 8 weeks of gestation or less. Ninety-five percent of abortions in Arizona were performed at 15 weeks of gestation or less. It is evident from the table that slightly less than one-third (31.46%) of the abortions were performed at six weeks of gestation, followed by approximately one-fifth (19.84%) at seven weeks of gestation, and approximately fifteen percent (14.49%) at eight weeks of gestation. About one percent (n = 124) of the abortions were performed at 21 weeks of gestation or greater, a 12 percent decrease from the number performed in 2011. In 20 cases no gestational age was reported.
Table 10. Distribution of gestational age at time of abortion, Arizona residents, 2012
Gestational Age Count
( N = 13,129) Percent ≤ 8 weeks 8,637 65.79%6 weeks 4,130 31.46%7 weeks 2,605 19.84%8 weeks 1,902 14.49%9 to 13 weeks 3,374 25.70%9 weeks 1,195 9.10%10 weeks 798 6.08%11 weeks 688 5.24%12 weeks 359 2.73%13 weeks 334 2.54%14 to 15 weeks 479 3.65%14 weeks 259 1.97%15 weeks 220 1.68%16 to 17 weeks 261 1.99%16 weeks 133 1.01%17 weeks 128 0.97%18 to 20 weeks 234 1.78%18 weeks 102 0.78%19 weeks 70 0.53%20 weeks 62 0.47%≥ 21 weeks 124 0.94%21 weeks 124 0.94%Unknown 20 0.15%
28 | P a g e
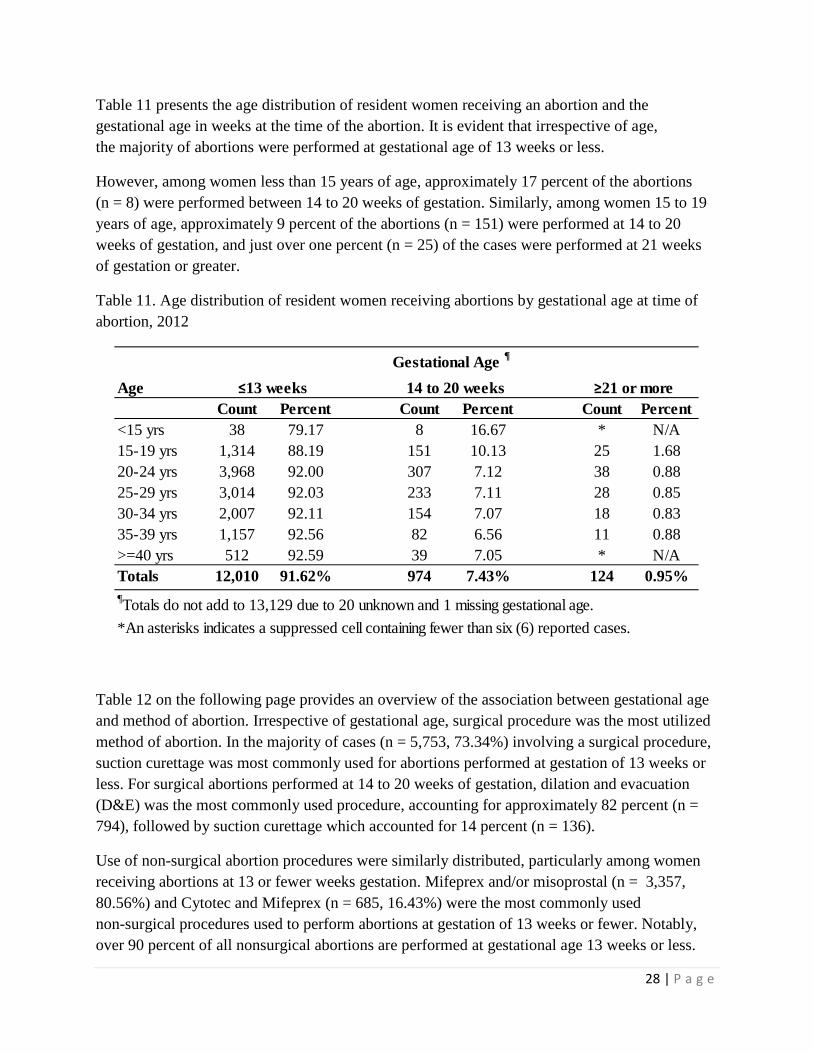
Table 11 presents the age distribution of resident women receiving an abortion and the gestational age in weeks at the time of the abortion. It is evident that irrespective of age, the majority of abortions were performed at gestational age of 13 weeks or less.
However, among women less than 15 years of age, approximately 17 percent of the abortions (n = 8) were performed between 14 to 20 weeks of gestation. Similarly, among women 15 to 19 years of age, approximately 9 percent of the abortions (n = 151) were performed at 14 to 20 weeks of gestation, and just over one percent (n = 25) of the cases were performed at 21 weeks of gestation or greater.
Table 11. Age distribution of resident women receiving abortions by gestational age at time of abortion, 2012
Table 12 on the following page provides an overview of the association between gestational age and method of abortion. Irrespective of gestational age, surgical procedure was the most utilized method of abortion. In the majority of cases (n = 5,753, 73.34%) involving a surgical procedure, suction curettage was most commonly used for abortions performed at gestation of 13 weeks or less. For surgical abortions performed at 14 to 20 weeks of gestation, dilation and evacuation (D&E) was the most commonly used procedure, accounting for approximately 82 percent (n = 794), followed by suction curettage which accounted for 14 percent (n = 136).
Use of non-surgical abortion procedures were similarly distributed, particularly among women receiving abortions at 13 or fewer weeks gestation. Mifeprex and/or misoprostal (n = 3,357, 80.56%) and Cytotec and Mifeprex (n = 685, 16.43%) were the most commonly used non-surgical procedures used to perform abortions at gestation of 13 weeks or fewer. Notably, over 90 percent of all nonsurgical abortions are performed at gestational age 13 weeks or less.
Age
Count Percent Count Percent Count Percent<15 yrs 38 79.17 8 16.67 * N/A15-19 yrs 1,314 88.19 151 10.13 25 1.6820-24 yrs 3,968 92.00 307 7.12 38 0.8825-29 yrs 3,014 92.03 233 7.11 28 0.8530-34 yrs 2,007 92.11 154 7.07 18 0.8335-39 yrs 1,157 92.56 82 6.56 11 0.88>=40 yrs 512 92.59 39 7.05 * N/ATotals 12,010 91.62% 974 7.43% 124 0.95%
Gestational Age ¶
¶Totals do not add to 13,129 due to 20 unknown and 1 missing gestational age.*An asterisks indicates a suppressed cell containing fewer than six (6) reported cases.
≤13 weeks 14 to 20 weeks ≥21 or more
29 | P a g e
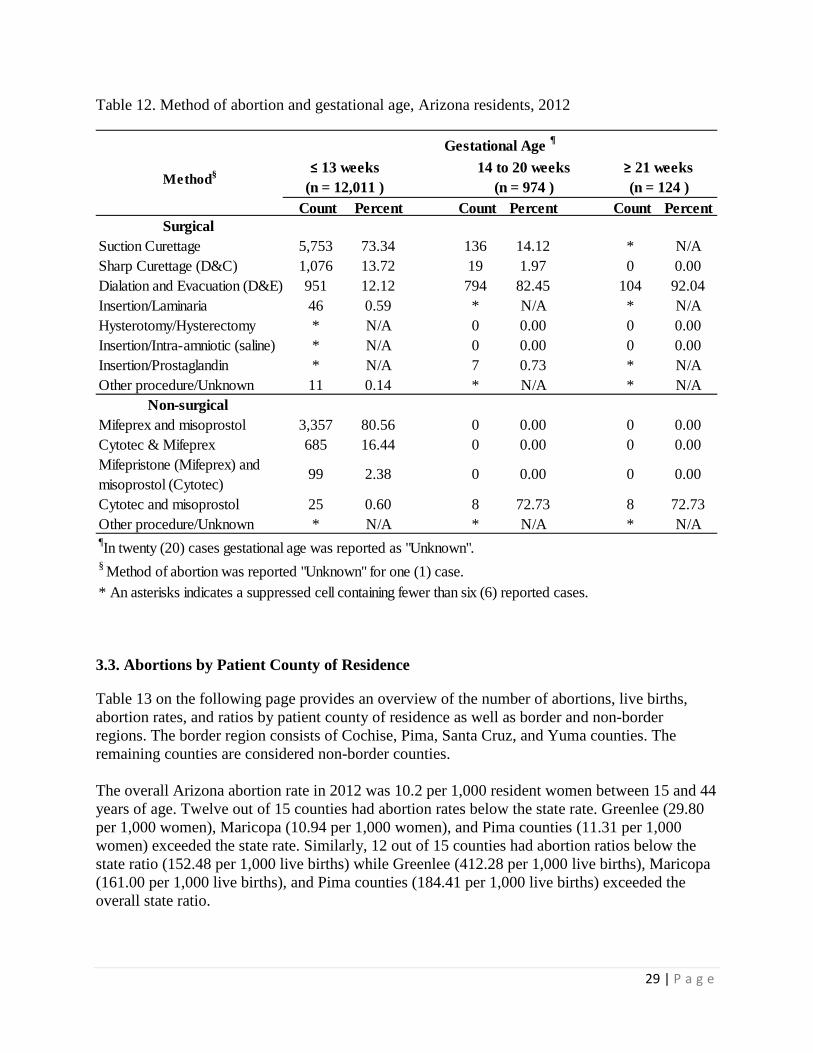
Table 12. Method of abortion and gestational age, Arizona residents, 2012
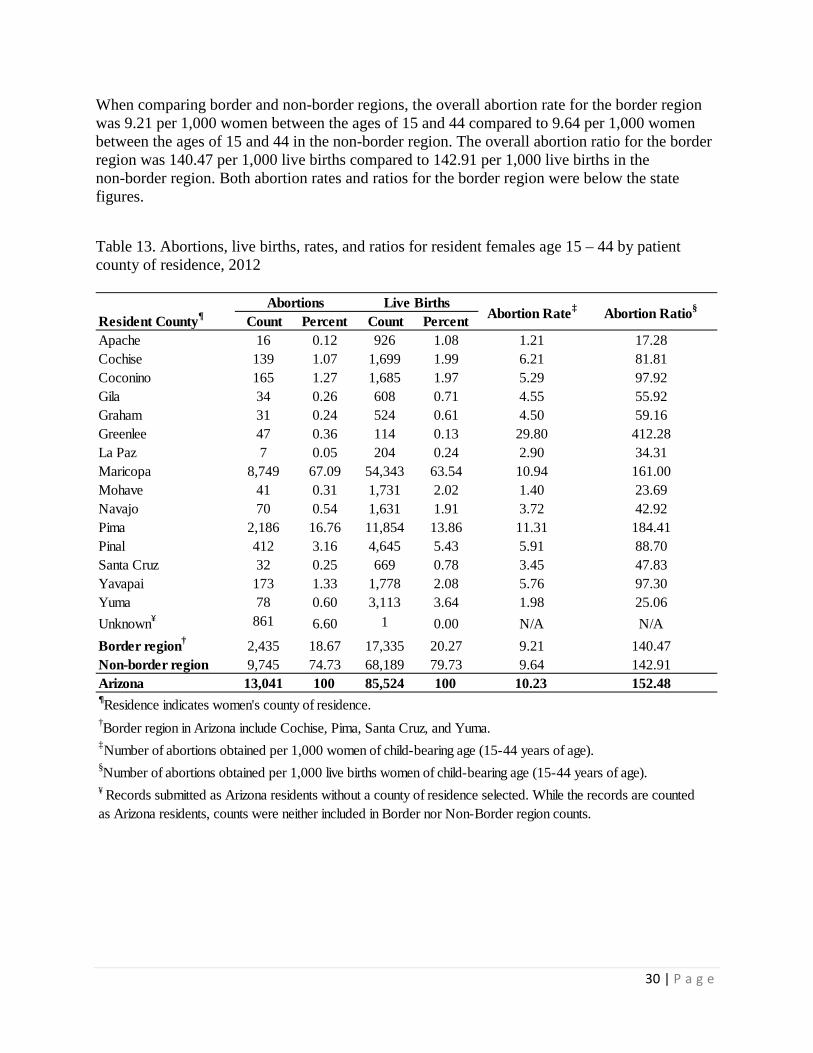
3.3. Abortions by Patient County of Residence
Table 13 on the following page provides an overview of the number of abortions, live births, abortion rates, and ratios by patient county of residence as well as border and non-border regions. The border region consists of Cochise, Pima, Santa Cruz, and Yuma counties. The remaining counties are considered non-border counties. The overall Arizona abortion rate in 2012 was 10.2 per 1,000 resident women between 15 and 44 years of age. Twelve out of 15 counties had abortion rates below the state rate. Greenlee (29.80 per 1,000 women), Maricopa (10.94 per 1,000 women), and Pima counties (11.31 per 1,000 women) exceeded the state rate. Similarly, 12 out of 15 counties had abortion ratios below the state ratio (152.48 per 1,000 live births) while Greenlee (412.28 per 1,000 live births), Maricopa (161.00 per 1,000 live births), and Pima counties (184.41 per 1,000 live births) exceeded the overall state ratio.
Count Percent Count Percent Count PercentSurgical
Suction Curettage 5,753 73.34 136 14.12 * N/ASharp Curettage (D&C) 1,076 13.72 19 1.97 0 0.00Dialation and Evacuation (D&E) 951 12.12 794 82.45 104 92.04Insertion/Laminaria 46 0.59 * N/A * N/AHysterotomy/Hysterectomy * N/A 0 0.00 0 0.00Insertion/Intra-amniotic (saline) * N/A 0 0.00 0 0.00Insertion/Prostaglandin * N/A 7 0.73 * N/AOther procedure/Unknown 11 0.14 * N/A * N/A
Non-surgical Mifeprex and misoprostol 3,357 80.56 0 0.00 0 0.00Cytotec & Mifeprex 685 16.44 0 0.00 0 0.00Mifepristone (Mifeprex) and misoprostol (Cytotec)
99 2.38 0 0.00 0 0.00
Cytotec and misoprostol 25 0.60 8 72.73 8 72.73Other procedure/Unknown * N/A * N/A * N/A
Gestational Age ¶
* An asterisks indicates a suppressed cell containing fewer than six (6) reported cases.
Method§
¶In twenty (20) cases gestational age was reported as "Unknown".§ Method of abortion was reported "Unknown" for one (1) case.
≤ 13 weeks (n = 12,011 )
14 to 20 weeks(n = 974 )
≥ 21 weeks (n = 124 )
30 | P a g e
When comparing border and non-border regions, the overall abortion rate for the border region was 9.21 per 1,000 women between the ages of 15 and 44 compared to 9.64 per 1,000 women between the ages of 15 and 44 in the non-border region. The overall abortion ratio for the border region was 140.47 per 1,000 live births compared to 142.91 per 1,000 live births in the non-border region. Both abortion rates and ratios for the border region were below the state figures.
Table 13. Abortions, live births, rates, and ratios for resident females age 15 – 44 by patient county of residence, 2012
Count Percent Count PercentApache 16 0.12 926 1.08Cochise 139 1.07 1,699 1.99Coconino 165 1.27 1,685 1.97Gila 34 0.26 608 0.71Graham 31 0.24 524 0.61Greenlee 47 0.36 114 0.13La Paz 7 0.05 204 0.24Maricopa 8,749 67.09 54,343 63.54Mohave 41 0.31 1,731 2.02Navajo 70 0.54 1,631 1.91Pima 2,186 16.76 11,854 13.86Pinal 412 3.16 4,645 5.43Santa Cruz 32 0.25 669 0.78Yavapai 173 1.33 1,778 2.08Yuma 78 0.60 3,113 3.64Unknown¥ 861 6.60 1 0.00Border region† 2,435 18.67 17,335 20.27Non-border region 9,745 74.73 68,189 79.73Arizona 13,041 100 85,524 100
1.21 17.28Resident County¶
Abortions Live BirthsAbortion Rate‡ Abortion Ratio§
6.21 81.815.29 97.924.55 55.924.50 59.16
29.80 412.282.90 34.31
10.94 161.001.40 23.693.72 42.9211.31 184.415.91 88.703.45 47.835.76 97.301.98 25.06
9.21 140.47
‡Number of abortions obtained per 1,000 women of child-bearing age (15-44 years of age).§Number of abortions obtained per 1,000 live births women of child-bearing age (15-44 years of age).
N/A N/A
¥ Records submitted as Arizona residents without a county of residence selected. While the records are counted as Arizona residents, counts were neither included in Border nor Non-Border region counts.
9.64 142.9110.23 152.48
¶Residence indicates women's county of residence. †Border region in Arizona include Cochise, Pima, Santa Cruz, and Yuma.
31 | P a g e
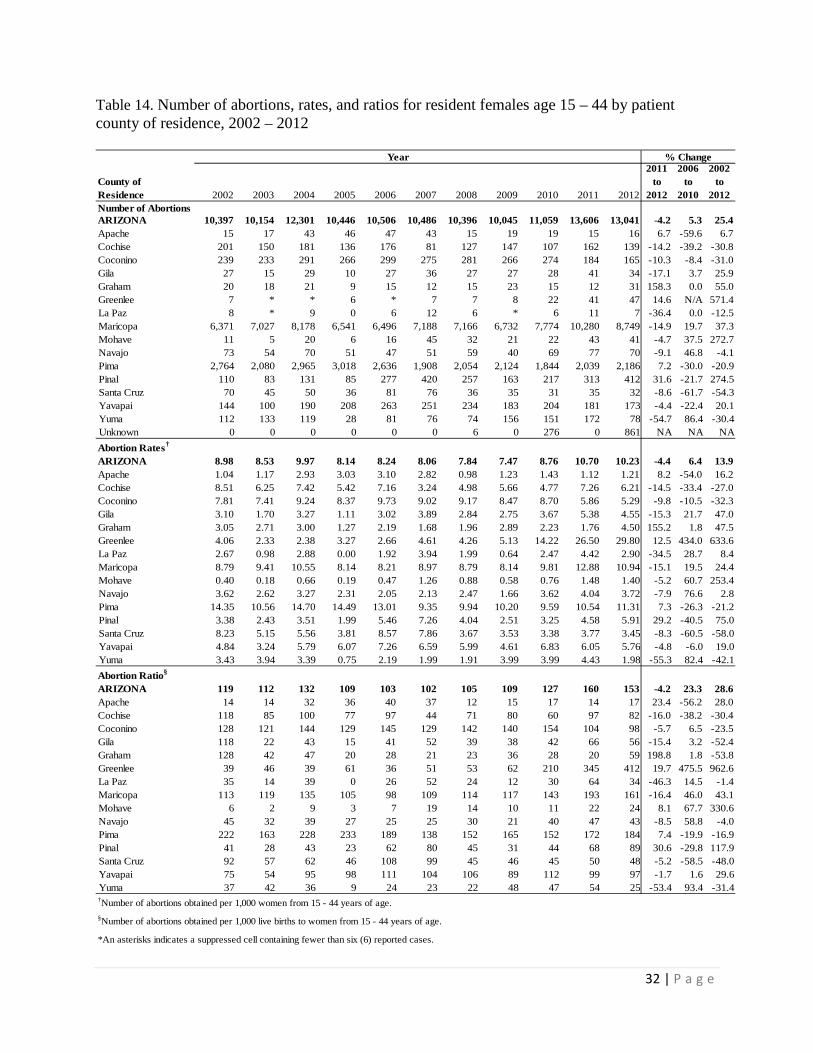
Table 14 displays the trends in abortions, rates, ratios, and percent change by county of residence for 2002 – 2012. During 2002 – 2012, the number of abortions increased in 8 counties (Apache, Gila, Graham, Greenlee, Maricopa, Mohave, Pinal, Yavapai) and decreased in the remaining seven (Cochise, Coconino, La Paz, Navajo, Pima, Santa Cruz, Yuma). The percent change in the number of abortions in Arizona during 2002 – 2012 was 25.4 percent. During 2002 – 2012, Greenlee (571%), Pinal (275%), and Mohave (273%) counties had the highest percent change in the number of abortions. The high percentage changes in Mohave and Greenlee counties may be due to the small number of cases (possibly under-reported in previous years). Santa Cruz (-54%), Coconino (-31%), Cochise (-30.8%), and Yuma (-30.4%) saw a decline in the number of abortions during this time period. The same pattern was true for the abortion rates and ratios in counties showing an increased percent change. There were several differences in the pattern for abortion ratios for counties showing a percentage decrease (this may be attributable to the differences in the numbers of births per 1,000 women per county and/or the number of women of childbearing age, 15 – 44 years, per county).
32 | P a g e
Table 14. Number of abortions, rates, and ratios for resident females age 15 – 44 by patient county of residence, 2002 – 2012
2002 2003 2004 2005 2006 2007 2008 2009 2010 2011 2012
2011 to
2012
2006 to
2010
2002 to
2012Number of Abortions ARIZONA 10,397 10,154 12,301 10,446 10,506 10,486 10,396 10,045 11,059 13,606 13,041 -4.2 5.3 25.4Apache 15 17 43 46 47 43 15 19 19 15 16 6.7 -59.6 6.7Cochise 201 150 181 136 176 81 127 147 107 162 139 -14.2 -39.2 -30.8Coconino 239 233 291 266 299 275 281 266 274 184 165 -10.3 -8.4 -31.0Gila 27 15 29 10 27 36 27 27 28 41 34 -17.1 3.7 25.9Graham 20 18 21 9 15 12 15 23 15 12 31 158.3 0.0 55.0Greenlee 7 * * 6 * 7 7 8 22 41 47 14.6 N/A 571.4La Paz 8 * 9 0 6 12 6 * 6 11 7 -36.4 0.0 -12.5Maricopa 6,371 7,027 8,178 6,541 6,496 7,188 7,166 6,732 7,774 10,280 8,749 -14.9 19.7 37.3Mohave 11 5 20 6 16 45 32 21 22 43 41 -4.7 37.5 272.7Navajo 73 54 70 51 47 51 59 40 69 77 70 -9.1 46.8 -4.1Pima 2,764 2,080 2,965 3,018 2,636 1,908 2,054 2,124 1,844 2,039 2,186 7.2 -30.0 -20.9Pinal 110 83 131 85 277 420 257 163 217 313 412 31.6 -21.7 274.5Santa Cruz 70 45 50 36 81 76 36 35 31 35 32 -8.6 -61.7 -54.3Yavapai 144 100 190 208 263 251 234 183 204 181 173 -4.4 -22.4 20.1Yuma 112 133 119 28 81 76 74 156 151 172 78 -54.7 86.4 -30.4Unknown 0 0 0 0 0 0 6 0 276 0 861 NA NA NAAbortion Rates†
ARIZONA 8.98 8.53 9.97 8.14 8.24 8.06 7.84 7.47 8.76 10.70 10.23 -4.4 6.4 13.9Apache 1.04 1.17 2.93 3.03 3.10 2.82 0.98 1.23 1.43 1.12 1.21 8.2 -54.0 16.2Cochise 8.51 6.25 7.42 5.42 7.16 3.24 4.98 5.66 4.77 7.26 6.21 -14.5 -33.4 -27.0Coconino 7.81 7.41 9.24 8.37 9.73 9.02 9.17 8.47 8.70 5.86 5.29 -9.8 -10.5 -32.3Gila 3.10 1.70 3.27 1.11 3.02 3.89 2.84 2.75 3.67 5.38 4.55 -15.3 21.7 47.0Graham 3.05 2.71 3.00 1.27 2.19 1.68 1.96 2.89 2.23 1.76 4.50 155.2 1.8 47.5Greenlee 4.06 2.33 2.38 3.27 2.66 4.61 4.26 5.13 14.22 26.50 29.80 12.5 434.0 633.6La Paz 2.67 0.98 2.88 0.00 1.92 3.94 1.99 0.64 2.47 4.42 2.90 -34.5 28.7 8.4Maricopa 8.79 9.41 10.55 8.14 8.21 8.97 8.79 8.14 9.81 12.88 10.94 -15.1 19.5 24.4Mohave 0.40 0.18 0.66 0.19 0.47 1.26 0.88 0.58 0.76 1.48 1.40 -5.2 60.7 253.4Navajo 3.62 2.62 3.27 2.31 2.05 2.13 2.47 1.66 3.62 4.04 3.72 -7.9 76.6 2.8Pima 14.35 10.56 14.70 14.49 13.01 9.35 9.94 10.20 9.59 10.54 11.31 7.3 -26.3 -21.2Pinal 3.38 2.43 3.51 1.99 5.46 7.26 4.04 2.51 3.25 4.58 5.91 29.2 -40.5 75.0Santa Cruz 8.23 5.15 5.56 3.81 8.57 7.86 3.67 3.53 3.38 3.77 3.45 -8.3 -60.5 -58.0Yavapai 4.84 3.24 5.79 6.07 7.26 6.59 5.99 4.61 6.83 6.05 5.76 -4.8 -6.0 19.0Yuma 3.43 3.94 3.39 0.75 2.19 1.99 1.91 3.99 3.99 4.43 1.98 -55.3 82.4 -42.1Abortion Ratio§
ARIZONA 119 112 132 109 103 102 105 109 127 160 153 -4.2 23.3 28.6Apache 14 14 32 36 40 37 12 15 17 14 17 23.4 -56.2 28.0Cochise 118 85 100 77 97 44 71 80 60 97 82 -16.0 -38.2 -30.4Coconino 128 121 144 129 145 129 142 140 154 104 98 -5.7 6.5 -23.5Gila 118 22 43 15 41 52 39 38 42 66 56 -15.4 3.2 -52.4Graham 128 42 47 20 28 21 23 36 28 20 59 198.8 1.8 -53.8Greenlee 39 46 39 61 36 51 53 62 210 345 412 19.7 475.5 962.6La Paz 35 14 39 0 26 52 24 12 30 64 34 -46.3 14.5 -1.4Maricopa 113 119 135 105 98 109 114 117 143 193 161 -16.4 46.0 43.1Mohave 6 2 9 3 7 19 14 10 11 22 24 8.1 67.7 330.6Navajo 45 32 39 27 25 25 30 21 40 47 43 -8.5 58.8 -4.0Pima 222 163 228 233 189 138 152 165 152 172 184 7.4 -19.9 -16.9Pinal 41 28 43 23 62 80 45 31 44 68 89 30.6 -29.8 117.9Santa Cruz 92 57 62 46 108 99 45 46 45 50 48 -5.2 -58.5 -48.0Yavapai 75 54 95 98 111 104 106 89 112 99 97 -1.7 1.6 29.6Yuma 37 42 36 9 24 23 22 48 47 54 25 -53.4 93.4 -31.4
*An asterisks indicates a suppressed cell containing fewer than six (6) reported cases.
County of Residence
Year % Change
†Number of abortions obtained per 1,000 women from 15 - 44 years of age. §Number of abortions obtained per 1,000 live births to women from 15 - 44 years of age.
33 | P a g e
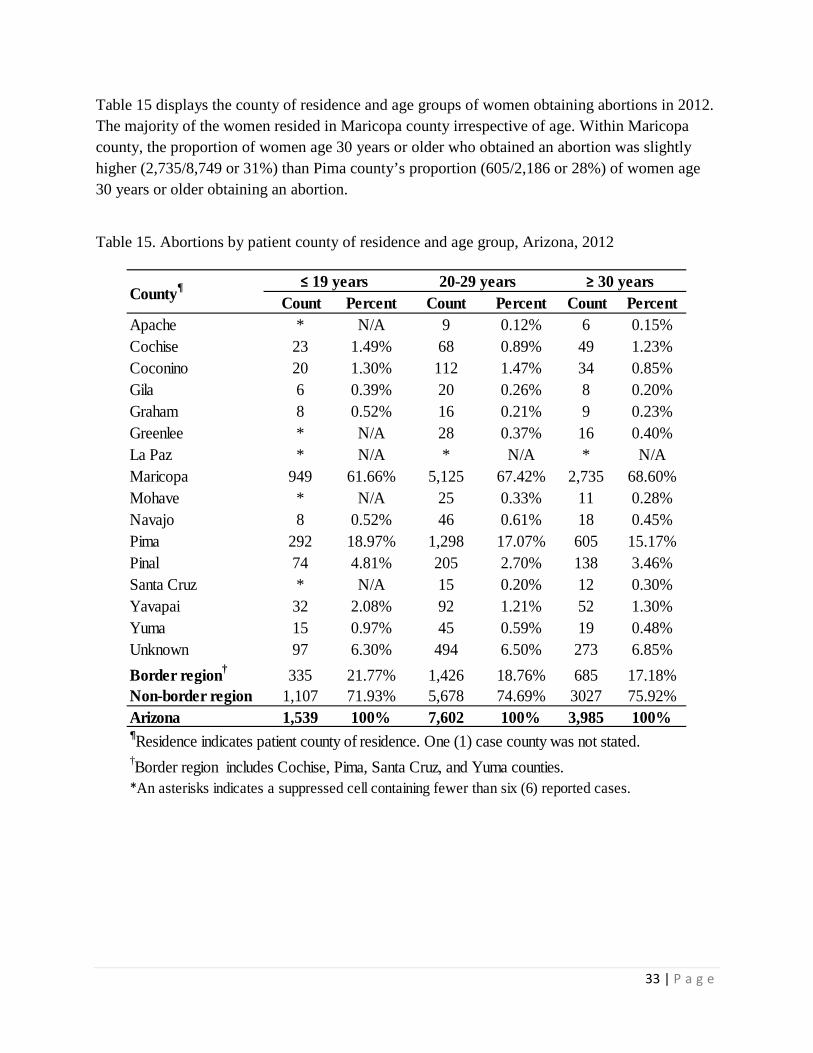
Table 15 displays the county of residence and age groups of women obtaining abortions in 2012. The majority of the women resided in Maricopa county irrespective of age. Within Maricopa county, the proportion of women age 30 years or older who obtained an abortion was slightly higher (2,735/8,749 or 31%) than Pima county’s proportion (605/2,186 or 28%) of women age 30 years or older obtaining an abortion.
Table 15. Abortions by patient county of residence and age group, Arizona, 2012
Count Percent Count Percent Count PercentApache * N/A 9 0.12% 6 0.15%Cochise 23 1.49% 68 0.89% 49 1.23%Coconino 20 1.30% 112 1.47% 34 0.85%Gila 6 0.39% 20 0.26% 8 0.20%Graham 8 0.52% 16 0.21% 9 0.23%Greenlee * N/A 28 0.37% 16 0.40%La Paz * N/A * N/A * N/AMaricopa 949 61.66% 5,125 67.42% 2,735 68.60%Mohave * N/A 25 0.33% 11 0.28%Navajo 8 0.52% 46 0.61% 18 0.45%Pima 292 18.97% 1,298 17.07% 605 15.17%Pinal 74 4.81% 205 2.70% 138 3.46%Santa Cruz * N/A 15 0.20% 12 0.30%Yavapai 32 2.08% 92 1.21% 52 1.30%Yuma 15 0.97% 45 0.59% 19 0.48%Unknown 97 6.30% 494 6.50% 273 6.85%Border region† 335 21.77% 1,426 18.76% 685 17.18%Non-border region 1,107 71.93% 5,678 74.69% 3027 75.92%Arizona 1,539 100% 7,602 100% 3,985 100%¶Residence indicates patient county of residence. One (1) case county was not stated.†Border region includes Cochise, Pima, Santa Cruz, and Yuma counties. *An asterisks indicates a suppressed cell containing fewer than six (6) reported cases.
County¶ ≤ 19 years 20-29 years ≥ 30 years
34 | P a g e
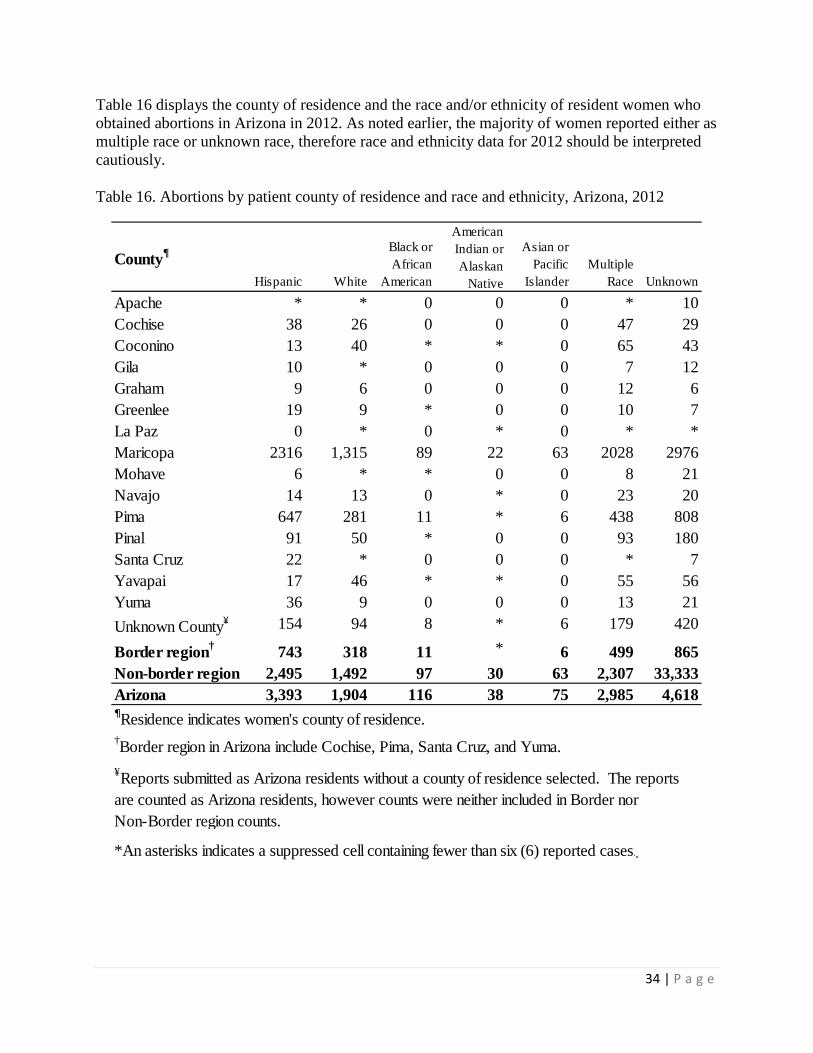
Table 16 displays the county of residence and the race and/or ethnicity of resident women who obtained abortions in Arizona in 2012. As noted earlier, the majority of women reported either as multiple race or unknown race, therefore race and ethnicity data for 2012 should be interpreted cautiously.
Table 16. Abortions by patient county of residence and race and ethnicity, Arizona, 2012
County¶
Hispanic White
Black or African
American
American Indian or Alaskan
Native
Asian or Pacific
IslanderMultiple
Race Unknown
Apache * * 0 0 0 * 10Cochise 38 26 0 0 0 47 29Coconino 13 40 * * 0 65 43Gila 10 * 0 0 0 7 12Graham 9 6 0 0 0 12 6Greenlee 19 9 * 0 0 10 7La Paz 0 * 0 * 0 * *Maricopa 2316 1,315 89 22 63 2028 2976Mohave 6 * * 0 0 8 21Navajo 14 13 0 * 0 23 20Pima 647 281 11 * 6 438 808Pinal 91 50 * 0 0 93 180Santa Cruz 22 * 0 0 0 * 7Yavapai 17 46 * * 0 55 56Yuma 36 9 0 0 0 13 21Unknown County¥ 154 94 8 * 6 179 420
Border region† 743 318 11 * 6 499 865Non-border region 2,495 1,492 97 30 63 2,307 33,333Arizona 3,393 1,904 116 38 75 2,985 4,618
*An asterisks indicates a suppressed cell containing fewer than six (6) reported cases.
¶Residence indicates women's county of residence. †Border region in Arizona include Cochise, Pima, Santa Cruz, and Yuma. ¥Reports submitted as Arizona residents without a county of residence selected. The reports are counted as Arizona residents, however counts were neither included in Border nor Non-Border region counts.
.
35 | P a g e
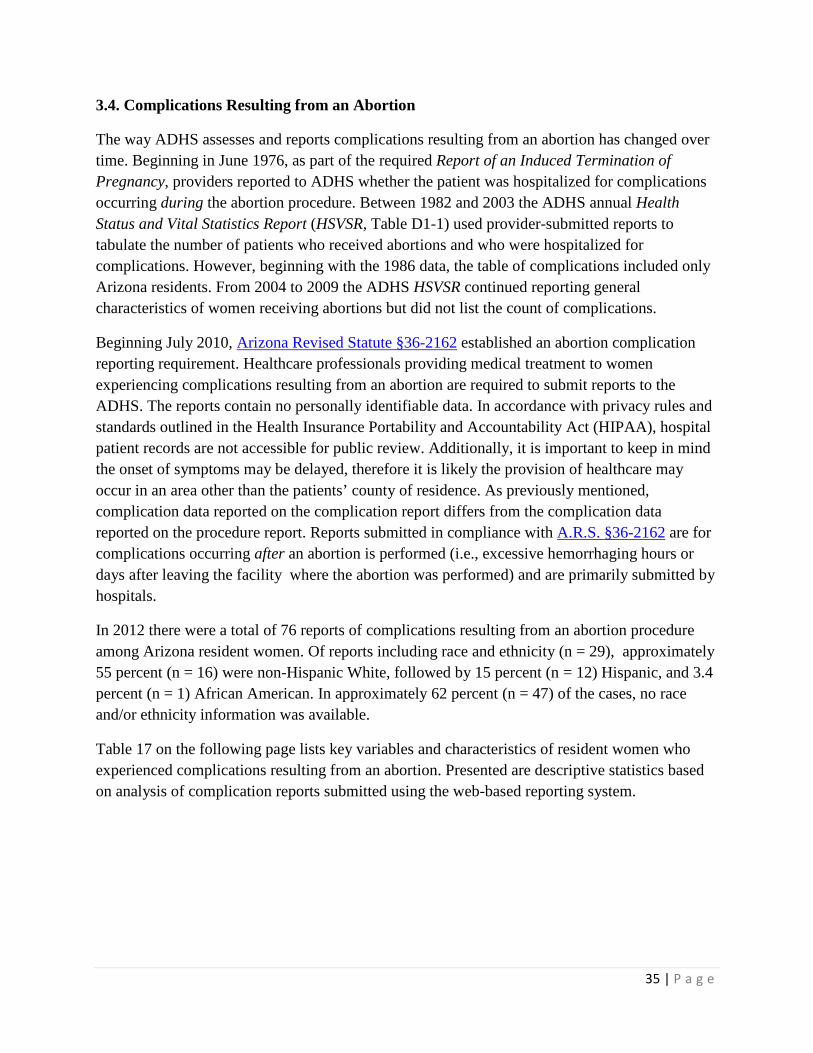
3.4. Complications Resulting from an Abortion
The way ADHS assesses and reports complications resulting from an abortion has changed over time. Beginning in June 1976, as part of the required Report of an Induced Termination of Pregnancy, providers reported to ADHS whether the patient was hospitalized for complications occurring during the abortion procedure. Between 1982 and 2003 the ADHS annual Health Status and Vital Statistics Report (HSVSR, Table D1-1) used provider-submitted reports to tabulate the number of patients who received abortions and who were hospitalized for complications. However, beginning with the 1986 data, the table of complications included only Arizona residents. From 2004 to 2009 the ADHS HSVSR continued reporting general characteristics of women receiving abortions but did not list the count of complications.
Beginning July 2010, Arizona Revised Statute §36-2162 established an abortion complication reporting requirement. Healthcare professionals providing medical treatment to women experiencing complications resulting from an abortion are required to submit reports to the ADHS. The reports contain no personally identifiable data. In accordance with privacy rules and standards outlined in the Health Insurance Portability and Accountability Act (HIPAA), hospital patient records are not accessible for public review. Additionally, it is important to keep in mind the onset of symptoms may be delayed, therefore it is likely the provision of healthcare may occur in an area other than the patients’ county of residence. As previously mentioned, complication data reported on the complication report differs from the complication data reported on the procedure report. Reports submitted in compliance with A.R.S. §36-2162 are for complications occurring after an abortion is performed (i.e., excessive hemorrhaging hours or days after leaving the facility where the abortion was performed) and are primarily submitted by hospitals.
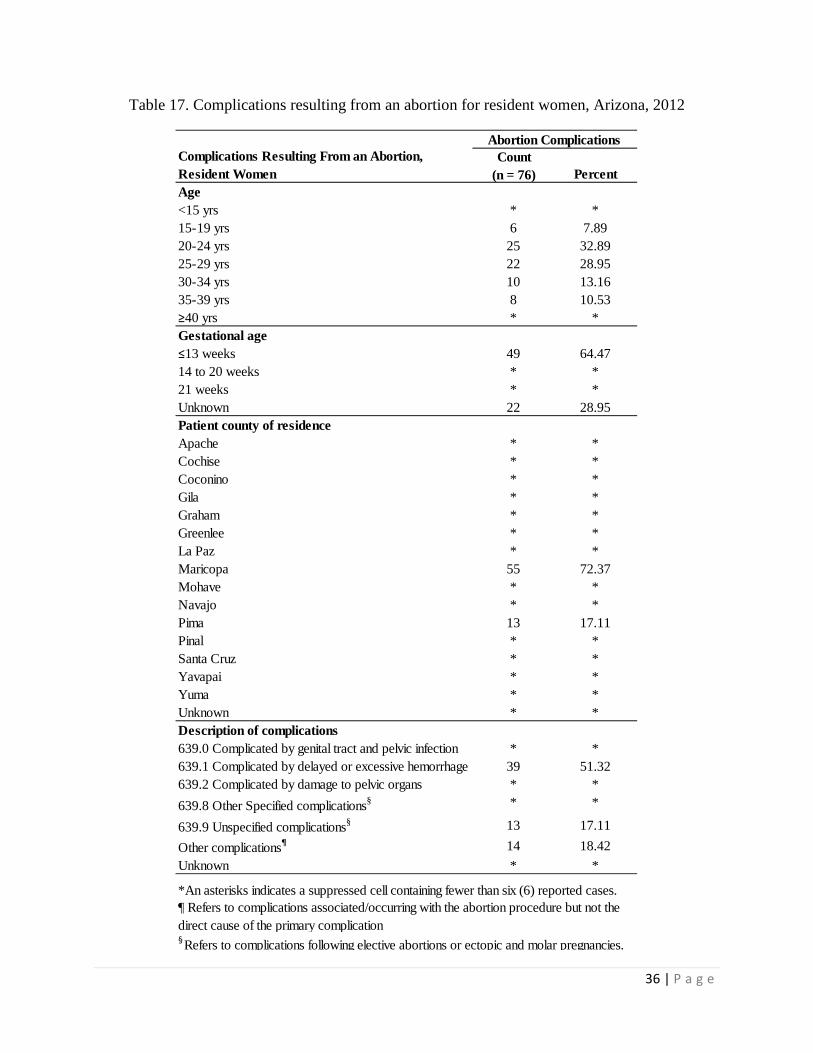
In 2012 there were a total of 76 reports of complications resulting from an abortion procedure among Arizona resident women. Of reports including race and ethnicity (n = 29), approximately 55 percent (n = 16) were non-Hispanic White, followed by 15 percent (n = 12) Hispanic, and 3.4 percent (n = 1) African American. In approximately 62 percent (n = 47) of the cases, no race and/or ethnicity information was available.
Table 17 on the following page lists key variables and characteristics of resident women who experienced complications resulting from an abortion. Presented are descriptive statistics based on analysis of complication reports submitted using the web-based reporting system.
36 | P a g e
Table 17. Complications resulting from an abortion for resident women, Arizona, 2012
Count (n = 76) Percent
Age <15 yrs * *15-19 yrs 6 7.8920-24 yrs 25 32.8925-29 yrs 22 28.9530-34 yrs 10 13.1635-39 yrs 8 10.53≥40 yrs * *Gestational age ≤13 weeks 49 64.4714 to 20 weeks * *21 weeks * *Unknown 22 28.95Patient county of residenceApache * *Cochise * *Coconino * *Gila * *Graham * *Greenlee * *La Paz * *Maricopa 55 72.37Mohave * *Navajo * *Pima 13 17.11Pinal * *Santa Cruz * *Yavapai * *Yuma * *Unknown * *Description of complications639.0 Complicated by genital tract and pelvic infection * *639.1 Complicated by delayed or excessive hemorrhage 39 51.32639.2 Complicated by damage to pelvic organs * *639.8 Other Specified complications§ * *
639.9 Unspecified complications§ 13 17.11Other complications¶ 14 18.42Unknown * *
Complications Resulting From an Abortion, Resident Women
Abortion Complications
*An asterisks indicates a suppressed cell containing fewer than six (6) reported cases. ¶ Refers to complications associated/occurring with the abortion procedure but not the direct cause of the primary complication§ Refers to complications following elective abortions or ectopic and molar pregnancies.
37 | P a g e
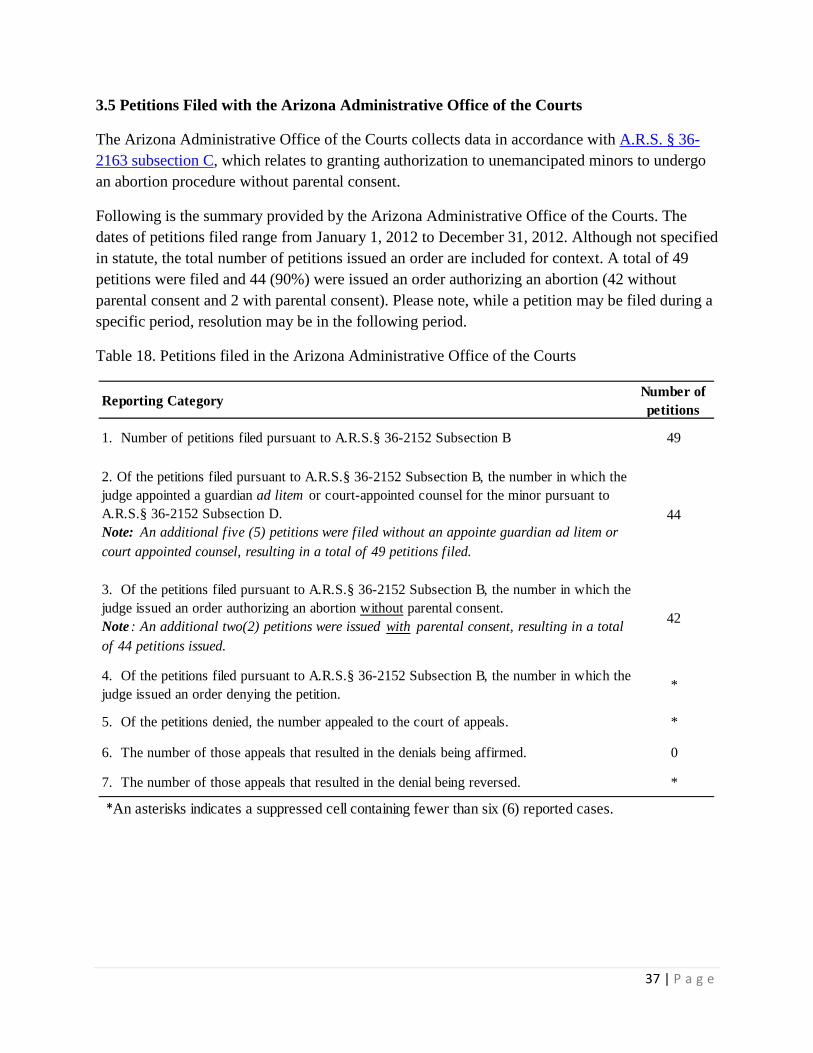
3.5 Petitions Filed with the Arizona Administrative Office of the Courts
The Arizona Administrative Office of the Courts collects data in accordance with A.R.S. § 36-2163 subsection C, which relates to granting authorization to unemancipated minors to undergo an abortion procedure without parental consent.
Following is the summary provided by the Arizona Administrative Office of the Courts. The dates of petitions filed range from January 1, 2012 to December 31, 2012. Although not specified in statute, the total number of petitions issued an order are included for context. A total of 49 petitions were filed and 44 (90%) were issued an order authorizing an abortion (42 without parental consent and 2 with parental consent). Please note, while a petition may be filed during a specific period, resolution may be in the following period.
Table 18. Petitions filed in the Arizona Administrative Office of the Courts
Reporting Category Number of petitions
1. Number of petitions filed pursuant to A.R.S.§ 36-2152 Subsection B 49
2. Of the petitions filed pursuant to A.R.S.§ 36-2152 Subsection B, the number in which the judge appointed a guardian ad litem or court-appointed counsel for the minor pursuant to A.R.S.§ 36-2152 Subsection D. Note: An additional five (5) petitions were filed without an appointe guardian ad litem or court appointed counsel, resulting in a total of 49 petitions filed.
44
3. Of the petitions filed pursuant to A.R.S.§ 36-2152 Subsection B, the number in which the judge issued an order authorizing an abortion without parental consent. Note : An additional two(2) petitions were issued with parental consent, resulting in a total of 44 petitions issued.
42
4. Of the petitions filed pursuant to A.R.S.§ 36-2152 Subsection B, the number in which the judge issued an order denying the petition. *
5. Of the petitions denied, the number appealed to the court of appeals. *
6. The number of those appeals that resulted in the denials being affirmed. 0
7. The number of those appeals that resulted in the denial being reversed. *
*An asterisks indicates a suppressed cell containing fewer than six (6) reported cases.
38 | P a g e
Conclusion This 2012 Abortion Report provides a comprehensive overview of abortion in the State of Arizona following the passage of SB1304. In addition to presenting comprehensive statistics regarding incidence and prevalence of abortion in Arizona, the report also highlights the importance of continued public health prevention messaging regarding unintended pregnancies and the risks associated with abortion among women of child-bearing age, especially in the adolescent teen population. The implementation of A.R.S. §36-2161 thru §36-2163 provides a standardized data collection system that improves data quality. Enhancments to the web-based reporting system and provider training are ongoing, providing an accurate public reporting system that allows individual providers to report abortions online through a secured web-based system. Analysis of abortion data has numerous public health implications. Ongoing abortion surveillance facilitates efforts to decrease and/or prevent unintended pregnancies. This report provides a comprehensive overview of statistics about the incidence of abortion in Arizona, however it is limited to descriptive data analysis. No attempt was made to formulate inferences regarding the general population or sub-populations of women obtaining abortions in Arizona. Because of differences in abortion data collection across time, trend comparisons should be interpreted with care because of variation in provider reporting prior to 2010 and expanded reporting requirements that went into effect July 2010. There are no data available to assess the extent of underreporting of incidences. The ADHS’ mission “To promote, protect, and improve the health and wellness of individuals and communities in Arizona” includes abortion surveillance as one of the critically reported Vital Statistics. The Arizona Department of Health Services is committed to improving the health and wellness of all Arizonans. This comprehensive annual abortion report is respectfully compiled and submitted for public review in accordance with Arizona Revised Statute §36-2163 Subsection B.
39 | P a g e
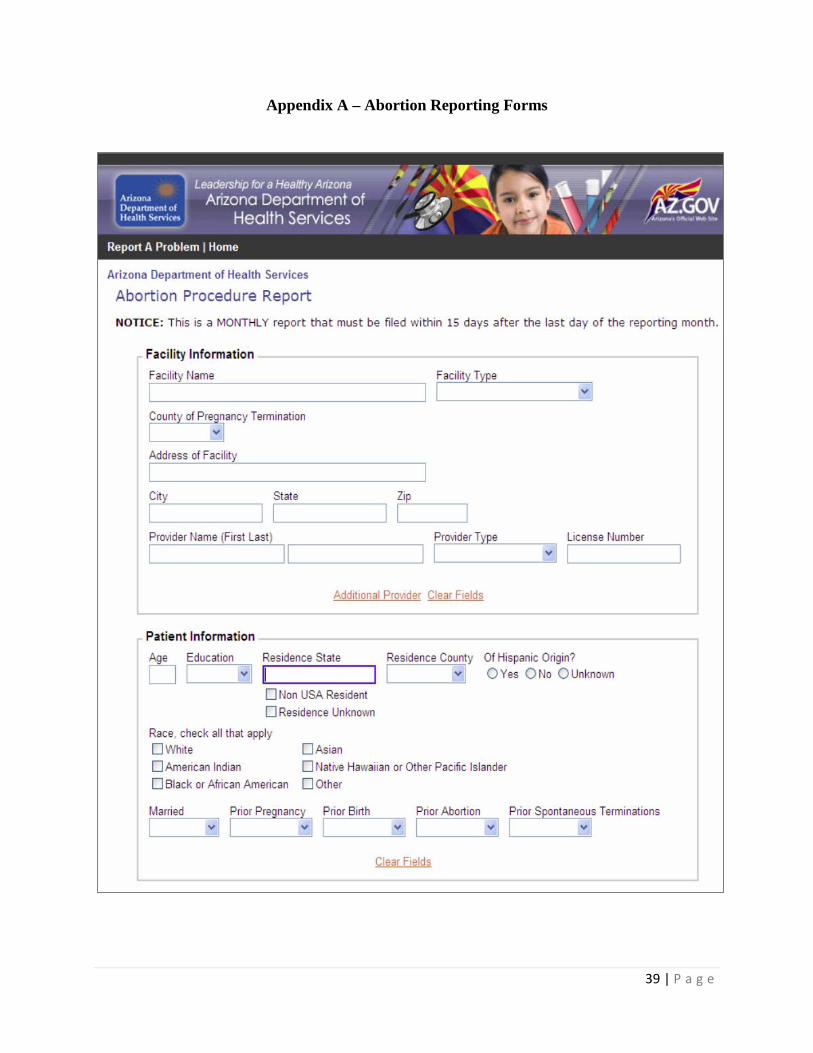
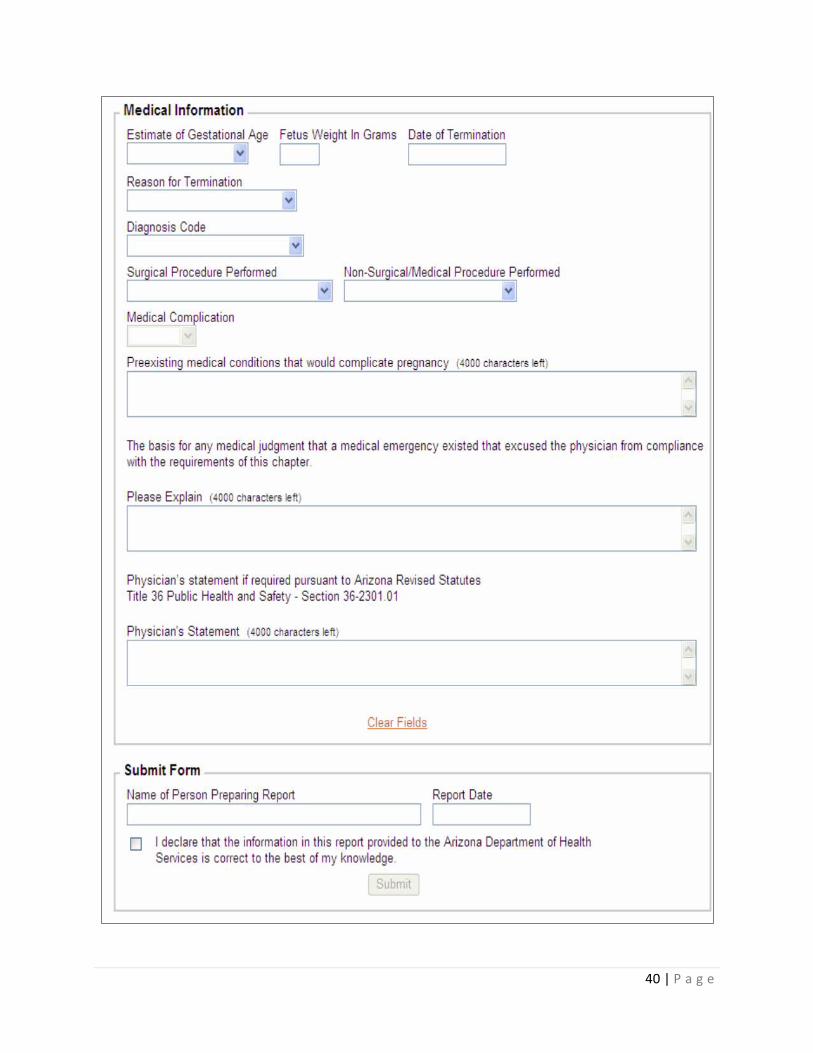
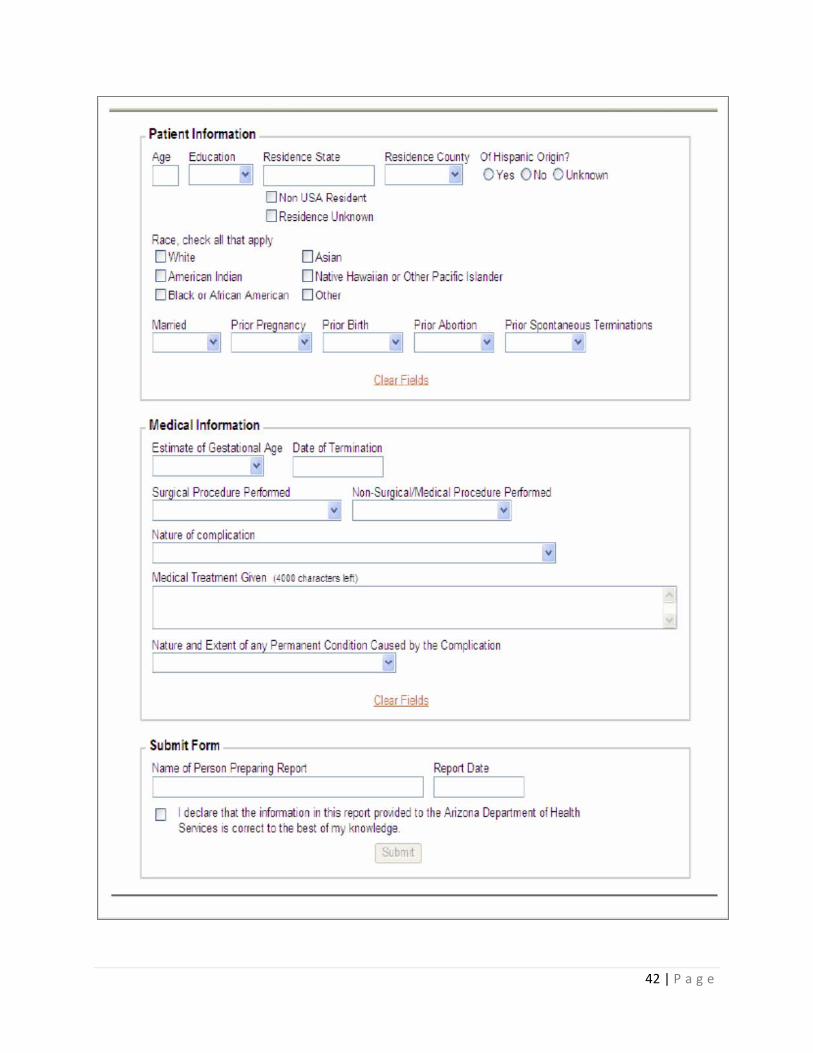
Appendix A – Abortion Reporting Forms
40 | P a g e

41 | P a g e
42 | P a g e
43 | P a g e
Appendix B- Glossary
Abortion or induced termination of pregnancy (ITOP) – Abortion means the use of any means to terminate the clinically diagnosable pregnancy of a woman with knowledge that the termination by those means will cause, with reasonable likelihood, the death of the unborn child. Abortion does not include birth control devices, oral contraceptives used to inhibit or prevent ovulation, conception or the implantation of a fertilized ovum in the uterus or the use of any means to save the life or preserve the health of the unborn child, to preserve the life or health of the child after a live birth, to terminate an ectopic pregnancy, or to remove a dead fetus (A.R.S. 36-2151).
Abortion rate – The number of abortions per 1,000 women aged 15 – 44 years or other specific group within a given population.
Abortion ratio – The number of abortions per 1,000 live births within a given population. The ratio reflects the relative number of pregnancies in a population that end in abortion compared to live birth.
Birth or live birth – The complete expulsion or extraction from its mother of a product of human conception, irrespective of the duration of pregnancy which, after such expulsion or extraction, breathes or shows any other evidence of life such as beating of the heart, pulsation of the umbilical cord or definite movement of voluntary muscles, whether or not the umbilical cord has been cut or the placenta is attached. Heartbeats are to be distinguished from transient cardiac contractions; respirations are to be distinguished from fleeting respiratory efforts or gasps.
Epidemiology - Epidemiology is the study of the distribution and determinants of disease, injury, and other health outcomes in human populations.
Gestational age – Gestational age means the age of the unborn child as calculated from the first day of the last menstrual period of the pregnant woman.
Pregnancies – Pregnancies are the sum of live births, spontaneous terminations of pregnancy (fetal deaths or stillbirths), and induced terminations of pregnancy (abortions).
Proportion – A proportion is a ratio in which those in the numerator are also in the denominator. Rate – A rate is a ratio in which those in the numerator are also in the denominator, and those in the denominator are "at risk" of being in the numerator. The denominator is the sum of "at risk" person-time or, by convention, the count of individuals "at risk" in a given time period. Ratio – A ratio is any division of one number by another; the numerator and denominator do not have to be mutually exclusive.

44 | P a g e
Unemancipated minor – Unemancipated minor means a minor who is subject to the control, authority, and supervision of his or her parents or guardians, as determined under State law (See Title 42. The Public Health and Welfare; Chapter 6a USCS §300z-1).
45 | P a g e
End notes 1. Extracted from Centers for Disease Control and Prevention. Abortion Surveillance — United States, 2009. MMWR 2012;61(8):1-46. Digital version available at http://www.cdc.gov/mmwr/preview/mmwrhtml/ss6108a1.htm?s_cid=ss6108a1_w 2. SB1304 State of Arizona Senate Forty-Ninth Legislature Second Regular Session 2010. http://www.azleg.gov/legtext/49leg/2r/bills/sb1304p.pdf 3. Revisions to the Standards for the Classification of Federal Data on Race and Ethnicity: Federal Register Notice. Retrieved from http://www.whitehouse.gov/omb/fedreg_1997standards/ accessed on July 16, 2012.
4. Abortion rate is essentially denoted as number of abortions per 1,000 women. Race specific abortion rates are obtained by estimating the number of abortions (numerator) by women in a given racial group per 1,000 women in that same racial group.
5. United States-México Border Health Commission. Border Region. Available at http://www.borderhealth.org/border_region.php. Website. Accessed on July 16, 2012.
6. Ancel Pierre-Yevel et al., History of induced abortion as a risk factor for preterm birth in European countries: results of the EUROPOP survey. Human Reproduction, 2004, 19(3):734-740.
7. Shah P, Zao J. Induced termination of pregnancy and low birthweight and preterm birth: a systematic review and meta-analyses. BJOG 2009;116:1425–1442.
8. Bartlett LA et al., Risk factors for legal induced abortion-related mortality in the United States, Obstetrics & Gynecology, 2004, 103(4):729–737.


![WELCOME! [azdhs.gov]](https://img.pdfslide.us/doc/110x75/61fa7a0a8f28e75abb7c8d4b/welcome-azdhsgov.jpg)