Embed Size (px)
Citation preview
“Experts in Elections Redistricting & GIS”
FOR IMMEDIATE RELEASE Date: December19, 2018
Contact: Kimball W. Brace Tel.: (202) 789–2004 or (703) 580-7267
Email: [email protected] Website: www.electiondataservices.com
Arizona Gains Rhode Island’s Seat With New 2018 Census Estimates; But Greater Change Likely by 2020
New Census Bureau population estimates for 2018 released today shows a change of one more seat between two states from last year’s study generated by Election Data Services, Inc. on which states would gain or lose congressional seats if the current numbers were used for appor-tionment in 2018. But projecting these numbers to 2020, using several different methods, leads to more states being impacted by the decennial census scheduled to take place in just two years. These numbers will also be impacted by financial considerations being debated in the states, as well as in Congress as Commerce Department and Census Bureau appropriations hang in the balance of the government “shut-down” debate this week.
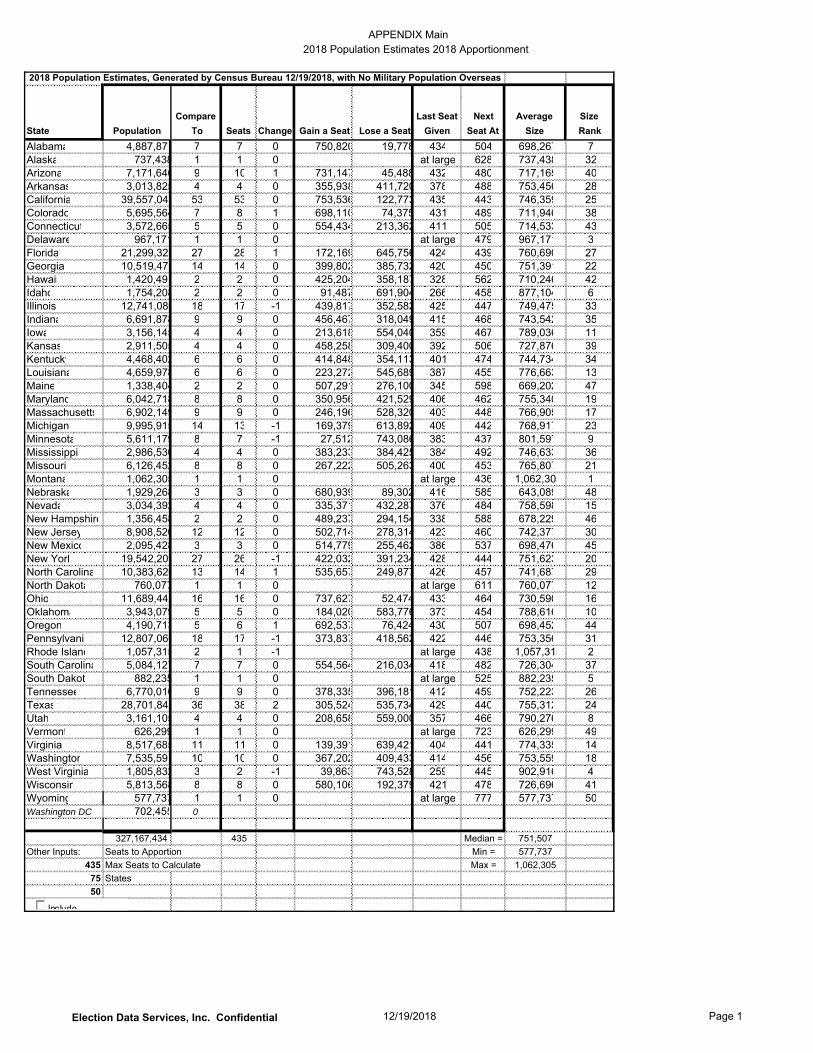
The Bureau’s 2018 total population estimates shows that now 13 states will be impacted by changes in their congressional delegation if these new numbers were used for apportionment to-day. The state of Arizona joins the previously indicated states of Colorado, Florida, North Carolina, and Oregon to each gain a single seat while the state of Texas is now shown to gain a second seat with the new data. The states of Rhode Island join the states of Illinois, Michigan, Minnesota, New York, Pennsylvania and West Virginia to lose a seat in Congress using the new data.
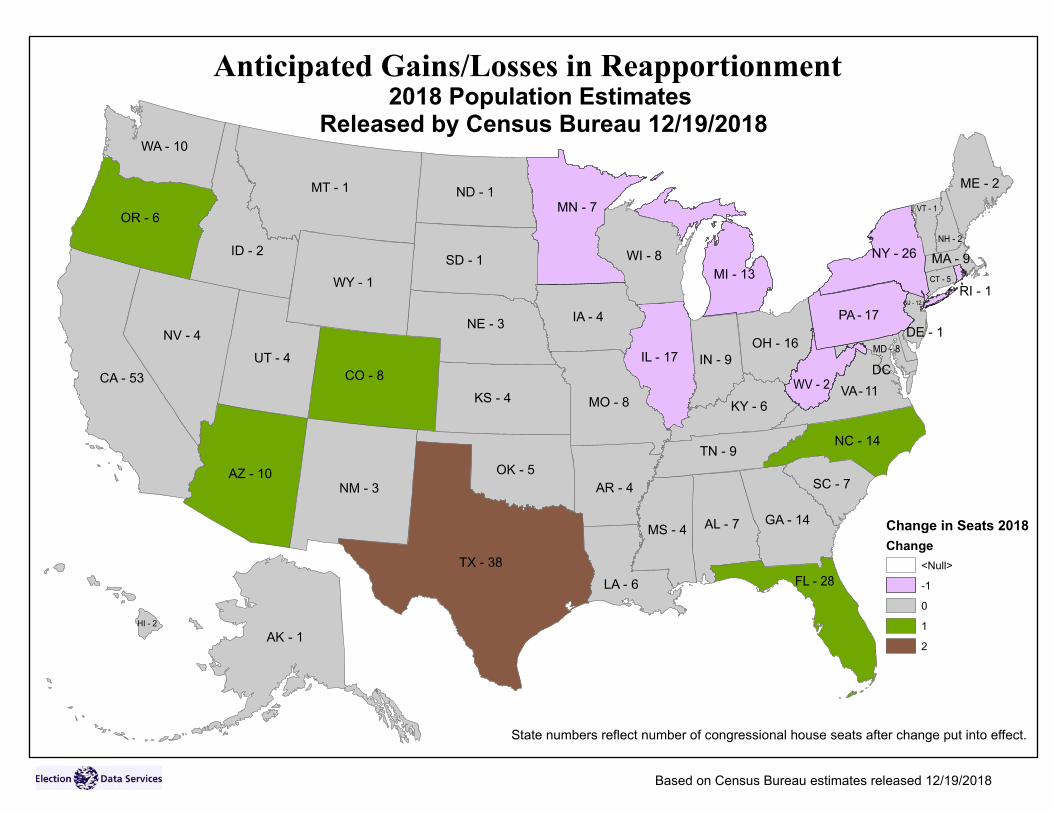
The new numbers, however, reflect subtle changes taking place across the nation in birth and death rates and resulting total population numbers that become magnified when the information is projected forward to coincide with the taking of the 2020 Census on April 1 that year. Elec-tion Data Services created a variety of different methodologies to project the 2018 data forward nearly two years to 2020 (several short-term projection methods for the trend occurring in 2017-2018, 2016-2018 and 2015-2018, a middle term methodology using the 2014-2018 trend, and a long-term projection for 2010-2018). The different methodologies benefit some states and dis-advantage others in the “musical-chairs” effort of allocating 435 seats to the 50 states. All the methods would add a seat to Montana, a second seat for Florida and a third seat for Texas, to the list of states noted above that will gain one or more seats by 2020. The list of losing states will expand to also include Alabama, Ohio, and a second seat from New York by the time the Census is taken in 2020.
6171 Emerywood Court Manassas, Virginia 20112
202 789.2004 tel. or 703 580.7267 703 580.6258 fax [email protected]
Election Data Services, “2018 Reapportionment Analysis” December 19, 2018 Page 2 of 5
The various methodologies diverge at several important points, however, that could impact a number of different states. For example, the various short-term projection methods would indi-cate that California will lose a congressional district in 2020, falling to seat position 436 by only 81,165 to 170,607 people, depending on the projection method used. This would be the first time that California has ever lost a seat in its nearly 160-year history. The mid- and long-term trend would have California keeping the seat (#435) by only 40,458 to 56,565 people to spare.
The short-term loss for California would result in Minnesota keeping their last seat (their 8th) by just 13,077 to 29,655 people to spare. Minnesota’s state demographer has indicated that re-cent influx of people to the state has boosted their numbers and it is likely to have had an impact on reapportionment.
The contentious nature of the apportionment process can be observed by the states right around the 435 cut-off mark first established in 1910. Our 2020 projections found Illinois gaining seat #435 (the last one to be handed out) by just 25,149 to 53,598 people to spare, depending on the projection methodology utilized, so that they would only lose a single seat in 2020. Earlier esti-mates pointed to Illinois possibly losing a second seat in 2020.
All the projection methods indicate New York will lose two congressional districts in 2020, but that second seat is actually very close to the margin, coming in at seat #436 or #437 depending on the projection model. The state missed keeping that seat by as close as 19,648 people.
Using any methodology, the population projections points toward a ten (10) seat change over 16 states across the nation by year 2020. States that will gain single seats include Arizona, Colora-do, Montana, North Carolina, and Oregon, while Florida is set to gain two congressional districts and Texas would gain three seats. Single seat losses will again occur in the Midwest and Northeast sections of the nation, where Alabama, Illinois, Michigan, New York, Ohio, Pennsylvania, Rhode Island and West Virginia, as well as possibly California and Minnesota would each lose a seat. All other states would keep the same number of representatives they were awarded in December 2010 when the official 2010 Census numbers were released.
Using the new sets of projected 2020 data, the apportionment calculations show that 15 to 16 states could gain or lose 8 to 10 districts by the time the Census is taken in 2020. The gainers and losers are:
States Gaining Districts (7) States Losing Districts (8 or 10)
Arizona +1 (from 9 to 10) Alabama -1 (from 7 to 6) Colorado +1 (from 7 to 8) California -1 or even (from 53 to 52 or no change) Florida +2 (from 27 to 29) Illinois -1 (from 18 to 17) Montana +1 (from At-large to 2) Michigan -1 (from 14 to 13) North Carolina +1 (from 13 to 14) Minnesota -1 or even (from 8 to 7 or no change) Oregon +1 (from 5 to 6) New York -2 (from 27 to 25) Texas +3 (from 36 to 39) Ohio -1 (from 16 to 15) Pennsylvania -1 (from 18 to 17)
Election Data Services, “2018 Reapportionment Analysis” December 19, 2018 Page 3 of 5
Rhode Island -1 (from 2 to 1) West Virginia -1 (from 3 to 2) The Census Bureau’s press release accompanying the December 19th, 2018 release of the popula-tion estimates notes that Nevada and Idaho are the nation’s fastest growing state in the past year, followed by Utah, Arizona, Florida and Washington. But this population growth has on-ly impacted the congressional allocation for Arizona and Florida. The 2018 numbers show Idaho would stay at two seats, and miss gaining an additional seat by as few as 91,487 people. But projecting the numbers forward to 2020 using one of the short-term methodologies shows Idaho as few as 18,559 people away from gaining a third seat. All of the population projection methodologies keep the state of Nevada at four seats and sufficiently away from any margins of a fifth possible seat. Utah is similar in that it would take more than 89,000 extra people for the state to gain a fifth district.
Since 1941, by law the number of seats in the U.S. House of Representatives has been capped at 435. As a result, there has always been interest in finding which states are close to that magic bubble, either just gaining their last seat, or just missing their next seat. The following table shows the results of the 2018 population estimates, as well as one of the short-term trend meth-odology calculations (2016-2018) for the seats within five positions of the 435 cut off.
2018 Reapportionment Analysis 2018 Population Estimates 2020 Projections
(using 2016-2018 short-term trend)Last Five Seats Margin of Gain 431 Colorado (8th) 74,375 432 Arizona (10th) 45,488 433 Ohio (16th) 52,474 434 Alabama(7th) 19,778 435 California (53rd) 122,773
Last Five Seats Margin of Gain 431 California (52rd) 762,731 432 Texas (39th) 420,300 433 Montana (2nd) 13,782 434 Minnesota (8th) 26,293 435 Illinois (17th) 45,184
Next Seats Margin of Loss 436 Montana (2nd) ? 437 Minnesota (8th) 27,512 438 Rhode Island (2nd) ? 439 Florida (29th) 172,169 440 Texas (39th) 305,524
Next Seats Margin of Loss 436 California (53rd) 143,827 437 New York (26th) 108,582 438 Ohio (16th) 93,419 439 Alabama (7th) 40,764 440 Idaho (3rd) 18,559
Kimball Brace, President of Election Data Services, Inc. cautioned users to take the projections as very preliminary and subject to change. “The change in administration, the lack of a Census Director, shortness of funds appropriated to the Bureau, and how well individual states conduct their own Complete Count campaigns could have a profound impact on how well the 2020 Cen-sus is conducted, and therefore the counts that are available for apportionment,” Brace noted. “Having worked with Census data and estimates since the 1970s, it is important to remember that major events like Katrina and the 2008 recession each changed population growth patterns and that impacted and changed the next apportionment,” he said.
Election Data Services, Inc. “2017 Reapportionment Analysis” December 26, 2017 Page 4 of 5 Brace also noted that major changes in the counting process are in the works for 2020 and that reduced budget funding could impact those plans. “History can also be a guide, recalling that the 1920 apportionment was cancelled because the numbers showed for the first time that more peo-ple resided in urban areas than rural areas” said Brace.
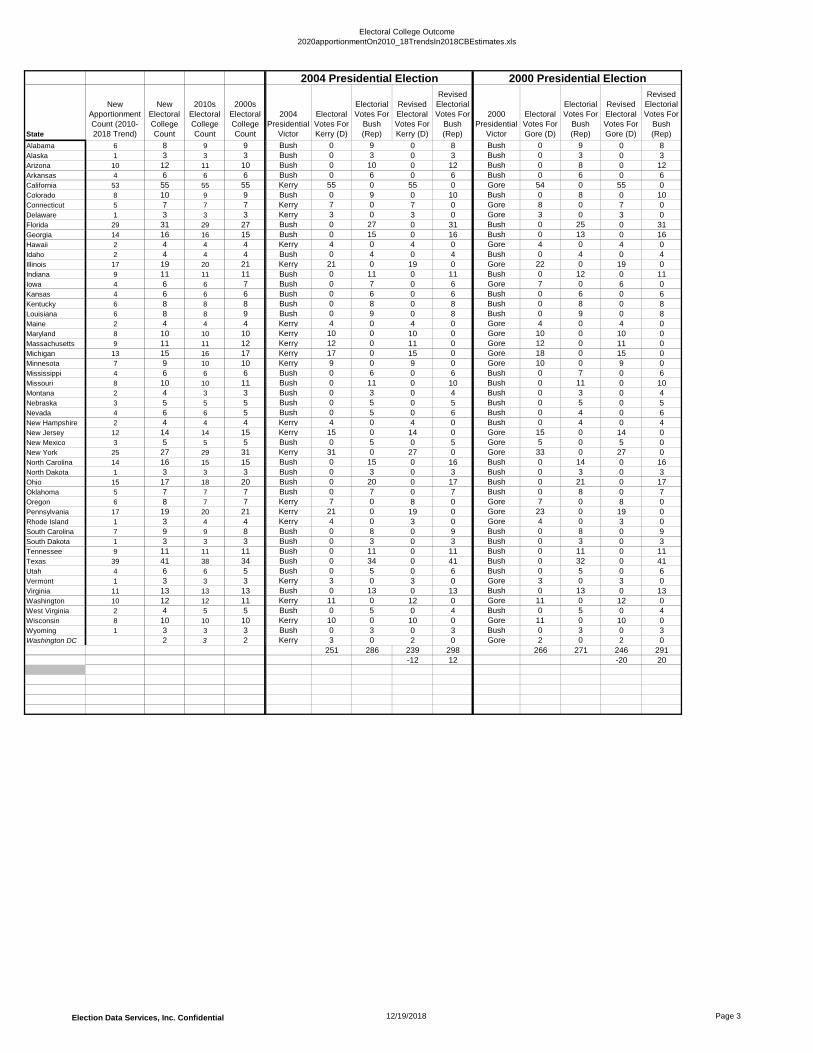
Because congressional apportionment also impacts the Electoral College and the vote for Presi-dent, Election Data Services took the 2020 projections for each state and applied the Presidential election results from the past five Presidential contests to determine the Electoral College out-comes in the past 16 years. The study shows that none of the presidential contests would have elected a different presidential candidate using the new apportionment counts but they would have been more Republican in nature. For example, in 2016 President Trump would have gained two additional electoral college votes under the new apportionment projections. In 2012 Presi-dent Obama would still have won the Electoral College, but with five less votes (327 vs 332) that he won at the time of the voting. The biggest change would have occurred in the 2000 presiden-tial election where George Bush would have gained an additional 20 electoral votes had the new 2020 apportionment projections determined the number of congressional seats in each state.
The 2016 Electoral College was muddled because 7 electors voted for a different candidate than what they had pledged based on the vote totals. As a result, the overall change in candidate votes based on the new apportionment numbers shows just two vote difference in the bottom line re-sults. President elect Trump’s ability to carry states that will be losing congressional seats in 2020 also contributed to a reversal of the pattern depicted in previous elections.
It should be noted that the 2020 Presidential election and resulting Electoral College will occur before the results of the 2020 Census are released by December 31, 2020. Therefore, the Elec-toral College results in 2020 will be governed by the state’s apportionment allocation as they exist today, having been first determined in 2011. The first time the new 2020 apportionment results will be utilized will be the 2024 Presidential election. Election Data Services, Inc. has also worked with the website 270ToWin, who has built an interactive map of the these new ap-portionment results where users can adjust state outcomes to discover Electoral College outcomes for the presidential elections back to 2000.
Major weather events have also affected apportionment. The Census Bureau’s estimated popula-tions released for 2005 showed Louisiana would keep all their congressional districts that decade. Even the Bureau’s own projections for 2010 released that same year showed Louisiana staying the same. Then hurricane Katrina hit Louisiana at the end of August 2005 (after the date of the population estimates). Devastation and population loss impacted New Orleans in a major way, and when the Bureau’s 2006 population estimates were released Louisiana was looking at losing a congressional seat. That was ultimately confirmed when the 2010 Census was taken, and state data was released at the end of that year.
As Election Data Services, Inc. noted last year in the 2017 study, the year of 2017 saw 18 hurri-canes and tropical storms, three of which had a potential of impact on population movements in the United States. Two of these storms: Irma (impacting Miami and the Florida Gulf Coast), and Maria (which devastated Puerto Rico)) affected Florida and the new population estimates reflect that fact. Last years study showed Florida was 366,735 people away from gaining a third seat.
Election Data Services, Inc. “2017 Reapportionment Analysis” December 26, 2017 Page 5 of 5 The 2018 shows the state is only 172,169 people away from a third additional seat, an improve-ment of nearly 200,000 people.
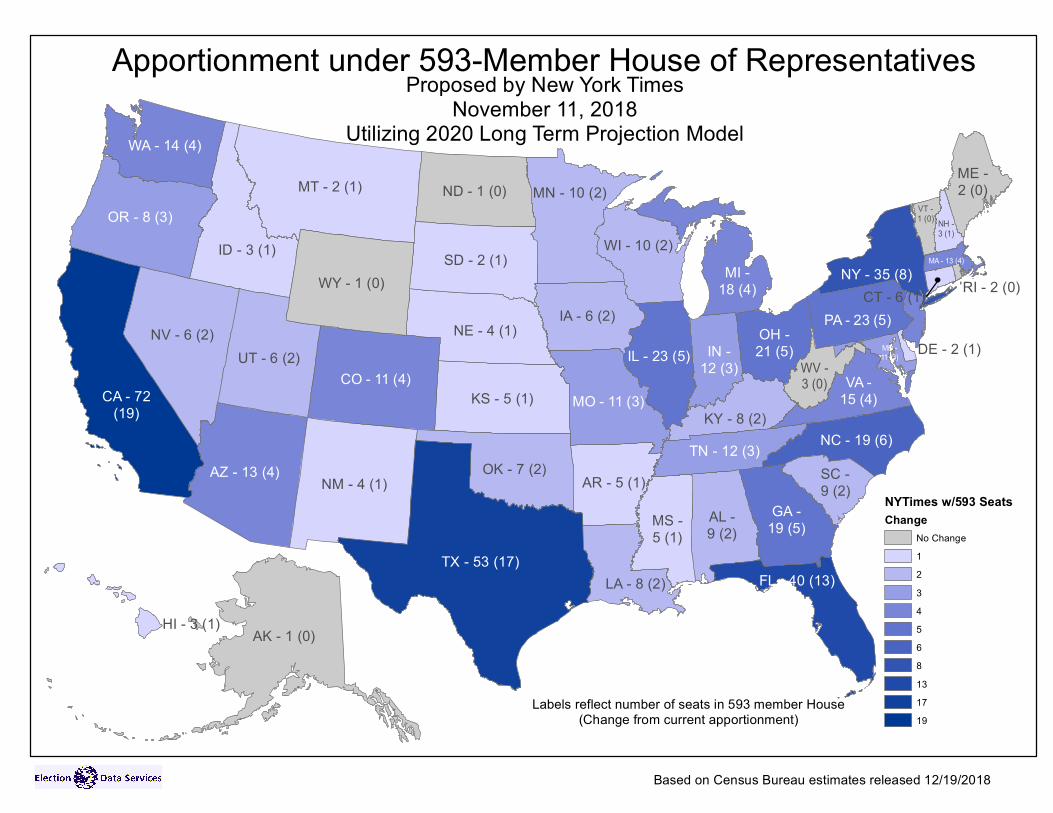
On November 11, 2018 the editorial writers at the New York Times suggested an increase in the size of the US House of Representatives to 593 members in order to bring down the size of each district. Election Data Services, Inc.’s apportionment calculator allows us to change the number of seats to be assigned, as well as allowing the District of Columbia to gain a Representative. Changing the number of seats in the House and running the apportionment program allows us to see how many seats would go to each state under that scenario. As expected, most states would see an increase in their representation in a 593-member House of Representatives. California would gain 19 seats, Florida an additional 13 seats, and Texas an additional 17 seats. All other states are single-digit seat increases and no state would lose any representatives from their cur-rent allocation. Only the states of Alaska, Maine, North Dakota, Rhode Island, Vermont, West Virginia and Wyoming would stay with the number of representatives they currently have in 2018. A table of these results are included in this packet.
The 2018 population estimates have not been statistically adjusted for any known undercount that may take place when the Census is conducted. In addition, no estimates were provided for U.S. military personnel overseas. This component has in the past been counted by the Census Bureau and allocated to the states. Overseas military personnel have been a factor in the appor-tionment formula for the past several decades, including the switching of the final district in 2000 that went from Utah to North Carolina. Observers are also awaiting the Census Bureau’s and/or Trump administration’s release of the “residency rules” that will dictate where college students, the military, and prisoners will be counted in the 2020 census, which in turn could im-pact the apportionment process.
Past apportionment studies by Election Data Services, Inc. can be found at https://www.electiondataservices.com/reapportionment-studies/. A historical chart on the num-ber of districts each state received each decade from 1789 to current is also available at this web address and linkable at https://www.electiondataservices.com/wp-content/uploads/2014/10/CD-apportionment-1789-2010.pdf.
Election Data Services Inc. is a political consulting firm that specializes in redistricting, election administration, and the analysis of census and political data. Election Data Services, Inc. con-ducts the congressional apportionment analyses with each annual release of the census population estimates. For more information about the reapportionment analysis, contact Kimball Brace (703-580-7267 or 202-789-2004 or [email protected]).
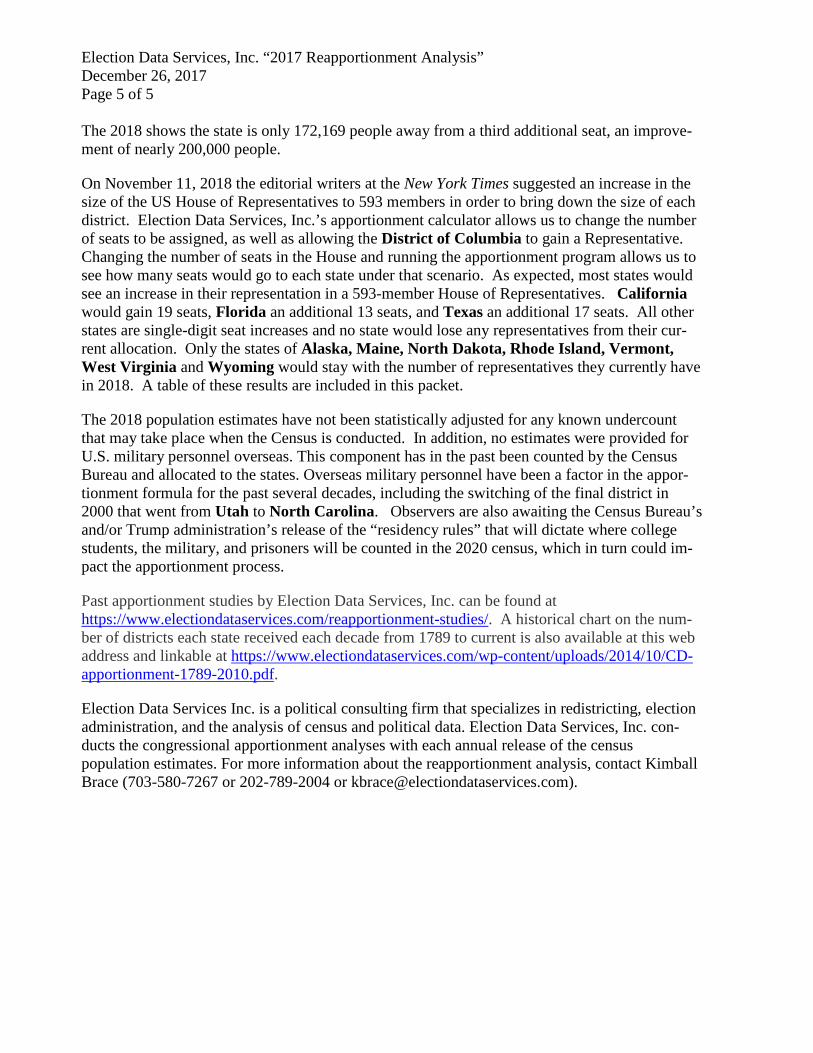
APPENDIX Main2018 Population Estimates 2018 Apportionment
2018 Population Estimates, Generated by Census Bureau 12/19/2018, with No Military Population Overseas
State Population
Compare
To Seats Change Gain a Seat Lose a Seat
Last Seat
Given
Next
Seat At
Average
Size
Size
Rank
Alabama 4,887,87 7 7 0 750,820 19,778 434 504 698,267 7Alaska 737,438 1 1 0 at large 628 737,438 32Arizona 7,171,646 9 10 1 731,147 45,488 432 480 717,165 40Arkansas 3,013,825 4 4 0 355,938 411,720 378 488 753,456 28California 39,557,045 53 53 0 753,536 122,773 435 443 746,359 25Colorado 5,695,564 7 8 1 698,110 74,375 431 489 711,946 38Connecticut 3,572,665 5 5 0 554,434 213,362 411 505 714,533 43Delaware 967,171 1 1 0 at large 479 967,171 3Florida 21,299,325 27 28 1 172,169 645,756 424 439 760,690 27Georgia 10,519,475 14 14 0 399,802 385,732 420 450 751,391 22Hawaii 1,420,49 2 2 0 425,204 358,187 328 562 710,246 42Idaho 1,754,208 2 2 0 91,487 691,904 266 458 877,104 6Illinois 12,741,080 18 17 -1 439,817 352,582 425 447 749,475 33Indiana 6,691,878 9 9 0 456,467 318,049 415 468 743,542 35Iowa 3,156,145 4 4 0 213,618 554,040 359 467 789,036 11Kansas 2,911,505 4 4 0 458,258 309,400 392 506 727,876 39Kentucky 4,468,402 6 6 0 414,848 354,113 401 474 744,734 34Louisiana 4,659,978 6 6 0 223,272 545,689 387 455 776,663 13Maine 1,338,404 2 2 0 507,291 276,100 345 598 669,202 47Maryland 6,042,718 8 8 0 350,956 421,529 406 462 755,340 19Massachusetts 6,902,149 9 9 0 246,196 528,320 403 448 766,905 17Michigan 9,995,915 14 13 -1 169,379 613,892 409 442 768,917 23Minnesota 5,611,179 8 7 -1 27,512 743,086 383 437 801,597 9Mississippi 2,986,530 4 4 0 383,233 384,425 384 492 746,633 36Missouri 6,126,452 8 8 0 267,222 505,263 400 453 765,807 21Montana 1,062,305 1 1 0 at large 436 1,062,305 1Nebraska 1,929,268 3 3 0 680,939 89,302 416 585 643,089 48Nevada 3,034,392 4 4 0 335,371 432,287 376 484 758,598 15New Hampshire 1,356,458 2 2 0 489,237 294,154 338 588 678,229 46New Jersey 8,908,520 12 12 0 502,714 278,314 423 460 742,377 30New Mexico 2,095,428 3 3 0 514,779 255,462 386 537 698,476 45New York 19,542,209 27 26 -1 422,032 391,234 428 444 751,623 20North Carolina 10,383,620 13 14 1 535,657 249,877 426 457 741,687 29North Dakota 760,077 1 1 0 at large 611 760,077 12Ohio 11,689,442 16 16 0 737,627 52,474 433 464 730,590 16Oklahoma 3,943,079 5 5 0 184,020 583,776 373 454 788,616 10Oregon 4,190,713 5 6 1 692,537 76,424 430 507 698,452 44Pennsylvani 12,807,060 18 17 -1 373,837 418,562 422 446 753,356 31Rhode Island 1,057,315 2 1 -1 at large 438 1,057,315 2South Carolina 5,084,127 7 7 0 554,564 216,034 418 482 726,304 37South Dakot 882,235 1 1 0 at large 525 882,235 5Tennessee 6,770,010 9 9 0 378,335 396,181 412 459 752,223 26Texas 28,701,845 36 38 2 305,524 535,734 429 440 755,312 24Utah 3,161,105 4 4 0 208,658 559,000 357 466 790,276 8Vermont 626,299 1 1 0 at large 723 626,299 49Virginia 8,517,685 11 11 0 139,391 639,421 404 441 774,335 14Washington 7,535,59 10 10 0 367,202 409,433 414 456 753,559 18West Virginia 1,805,832 3 2 -1 39,863 743,528 259 445 902,916 4Wisconsin 5,813,568 8 8 0 580,106 192,379 421 478 726,696 41Wyoming 577,737 1 1 0 at large 777 577,737 50Washington DC 702,455 0
327,167,434 435 Median = 751,507
Other Inputs: Seats to Apportion Min = 577,737
435 Max Seats to Calculate Max = 1,062,305
75 States
50
Include
Election Data Services, Inc. Confidential 12/19/2018 Page 1
AL - 7
AZ - 10AR - 4
CA - 53 CO - 8
CT - 5
DE - 1
DC
FL - 28
GA - 14
HI - 2
ID - 2
IL - 17 IN - 9
IA - 4
KS - 4KY - 6
LA - 6
ME - 2
MD - 8
MA - 9MI - 13
MN - 7
MS - 4
MO - 8
MT - 1
NE - 3NV - 4
NH - 2
NJ - 12
NM - 3
NY - 26
NC - 14
ND - 1
OH - 16
OK - 5
OR - 6
PA - 17
RI - 1
SC - 7
SD - 1
TN - 9
TX - 38
UT - 4
VT - 1
VA - 11
WA - 10
WV - 2
WI - 8
WY - 1
AK - 1
Anticipated Gains/Losses in Reapportionment2018 Population Estimates
Released by Census Bureau 12/19/2018
Change in Seats 2018
Change
<Null>
-1
0
1
2
Based on Census Bureau estimates released 12/19/2018
State numbers reflect number of congressional house seats after change put into effect.
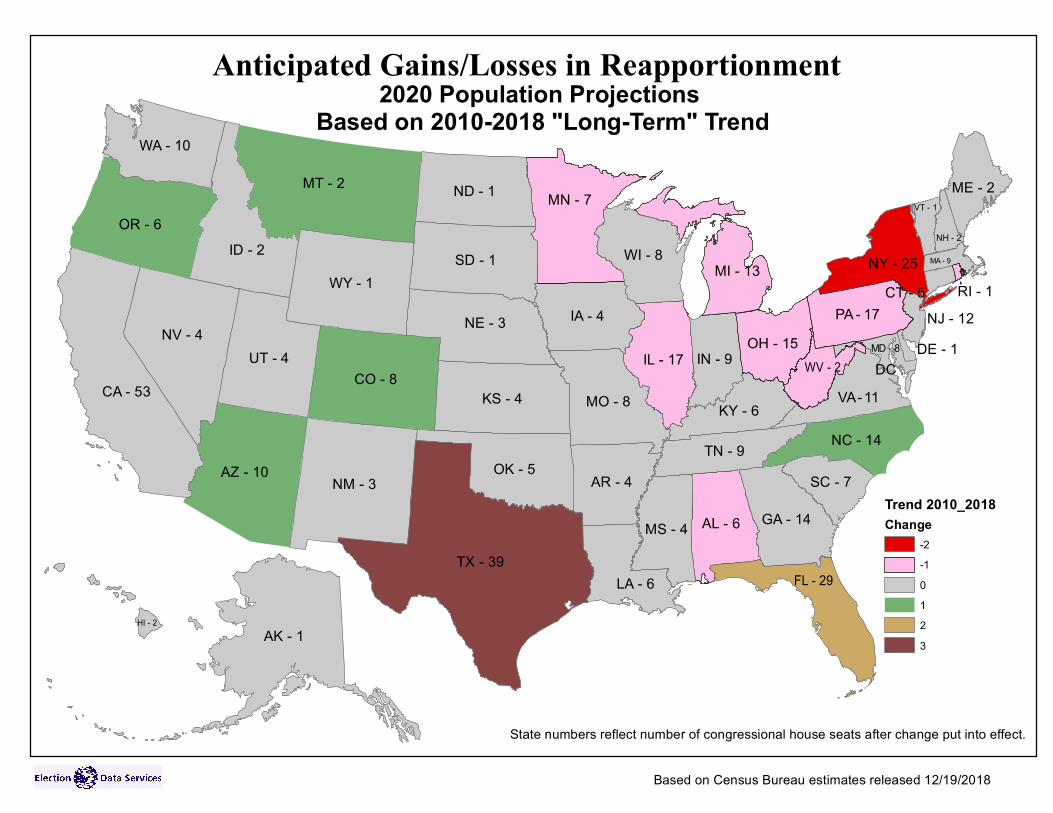
APPENDIX Main2020apportionmentOn2010_18TrendsIn2018CBEstimates.xls
2020 Projections, based on 2010-18 Change shown in 2018 Population Estimates, Generated by Census Bureau 12/19/2018, with No Military P
State PopulationCompare
To Seats Change Gain a Seat Lose a SeatLast Seat
GivenNext Seat
At Average Size Size RankAlabama 4,925,739 7 6 -1 61,258 715,179 374 439 820,956 7Alaska 747,142 1 1 0 at large 632 747,142 32Arizona 7,472,214 9 10 1 598,478 179,310 426 471 747,221 40Arkansas 3,048,570 4 4 0 392,785 385,579 381 493 762,143 28California 40,397,455 53 53 0 769,545 40,458 435 442 762,216 25Colorado 5,954,926 7 8 1 574,585 202,206 423 479 744,366 38Connecticut 3,572,156 5 5 0 642,626 134,248 421 512 714,431 43Delaware 992,806 1 1 0 at large 478 992,806 3Florida 22,270,665 27 29 2 426,627 364,959 430 443 767,954 27Georgia 10,829,538 14 14 0 321,726 458,674 417 446 773,538 22Hawaii 1,442,095 2 2 0 442,813 354,933 333 567 721,047 42Idaho 1,825,966 2 2 0 58,942 738,805 262 447 912,983 6Illinois 12,710,193 18 17 -1 750,739 31,815 433 462 747,658 33Indiana 6,765,605 9 9 0 534,611 242,633 422 469 751,734 35Iowa 3,195,055 4 4 0 246,300 532,063 365 468 798,764 11Kansas 2,931,983 4 4 0 509,372 268,992 397 511 732,996 39Kentucky 4,514,089 6 6 0 472,908 303,529 407 482 752,348 34Louisiana 4,704,673 6 6 0 282,324 494,114 392 463 784,112 13Maine 1,341,880 2 2 0 543,028 254,718 352 611 670,940 47Maryland 6,139,465 8 8 0 390,047 386,745 409 465 767,433 19Massachusetts 7,030,552 9 9 0 269,663 507,581 403 452 781,172 17Michigan 10,034,780 14 13 -1 346,481 433,226 415 448 771,906 23Minnesota 5,722,916 8 7 -1 35,572 740,915 379 437 817,559 9Mississippi 2,992,898 4 4 0 448,457 329,907 390 499 748,225 36Missouri 6,174,803 8 8 0 354,709 422,083 405 461 771,850 21Montana 1,089,209 1 2 1 795,699 2,048 434 735 544,605 1Nebraska 1,966,657 3 3 0 699,005 83,638 416 588 655,552 48Nevada 3,163,281 4 4 0 278,074 500,289 368 474 790,820 15New Hampshire 1,370,624 2 2 0 514,284 283,462 342 596 685,312 46New Jersey 8,949,118 12 12 0 662,062 116,973 431 466 745,760 30New Mexico 2,108,108 3 3 0 557,555 225,088 391 547 702,703 45New York 19,599,091 27 25 -2 19,648 768,894 419 436 783,964 20North Carolina 10,700,996 13 14 1 450,268 330,132 424 454 764,357 29North Dakota 794,069 1 1 0 at large 595 794,069 12Ohio 11,742,622 16 15 -1 178,580 602,528 413 440 782,841 16Oklahoma 4,012,266 5 5 0 202,516 574,358 376 456 802,453 10Oregon 4,325,944 5 6 1 661,053 115,384 425 501 720,991 44Pennsylvania 12,843,168 18 17 -1 617,764 164,790 432 455 755,480 31Rhode Island 1,058,819 2 1 -1 at large 444 1,058,819 2South Carolina 5,257,461 7 7 0 501,027 275,460 412 477 751,066 37South Dakota 907,577 1 1 0 at large 525 907,577 5Tennessee 6,925,390 9 9 0 374,825 402,419 410 459 769,488 26Texas 30,096,962 36 39 3 296,258 502,984 429 438 771,717 24Utah 3,317,271 4 4 0 124,084 654,279 345 450 829,318 8Vermont 626,490 1 1 0 at large 738 626,490 49Virginia 8,706,744 11 11 0 134,256 644,135 401 441 791,522 14Washington 7,848,016 10 10 0 222,676 555,112 404 445 784,802 18West Virginia 1,790,030 3 2 -1 94,878 702,869 269 457 895,015 4Wisconsin 5,857,943 8 8 0 671,569 105,223 428 488 732,243 41Wyoming 582,656 1 1 0 at large 787 582,656 50Washington DC 742,858 0
334,121,530 435 Median = 765,895Other Inputs: Seats to Apportion Min = 544,605
435 Max Seats to Calculate Max = 1,058,81975 States50
Include
Election Data Services, Inc. Confidential 12/19/2018 Page 1
AL - 6
AZ - 10 AR - 4
CA - 53 CO - 8
CT - 5
DE - 1DC
FL - 29
GA - 14
HI - 2
ID - 2
IL - 17 IN - 9
IA - 4
KS - 4 KY - 6
LA - 6
ME - 2
MD - 8
MA - 9MI - 13
MN - 7
MS - 4
MO - 8
MT - 2
NE - 3NV - 4
NH - 2
NJ - 12
NM - 3
NY - 25
NC - 14
ND - 1
OH - 15
OK - 5
OR - 6
PA - 17RI - 1
SC - 7
SD - 1
TN - 9
TX - 39
UT - 4
VT - 1
VA - 11
WA - 10
WV - 2
WI - 8WY - 1
AK - 1
Anticipated Gains/Losses in Reapportionment2020 Population Projections
Based on 2010-2018 "Long-Term" Trend
Trend 2010_2018Change
-2-10123
Based on Census Bureau estimates released 12/19/2018
State numbers reflect number of congressional house seats after change put into effect.
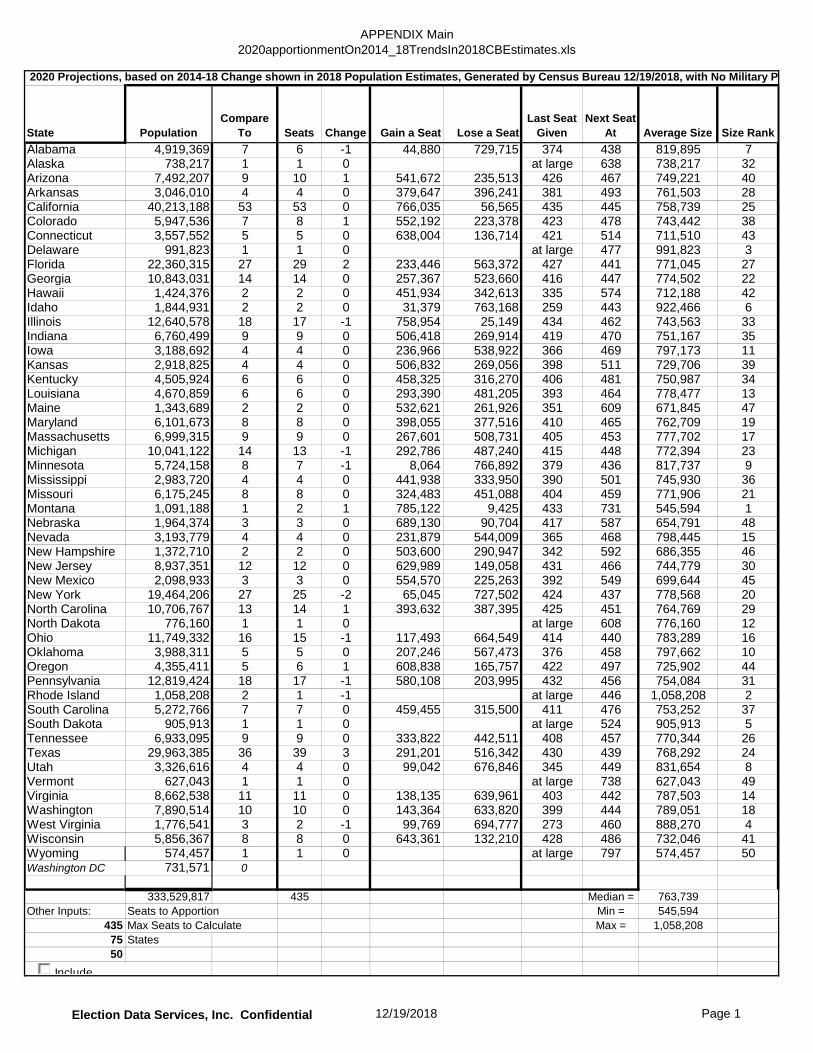
APPENDIX Main2020apportionmentOn2014_18TrendsIn2018CBEstimates.xls
2020 Projections, based on 2014-18 Change shown in 2018 Population Estimates, Generated by Census Bureau 12/19/2018, with No Military P
State PopulationCompare
To Seats Change Gain a Seat Lose a SeatLast Seat
GivenNext Seat
At Average Size Size RankAlabama 4,919,369 7 6 -1 44,880 729,715 374 438 819,895 7Alaska 738,217 1 1 0 at large 638 738,217 32Arizona 7,492,207 9 10 1 541,672 235,513 426 467 749,221 40Arkansas 3,046,010 4 4 0 379,647 396,241 381 493 761,503 28California 40,213,188 53 53 0 766,035 56,565 435 445 758,739 25Colorado 5,947,536 7 8 1 552,192 223,378 423 478 743,442 38Connecticut 3,557,552 5 5 0 638,004 136,714 421 514 711,510 43Delaware 991,823 1 1 0 at large 477 991,823 3Florida 22,360,315 27 29 2 233,446 563,372 427 441 771,045 27Georgia 10,843,031 14 14 0 257,367 523,660 416 447 774,502 22Hawaii 1,424,376 2 2 0 451,934 342,613 335 574 712,188 42Idaho 1,844,931 2 2 0 31,379 763,168 259 443 922,466 6Illinois 12,640,578 18 17 -1 758,954 25,149 434 462 743,563 33Indiana 6,760,499 9 9 0 506,418 269,914 419 470 751,167 35Iowa 3,188,692 4 4 0 236,966 538,922 366 469 797,173 11Kansas 2,918,825 4 4 0 506,832 269,056 398 511 729,706 39Kentucky 4,505,924 6 6 0 458,325 316,270 406 481 750,987 34Louisiana 4,670,859 6 6 0 293,390 481,205 393 464 778,477 13Maine 1,343,689 2 2 0 532,621 261,926 351 609 671,845 47Maryland 6,101,673 8 8 0 398,055 377,516 410 465 762,709 19Massachusetts 6,999,315 9 9 0 267,601 508,731 405 453 777,702 17Michigan 10,041,122 14 13 -1 292,786 487,240 415 448 772,394 23Minnesota 5,724,158 8 7 -1 8,064 766,892 379 436 817,737 9Mississippi 2,983,720 4 4 0 441,938 333,950 390 501 745,930 36Missouri 6,175,245 8 8 0 324,483 451,088 404 459 771,906 21Montana 1,091,188 1 2 1 785,122 9,425 433 731 545,594 1Nebraska 1,964,374 3 3 0 689,130 90,704 417 587 654,791 48Nevada 3,193,779 4 4 0 231,879 544,009 365 468 798,445 15New Hampshire 1,372,710 2 2 0 503,600 290,947 342 592 686,355 46New Jersey 8,937,351 12 12 0 629,989 149,058 431 466 744,779 30New Mexico 2,098,933 3 3 0 554,570 225,263 392 549 699,644 45New York 19,464,206 27 25 -2 65,045 727,502 424 437 778,568 20North Carolina 10,706,767 13 14 1 393,632 387,395 425 451 764,769 29North Dakota 776,160 1 1 0 at large 608 776,160 12Ohio 11,749,332 16 15 -1 117,493 664,549 414 440 783,289 16Oklahoma 3,988,311 5 5 0 207,246 567,473 376 458 797,662 10Oregon 4,355,411 5 6 1 608,838 165,757 422 497 725,902 44Pennsylvania 12,819,424 18 17 -1 580,108 203,995 432 456 754,084 31Rhode Island 1,058,208 2 1 -1 at large 446 1,058,208 2South Carolina 5,272,766 7 7 0 459,455 315,500 411 476 753,252 37South Dakota 905,913 1 1 0 at large 524 905,913 5Tennessee 6,933,095 9 9 0 333,822 442,511 408 457 770,344 26Texas 29,963,385 36 39 3 291,201 516,342 430 439 768,292 24Utah 3,326,616 4 4 0 99,042 676,846 345 449 831,654 8Vermont 627,043 1 1 0 at large 738 627,043 49Virginia 8,662,538 11 11 0 138,135 639,961 403 442 787,503 14Washington 7,890,514 10 10 0 143,364 633,820 399 444 789,051 18West Virginia 1,776,541 3 2 -1 99,769 694,777 273 460 888,270 4Wisconsin 5,856,367 8 8 0 643,361 132,210 428 486 732,046 41Wyoming 574,457 1 1 0 at large 797 574,457 50Washington DC 731,571 0
333,529,817 435 Median = 763,739Other Inputs: Seats to Apportion Min = 545,594
435 Max Seats to Calculate Max = 1,058,20875 States50
Include
Election Data Services, Inc. Confidential 12/19/2018 Page 1

AL - 6
AZ - 10 AR - 4
CA - 53 CO - 8
CT - 5
DE - 1DC
FL - 29
GA - 14
HI - 2
ID - 2
IL - 17 IN - 9
IA - 4
KS - 4 KY - 6
LA - 6
ME - 2
MD - 8
MA - 9MI - 13
MN - 7
MS - 4
MO - 8
MT - 2
NE - 3NV - 4
NH - 2
NJ - 12
NM - 3
NY - 25
NC - 14
ND - 1
OH - 15
OK - 5
OR - 6
PA - 17
SC - 7
SD - 1
TN - 9
TX - 39
UT - 4
VT - 1
VA - 11
WA - 10
WV - 2
WI - 8WY - 1
AK - 1
Anticipated Gains/Losses in Reapportionment2020 Population Projections
Based on 2014-2018 "Mid-Term" Trend
Trend 2014_2018-2-10123
Based on Census Bureau estimates released 12/19/2018
State numbers reflect number of congressional house seats after change put into effect.

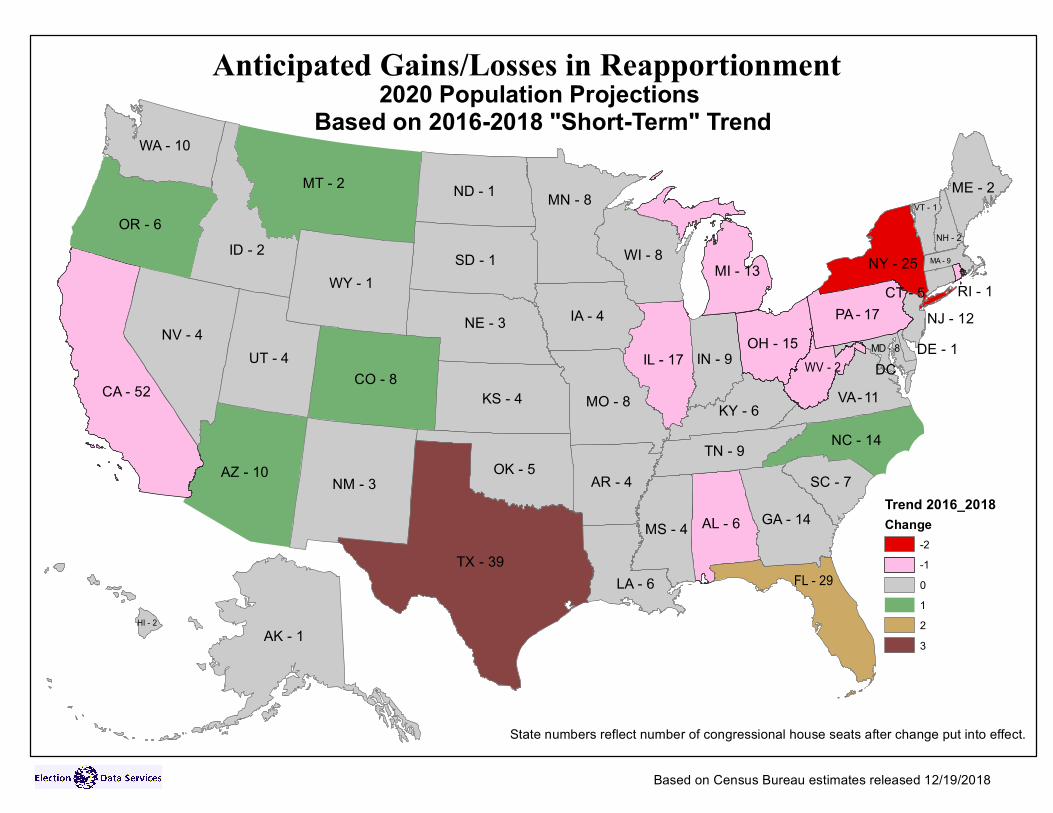
APPENDIX Main2020apportionmentOn2016_18TrendsIn2018CBEstimates.xls
2020 Projections, based on 2016-18 Change shown in 2018 Population Estimates, Generated by Census Bureau 12/19/2018, with No Military P
State PopulationCompare
To Seats Change Gain a Seat Lose a SeatLast Seat
GivenNext Seat
At Average Size Size RankAlabama 4,919,820 7 6 -1 40,764 742,368 374 439 819,970 7Alaska 731,878 1 1 0 at large 642 731,878 32Arizona 7,492,792 9 10 1 535,157 257,231 426 468 749,279 40Arkansas 3,046,273 4 4 0 376,856 404,220 381 492 761,568 28California 40,039,677 53 52 -1 143,827 762,731 431 436 769,994 25Colorado 5,914,133 7 8 1 580,797 206,646 425 479 739,267 38Connecticut 3,564,416 5 5 0 628,043 153,541 419 514 712,883 43Delaware 992,326 1 1 0 at large 476 992,326 3Florida 22,249,532 27 29 2 327,551 516,068 428 441 767,225 27Georgia 10,820,855 14 14 0 271,349 531,536 416 447 772,918 22Hawaii 1,410,078 2 2 0 464,848 331,464 336 580 705,039 42Idaho 1,856,366 2 2 0 18,559 777,753 258 440 928,183 6Illinois 12,623,874 18 17 -1 765,767 45,184 435 461 742,581 33Indiana 6,773,072 9 9 0 488,480 301,390 418 469 752,564 35Iowa 3,189,901 4 4 0 233,228 547,848 364 471 797,475 11Kansas 2,911,838 4 4 0 511,291 269,785 396 512 727,959 39Kentucky 4,510,172 6 6 0 450,413 332,719 406 481 751,695 34Louisiana 4,635,000 6 6 0 325,585 457,547 394 466 772,500 13Maine 1,348,127 2 2 0 526,798 269,514 348 603 674,063 47Maryland 6,095,335 8 8 0 399,595 387,848 410 463 761,917 19Massachusetts 7,007,991 9 9 0 253,561 536,309 404 450 778,666 17Michigan 10,056,717 14 13 -1 269,563 530,659 415 448 773,594 23Minnesota 5,733,780 8 8 0 761,150 26,293 434 494 716,723 9Mississippi 2,984,100 4 4 0 439,028 342,048 389 500 746,025 36Missouri 6,180,767 8 8 0 314,163 473,280 403 458 772,596 21Montana 1,092,395 1 2 1 782,530 13,782 433 731 546,198 1Nebraska 1,961,759 3 3 0 689,785 93,546 417 586 653,920 48Nevada 3,198,181 4 4 0 224,947 556,129 363 467 799,545 15New Hampshire 1,376,028 2 2 0 498,897 297,415 341 590 688,014 46New Jersey 8,955,455 12 12 0 604,823 192,755 429 465 746,288 30New Mexico 2,099,061 3 3 0 552,483 230,848 391 549 699,687 45New York 19,406,253 27 25 -2 108,582 724,115 423 437 776,250 20North Carolina 10,702,636 13 14 1 389,568 413,317 421 451 764,474 29North Dakota 768,007 1 1 0 at large 617 768,007 12Ohio 11,764,646 16 15 -1 93,419 712,144 412 438 784,310 16Oklahoma 3,965,598 5 5 0 226,861 554,723 376 459 793,120 10Oregon 4,330,577 5 6 1 630,008 153,125 424 498 721,763 44Pennsylvania 12,839,462 18 17 -1 550,178 260,773 430 454 755,262 31Rhode Island 1,057,662 2 1 -1 at large 446 1,057,662 2South Carolina 5,261,624 7 7 0 466,366 318,795 411 475 751,661 37South Dakota 909,431 1 1 0 at large 520 909,431 5Tennessee 6,945,117 9 9 0 316,436 473,435 407 456 771,680 26Texas 29,781,585 36 39 3 450,667 420,300 432 443 763,630 24Utah 3,330,377 4 4 0 92,752 688,324 344 449 832,594 8Vermont 629,965 1 1 0 at large 732 629,965 49Virginia 8,666,314 11 11 0 127,863 667,100 401 442 787,847 14Washington 7,877,783 10 10 0 150,165 642,223 399 444 787,778 18West Virginia 1,771,797 3 2 -1 103,129 693,183 271 460 885,898 4Wisconsin 5,869,800 8 8 0 625,130 162,312 427 485 733,725 41Wyoming 568,828 1 1 0 at large 803 568,828 50Washington DC 724,795 0
332,943,956 435 Median = 762,774Other Inputs: Seats to Apportion Min = 546,198
435 Max Seats to Calculate Max = 1,057,66275 States50
Include
Election Data Services, Inc. Confidential 12/19/2018 Page 1
AL - 6
AZ - 10 AR - 4
CA - 52 CO - 8
CT - 5
DE - 1DC
FL - 29
GA - 14
HI - 2
ID - 2
IL - 17 IN - 9
IA - 4
KS - 4 KY - 6
LA - 6
ME - 2
MD - 8
MA - 9MI - 13
MN - 8
MS - 4
MO - 8
MT - 2
NE - 3NV - 4
NH - 2
NJ - 12
NM - 3
NY - 25
NC - 14
ND - 1
OH - 15
OK - 5
OR - 6
PA - 17RI - 1
SC - 7
SD - 1
TN - 9
TX - 39
UT - 4
VT - 1
VA - 11
WA - 10
WV - 2
WI - 8WY - 1
AK - 1
Anticipated Gains/Losses in Reapportionment2020 Population Projections
Based on 2016-2018 "Short-Term" Trend
Trend 2016_2018Change
-2-10123
Based on Census Bureau estimates released 12/19/2018
State numbers reflect number of congressional house seats after change put into effect.
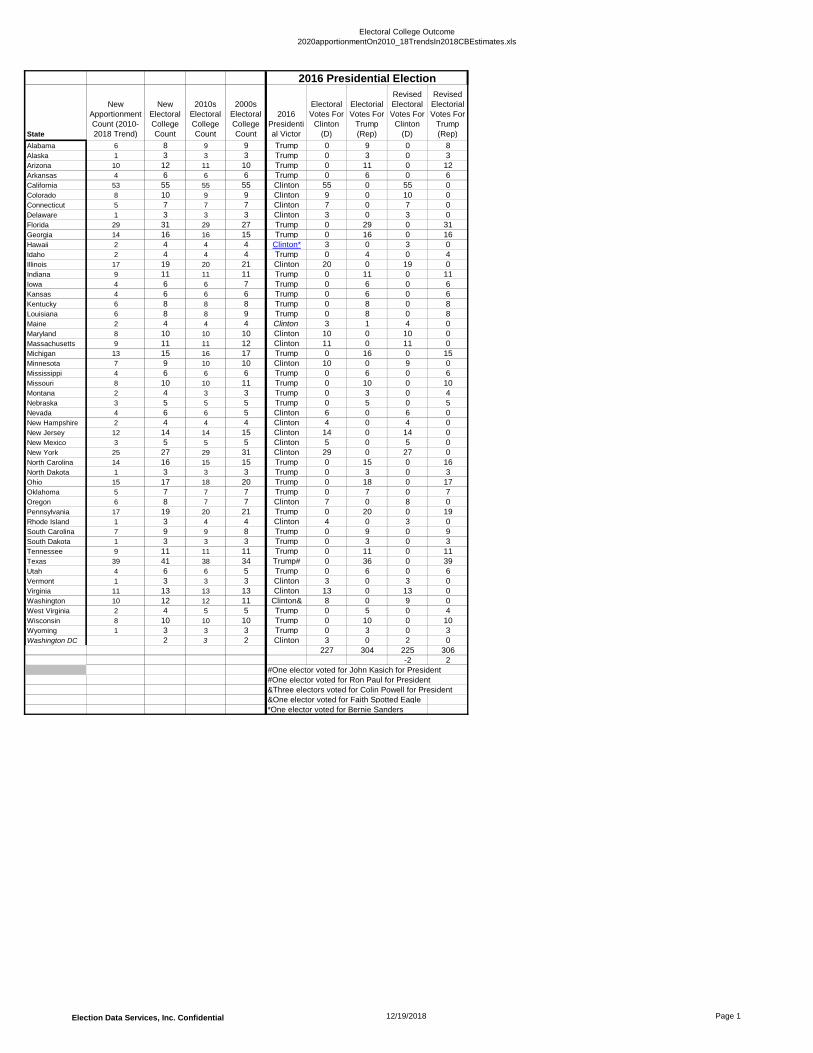
Electoral College Outcome2020apportionmentOn2010_18TrendsIn2018CBEstimates.xls
State
New Apportionment Count (2010-2018 Trend)
New Electoral College Count
2010s Electoral College Count
2000s Electoral College Count
2016 Presidential Victor
Electoral Votes For
Clinton (D)
Electorial Votes For
Trump (Rep)
Revised Electoral Votes For
Clinton (D)
Revised Electorial Votes For
Trump (Rep)
Alabama 6 8 9 9 Trump 0 9 0 8Alaska 1 3 3 3 Trump 0 3 0 3Arizona 10 12 11 10 Trump 0 11 0 12Arkansas 4 6 6 6 Trump 0 6 0 6California 53 55 55 55 Clinton 55 0 55 0Colorado 8 10 9 9 Clinton 9 0 10 0Connecticut 5 7 7 7 Clinton 7 0 7 0Delaware 1 3 3 3 Clinton 3 0 3 0Florida 29 31 29 27 Trump 0 29 0 31Georgia 14 16 16 15 Trump 0 16 0 16Hawaii 2 4 4 4 Clinton* 3 0 3 0Idaho 2 4 4 4 Trump 0 4 0 4Illinois 17 19 20 21 Clinton 20 0 19 0Indiana 9 11 11 11 Trump 0 11 0 11Iowa 4 6 6 7 Trump 0 6 0 6Kansas 4 6 6 6 Trump 0 6 0 6Kentucky 6 8 8 8 Trump 0 8 0 8Louisiana 6 8 8 9 Trump 0 8 0 8Maine 2 4 4 4 Clinton 3 1 4 0Maryland 8 10 10 10 Clinton 10 0 10 0Massachusetts 9 11 11 12 Clinton 11 0 11 0Michigan 13 15 16 17 Trump 0 16 0 15Minnesota 7 9 10 10 Clinton 10 0 9 0Mississippi 4 6 6 6 Trump 0 6 0 6Missouri 8 10 10 11 Trump 0 10 0 10Montana 2 4 3 3 Trump 0 3 0 4Nebraska 3 5 5 5 Trump 0 5 0 5Nevada 4 6 6 5 Clinton 6 0 6 0New Hampshire 2 4 4 4 Clinton 4 0 4 0New Jersey 12 14 14 15 Clinton 14 0 14 0New Mexico 3 5 5 5 Clinton 5 0 5 0New York 25 27 29 31 Clinton 29 0 27 0North Carolina 14 16 15 15 Trump 0 15 0 16North Dakota 1 3 3 3 Trump 0 3 0 3Ohio 15 17 18 20 Trump 0 18 0 17Oklahoma 5 7 7 7 Trump 0 7 0 7Oregon 6 8 7 7 Clinton 7 0 8 0Pennsylvania 17 19 20 21 Trump 0 20 0 19Rhode Island 1 3 4 4 Clinton 4 0 3 0South Carolina 7 9 9 8 Trump 0 9 0 9South Dakota 1 3 3 3 Trump 0 3 0 3Tennessee 9 11 11 11 Trump 0 11 0 11Texas 39 41 38 34 Trump# 0 36 0 39Utah 4 6 6 5 Trump 0 6 0 6Vermont 1 3 3 3 Clinton 3 0 3 0Virginia 11 13 13 13 Clinton 13 0 13 0Washington 10 12 12 11 Clinton& 8 0 9 0West Virginia 2 4 5 5 Trump 0 5 0 4Wisconsin 8 10 10 10 Trump 0 10 0 10Wyoming 1 3 3 3 Trump 0 3 0 3Washington DC 2 3 2 Clinton 3 0 2 0
227 304 225 306-2 2
#One elector voted for John Kasich for President#One elector voted for Ron Paul for President&Three electors voted for Colin Powell for President&One elector voted for Faith Spotted Eagle*One elector voted for Bernie Sanders
2016 Presidential Election
Election Data Services, Inc. Confidential 12/19/2018 Page 1

Electoral College Outcome2020apportionmentOn2010_18TrendsIn2018CBEstimates.xls
State
New Apportionment Count (2010-2018 Trend)
New Electoral College Count
2010s Electoral College Count
2000s Electoral College Count
Alabama 6 8 9 9Alaska 1 3 3 3Arizona 10 12 11 10Arkansas 4 6 6 6California 53 55 55 55Colorado 8 10 9 9Connecticut 5 7 7 7Delaware 1 3 3 3Florida 29 31 29 27Georgia 14 16 16 15Hawaii 2 4 4 4Idaho 2 4 4 4Illinois 17 19 20 21Indiana 9 11 11 11Iowa 4 6 6 7Kansas 4 6 6 6Kentucky 6 8 8 8Louisiana 6 8 8 9Maine 2 4 4 4Maryland 8 10 10 10Massachusetts 9 11 11 12Michigan 13 15 16 17Minnesota 7 9 10 10Mississippi 4 6 6 6Missouri 8 10 10 11Montana 2 4 3 3Nebraska 3 5 5 5Nevada 4 6 6 5New Hampshire 2 4 4 4New Jersey 12 14 14 15New Mexico 3 5 5 5New York 25 27 29 31North Carolina 14 16 15 15North Dakota 1 3 3 3Ohio 15 17 18 20Oklahoma 5 7 7 7Oregon 6 8 7 7Pennsylvania 17 19 20 21Rhode Island 1 3 4 4South Carolina 7 9 9 8South Dakota 1 3 3 3Tennessee 9 11 11 11Texas 39 41 38 34Utah 4 6 6 5Vermont 1 3 3 3Virginia 11 13 13 13Washington 10 12 12 11West Virginia 2 4 5 5Wisconsin 8 10 10 10Wyoming 1 3 3 3Washington DC 2 3 2
2012 Presidential
Victor
Electoral Votes For
Obama (D)
Electorial Votes For Romney
(Rep)
Revised Electoral Votes For
Obama (D)
Revised Electorial Votes For Romney
(Rep)
2008 Presidential
Victor
Electoral Votes For
Obama (D)
Electorial Votes For McCain (Rep)
Revised Electoral Votes For
Obama (D)
Revised Electorial Votes For McCain (Rep)
Romney 0 9 0 8 McCain 0 9 0 8Romney 0 3 0 3 McCain 0 3 0 3Romney 0 11 0 12 McCain 0 10 0 12Romney 0 6 0 6 McCain 0 6 0 6Obama 55 0 55 0 Obama 55 0 55 0Obama 9 0 10 0 Obama 9 0 10 0Obama 7 0 7 0 Obama 7 0 7 0Obama 3 0 3 0 Obama 3 0 3 0Obama 29 0 31 0 Obama 27 0 31 0Romney 0 16 0 16 McCain 0 15 0 16Obama 4 0 4 0 Obama 4 0 4 0Romney 0 4 0 4 McCain 0 4 0 4Obama 20 0 19 0 Obama 21 0 19 0Romney 0 11 0 11 Obama 11 0 11 0Obama 6 0 6 0 Obama 7 0 6 0Romney 0 6 0 6 McCain 0 6 0 6Romney 0 8 0 8 McCain 0 8 0 8Romney 0 8 0 8 McCain 0 9 0 8Obama 4 0 4 0 Obama 4 0 4 0Obama 10 0 10 0 Obama 10 0 10 0Obama 11 0 11 0 Obama 12 0 11 0Obama 16 0 15 0 Obama 17 0 15 0Obama 10 0 9 0 Obama 10 0 9 0Romney 0 6 0 6 McCain 0 6 0 6Romney 0 10 0 10 McCain 0 11 0 10Romney 0 3 0 4 McCain 0 3 0 4Romney 0 5 0 5 McCain 1 4 1 4Obama 6 0 6 0 Obama 5 0 6 0Obama 4 0 4 0 Obama 4 0 4 0Obama 14 0 14 0 Obama 15 0 14 0Obama 5 0 5 0 Obama 5 0 5 0Obama 29 0 27 0 Obama 31 0 27 0Romney 0 15 0 16 Obama 15 0 16 0Romney 0 3 0 3 McCain 0 3 0 3Obama 18 0 17 0 Obama 20 0 17 0Romney 0 7 0 7 McCain 0 7 0 7Obama 7 0 8 0 Obama 7 0 8 0Obama 20 0 19 0 Obama 21 0 19 0Obama 4 0 3 0 Obama 4 0 3 0Romney 0 9 0 9 McCain 0 8 0 9Romney 0 3 0 3 McCain 0 3 0 3Romney 0 11 0 11 McCain 0 11 0 11Romney 0 38 0 41 McCain 0 34 0 41Romney 0 6 0 6 McCain 0 5 0 6Obama 3 0 3 0 Obama 3 0 3 0Obama 13 0 13 0 Obama 13 0 13 0Obama 12 0 12 0 Obama 11 0 12 0Romney 0 5 0 4 McCain 0 5 0 4Obama 10 0 10 0 Obama 10 0 10 0Romney 0 3 0 3 McCain 0 3 0 3Obama 3 0 2 0 Obama 3 0 2 0
332 206 327 210 365 173 355 182-5 4 -10 9
2008 Presidential Election2012 Presidential Election
Election Data Services, Inc. Confidential 12/19/2018 Page 2
Electoral College Outcome2020apportionmentOn2010_18TrendsIn2018CBEstimates.xls
State
New Apportionment Count (2010-2018 Trend)
New Electoral College Count
2010s Electoral College Count
2000s Electoral College Count
Alabama 6 8 9 9Alaska 1 3 3 3Arizona 10 12 11 10Arkansas 4 6 6 6California 53 55 55 55Colorado 8 10 9 9Connecticut 5 7 7 7Delaware 1 3 3 3Florida 29 31 29 27Georgia 14 16 16 15Hawaii 2 4 4 4Idaho 2 4 4 4Illinois 17 19 20 21Indiana 9 11 11 11Iowa 4 6 6 7Kansas 4 6 6 6Kentucky 6 8 8 8Louisiana 6 8 8 9Maine 2 4 4 4Maryland 8 10 10 10Massachusetts 9 11 11 12Michigan 13 15 16 17Minnesota 7 9 10 10Mississippi 4 6 6 6Missouri 8 10 10 11Montana 2 4 3 3Nebraska 3 5 5 5Nevada 4 6 6 5New Hampshire 2 4 4 4New Jersey 12 14 14 15New Mexico 3 5 5 5New York 25 27 29 31North Carolina 14 16 15 15North Dakota 1 3 3 3Ohio 15 17 18 20Oklahoma 5 7 7 7Oregon 6 8 7 7Pennsylvania 17 19 20 21Rhode Island 1 3 4 4South Carolina 7 9 9 8South Dakota 1 3 3 3Tennessee 9 11 11 11Texas 39 41 38 34Utah 4 6 6 5Vermont 1 3 3 3Virginia 11 13 13 13Washington 10 12 12 11West Virginia 2 4 5 5Wisconsin 8 10 10 10Wyoming 1 3 3 3Washington DC 2 3 2
2004 Presidential
Victor
Electoral Votes For Kerry (D)
Electorial Votes For
Bush (Rep)
Revised Electoral Votes For Kerry (D)
Revised Electorial Votes For
Bush (Rep)
2000 Presidential
Victor
Electoral Votes For Gore (D)
Electorial Votes For
Bush (Rep)
Revised Electoral Votes For Gore (D)
Revised Electorial Votes For
Bush (Rep)
Bush 0 9 0 8 Bush 0 9 0 8Bush 0 3 0 3 Bush 0 3 0 3Bush 0 10 0 12 Bush 0 8 0 12Bush 0 6 0 6 Bush 0 6 0 6Kerry 55 0 55 0 Gore 54 0 55 0Bush 0 9 0 10 Bush 0 8 0 10Kerry 7 0 7 0 Gore 8 0 7 0Kerry 3 0 3 0 Gore 3 0 3 0Bush 0 27 0 31 Bush 0 25 0 31Bush 0 15 0 16 Bush 0 13 0 16Kerry 4 0 4 0 Gore 4 0 4 0Bush 0 4 0 4 Bush 0 4 0 4Kerry 21 0 19 0 Gore 22 0 19 0Bush 0 11 0 11 Bush 0 12 0 11Bush 0 7 0 6 Gore 7 0 6 0Bush 0 6 0 6 Bush 0 6 0 6Bush 0 8 0 8 Bush 0 8 0 8Bush 0 9 0 8 Bush 0 9 0 8Kerry 4 0 4 0 Gore 4 0 4 0Kerry 10 0 10 0 Gore 10 0 10 0Kerry 12 0 11 0 Gore 12 0 11 0Kerry 17 0 15 0 Gore 18 0 15 0Kerry 9 0 9 0 Gore 10 0 9 0Bush 0 6 0 6 Bush 0 7 0 6Bush 0 11 0 10 Bush 0 11 0 10Bush 0 3 0 4 Bush 0 3 0 4Bush 0 5 0 5 Bush 0 5 0 5Bush 0 5 0 6 Bush 0 4 0 6Kerry 4 0 4 0 Bush 0 4 0 4Kerry 15 0 14 0 Gore 15 0 14 0Bush 0 5 0 5 Gore 5 0 5 0Kerry 31 0 27 0 Gore 33 0 27 0Bush 0 15 0 16 Bush 0 14 0 16Bush 0 3 0 3 Bush 0 3 0 3Bush 0 20 0 17 Bush 0 21 0 17Bush 0 7 0 7 Bush 0 8 0 7Kerry 7 0 8 0 Gore 7 0 8 0Kerry 21 0 19 0 Gore 23 0 19 0Kerry 4 0 3 0 Gore 4 0 3 0Bush 0 8 0 9 Bush 0 8 0 9Bush 0 3 0 3 Bush 0 3 0 3Bush 0 11 0 11 Bush 0 11 0 11Bush 0 34 0 41 Bush 0 32 0 41Bush 0 5 0 6 Bush 0 5 0 6Kerry 3 0 3 0 Gore 3 0 3 0Bush 0 13 0 13 Bush 0 13 0 13Kerry 11 0 12 0 Gore 11 0 12 0Bush 0 5 0 4 Bush 0 5 0 4Kerry 10 0 10 0 Gore 11 0 10 0Bush 0 3 0 3 Bush 0 3 0 3Kerry 3 0 2 0 Gore 2 0 2 0
251 286 239 298 266 271 246 291-12 12 -20 20
2004 Presidential Election 2000 Presidential Election
Election Data Services, Inc. Confidential 12/19/2018 Page 3
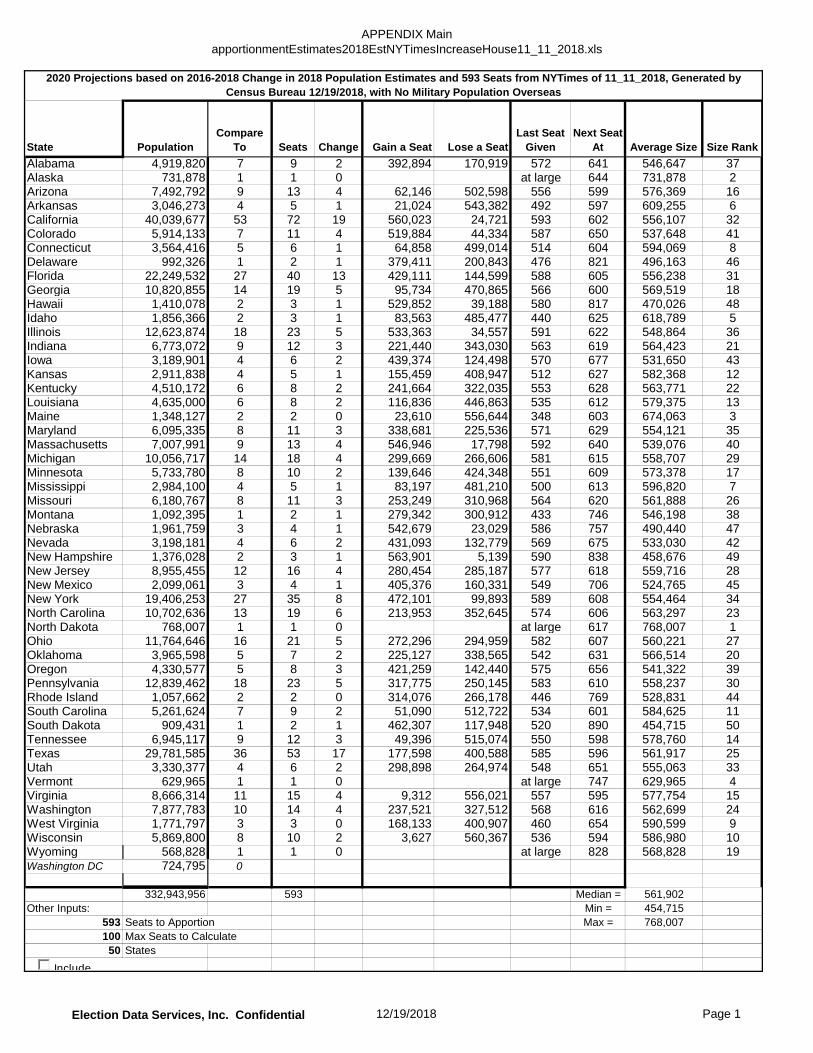
APPENDIX MainapportionmentEstimates2018EstNYTimesIncreaseHouse11_11_2018.xls
State PopulationCompare
To Seats Change Gain a Seat Lose a SeatLast Seat
GivenNext Seat
At Average Size Size RankAlabama 4,919,820 7 9 2 392,894 170,919 572 641 546,647 37Alaska 731,878 1 1 0 at large 644 731,878 2Arizona 7,492,792 9 13 4 62,146 502,598 556 599 576,369 16Arkansas 3,046,273 4 5 1 21,024 543,382 492 597 609,255 6California 40,039,677 53 72 19 560,023 24,721 593 602 556,107 32Colorado 5,914,133 7 11 4 519,884 44,334 587 650 537,648 41Connecticut 3,564,416 5 6 1 64,858 499,014 514 604 594,069 8Delaware 992,326 1 2 1 379,411 200,843 476 821 496,163 46Florida 22,249,532 27 40 13 429,111 144,599 588 605 556,238 31Georgia 10,820,855 14 19 5 95,734 470,865 566 600 569,519 18Hawaii 1,410,078 2 3 1 529,852 39,188 580 817 470,026 48Idaho 1,856,366 2 3 1 83,563 485,477 440 625 618,789 5Illinois 12,623,874 18 23 5 533,363 34,557 591 622 548,864 36Indiana 6,773,072 9 12 3 221,440 343,030 563 619 564,423 21Iowa 3,189,901 4 6 2 439,374 124,498 570 677 531,650 43Kansas 2,911,838 4 5 1 155,459 408,947 512 627 582,368 12Kentucky 4,510,172 6 8 2 241,664 322,035 553 628 563,771 22Louisiana 4,635,000 6 8 2 116,836 446,863 535 612 579,375 13Maine 1,348,127 2 2 0 23,610 556,644 348 603 674,063 3Maryland 6,095,335 8 11 3 338,681 225,536 571 629 554,121 35Massachusetts 7,007,991 9 13 4 546,946 17,798 592 640 539,076 40Michigan 10,056,717 14 18 4 299,669 266,606 581 615 558,707 29Minnesota 5,733,780 8 10 2 139,646 424,348 551 609 573,378 17Mississippi 2,984,100 4 5 1 83,197 481,210 500 613 596,820 7Missouri 6,180,767 8 11 3 253,249 310,968 564 620 561,888 26Montana 1,092,395 1 2 1 279,342 300,912 433 746 546,198 38Nebraska 1,961,759 3 4 1 542,679 23,029 586 757 490,440 47Nevada 3,198,181 4 6 2 431,093 132,779 569 675 533,030 42New Hampshire 1,376,028 2 3 1 563,901 5,139 590 838 458,676 49New Jersey 8,955,455 12 16 4 280,454 285,187 577 618 559,716 28New Mexico 2,099,061 3 4 1 405,376 160,331 549 706 524,765 45New York 19,406,253 27 35 8 472,101 99,893 589 608 554,464 34North Carolina 10,702,636 13 19 6 213,953 352,645 574 606 563,297 23North Dakota 768,007 1 1 0 at large 617 768,007 1Ohio 11,764,646 16 21 5 272,296 294,959 582 607 560,221 27Oklahoma 3,965,598 5 7 2 225,127 338,565 542 631 566,514 20Oregon 4,330,577 5 8 3 421,259 142,440 575 656 541,322 39Pennsylvania 12,839,462 18 23 5 317,775 250,145 583 610 558,237 30Rhode Island 1,057,662 2 2 0 314,076 266,178 446 769 528,831 44South Carolina 5,261,624 7 9 2 51,090 512,722 534 601 584,625 11South Dakota 909,431 1 2 1 462,307 117,948 520 890 454,715 50Tennessee 6,945,117 9 12 3 49,396 515,074 550 598 578,760 14Texas 29,781,585 36 53 17 177,598 400,588 585 596 561,917 25Utah 3,330,377 4 6 2 298,898 264,974 548 651 555,063 33Vermont 629,965 1 1 0 at large 747 629,965 4Virginia 8,666,314 11 15 4 9,312 556,021 557 595 577,754 15Washington 7,877,783 10 14 4 237,521 327,512 568 616 562,699 24West Virginia 1,771,797 3 3 0 168,133 400,907 460 654 590,599 9Wisconsin 5,869,800 8 10 2 3,627 560,367 536 594 586,980 10Wyoming 568,828 1 1 0 at large 828 568,828 19Washington DC 724,795 0
332,943,956 593 Median = 561,902Other Inputs: Min = 454,715
593 Seats to Apportion Max = 768,007100 Max Seats to Calculate
50 States
2020 Projections based on 2016-2018 Change in 2018 Population Estimates and 593 Seats from NYTimes of 11_11_2018, Generated by Census Bureau 12/19/2018, with No Military Population Overseas
Include
Election Data Services, Inc. Confidential 12/19/2018 Page 1
ME -2 (0)ND - 1 (0)
RI - 2 (0)
VT -1 (0)
WV -3 (0)
WY - 1 (0)
AK - 1 (0)
AR - 5 (1)
CT - 6 (1)
DE - 2 (1)
HI - 3 (1)
ID - 3 (1)
KS - 5 (1)
MS -5 (1)
MT - 2 (1)
NE - 4 (1)
NH -3 (1)
NM - 4 (1)
SD - 2 (1)
AL -9 (2)
IA - 6 (2)
KY - 8 (2)
LA - 8 (2)
MN - 10 (2)
NV - 6 (2)
OK - 7 (2) SC -9 (2)
UT - 6 (2)
WI - 10 (2)
IN -12 (3)
MD -11 (3)
MO - 11 (3)
OR - 8 (3)
TN - 12 (3)AZ - 13 (4)
CO - 11 (4)
MA - 13 (4)MI -
18 (4)NJ - 16 (4)
VA -15 (4)
WA - 14 (4)
GA -19 (5)
IL - 23 (5)OH -21 (5)
PA - 23 (5)
NC - 19 (6)
NY - 35 (8)
FL - 40 (13)TX - 53 (17)
CA - 72(19)
NYTimes w/593 SeatsChange
No Change1234568131719
Based on Census Bureau estimates released 12/19/2018
Labels reflect number of seats in 593 member House(Change from current apportionment)
Apportionment under 593-Member House of RepresentativesProposed by New York Times
November 11, 2018Utilizing 2020 Long Term Projection Model