Embed Size (px)
Citation preview

DI
SC
US
SI
ON
P
AP
ER
S
ER
IE
S
Forschungsinstitut zur Zukunft der ArbeitInstitute for the Study of Labor
Are Young People’s Educational OutcomesLinked to their Sense of Control?
IZA DP No. 4907
April 2010
Juan D. BarónDeborah Cobb-Clark

Are Young People’s Educational Outcomes
Linked to their Sense of Control?
Juan D. Barón Central Bank of Colombia
and IZA
Deborah Cobb-Clark MIAESR, University of Melbourne
and IZA
Discussion Paper No. 4907 April 2010
IZA
P.O. Box 7240 53072 Bonn
Germany
Phone: +49-228-3894-0 Fax: +49-228-3894-180
E-mail: [email protected]
Any opinions expressed here are those of the author(s) and not those of IZA. Research published in this series may include views on policy, but the institute itself takes no institutional policy positions. The Institute for the Study of Labor (IZA) in Bonn is a local and virtual international research center and a place of communication between science, politics and business. IZA is an independent nonprofit organization supported by Deutsche Post Foundation. The center is associated with the University of Bonn and offers a stimulating research environment through its international network, workshops and conferences, data service, project support, research visits and doctoral program. IZA engages in (i) original and internationally competitive research in all fields of labor economics, (ii) development of policy concepts, and (iii) dissemination of research results and concepts to the interested public. IZA Discussion Papers often represent preliminary work and are circulated to encourage discussion. Citation of such a paper should account for its provisional character. A revised version may be available directly from the author.

IZA Discussion Paper No. 4907 April 2010
ABSTRACT
Are Young People’s Educational Outcomes Linked to their Sense of Control?*
This paper analyzes the link between young people’s sense (locus) of control over their lives and their investments in education. We find that young people with a more internal locus of control have a higher probability of finishing secondary school and, conditional on completion, meeting the requirements to obtain a university entrance rank. Moreover, those with an internal locus of control who obtain a university entrance rank achieve somewhat higher rankings than do their peers who have a more external locus of control. Not surprisingly, there is a negative relationship between growing up in disadvantage and educational outcomes. However, this effect does not appear to operate indirectly by increasing the likelihood of having a more external locus of control. In particular, we find no significant relationship between family welfare history and young people's locus of control. JEL Classification: I38, J24, H31 Keywords: locus of control, parental socio-economic background, education Corresponding author: Juan D. Barón Calle 33 No. 3 -123 Centro Banco de la República Cartagena de Indias Colombia E-mail: [email protected]
* Our data come from the Youth in Focus Project which is jointly funded by the Australian Government Department of Education, Employment and Workplace Relations, the Australian Government Department of Families, Housing, Community Services and Indigenous Affairs, Centrelink and the Australian Research Council (Grant Number LP0347164) and is carried out by the Australian National University. The findings and views reported in this paper, however, are those of the authors and should not be attributed to either of the previous institutions, the Banco de la República (Central Bank of Colombia) or its Board of Directors. The authors would like to David Ribar, Chris Ryan, Michelle Tan and participants at the IZA internal seminar for useful comments and discussions.

1 Introduction
Human capital formation is the bedrock of modern social policy. Governments often rely on
investments in health, education, or labor market skills as the primary means of assisting dis-
advantaged groups, raising productivity (and hence living standards), promoting economic
and social development, and generally enhancing the wellbeing of the population. It is not
surprising, then, that there is intense interest in understanding the process that underpins
human capital formation. Increasingly, researchers’ attention has turned towards the com-
plex role that non-cognitive skills play in facilitating human capital investments generally,
and educational achievement in particular (e.g. Heckman et al., 2006; Cunha and Heckman,
2007; Borghans and Weel, 2008; Leininger and Kalil, 2008).
Our objective is to contribute to this emerging literature by analyzing the link
between young people’s sense of control over their lives (i.e., “locus of control” or “self-
efficacy”) and their investments in education. Locus of control is a psychological concept
capturing “a generalized attitude, belief, or expectancy regarding the nature of the causal
relationship between one’s own behavior and its consequences”(Rotter, 1966). Those who
believe that life’s outcomes are due to their own efforts have an “internal” locus (sense) of
control, while those who believe that outcomes are due to external factors (e.g. luck) have
an “external” locus (sense) of control (see Gatz and Karel, 1993). In short, locus of control
reflects individuals’ beliefs about whether there is a payoff to their own behavior and there
is evidence that locus of control influences educational outcomes primarily through these
beliefs rather than through overall ability (Coleman and DeLeire, 2003).
Our data come from the Youth in Focus (YIF) Project which interviews 18-year old
Australians about their experiences in school, educational achievement, and future study
plans. Detailed information about non-cognitive skills including personality and locus of
control, family background, parental education, and parents’ investments in their children’s
education is also collected. These survey data are then linked to almost twelve years of
administrative data on the family’s welfare receipt while the young person was growing
up. We use these unique data to answer the following questions: How are young people’s
educational outcomes related to their locus of control? Does locus of control have differential
effects on educational attainment and educational achievement? Finally, does growing up
1

in disadvantage seem to have an indirect effect on educational outcomes by reducing young
people’s sense of control over their lives?
In addressing these questions, we make several contributions to the existing literature.
First, we consider not only educational attainment (i.e., completion of secondary school),
but also relative academic achievement (i.e., university entrance rank). Economic models of
skill formation recently proposed by Heckman and his co-authors suggest that non-cognitive
skills (like locus of control) may affect schooling decisions (i.e. educational attainment) and
cognitive skills (i.e. educational achievement or test scores) differently (Heckman et al.,
2006; Cunha and Heckman, 2007). Second, we utilize an estimation strategy that allows
us to combine all of the information from multiple (imperfect) indicators of young people’s
locus of control without requiring us to use ad hoc weights to create an overall locus of
control index. In contrast, the approach often taken in the economics literature is to use
weights to aggregate the multiple indicators of locus of control found in survey data into
a single index and then to estimate conventional regression models. Unfortunately, these
weights are necessarily ad hoc given the lack of information about the contribution that
each indicator makes to predicting locus of control and estimation results can be sensitive
to the weights chosen.1 Our estimation model is flexible in allowing for differences in the
response error associated with each separate locus of control indicator thus avoiding this
problem. Finally, our data allow us to account for socio-economic background, specifically
family welfare history, in a very detailed way. This is important in light of the ongoing
debate on the effect of welfare receipt on non-cognitive skills such as self-esteem and locus
of control (Elliott, 1996; Kunz and Kalil, 1999; Gottschalk, 2005) and the evidence that
locus of control may be related to socio-economic status (see Wang et al., 1999). Designing
sensible policies to enhance opportunities for disadvantaged students requires that we know
more about the extent to which socio-economic disadvantage limits educational outcomes
by diminishing non-cognitive skills.
We find that young people with a more internal locus of control have a higher prob-
ability of finishing secondary school and, conditional on completion, obtaining a university
1In related research, Kalil et al. (2010) use the Youth in Focus data to investigate the effect of a stan-dardized locus of control index on employment and education transitions. In contrast, Osborne-Groves(2005) and Heckman et al. (2006) are exceptions in explicitly considering the latent nature of psycho-socialcharacteristics (including locus of control).
2

entrance rank. Those with an internal locus of control who obtain a university entrance rank
achieve somewhat higher rankings than do their peers who have a more external locus of
control. Not surprisingly, there is a negative relationship between growing up in disadvan-
tage and educational outcomes. However, this effect does not appear to operate indirectly
by increasing the likelihood of having a more external locus of control. In particular, we
find no significant relationship between family welfare history and young people’s locus of
control.
In Section 2, we briefly review the literature relating locus of control and educational
investments. Section 3 presents details of the Youth in Focus (YIF) data and provides
an overview of the Australian institutional context relevant to young people’s educational
outcomes. Our conceptual framework and estimation strategy are reviewed in Section 4,
while our results are discussed in Section 5. Our conclusions and suggestions for future
research are in Section 6.
2 Locus of Control and Investments in Education
A vast psychology literature assesses the determinants of individuals’ locus of control. In
their reviews of this research, Gatz and Karel (1993) and Coleman and DeLeire (2003) make
the following observations. First, psychologists typically believe that locus of control forms
during childhood and stabilizes during adolescence. Second, parents can influence their
children’s locus of control through their parenting style. Children are more likely to develop
an internal locus of control if their parents encourage autonomy and consistently use a
system of rewards and punishments. Third, stressful life events are related to a higher
likelihood of having an external locus of control. Finally, although the empirical evidence
is inconclusive, individuals’ locus of control may evolve over the life-cycle as physical and
mental health changes.
Previous research concludes that an internal locus of control is associated with supe-
rior academic performance (see Wang et al., 1999 for a review). A sense of personal control
is thought to increase effort, motivation, and persistence in problem solving all of which
are expected to improve educational outcomes (Ross and Broh, 2000). Others argue that,
because those with an internal sense of control believe that success comes from hard work,
3

they are more likely to be aware of information that is useful for future decision-making, are
more willing to take action to improve their performance, and are less likely to surrender
to peer pressures (Andrisani, 1977). Coleman and DeLeire (2003) formalize many of these
ideas in an explicit model of human capital accumulation in which locus of control influ-
ences adolescents’ perceptions of the future returns to education. Those with an internal
locus of control are assumed to believe that the marginal return to education is higher than
is the case for those with an external locus of control. Consequently, they are expected
to accumulate more human capital than their peers with a more external sense of control.
Coleman and Deleire provide empirical evidence that U.S. adolescents with an internal locus
of control do in fact anticipate higher wage returns to additional years of education. Cebi
(2007), however, is not able to replicate these results using a different data set once cognitive
ability is controlled. Moreover, Borghans et al. (2008) demonstrate that, in an experimen-
tal setting, those with an internal locus of control respond less to financial incentives when
allocating effort to cognitive tasks. This is more consistent with those having an internal
locus of control being simply more highly motivated, rather than with them being more
sensitive to the marginal returns to their investment decisions.
Much less is known about the effect of socio-economic status on these relationships,
in particular, the extent to which growing up in disadvantage might contribute to poorer
educational outcomes by limiting adolescents’ sense of control over their lives. There is
evidence, for example, that welfare receipt is related to lower self-esteem (Elliott, 1996) and
that increased employment results in adult welfare recipients adopting a more internal locus
of control (Gottschalk, 2005). The evidence for young people growing up in welfare families
is less clear, however. It also appears that the efficacy of policies designed to improve
educational outcomes for disadvantage students may in the end rest on their level of non-
cognitive skills. Experimental evidence, for example, indicates that U.S. welfare recipients
enrolled in an adult education program are twice as likely to receive a high school diploma
or GED if they feel they have control over the things that happen to them than if they do
not (Leininger and Kalil, 2008). With this in mind, some remedial education programs in
the U.K. are in fact designed to enhance these skills (including locus of control) in the hope
of improving cognitive outcomes (see Holmlund and Silva, 2009).
4

3 The Youth in Focus Data
Our data come from the Youth in Focus Project (YIF). These data are unique in providing
detailed information about educational attainment, educational achievement, family welfare
histories, as well as individual and household characteristics for a sample of 18-year old
Australians.
3.1 Estimation Sample
The YIF Project uses Australian administrative social security records to identify all young
people born between October 1987 and March 1988 who ever had contact with the social
security system between 1993 and 2005 (Breunig et al., 2007). The Australian social security
system is nearly universal for families with children with some payments such as the Child
Care Benefit having no income test at all and others, such as the Family Tax Benefit,
being denied only to families in the top quintile of the income distribution. At the other
extreme are welfare payments that are targeted towards low-income parents (mainly single
parents) or unemployed individuals which are also subject to income, asset and/or activity
tests. Young people are also in the administrative data if they receive benefits in their own
right. Most, however, are in the data because a family member (usually a parent) received
a payment at some point between 1993 and 2005 which depended in part on his or her
relationship to the youth. Comparing the number of young adults in these administrative
data to census data suggests that over 98 percent of young people born between October
1987 and March 1988 are represented in the administrative data (Breunig et al., 2007).
Thus, these social security records provide high-quality, fortnightly data on the payment
details for nearly the entire birth cohort. A stratified (on welfare history) random sample of
young people was selected from the administrative data for interview by phone and through
a self-completion questionnaire (SCQ). These data are then matched to the administrative
social security data for the youth’s family.2
2Following best practice (Groves et al., 2004), approach letters, incentive payments, repeated call backs,and Computer Assisted Telephone Interviewing (CATI) were all used to maximize response rates. Responserates differed somewhat across strata, however these differences stem primarily from differences in contactrates rather than refusal rates (Breunig et al., 2007). Overall, 36.1 percent of young people responded tothe survey—73.1 percent of whom also completed the self-completion questionnaire. More than 96 percentof youth consented to having these survey data linked to their administrative records.
5

We have necessarily made a number of sample restrictions. Many of our variables
of interest come from the SCQ. Consequently, out of the 4,079 youth in the YIF data, we
drop 1,150 youths who did not provide SCQs or had missing information on the SCQ-related
variables. We drop an additional 864 youths who did not provide information on some other
variable of interest (most commonly parental education). The estimation sample consists
of 2,065 youths. Appendix Table A1 presents summary statistics for the variables used in
the analysis.3
3.2 Education, Locus of Control, and Welfare History Measures
Australian children enter Kindergarten at age five, complete a further six years of primary
school, and leave secondary school after finishing 12th grade. Students who complete sec-
ondary school meeting certain minimum coursework requirements (e.g. with respect to
minimum credit hours, English requirements, etc.) are eligible to obtain a percentile rank-
ing for university entrance based on their academic performance in grades 11 and 12. Each
of the six states and two territories calculates this ranking differently and a national conver-
sion table is used to make comparisons across students educated in different jurisdictions.
Potential students wishing to go to university register their preferences (in rank order) for
specific degree programs with a central administrative agency. University placements of-
fers are then made on the basis of students’ entrance rankings once they are known (see
Marks et al., 2001, for details). Given these institutional arrangements, we consider three
measures of educational attainment: (i) an indicator of secondary school completion; (ii)
an indicator for obtaining a university entrance rank; and (iii) the actual entrance ranking
(measured from 30.0 – 99.9).4
We measure individuals’ locus of control using their responses to seven separate ques-
tions from the Pearlin and Schooler, 1978 Mastery Scale about their sense of control over
life’s events and what happens to them.5 Specifically, respondents are asked to indicate
3A corresponding parent or guardian—in 96.5 percent of cases the biological mother—was also selectedfrom the administrative data for a separate interview. The matched parent-youth sample is substantiallysmaller and we therefore rely strictly upon survey and administrative data from our sample of young people.
4Unlike other states and territories, Queensland ranks students on a scale from 1 (highest) to 25 (lowest).Following Cardak and Ryan (2006), we transform scores for students in Queensland to be equivalent to thosein other jurisdictions so that our university entrance rankings are calibrated to a common, Australia-widescale that ranges from 30 to 99.99.
5The seven separate items underlying the Pearlin-Schooler scale are summarized in Table A2.
6

their agreement (or disagreement) with seven separate statements using a four-point re-
sponse scale ranging from strongly agree to strongly disagree. We use these responses to
create seven separate, ordered indicators of locus of control each of which is included sepa-
rately into our estimation model (see Section 4).
Finally, we classify young people on the basis of their families’ welfare histories as
follows: 1) those in families with no history of welfare (non-recipients); 2) those in families
that received welfare for more than six years while the youth was growing up (intensive
support); and those in families receiving less than six years of support (moderate support)
for the first time 3) after 1998 (age 10); 4) between 1994 and 1998 (age 6 - 10); and 5) before
1994 (age 0 - 6).6 This categorization allows us to make comparisons between the intensity
and timing of welfare receipt.
3.3 Locus of Control: Links to Education and Welfare History
Table 1 presents information about the relationship between educational outcomes on the
one hand and locus of control and family welfare history on the other.7 We find a strong
relationship between the probability of secondary school completion and our indicators of
young people’s sense of control over their lives. Specifically, young people who (strongly)
agree that (i) they cannot solve some of the problems they have; (ii) have no control over
the things happening to them; (iii) feel helpless in dealing with problems; or (iv) can do
little to change things in life are all significantly less likely to have finished Year 12 at
the time of the survey.8 In contrast, completion rates are substantially higher for those
who (strongly) agree that (i) they can do anything they set their mind to or (ii) what
6We use the Australian government’s guidelines to identify the specific programs to be classified as“welfare”. For example, neither the Family Tax Benefit or the Child Care Benefit are considered to bewelfare payments. To place these payments in context, similar benefits are provided to United Statesfamilies through the tax system in the form of standard deductions for dependent children and child carerebates. The most common welfare payments are those for the unemployed (New Start Allowance) or low-income parents (Parenting Payments). Unlike the case in the U.S., Australian unemployment benefits areincome-, asset-, and activity-tested, are not time-limited, and are not related to an individual’s previousearnings history (Centrelink, 2007). As such they represent welfare rather than unemployment insurance.
7The results in Table 1 are based on seven indicator variables which take the value of one if the respondentstrongly agrees or agrees with each statement and zero otherwise. Descriptive statistics for obtaining auniversity entrance rank are conditional on having completed secondary school, while the percentile entrancerankings are conditional upon having qualified for an entrance rank.
8The young people in the sample were 18 at the time of interview and most of them would have beenexpected to have finished secondary school. Those who have not include those who have left school withoutcompleting 12th grade and those who are still in school, but have not yet completed 12th grade perhapsbecause they have made slower academic progress or because they began school at a later age.
7

happens to them mostly depends on them. In only one case, feeling pushed around in life,
is there no significant difference in the views of those who have and have not completed
secondary school. Thus, there appears to be a strong relationship between locus of control
and educational attainment.
[Table 1 here]
There is also evidence that locus of control is related to the propensity to obtain
a university entrance rank (see Table 1). Conditional upon completing secondary school,
those young people who (strongly) agree that there is little they can do to change things in
their lives are significantly more likely to have failed to meet the curriculum requirements
necessary to qualify for a university entrance rank (70.6 vs. 61.3 percent). Those who feel
that they have little control over what happens to them are also significantly less likely
to obtain a university entrance rank, while those who feel that they can do anything that
they set their minds to are more likely to obtain a ranking for university. In general, young
people with a more internal locus of control seem more inclined towards obtaining university
entrance ranks.
There is less evidence that locus of control is related to academic achievement, i.e.
actual university entrance rankings themselves. The last panel of Table 1 presents the
average percentile ranking for those who (strongly) agree and (strongly) disagree with each
of the locus of control statements. The difference in average percentile rankings for these
two groups is generally small in magnitude (usually less than one percentage point) and
statistically insignificant. At the same time, young people who think they have little control
over the things that happen to them obtain entrance rankings that are on average three
percentage points lower.
Taken together, the results suggest that youths with a more internal locus of control
are more likely to have completed 12th grade by age 18 and more likely to obtain a university
entrance rank upon completion. The strength of these relationships, nevertheless, varies
considerably by the specific locus of control indicator under consideration highlighting the
challenges associated with combining these indicators into a single index. Consequently, we
adopt an estimation strategy which accounts for each indicator separately and avoids the
necessity of imposing ad hoc restrictions on the way these indicators are combined.
8

Unlike previous Australian research on the effect of parental socio-economic sta-
tus on the educational attainment of youth (Cardak and Ryan, 2006; Marks et al., 2000;
Le and Miller, 2005), our measure of social and economic disadvantage is based on 12 years
of parental welfare history and not on parental occupation at some point in the past. Fully
77.6 percent of young people with no family history of welfare receipt have completed sec-
ondary school by the time they turn 18 and, of those who graduate, 76.8 percent earn a
university entrance rank with an average ranking in the 75.1 percentile. Youth growing up
in the most extreme disadvantage have completion rates that are substantially lower (54.9
percent) and are much less likely to be awarded a university entrance rank upon completion
(53.7 percent). There is also a large gap in achievement associated with having a family
history of intensive welfare receipt (69.4 versus 75.1 percentile). Finally there is evidence
that, moderate levels of socio-economic disadvantage (particularly those experienced for the
first before age 6) are also associated with a lower probability of completing 12th grade
and earning a ranking for university entrance. Gaps in achievement conditional upon meet-
ing the curriculum requirements necessary for obtaining a ranking are smaller than those
associated with extreme disadvantage.
4 The Econometric Model
Our primary empirical challenge is to make the best use of the multiple indicators of locus
of control that are available to us. We wish to avoid adopting ad hoc weights to create a
single locus of control index or, at the other extreme, using a measure-by-measure approach
to analyze each indicator separately.9 Instead, our estimation strategy allows for the possi-
bility that responses to specific survey questions are only imperfect measures, or indicators,
of a single, unobserved concept called locus of control. By simultaneously using information
from multiple indicators, we also hope to improve the precision of our estimates. The esti-
mation model for each of our three outcomes consists of two parts. The first is a behavioral
(structural) model that links the specific educational outcome to individuals’ latent locus
of control. The second is a measurement model that relates individuals’ observed, ordered
9The difficulty with the latter is that it treats the data as though each survey question provides infor-mation about a separate, perfectly measured concept. Dohmen et al. (2006) who adopt this approach toanalyze different measures of trust.
9

responses to each locus of control question to their underlying latent locus of control.
4.1 Secondary School Completion
We begin by assuming that the latent propensity of completing Year 12 (y∗) is given by
(1) y∗ = X¯ + °LC∗ +Wµ + u;
where X represents a set of covariates, LC∗ is a continuous measure capturing an individ-
ual’s latent locus of control, and W is the set of dummy variables indicating young people’s
exposure to socio-economic disadvantage while growing up. Moreover, {¯, °,µ} are vectors
of parameters of conformable dimensions to the matrices they multiply, and u is the error
term which is independent of each element of Z = {X, LC∗,W}. Finally, u ∼ N(0, ¾2u).
We cannot observe the propensity of completing secondary school (y∗). Instead we ob-
serve an indicator of Year 12 completion, y, which takes the values 1 (completion) and 0
(noncompletion) according to the rule y = 1 [y∗ > 0]. Given these assumptions, ui/¾u is
distributed standard normal and by the symmetry of the normal distribution we can write
the probability of secondary school completion as:
(2) P (y = 1∣Z) = Φ
(X
¯
¾u
+°
¾u
LC∗ +µ
¾u
W
),
where Φ(⋅) is the cumulative distribution function for a standard normal. Equation 2 de-
scribes the well-known probit model.10 Unlike the standard case, however, our model in-
cludes a continuous, latent right-hand-side variable, LC∗, which captures a young person’s
locus of control and is assumed to be distributed N(0, ¾2ℓ ). Higher values of LC∗are asso-
ciated with having a more internal locus of control, while lower values are associated with
being more external. Equation 2 sets out the model’s key behavioral relationship.
Although we do not observe LC∗ directly, we can generate imperfect measures of
LC∗ by using information from individuals’ survey responses to our seven items from the
Pearlin and Schooler (1978) Mastery Scale. Specifically, let l∗j represent the degree to which
a respondent agrees with each of the seven specific items in the scale (see Table A1). We
10Note that without further assumptions only the ratio ¯i/¾u is identified. Consequently, it is standardto achieve identification of ¯i by adopting the normalization ¾u = 1.
10

assume that l∗j is related to latent locus of control (LC∗) through the following measurement
model:
(3) l∗j = ®jLC∗ + ²j ; j = 1, 2, ..., 7.
In this set of equations, ®js are parameters to be estimated and ²j captures seven separate
error terms such that, conditional on LC∗, ²j ∼ N(0, 1) ∀j. Although we do not observe in-
dividuals’ latent degree of agreement with each of the seven items in the Pearlin and Schooler
scale (l∗j ), we do observe their discrete responses to each survey question (lj). In particular,
there are four possible responses to each survey question ranging from “strongly agree” to
“strongly disagree”. The rule linking these observed (ordered) responses to the underlying
(latent) degree of agreement is:
(4) lj =
⎧⎨⎩
1 if −∞ < l∗j ≤ ±0j,
2 if ±0j < l∗j ≤ ±1j,
3 if ±1j < l∗j ≤ ±2j,
4 if ±3j < l∗j < ∞;
where ±ij are threshold parameters satisfying the restriction ±1j < ±2j < ... < ±3j ∀j = 1, ..., 7.
The error terms in this system of seven ordered probits are independent of each other and
the error term in the Year 12 completion equation (i.e. E[²j²i] = 0 ∀j ∕= i and E[²iu] = 0).11
The objective is to obtain estimates of ¯, the ®js, the thresholds for each of the
ordered probits (±ijs), and the main parameters of interest, ° and µ. The wording of the
items in the Pearlin and Schooler locus of control scale and the possible response options
imply that higher values of LC∗ can be interpreted as reflecting a more internal locus of
control and the extent to which the data support this interpretation is explicitly considered
in Section 5.1. Given this, the literature review in section 2 leads us to expect that °̂ > 0
and µ̂i < 0 for all i ∈ µ. In addition to the standard normalizations of the variance of the
error terms in the probit and ordered probit equations outlined above, it is also necessary
to set one of the ® parameters to unity in order to identify the parameters in the model.12
11Note that by assuming ²j ∼ N(0, 1), the model uses a common identification restriction; that is ¾2"j = 1.
12This is the standard normalization adopted in the literature. An alternative normalization is to set thevariance of LC∗ to unity.
11

Moreover, the model can be seen as a system of seven ordered probits (given by the set of
equations in equations 3 and 4) and a binary probit model for Year 12 completion (equation
2). The system has cross-equation restrictions on some of the parameters and a common
factor with known distribution (LC∗).13
In summary, our estimation model allows us to test whether there is a relationship
between locus of control and Year 12 completion while first, taking into account the latent
nature of locus of control, and second, utilizing the information from multiple locus of control
indicators. The resulting estimates can be given a causal interpretation if the identifying
assumptions of the model hold. Most concerning is the assumption that u is independent of
the independent variables in the model (i.e. Z = {X, LC∗,W}) as it rules out the presenceof unobserved individual-specific effects which might be correlated both with individuals’
locus of control or family welfare history and their educational outcomes. Unfortunately,
our cross-sectional data do not permit us to account for individual-specific effects in the
estimation. Therefore, we will be cautious in interpreting our estimates as associations
rather than causal effects.14
4.2 University Entrance Rankings
The above model can also be used to estimate the propensity for young people graduating
from secondary school to have met the specific curriculum requirements necessary to qualify
for a university entrance rank. This propensity is unobserved. However, we do observe each
individuals’ receipt of a university entrance rank (R) which is assumed to be given by the
following:
(5) R = 1 [X1¯1 + °1LC∗ + µ1W + u1 > 0]
13This and all subsequent models are estimated in aML using maximum likelihood with adaptative quadra-ture for the numeric maximization of the likelihood (Lillard and Panis, 2003).The aML software is freelyavailable from http://www.applied-ml.com. However, any other software that performs maximum likelihoodcan also be used to estimate this model.
14Using data on siblings to account for unobserved family characteristics, Ku and Plotnick (2003) suggestthat cross-sectional estimates of the relationship between disadvantage at home and school completion ofyouth are biased downwards. If this is the case in the Australian context, the results discussed aboveunder-estimate the effect of disadvantage on the educational outcomes of young people.
12

where 1 [⋅] is the indicator function which takes the value of 1 for graduates with university
entrance rankings and 0 for graduates without. As before, we are interested in the effect
of LC∗ —individuals’ latent locus of control—on educational attainment. Consequently,
the full model also includes equations 3 and 4 which capture the relationship between
young people’s responses to survey questions about the degree of control they have over
their lives (lj) and their latent degree of agreement with each of the seven items in the
Pearlin and Schooler locus of control scale (l∗j ). The error term u1 is assumed to be inde-
pendent of all explanatory variables, distributed standard normal, and independent of the
error terms in the measurement equations in equation 3.
Finally, we consider the determinants of a young person’s actual (percentile) univer-
sity ranking conditional on having received one. Australian states and territories calculate
these rankings somewhat differently (see Section 3.2). However, each jurisdiction bases their
rankings on a combination of: (i) students’ academic performance in their coursework in
grades 11 and 12 (normed within the state or territory through school-specific, test-based
scaling factors); and (ii) students’ individual results on state-wide examinations at the end
of 12th grade. The resulting score reflects the student’s percentile ranking within the entire
cohort (see Marks et al., 2001). Entrance rankings are left-censored at 30 leading us to
adopt a censored regression model that incorporates the effect of individuals’ latent locus
of control through the measurement model given in equations 3 and 4. Specifically,
RANK∗ = X2¯2 + °2LC∗ + µ2W + u2(6)
RANK = max (30, RANK∗)(7)
where RANK∗ represents individuals’ actual percentile rankings which are observed only
if they are greater than the censored value of 30. In this specification u, conditional on
regressors and censored value, is assumed to be normally distributed with mean zero and
variance ¾2u. The resulting estimates from the censored model are consistent (unlike OLS
estimates) and directly interpretable (unlike Tobit estimates).
13

5 Results
5.1 Measurement Model: Are we capturing locus of control?
We being by considering whether the measurement component of the model specified in
equations 3 and 4 yields estimated parameters (®̂), i.e. factor loadings, that are consistent
with our interpretation of internal versus external locus of control. Locus of control has no
intrinsic unit of measurement, so it is necessary to set one factor loading to be a constant
in order to identify the model.15 Therefore, we set ®̂1 to unity implying that the signs
and relative magnitudes of all remaining ®̂j can also be interpreted relative to this outcome
(i.e. “I cannot solve some of my problems”). If our interpretation of the latent variable
(LC∗)–i.e. higher values represent a more internal locus of control–is consistent with the
data, we expect that ®̂ > 0 for those items suggesting an internal sense of control and ®̂ < 0
for those items suggesting a more external sense of control.16
Table 2 presents the results (®̂ and heteroscedasticity-robust standard errors) of our
measurement component of our model for each of the three educational outcomes under
consideration. Although the measurement and behavioral components of each model are
estimated jointly, for ease of interpretation Table 2 presents only the results from the mea-
surement model. Table 2 also reports the estimated standard deviation of the latent locus
of control variable.
[Table 2 here]
We find that all factor loadings are statistically significant and have signs that are
consistent with our interpretation that higher (lower) values of the latent variable correspond
to a more internal (external) locus of control. That is, responding that one strongly disagrees
with the statement that he or she feels pushed around in life (i.e. l2 = 4) is significantly
related to higher levels of the latent variable (LC∗) because the coefficient relating the two
(®̂2) is positive and significant. The same holds true for all items for which disagreement
indicates a strong sense of personal control (i.e. l3, l5,and l7). For the remaining items (i.e.
l4 and l6) disagreement indicates a lack of personal control which is consistent with ®̂4 and
15Another alternative is to set the variance of LC∗ to unity.16Recall that higher values of the locus of control indicator variables reflect higher levels of disagreement
with the underlying statement.
14

®̂6 being significant and negative. Taken together, these estimated factor loadings imply
that higher values of the latent variable indicate a more internal locus of control.
5.2 Secondary School Completion
Table 3 presents the marginal effect of a change in each of our explanatory variables on (i)
secondary school completion; (ii) receipt of a university entrance rank; and (iii) university
entrance ranking. The level of statistical significance (denoted by stars) is based upon the
significance of the underlying parameter in the probit model.17
[Table 3 here]
We find that there is a relationship between young people’s sense of control over
their lives and their chances of having completed secondary school by age 18. Specifically,
moving from the 25th to the 75th percentile of the locus of control scale is associated with
an increased probability of completing secondary school of 6.1pp (see column 1). Although
significant only at the 10th percent level, this estimate is nonetheless economically sizeable.
Its effect is almost as large as the advantage associated with living with both biological
parents at age 14 (6.5pp), for example, and is larger than the relative effect of having a
mother with a secondary school education (5.4pp). To put this in the context of the
international literature, this result can also be expressed as a one standard deviation change
in the extent to which a young person has an internal locus of control being associated with
a 4.5 percentage point (pp) increase in the probability of secondary school completion.18
This is remarkably consistent with Coleman and DeLeire (2003) who also find that a one
standard deviation increase in youths’ sense of control results in a 2 to 3pp increase in the
probability of completing high school in the United States.
Not surprisingly, young people growing up in economic and social disadvantage have
lower secondary school completion rates. In particular, youth in families with a history of
welfare receipt are between 2.9 and 9.9pp less likely to have completed secondary school
17Results available upon request.18Latent locus of control is assumed to be distributed normal with mean zero and variance ¾2
ℓ . Themarginal effect of moving from one percentile of the latent locus of control scale to another is calculatedby using the estimated standard deviation of latent locus of control (see Table 2). Becoming more internalby one standard deviation (¾̂l = 1.020) increases the probability of completing secondary school by 4.5percentage points. This figure is calculated as the marginal effect (evaluated at the means of the explanatoryvariables) of a continuous variable in a probit model where the change is by a standard deviation, Φ(Xˆ̄)⋅¾̂l⋅°̂.
15

by age 18 than are their peers in families with no welfare history. Exposure to prolonged
disadvantage (i.e. more than six years) while growing up appears to be particularly detri-
mental and young people in this situation have secondary school completion rates that are
9.9pp lower. The effect of shorter periods of disadvantage (i.e. less than six years) appears
to be related to the age at which young people first experienced welfare receipt. Exposure
to disadvantage when aged 6 - 10 years old (i.e. just at the start of primary school) is
linked to a 8.0pp lower probability of completing secondary school by age 18. Earlier (i.e.
before school age) or later (i.e. late primary) exposure is associated with an economically
sizeable, but much smaller and statistically insignificant, gap in the chances of completing
12th grade.
An individual’s demographic characteristics and family background are also signifi-
cantly related to the chances of having completed secondary school by age 18. Consistent
with the literature (see d’Addio, 2007 for a review), higher parental education is associated
with higher secondary school completion rates. Young people have an 8.8pp higher likeli-
hood of finishing secondary school if their fathers’ have university degrees (as opposed to
leaving school before completing 12th grade) and a 3.6pp (5.4pp) higher probability of grad-
uation if their mothers have university degrees (completed 12th grade). Moreover, young
people who lived with both parents at age 14 are more likely to have completed secondary
school by age 18 (5.4pp), although we find no evidence of a significant relationship between
parental investment in their children’s education as measured by reading at night or help-
ing with homework and completion rates once everything else is controlled. Young people
with at least one foreign-born parent from a non-English-speaking country have a much
higher probability of completing secondary school (12pp), though young people with an
English-speaking background immigrant parent graduate at the same rate as those youth
with Australian-born parents. These differences are consistent with previous research (see,
for example, Larum and Beggs, 1989) and most likely stem from the highly-skilled nature
of immigration to Australia, particularly that from Asian countries. Indigenous youth are
17pp less likely to have completed secondary school by age 18, while young men are less
likely (12pp) to graduate than are young women.
16

Finally, young people who start school at younger ages will be more likely to have
completed secondary school by age 18. In two Australian jurisdictions (Queensland, and
Western Australia) the cutoff date for beginning school is January 1, the midpoint of the
period October – March in which our sample is being born. The entire birth cohort is
eligible to begin school in the same year in other jurisdictions. Consequently, we expect
the effect of an early (vs. late) birth on completion rates to be larger in Queensland and
Western Australia than elsewhere because the cutoff date for starting school will bind for
some families with younger children forcing them to delay the start of school until the next
year. We account for this through interaction terms between (i) being born in Queensland
or Western Australia and (ii) being born between October and December 1987 (early born).
We find results that are consistent with these differences in school starting ages. Not
surprisingly, young people who were born early in the period (October to December 1987)
are 16.7pp more likely to complete secondary school by age 18 than are young people who
are born late (January - March 1988). More importantly, this marginal effect of an early
birth is 3.6pp higher in Queensland and Western Australia than in the rest of Australia.
5.3 University Entrance Rank Receipt
We turn now to consider the determinants of having met the curriculum requirements nec-
essary to be awarded a university entrance rank upon completion of secondary school. The
marginal effect of a change in each explanatory variable on the probability of a graduate
receiving an entrance rank is reported in column 2 of Table 3.
Having an internal locus of control is associated with a higher likelihood that gradu-
ates have qualified for a ranking for university entrance. A one standard deviation increase
in the degree to which one has an internal locus of control is associated with a 2.9pp increase
in the probability of obtaining a university entrance rank. Thus, moving from the 25th to
the 75th percentile of the locus of control distribution is related to a 7.1pp increase in the
probability of obtaining an entrance ranking at graduation. The magnitude of this effect is
relatively large and is roughly equivalent to that of having immigrant parents from a non-
English-speaking country or (in the opposite direction) having a family history of moderate
welfare receipt starting at age 6-10.
17

A family’s experiences with the welfare system is closely related to the likelihood that
its 18-year old children receive a university entrance rank upon graduation from secondary
school. The most disadvantaged young people (i.e., those experiencing six years or more of
parental welfare receipt) are 19.8pp less likely to receive a ranking. Moderate (i.e. less than
six years) disadvantage is also related to the receipt of entrance rankings with disadvantage
early in life mattering most. Specifically, those graduates first exposed to disadvantage in
their preschool ages (0 - 6) experience the largest gap in the receipt of a ranking (9.9pp),
followed by those experiencing moderate disadvantage for the first time between the ages
of 6 and 10 (7.8 pp). Young people exposed to the welfare system for the first time in
adolescence (10 - 16 years old) are also less likely to obtain a ranking (3.7pp), although this
relationship is not statistically significant.
The probability of meeting the curriculum requirements necessary to obtain a uni-
versity entrance ranking is also related to an individual’s demographic characteristics and
family background (see Table 3). Male (2.8pp) and indigenous (17.5pp) youth, for example,
are less likely to obtain a university entrance rank upon graduation from secondary school
than are their female and non-indigenous peers. While young people who lived with both
parents at age 14 are more likely to complete secondary school (see Section 5.2), condi-
tional upon completion they are no more likely to obtain a ranking for university entrance.
However, youths whose parents read to them before they went to bed as a child have a
significantly higher probability of obtaining a university entrance rank (5.8pp) suggesting
that they have additional skills or aspirations that make university study more likely. The
relationship between parents helping adolescents with their homework and achieving a uni-
versity entrance rank (5.3pp) is, somewhat surprisingly, significantly negative almost exactly
canceling the benefits of reading at night. This negative relationship is consistent with the
possibility that young people struggling in school might be more likely to get help from their
parents. Parental education–both of mothers and fathers–is closely linked to youth people’s
propensity to obtain a ranking for university entrance. In particular, young people are
significantly more likely to obtain a university entrance ranking if their fathers completed
secondary school or if their mothers have degrees. Finally, young people with immigrant
parents from non-English-speaking backgrounds are not only more likely to complete sec-
18

ondary school (11.8pp), but are also more likely to obtain a ranking for university entrance
when they do (4.6pp).
5.4 Percentile University Entrance Rankings
Australian universities offer admission to specific programs to applicants in rank order.
Thus, while obtaining a university entrance rank is necessary for university study, it is not
sufficient. It is the percentile ranking itself that determines to which university and to which
degree program a student will be admitted. Programs in law or medicine, for example, are
very competitive and typically require entrance rankings in the 99th percentile, while in
first-tier universities almost all programs require rankings in the top quartile for admission.
Students with rankings toward the bottom of the scale are usually not offered any placement
at all. These institutional arrangements imply that the options open to students can be
strongly influenced by relatively small changes in their university entrance rankings.
We use a censored regression model in combination with our measurement model
to estimate the relationship between students sense of control over their lives and their
university entrance rankings (see Section 4.3).19 These results are conditional upon young
people having completed 12th grade and having obtained a university entrance ranking (see
Table 3).
We find that moving from the 25th to the 75th percentile of the locus of control
ranking is associated with an increase in students’ university entrance rankings of 1.31
percentiles (see column 3). Alternatively, a one standard deviation change in the extent to
which one is internal is associated with an increase of less than one (0.95) percentiles in ones
university ranking. Thus, the effect of locus of control on students’ percentile rankings is
relatively small in comparison to its effect on the probability of completing secondary school
or, conditional on graduation, receiving a ranking at all.
Young people growing up in the most socio-economically disadvantaged households
obtain, on average, university entrance rankings that are 4.3 percentiles lower than their
peers in families with no exposure to the welfare system. Intermediate exposure to disad-
vantage (i.e. less than six years), however is not statistically related to a student’s percentile
ranking conditional on receiving one. To the extent that intermediate levels of disadvantage
19Rankings are censored at 30 below (n=17) and 99.99 (n=4) above.
19

affect students’ educational outcomes, the effect appears to operate through graduation rates
and curriculum requirements, not through the academic performance of graduates meeting
those requirements.
At the same time, family background seems particularly relevant for understanding
performance. Young people achieve significantly higher rankings if their parent’s were in-
volved in their education either by reading to them at night (3.3 percentiles) or by helping
them with homework (3.4 percentiles) when they were younger. Parental education is also
linked to better performance, with young people achieving higher rankings if their mothers
(4.9 percentiles) and fathers (3.7 percentiles) completed secondary school than if they did
not. Finally, having an immigrant parent from a non-English-speaking country is associated
with an increased ranking of 2.8 percentiles.
Interestingly, students’ demographic characteristics are statistically unrelated to their
entrance rankings conditional on achieving one. There is a gender gap of 3.8 percentiles
in the rankings of young women relative to young men and a gap of 7.3 percentiles for
indigenous youth relative to their non-indigenous peers. This latter gap is significant is not
statistically significant at conventional levels which most likely reflects imprecision of our
estimates given the very small number of indigenous students in our sample.
5.5 Sensitivity Analysis
The above evidence strongly suggests that young people’s educational attainment and
achievement are linked to the sense of control they have over their lives. Here we con-
sider the sensitivity of our results to: first, the conditioning on specific subsamples and
second, the use of our measurement model.
Section 5.2 provides estimates of the effect of locus of control on secondary school
completion rates for the entire sample of 18-year-olds. The relationship between locus of
control and the receipt of a university entrance rank (Section 5.3), however, is estimated
only for secondary school graduates. Similarly, we estimate the determinants of percentile
university rankings only for those graduates who receive one (Section 5.4). This focus on
specific subsamples is useful in isolating the impact of locus of control on specific educational
outcomes. However, estimation conditional on prior educational outcomes may underesti-
20

mate the overall effect of locus of control because there is likely to be non-random sample
selection due to incidental truncation. Specifically, we do not observe whether or not an
individual would receive a university entrance if he or she has not completed secondary
school. Moreover, individuals who have not completed secondary school are likely to have
characteristics that make them less likely to meet the requirements to receive a university
entrance rank. Consequently, our estimates represent an underestimate of the effect of locus
of control on the receipt of an entrance score across the entire population of students. A
similar problem pertains to estimates in the model of the percentile ranking itself.
Given the complexity of the model, it is not possible to incorporate a selection equa-
tion to account for this truncation problem.20 We can, however, gauge the extent to which
we are underestimating the effect of locus of control by using information about institutional
differences in school starting ages (i.e. interactions on early versus late births and living in
Queensland or Western Australia) as instruments in the model of entrance rank receipt.21
As expect, this resulted in a larger association between an individual’ locus of control and
his or her chances of receiving a university entrance rank. Specifically, moving from the
25th to the 75th percentile of the locus of control distribution is associated with an increase
of 7.6pp in the probability of obtaining an entrance ranking when we use instruments to ac-
count for incidental truncation in comparison to 7.1pp when we do not (see Table 3). This
difference of 6.6 percent suggests that we are not grossly underestimating the effect of locus
of control by conditioning on secondary school completion. Unfortunately, we do not have
plausible instruments for identifying the probability of receiving an entrance rank separately
to the percentile ranking itself making it impossible to test the sensitivity of the estimated
relationship between locus of control and percentile entrance rankings. Consequently, our
results should be regarded as a conservative estimate of the total effect.
Finally, we consider our results would change if we had adopted the standard approach
in the literature and used ad hoc weights to created a single locus of control index rather
than using our measurement model to simultaneously use the information from multiple
indicators of latent locus of control. We investigate this by using standard probit models to
20The maximization algorithm failed to converge in this extended model most likely because the likelihoodfunction did not have sufficient curvature for us to identify the global maximum.
21These institutional arrangements affect school starting ages, but have no obvious relationship to thereceipt of a university entrance rank conditional on graduating from secondary school. Hence they meet thenecessary exclusion restriction.
21

estimate the effect of a standardized index of locus of control which weights each indicator
equally on (i) secondary school completion and (ii) the receipt of a university entrance
rank.22 A censored regression is used to estimate the effect of this locus of control index on
(iii) percentile rankings themselves.
The use of an index based on equal weights results in an estimated marginal effect of
moving from the 25th to the 75th percentile of the locus of control index on secondary school
completion of 0.057. In comparison, the estimated marginal effect when we take advantage
of the measurement model is 0.061 (see Table 3). The use of an ad hoc index in this case
slightly understates the estimated relationship between a young person’s sense of control
and the probability that he or she completes secondary school. The estimated marginal
effect of locus of control on the probability of obtaining a university entrance ranking is also
understated when we use an equal-weight index (0.063 versus 0.071), while the estimated
marginal effect of locus of control on individuals’ percentile rankings is virtually the same
(1.34 versus 1.31).
5.6 Is Locus of Control Linked to Disadvantage?
Previous researchers have argued that welfare receipt can influence recipients’ non-cognitive
skills such as self-esteem (Elliott, 1996) and locus of control (Gottschalk, 2005). We know
very little, however, about the effect of a family’s welfare history on the non-cognitive skills,
in particular locus of control, of its young adult members. The concern is that growing up in
disadvantage may play an indirect role in limiting educational attainment and achievement
by reducing adolescents’ sense of control over their lives.
We investigated this issue using a model in which (latent) locus of control is regressed
on our measures of socio-economic disadvantage both with and without controls for demo-
graphic characteristics (gender and indigenous status) and family background (parental
education, immigrant parents, and parental investment in education). As before, we use
responses to each of the seven items in the Pearlin and Schooler (1978) Mastery Scale to
generate imperfect indicators of individuals’ latent locus of control. These indicators are
incorporated separately into a model which is similar to the one estimated in Sections 5.2
22We created this index by rescaling items in the Pearlin and Schooler (1978) scale so that higher valueson each item reflect a more internal locus of control, summing individual responses to these seven items,and then standardizing the result to have a mean of zero and a variance of one.
22

- 5.4. In this case, however, locus of control is the dependent rather than independent
variable. Results (coefficients) for our measures of family welfare history are presented in
Table 4.
We find that when we do not control for demographic and other family background
characteristics having a family history of intensive welfare receipt (i.e. more than six years)
while growing up is significantly related to having a more external locus of control. Having
a family history of moderate welfare receipt, irrespective of when it occurs, however, is not
significantly related to young people’s sense of control over their lives. Once we control for
demographic and family background characteristics the estimated coefficient on intensive
welfare receipt falls (in absolute terms) from -0.150 to -0.116 standard deviations and be-
comes statistically insignificant. Thus, there is little evidence that young people growing
up in extreme disadvantage have a more external locus of control once other factors are
taken into account. Consequently, it is unlikely that disadvantage has an indirect effect on
youths’ educational outcomes by leading them to feel less in control of their lives.
6 Conclusions
Human capital investment is often at the core of public policies designed to assist individuals—
in particular the young, disadvantaged, or socially-excluded—in becoming more self-reliant.
It is not surprising, then, that researchers’ attention has increasingly turned towards in-
vestigating the complex role that non-cognitive skills like locus of control play in human
capital formation. In particular, we would like to understand why some individuals invest
more than others in ensuring good outcomes for themselves and whether believing that life’s
events are outside one’s control leads to a lack of human capital investment.
This paper makes an important contribution to these efforts by analyzing the rela-
tionship between young people’s educational outcomes and their sense of control over their
lives. Our estimation model advances the literature by allowing for differences in the re-
sponse error associated with each separate locus of control indicator thus avoiding the need
to create a single index through the use of ad hoc weights. Moreover, our data are unique
in allowing us to account for the effects of socio-economic disadvantage in a very detailed
way.
23

Our results clearly indicate that having an internal locus of control is associated
with more positive educational outcomes. In particular, we find that young people with
a more internal locus of control are more likely to finish secondary school and to meet the
necessary requirements to be assigned a university entrance rank upon graduation. Those
with an internal locus of control who obtain a university entrance rank achieve somewhat
higher rankings than do their peers who have a more external locus of control. At the
same time, we find that socio-economic disadvantage is associated with large gaps in the
educational attainment and academic achievement of young people. This disparity in the
educational outcomes of youths growing up in disadvantage does not appear to be the result
of an indirect effect of disadvantage on the development of a more external locus of control
however. There is no significant relationship between family welfare history and young
people’s locus of control once other factors are taken into account.
These results are important in furthering our understanding of the relationship be-
tween young people’s educational outcomes and their sense of control over their lives. At the
same time, they leave a number of important issues unresolved. In particular, it is impor-
tant that we know more about whether or not the association between locus of control and
educational outcomes represents a causal effect and, if so, the mechanism through which it
operates. Unfortunately, our data do not allow us to account for individual-specific hetero-
geneity in our estimation and we, therefore, have been cautious in interpreting our results
as associations rather than causal effects. Experimental evidence, however, suggests that
at least some of what we are measuring is likely to be causal (Leininger and Kalil, 2008).
Moreover, the mechanisms through which locus of control affect human capital investments
are not well understood. Making progress in this area is often hampered by the complex
relationship between various non-cognitive skills. There is often a very close link between
an individual’s locus of control and dimensions of his or her personality for example, while
Ross and Broh (2000) argue that the apparent benefits of high self-esteem for academic
achievement are in fact the result of having an internal locus of control. These linkages
often make it difficult to isolate the effects of locus of control per se. Finally, we need to
understand what these results imply for policy development. Can we design policy inter-
ventions to promote adolescents’ sense of control over their lives? Thus far, there is little
24

evidence that academic achievement can be improved by programs which specifically target
adolescents’ non-cognitive skills (see Holmlund and Silva, 2009, for a review). Psycholo-
gists argue, however, that parenting style may contribute to adolescents’ sense of control (see
McClun and Merrel, 1998) opening up the possibility for policy makers to target parenting
skills directly. Most importantly, how can we close the gaps associated with socio-economic
disadvantage? Answering this question is critical because the relative lack of educational
attainment and academic achievement among young people growing up in disadvantage will
almost certainly result in further gaps in their labor market opportunities, health status,
and overall wellbeing over the course of their lives.
25

References
Andrisani, P. J. (1977). Internal-external attitudes, personal initiative, and the labor marketexperience of black and white men. The Journal of Human Resources 12 (3), 308–328.
Borghans, L., H. M. and B. Weel (2008). The role of noncognitive skills in explainingcognitive test scores. Economic Inquiry 46 (1), 2–12.
Borghans, L., A. L. Duckworth, J. J. Heckman, and B. ter Weel (2008, February). Theeconomics and psychology of personality traits. Working Paper 13810, National Bureauof Economic Research.
Breunig, R., D. Cobb-Clark, T. Gorgens, and A. Sartbayeva (2007, September). User’s guideto the Youth in Focus Project, version 1.0. Youth in Focus Project Discussion PaperSeries No. 1, The Australian National University, Research School of Social Sciences(Economics Program), Canberra, Australia.
Cardak, B. A. and C. Ryan (2006, June). Why are high ability individuals from poorbackgrounds under-represented at university? Discussion Paper No. A06.04, La TrobeUniversity, Melbourne, Australia.
Cebi, M. (2007). Locus of control and human capital investment revisited. Journal ofHuman Resources 42 (4), 919932.
Centrelink (2007). A guide to Australian government payments.<http://www.centrelink.gov.au/internet/internet.nsf/filestores/> (accessedJanuary 2008 ).
Coleman, M. and T. DeLeire (2003). An economic model of locus of control and the humancapital investment decision. The Journal of Human Resources 38 (3), 701–721.
Cunha, F. and J. Heckman (2007). The technology of skill formation. American EconomicReview 97 (2), 3147.
d’Addio, A. C. (2007). Intergenerational transmission of disadvantage: Mobility or immo-bility across generations? A review of the evidence for OECD countries. OECD Social,Employment and Migration Working Papers 52, OECD, Paris, France.
Dohmen, T., A. Falk, D. Huffman, and U. Sunde (2006, October). The intergenerationaltransmission of risk and trust attitudes. IZA Discussion Paper No. 2380, Institute for theStudy of Labor—IZA, Bonn, Germany.
Elliott, M. (1996). Impact of work, family, and welfare receipt on women’s self-esteem inyoung adulthood. Social Psychology Quarterly 59 (1), 80–95.
Gatz, M. and M. J. Karel (1993). Individual change in perceived control over 20 years.International Journal of Behavioral Development 16 (2), 305–322.
Gottschalk, P. (2005). Can work alter welfare recipients’ beliefs? Journal of Policy Analysisand Management 24 (3), 485–498.
Groves, R. M., F. J. Fowler, M. P. Couper, J. M. Lepkowski, E. Singer, and R. Tourangeau(2004). Survey Methodology. New Jersey, USA: Wiley-Interscience.
26
Heckman, J. J., J. Stixrud, and S. Urzua (2006, July). The effects of cognitive and noncog-nitive abilities on labor market outcomes and social behavior. Journal of Labor Eco-nomics 24 (3), 411.
Holmlund, H. and O. Silva (2009). Targeting non-cognitive skills to improve cognitiveoutcomes: Evidence from a remedial education intervention. IZA Discussion Papers 4476,Institute for the Study of Labor (IZA).
Kalil, A., W. Kanjanapan, and A. Sartbayeva (2010). Non-cognitive skills and the transitionto adulthood for Australian youth. Australian Government Department of Education,Employment and Workplace Relations (deewr), Paper prepared for presentation at theAnnual Meetings of the Population Association of America, Dallas TX, April 2010.
Ku, I. and R. Plotnick (2003). Do children from welfare families obtain less education?Demography 40 (1), 151–170.
Kunz, J. and A. Kalil (1999). Self-esteem, self-efficacy, and welfare use. Social WorkResearch 23 (2), 119–126.
Larum, J. and J. J. Beggs (1989). What drives Australian teenage labour force participation?The Australian Journal of Statistics 31A, 125–142.
Le, A. T. and P. W. Miller (2005). Participation in higher education: equity and access?The Economic Record 81, 152–165.
Leininger, L. J. and A. Kalil (2008). Cognitive and non-cognitive predictors of successin adult education programs: Evidence from experimental data with low-income welfarerecipients. Journal of Policy Analysis and Management 27 (3), 521–535.
Lillard, L. A. and C. W. Panis (2003). aML User’s Guide and Reference Manual, Version2. Los Angeles, California, USA: EconWare.
Marks, G., N. Fleming, M. Long, and J. McMillan (2000). Patterns of participation inYear 12 and higher education in Australia: Trends and issues, Longitudinal Surveys ofAustralian Youth. Research Report 17, Australian Council for Educational Research,Melbourne, Australia.
Marks, G. N., J. McMillan, and K. Hillman (2001). Tertiary entrance performance: the roleof student background and school factors. Research Report 22, Australian Council forEducational Research, Longitudinal Surveys of Australian Youth, Melbourne, Australia.
McClun, L. A. and K. W. Merrel (1998). Relationship of perceived parenting styles, lo-cus of control orientation, and self-concept among high age students. Psychology in theSchools 35 (4), 381–390.
Osborne-Groves, M. (2005). How important is your personality? Labor market returns topersonality for women in the US and UK. Journal of Economic Psychology 26, 827841.
Pearlin, L. I. and C. Schooler (1978, Mar.). The structure of coping. Journal of Health andSocial Behavior 19 (1), 2–21.
Ross, C. E. and B. A. Broh (2000). The roles of self-esteem and the sense of personal controlin the academic achievement process. Sociology of Education 73, 270–284.
Rotter, J. (1966). Generalized expectancies of internal versus external control of reinforce-ments. Psychological Monographs 80.
27

Wang, L.-Y., E. Kick, J. Fraser, and T. J. Burns (1999). Status attainment in America :The roles of locus of control and self-steem in educational and occupational outcomes.Sociological Spectrum 19, 281–298.
28

Tab
le1:
Educa
tionalAttainmentand
Ach
ievementbyLocu
sofControland
Socio-E
conomic
Disadvantage.
Secondary
School
Obtained
University
University
Variables
Completion
Entrance
Rank
Entrance
Rank
Mean∗∗
∗Std.Dev.
Mean∗∗
∗Std.Dev.
Mean∗∗
∗Std.Dev.∗∗∗
LocusofControl
Icannot
solvesomeof
myproblems
Agree
0.624∗
∗∗(0.485)
0.682∗∗
∗(0.466)
74.9
∗∗∗
(18.0)
Disagree
0.708∗
∗∗(0.455)
0.696∗∗
∗(0.460)
73.6
∗∗∗
(17.2)
Ifeel
beingpushed
arou
ndin
life
Agree
0.676∗
∗∗(0.468)
0.673∗∗
∗(0.469)
73.5
∗∗∗
(16.7)
Disagree
0.699∗
∗∗(0.459)
0.707∗∗
∗(0.455)
74.0
∗∗∗
(17.7)
Ihavenocontrol
over
things
hap
pen
ningto
me
Agree
0.612∗
∗∗(0.488)
0.642∗
∗∗(0.480)
71.2
∗∗∗
(17.0)
Disagree
0.705∗
∗∗(0.456)
0.701∗
∗∗(0.458)
74.2
∗∗∗
(17.3)
Icandoan
ythingIsetmymindto
Agree
0.701∗
∗∗(0.458)
0.700∗
∗∗(0.458)
73.8
∗∗∗
(17.1)
Disagree
0.602∗
∗∗(0.490)
0.626∗
∗∗(0.485)
73.4
∗∗∗
(19.9)
Ifeel
helpless
indealingwithmyproblems
Agree
0.629∗
∗∗(0.483)
0.672∗∗
∗(0.470)
73.3
∗∗∗
(16.9)
Disagree
0.719∗
∗∗(0.449)
0.702∗∗
∗(0.458)
74.0
∗∗∗
(17.5)
What
hap
pen
sto
memostlydep
endson
me
Agree
0.696∗
∗ ∗(0.460)
0.696∗∗
∗(0.460)
73.8
∗∗∗
(17.4)
Disagree
0.621∗
∗ ∗(0.486)
0.650∗∗
∗(0.479)
74.4
∗∗∗
(16.8)
Thereis
little
Icandoto
chan
gethings
inmylife
Agree
0.591∗
∗∗(0.492)
0.613∗
∗∗(0.488)
72.2
∗∗∗
(17.5)
Disagree
0.710∗
∗∗(0.454)
0.706∗
∗∗(0.456)
74.0
∗∗∗
(17.3)
Socio-economic
background(b)
You
thunexposed
todisad
vantage
0.776∗∗
∗(0.417)
0.768∗∗
∗(0.422)
75.1
∗∗∗
(17.1)
You
thexposed
tosixor
moreyears
ofdisad
vantage
0.549∗
∗∗(0.498)
0.537∗
∗∗(0.499)
69.4
∗∗∗
(18.4)
You
thexposed
todisad
vantage
when
aged
10+
years
0.686∗
∗∗(0.464)
0.684∗
∗∗(0.465)
71.6
∗∗∗
(18.1)
You
thexposed
todisad
vantage
when
aged
6-10
years
0.684∗
∗∗(0.465)
0.658∗
∗∗(0.475)
72.9
∗ ∗∗
(16.8)
You
thexposed
todisad
vantage
when
aged
less
than
6years
0.640∗
∗∗(0.481)
0.628∗
∗∗(0.484)
72.7
∗∗∗
(16.8)
Notes:
Standard
errors
inparenth
eses.
∗∗∗ ,
∗∗and
∗den
otesth
atth
edifferen
ceis
statisticallydifferen
tfrom
0atth
e1%,5%
and10%
level.
(a)Descriptionofindex
...stronglyagree
oragree
withth
estatemen
tin
thequestion,andvaluezero
ifth
eydisagree
orstronglydisagree.
(b)Thediferen
cein
mea
nstestsco
mpare
allgroupsagainst
those
withnohistory
ofinco
mesu
pport.
Source:
Auth
ors’ca
lculationsusingdata
from
theYouth
inFocu
sdata
wave1.

Table 2: Measurement Model Results: The Estimated Effect of Locus of ControlIndicators on Latent Locus of Control.
Secondary School Obtained University UniversityMeasurement Model’s Variables(a) Completion Entrance Rank Entrance Rank
I cannot solve some of my problems (®1) 1.00(b) 1.00(b) 1.00(b)
I feel being pushed around in life (®̂2 ) .903 .903 .899(.065) (.059) (.091)
I have no control over things happenning to me (®̂3) 1.150 1.153 1.238(.091) (.077) (.139)
I can do anything I set my mind to (®̂4) −.576 −.578 −.651(.047) (.043) (.073)
I feel helpless in dealing with my problems (®̂5) 1.107 1.107 1.206(.079) (.071) (.119)
What happens to me mostly depends on me (®̂6) −.403 −.406 −.346(.044) (.035) (.059)
There is little I can do to change things in my life(®̂7)
.671 .674 .664
(.052) (.046) (.071)
¾̂ℓ(c) 1.020 1.015 0.985
(.053) (.049) (.070)
Notes: Heteroscedasticity-robust Standard errors in parentheses.(a) The locus of control variables take four values: 1 if strongly agree, 2 if agree, 3 if disagree, and 4 if strongly disagree. Theinterpretation of the locus of control latent variable, therefore, corresponds to higher values (positive) for internals and lowvalues (negative) for externals.(b) Set to 1.(c) Estimated standard deviation for the latent locus of control, LC∗. LC∗ ∼ N(0, ¾2
ℓ ). All parameters in the models,including the ones reported in this table, are estimated jointly by maximum likelihood.
30
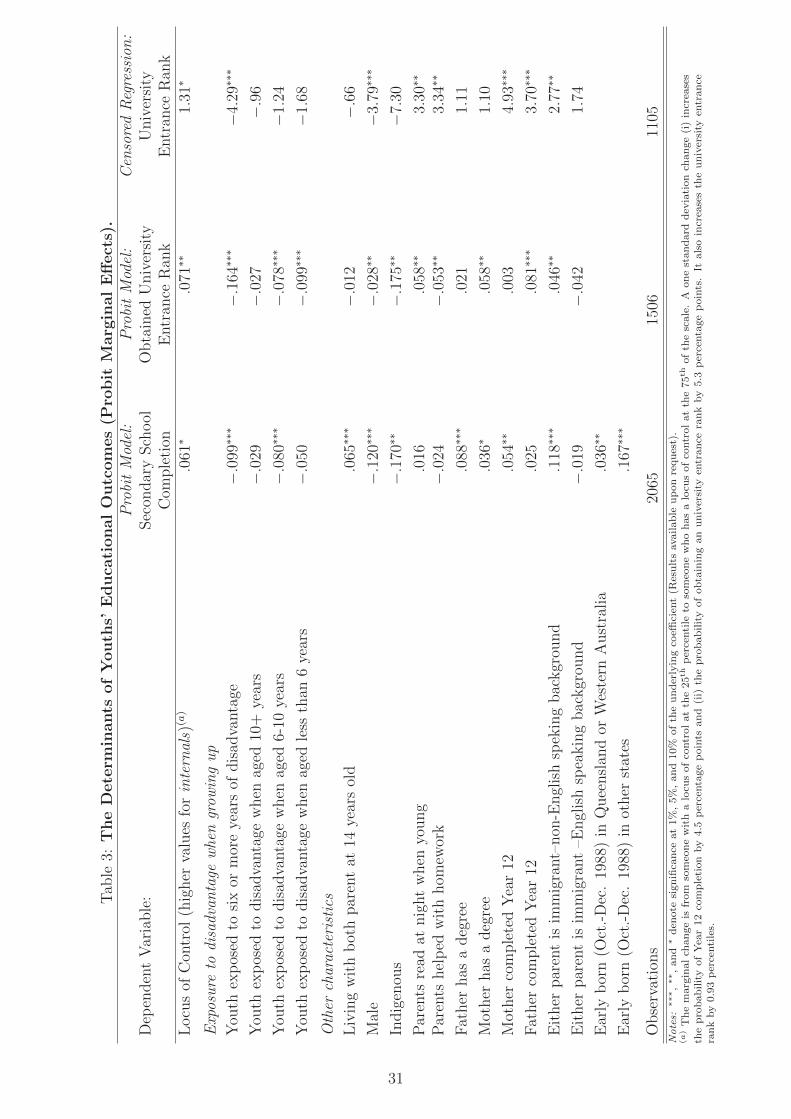
Tab
le3:
TheDeterm
inants
ofYouth
s’Educa
tionalOutcomes(P
robit
Marg
inalEffects).
ProbitModel:
ProbitModel:
Cen
soredRegression:
Dep
endentVariable:
Secon
darySchool
Obtained
University
University
Com
pletion
Entran
ceRan
kEntran
ceRan
k
Locusof
Con
trol
(higher
values
forinternals)
(a)
.061
∗.071
∗∗1.31
∗
Exposure
todisadvan
tage
whengrow
ingup
You
thexposed
tosixor
moreyearsof
disad
vantage
−.099∗
∗∗−.
164∗
∗∗−4
.29∗
∗∗
You
thexposed
todisad
vantage
when
aged
10+
years
−.029
−.027
−.96
You
thexposed
todisad
vantage
when
aged
6-10
years
−.080∗
∗∗−.
078∗
∗∗−1
.24
You
thexposed
todisad
vantage
when
aged
less
than
6years
−.050
−.099∗
∗∗−1
.68
Other
characteristics
Livingwithbothparentat
14yearsold
.065
∗∗∗
−.012
−.66
Male
−.120∗
∗∗−.
028∗
∗−3
.79∗
∗∗
Indigenou
s−.
170∗
∗−.
175∗
∗−7
.30
Parents
read
atnightwhen
young
.016
.058
∗∗3.30
∗∗
Parents
helped
withhom
ework
−.024
−.053∗
∗3.34
∗∗
Father
has
adegree
.088
∗∗∗
.021
1.11
Mother
has
adegree
.036
∗.058
∗∗1.10
Mother
completedYear12
.054
∗∗.003
4.93
∗∗∗
Father
completedYear12
.025
.081
∗∗∗
3.70
∗∗∗
Either
parentisim
migrant–non
-Englishspekingbackgrou
nd
.118
∗∗∗
.046
∗∗2.77
∗∗
Either
parentisim
migrant–E
nglishspeakingbackgrou
nd
−.019
−.042
1.74
Early
born(O
ct.-Dec.1988)in
Queenslan
dor
Western
Australia
.036
∗∗
Early
born(O
ct.-Dec.1988)in
other
states
.167
∗∗∗
Observations
2065
1506
1105
Notes:
∗∗∗ ,
∗∗,and
∗den
ote
significa
nce
at1%,5%,and10%
ofth
eunderlyingco
efficien
t(R
esultsavailable
uponrequest).
(a)Themarginalch
angeis
from
someo
newithalocu
sofco
ntrolatth
e25th
percentile
tosomeo
newhohasalocu
sofco
ntrolatth
e75th
ofth
escale.A
onestandard
dev
iationch
ange(i)increa
ses
theprobabilityofYea
r12co
mpletionby4.5
percentagepoints
and(ii)
theprobabilityofobtaininganuniversity
entrance
rankby5.3
percentagepoints.It
alsoincrea
sesth
euniversity
entrance
rankby0.93percentiles.
31

Table 4: The Effect of Socio-Economic Disadvantage on Youths’ Locus of Control.
Dependent Variable: Latent Locus of Control Model With ModelNo Controls With Controls
Disadvantage Variable Coefficient CoefficientIn terms of Standard Deviations of the Dependent Variable:
Youth exposed to six or more years of disadvantage −.147∗∗ −.116
Youth exposed to disadvantage when aged 10+ years −.079∗∗ −.039
Youth exposed to disadvantage when aged 6-10 years −.028∗∗ −.056
Youth exposed to disadvantage when aged less than 6 years −.010∗∗ −.031
Observations 2065 2065
Note: The figures come from a model in which latent Locus of Control is regressed on disadvantage variables. Regressorsinclude gender, parental education, parent’s non-pecuniary, indigenous indicator, parental immigration status. ∗∗∗, ∗∗, and ∗denote significance at 1%, 5%, and 10% of the underlying coefficient.
32

Table A1: Variable Definition and Sample Descriptive Statistics.Variable definition Mean Std.Dev. Min. Max Obs.=1 if individual had completed Year 12at interview, =0 otherwise
.717 (.451) 0 1 3723
University entrance score, 0 for thosewho did not take it
50.348 (33.938) 0 99.98 2294
I cannot solve some of my problems 3.044 (.753) 1 4 2705
I feel being pushed around in life 2.751 (.811) 1 4 2702
I have no control over things happen-ning to me
3.131 (.709) 1 4 2699
I can do anything I set my mind to 1.756 (.657) 1 4 2696
I feel helpless in dealing with my prob-lems
2.834 (.781) 1 4 2698
What happens to me mostly dependson me
1.636 (.644) 1 4 2702
There is little I can do to change thingsin my life
3.125 (.703) 1 4 2701
Youth unexposed to disadvantage .252 (.434) 0 1 3723
Youth exposed to six or more years ofdisadvantage
.365 (.482) 0 1 3723
Youth exposed to disadvantage whenaged 10+ years
.127 (.333) 0 1 3723
Stratum D .102 (.302) 0 1 3723
Stratum F .054 (.226) 0 1 3723
Youth exposed to disadvantage whenaged less than 6 years
.100 (.300) 0 1 3723
Regional dummy variablesACT .013 (.115) 0 1 3723
VIC .250 (.433) 0 1 3723
WA .103 (.305) 0 1 3723
NT .003 (.057) 0 1 3723
QLD .218 (.413) 0 1 3723
SA .078 (.269) 0 1 3723
TAS .026 (.159) 0 1 3723
Characteristics=1 if youth is male, 0 otherwise .468 (.499) 0 1 3723
=1 if youth is indigenous, 0 otherwise .040 (.197) 0 1 3714
=1 if parent read to youth at night, 0otherwise
.471 (.499) 0 1 2715
=1 if parent helped youth with home-work, 0 otherwise
.554 (.497) 0 1 2717
=1 if youth lived with both parents atage 14, 0 otherwise
.664 (.472) 0 1 3711
=1 if youth’s father had a degree whenthe youth was aged 14, 0 otherwise
.539 (.499) 0 1 3188
=1 if youth’s mother had a degree whenthe youth was aged 14, 0 otherwise
.471 (.499) 0 1 3133
=1 if youth’s mother was a high schoolgraduate when youth was 14, 0 other-wise
.469 (.499) 0 1 3446
=1 if youth’s father was a high schoolgraduate when youth was 14, 0 other-wise
.409 (.492) 0 1 3446
=1 if either parent is immigrant fromnon-English-speaking country, 0 other-wise
.246 (.430) 0 1 3723
=1 if either parent is immigrant fromEnglish-speaking country, 0 otherwise
.164 (.370) 0 1 3723
Source: Author’s calculations based on data from Youth in Focus (YIF) data, wave 1.
33

Table A2: Items in the Pearlin-Schooler Scale.How strongly you agree or disagree with the following statements?(1) Strongly disagree; (2) Disagree; (3) Agree; and (4) Strongly agreeItem 1 I cannot solve some of my problemsItem 2 I feel being pushed around in lifeItem 3 I have no control over things happenning to meItem 4 I can do anything I set my mind toItem 5 I feel helpless in dealing with my problemsItem 6 What happens to me mostly depends on meItem 7 There is little I can do to change things in my life
Source: Author’s calculations based on data from Youth in Focus (YIF) data, wave 1.
34