Embed Size (px)
Citation preview
Are You FRETting?Are You FRETting?Find Out for Sure With Find Out for Sure With
FLIMFLIM
Frequency Domain FLIM Frequency Domain FLIM for Your Scopefor Your Scope
Intelligent Imaging Innovations
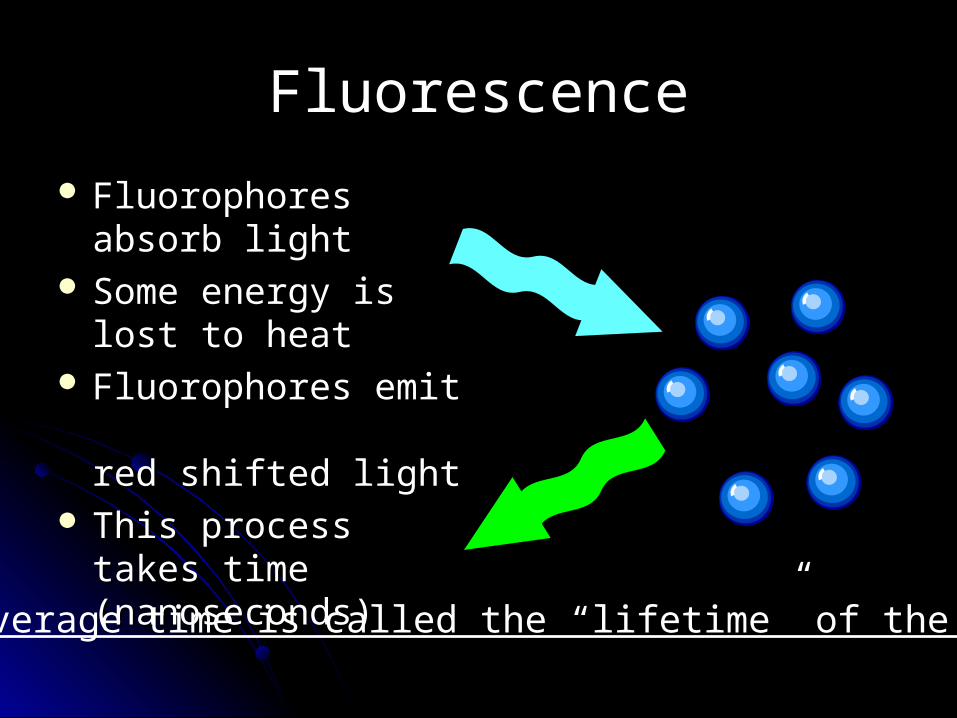
FluorescenceFluorescence
Fluorophores absorb Fluorophores absorb lightlight
Some energy is lost Some energy is lost to heatto heat
Fluorophores emit Fluorophores emit red shifted lightred shifted light
This process takes This process takes time (nanoseconds)time (nanoseconds)
The average time is called the “lifetime” of the probe
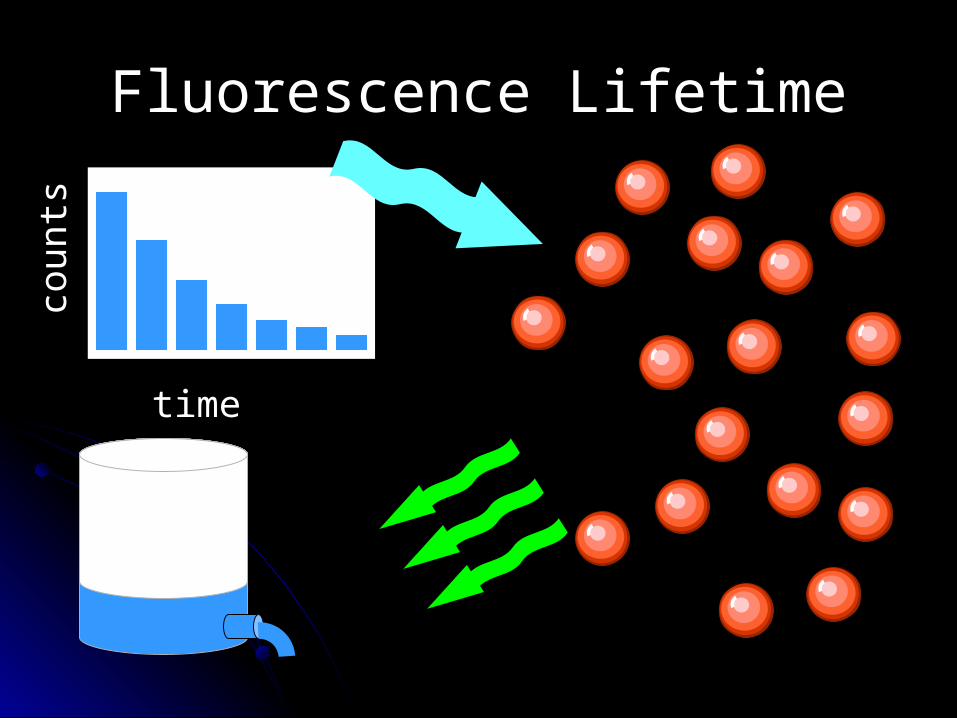
Fluorescence LifetimeFluorescence Lifetime
time
coun
ts
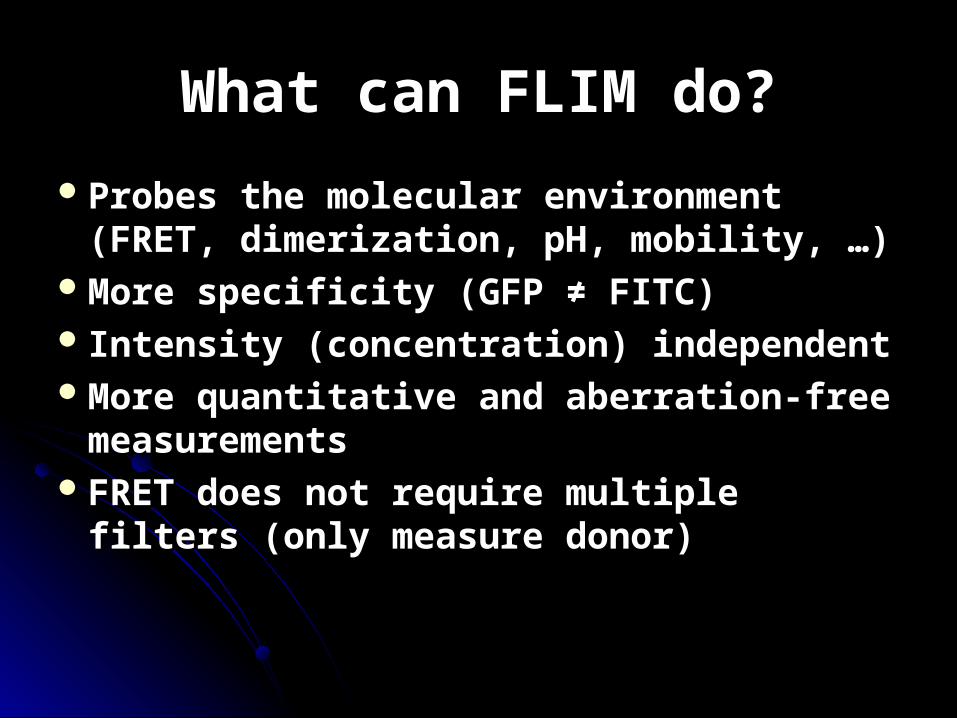
What can FLIM do?What can FLIM do?
Probes the molecular environment Probes the molecular environment (FRET, dimerization, pH, mobility, …)(FRET, dimerization, pH, mobility, …)
More specificity (GFP More specificity (GFP ≠ FITC)≠ FITC) Intensity (concentration) independent Intensity (concentration) independent More quantitative and aberration-free More quantitative and aberration-free
measurementsmeasurementsFRET does not require multiple filters FRET does not require multiple filters
(only measure donor)(only measure donor)
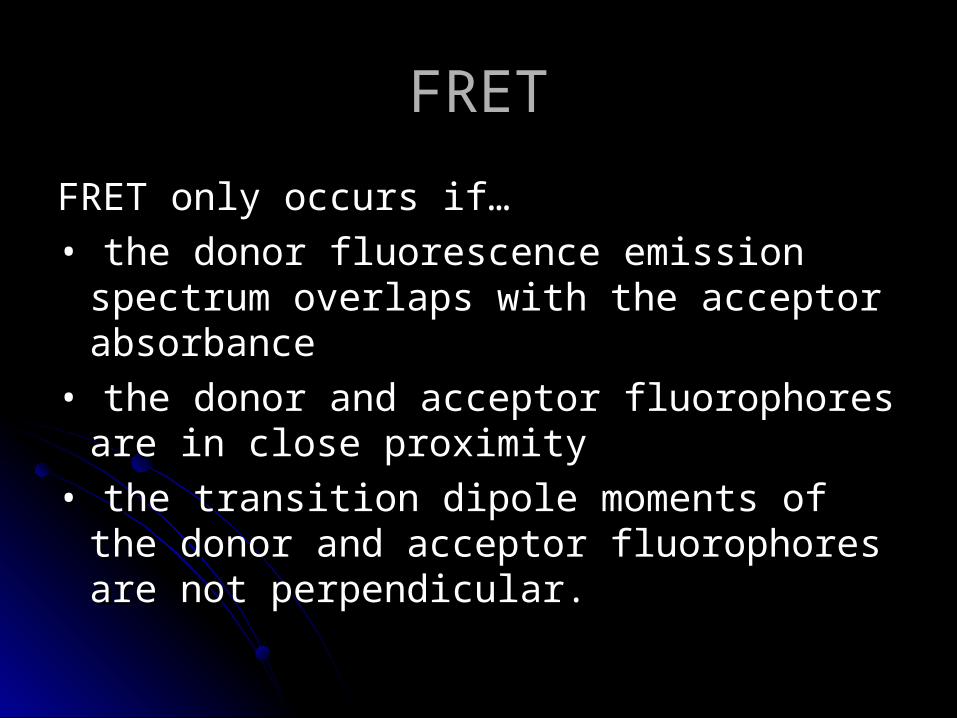
FRETFRET
FRET only occurs if…FRET only occurs if…
• • the donor fluorescence emission spectrum the donor fluorescence emission spectrum overlaps with the acceptor absorbanceoverlaps with the acceptor absorbance
• • the donor and acceptor fluorophores are in the donor and acceptor fluorophores are in close proximity close proximity
• • the transition dipole moments of the donor the transition dipole moments of the donor and acceptor fluorophores are not and acceptor fluorophores are not perpendicular.perpendicular.
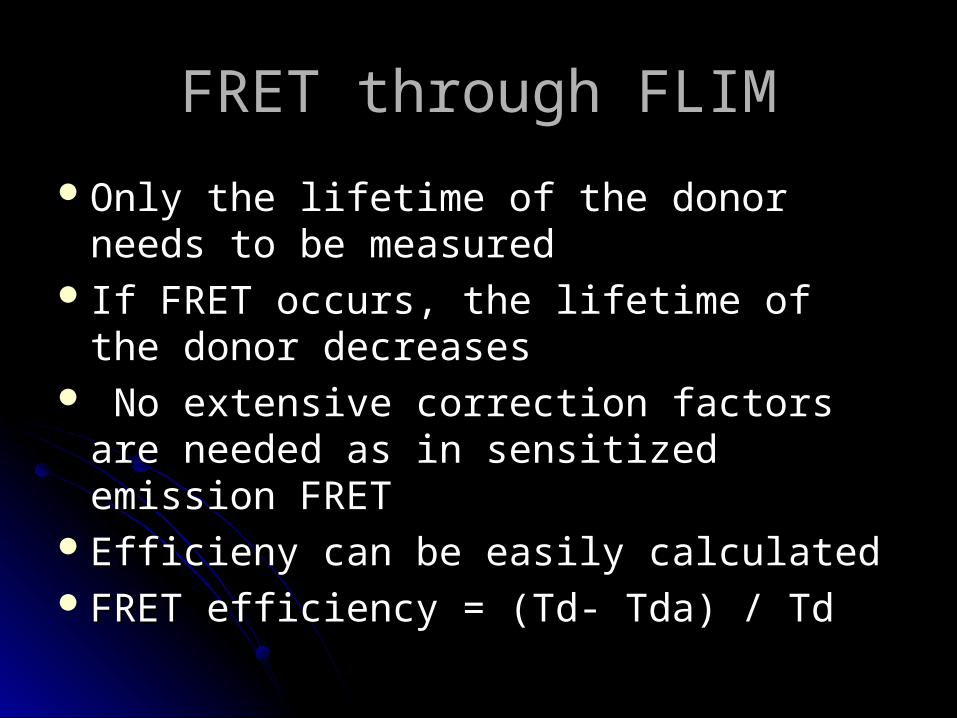
FRET through FLIMFRET through FLIM
Only the lifetime of the donor needs to be Only the lifetime of the donor needs to be measuredmeasured
If FRET occurs, the lifetime of the donor If FRET occurs, the lifetime of the donor decreasesdecreases
No extensive correction factors are No extensive correction factors are needed as in sensitized emission FRETneeded as in sensitized emission FRET
Efficieny can be easily calculatedEfficieny can be easily calculatedFRET efficiency = (Td- Tda) / TdFRET efficiency = (Td- Tda) / Td
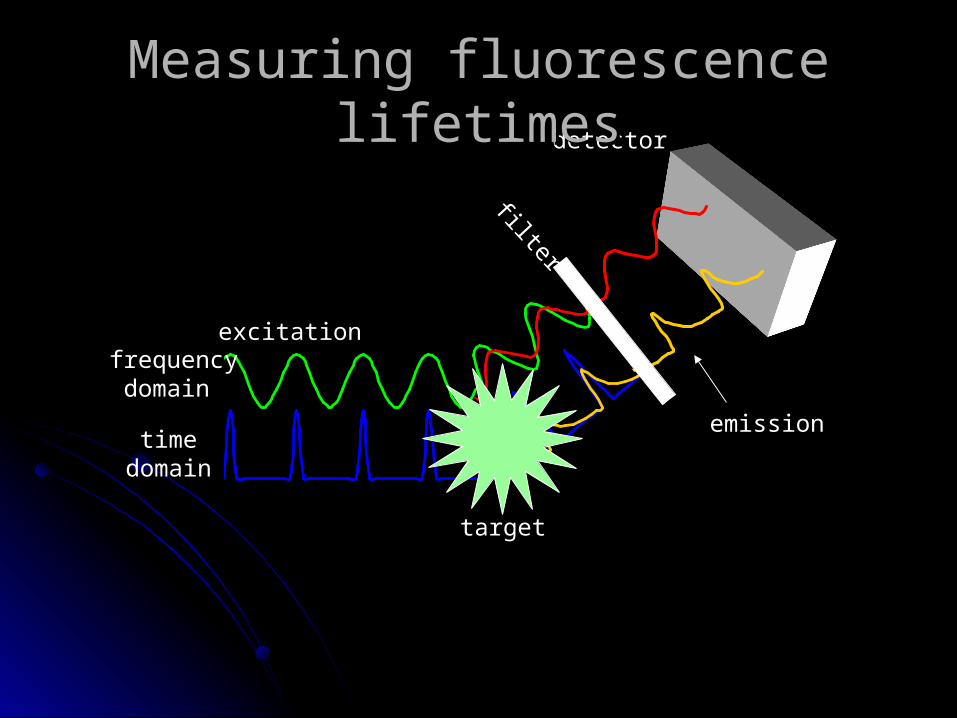
excitation
target
emissionfilter
detector
frequency domain
timedomain
Measuring fluorescence lifetimesMeasuring fluorescence lifetimes
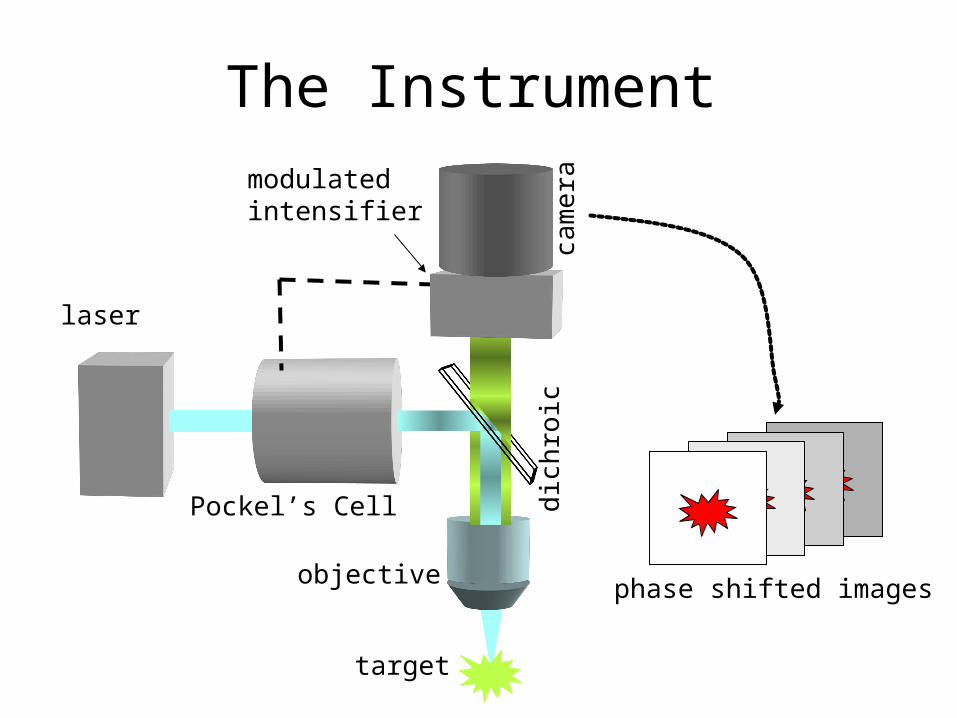
The Instrument
objective
Pockel’s Cell
laser
modulatedintensifier
cam
era
dic
hro
ic
target
phase shifted images
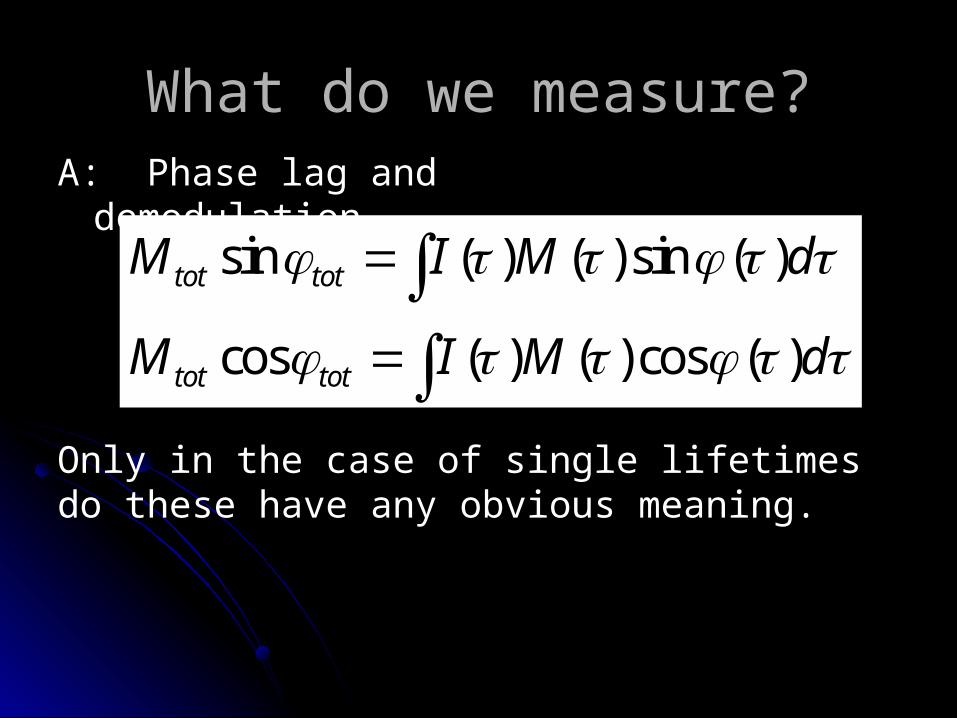
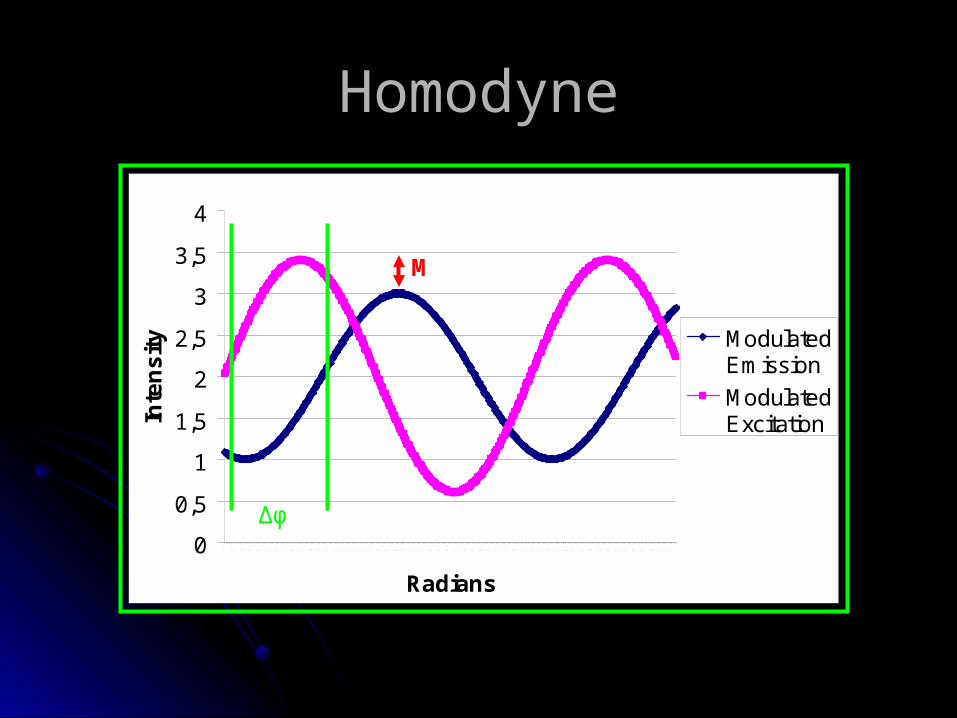
What do we measure?What do we measure?A: Phase lag and demodulationA: Phase lag and demodulation
sin ( ) ( )sin ( )
cos ( ) ( ) cos ( )
tot tot
tot tot
M I M d
M I M d
Only in the case of single lifetimes do these have any obvious meaning.
0
0,5
1
1,5
2
2,5
3
3,5
4
1 1 1 2 1 3 1 4 1 5 1 6 1 7 1 8 1 9 1 1 0 1 1 1 1 2 1 3 1 4 1 5 1 6 1 7 1 8 1 9 2 0 1 2 1 2 2 2 3 2 4 2 5 2 6 2 7 2 8 2 9 3 0 1 3 1 3 2 3 3 3 4 3 5 3 6 3 7 3 8 3 9 4 0 1 4 1 4 2 4 3 4 4 4 5 4 6 4 7 4 8 4 9 5 0 1 5 1 5 2
Radians
Inte
ns
ity Modulated
Emission
ModulatedExcitation
Δφ
M
HomodyneHomodyne
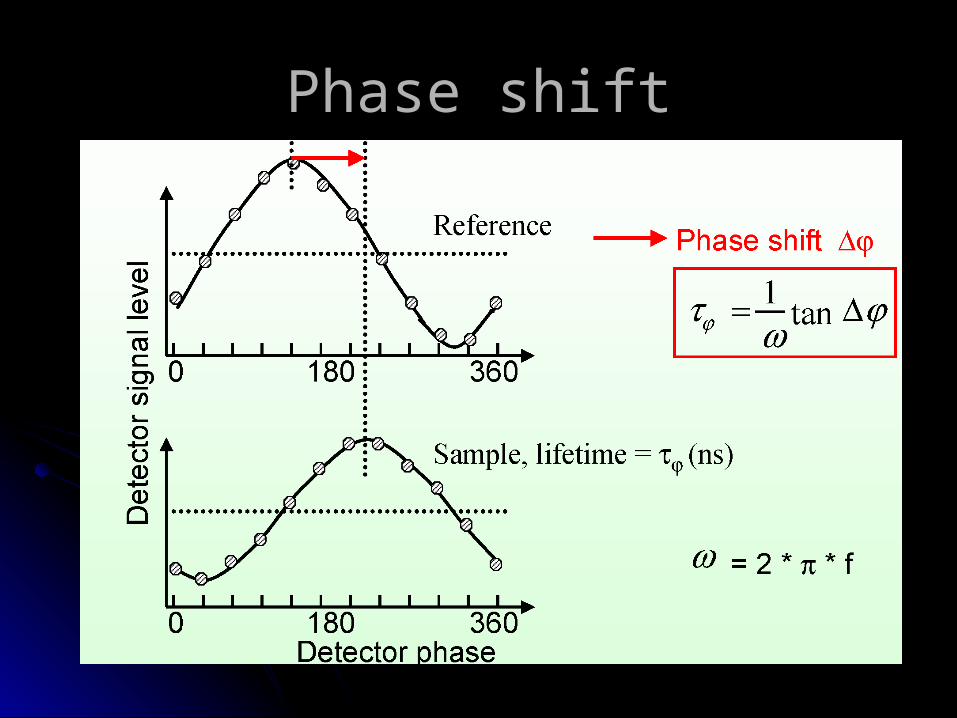
Phase shiftPhase shift
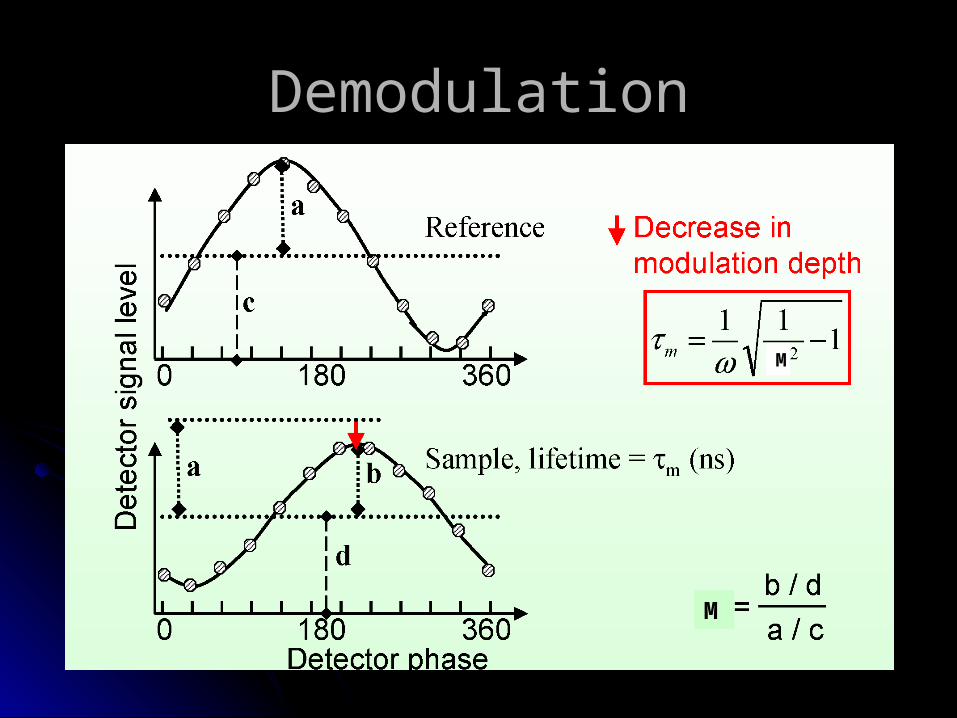
DemodulationDemodulation
M
M
Lifetime VectorsLifetime Vectors
Let the radial distance be Let the radial distance be MM and the angle from and the angle from the x-axis be the x-axis be φφ. .
Call this a Call this a lifetime vectorlifetime vector. .
( ) ( )totr I r d
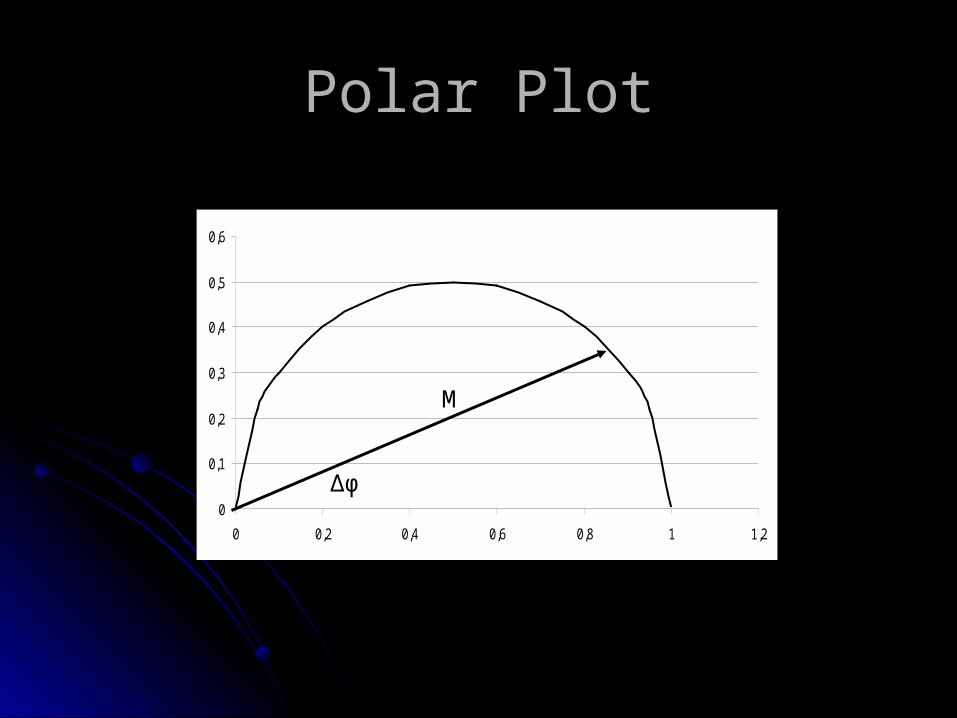
Polar PlotPolar Plot
0
0,1
0,2
0,3
0,4
0,5
0,6
0 0,2 0,4 0,6 0,8 1 1,2
M
Δφ
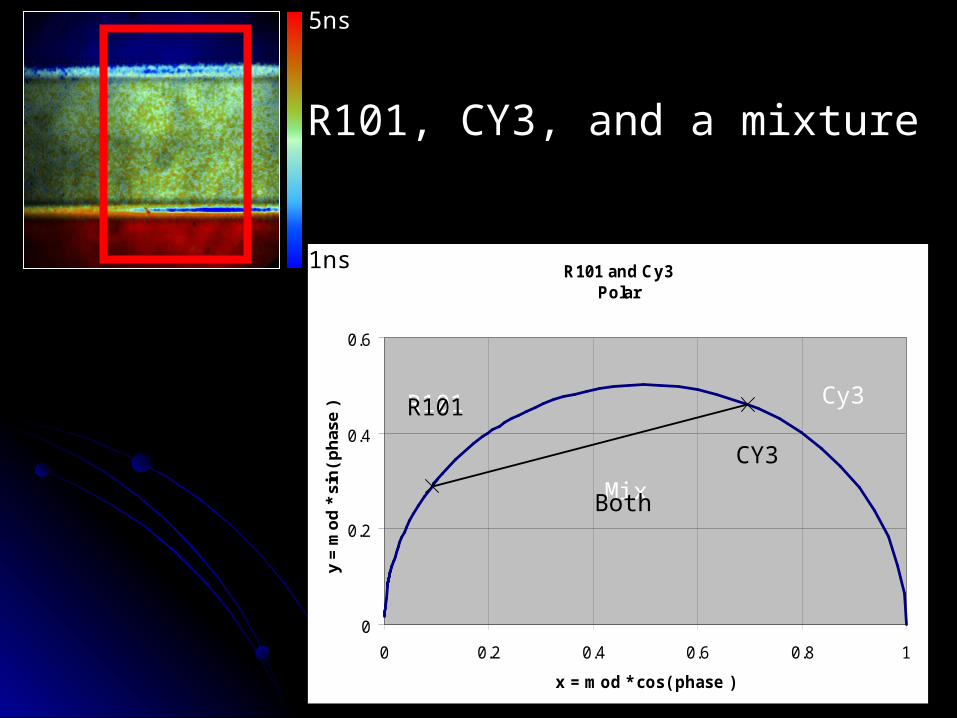
Polar PlotPolar Plot
All single exponential lifetimes lie on the All single exponential lifetimes lie on the semicirclesemicircle
Multi-exponetinal Lifetime are a linear Multi-exponetinal Lifetime are a linear combination of their componentscombination of their components
The ratio of the linear combination The ratio of the linear combination determines the fraction of the componentsdetermines the fraction of the components
5ns
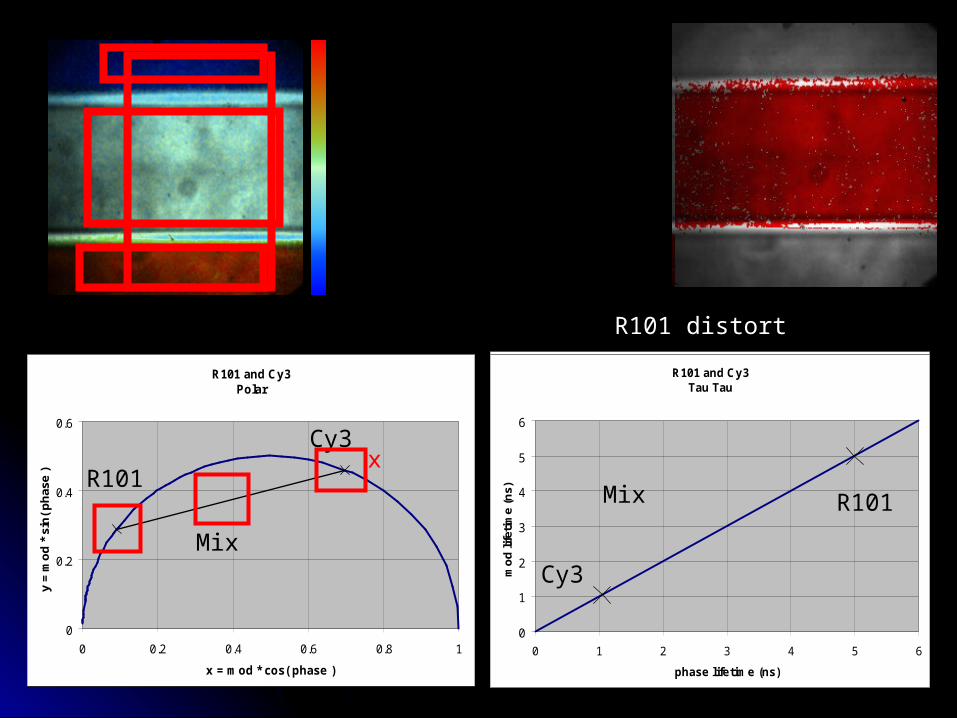
R101 and Cy3Polar
0
0.2
0.4
0.6
0 0.2 0.4 0.6 0.8 1
x = mod * cos( phase )
y =
mo
d *
sin
( p
has
e ) Cy3R101
Mix
1ns
R101, CY3, and a mixture
CY3
R101
Both
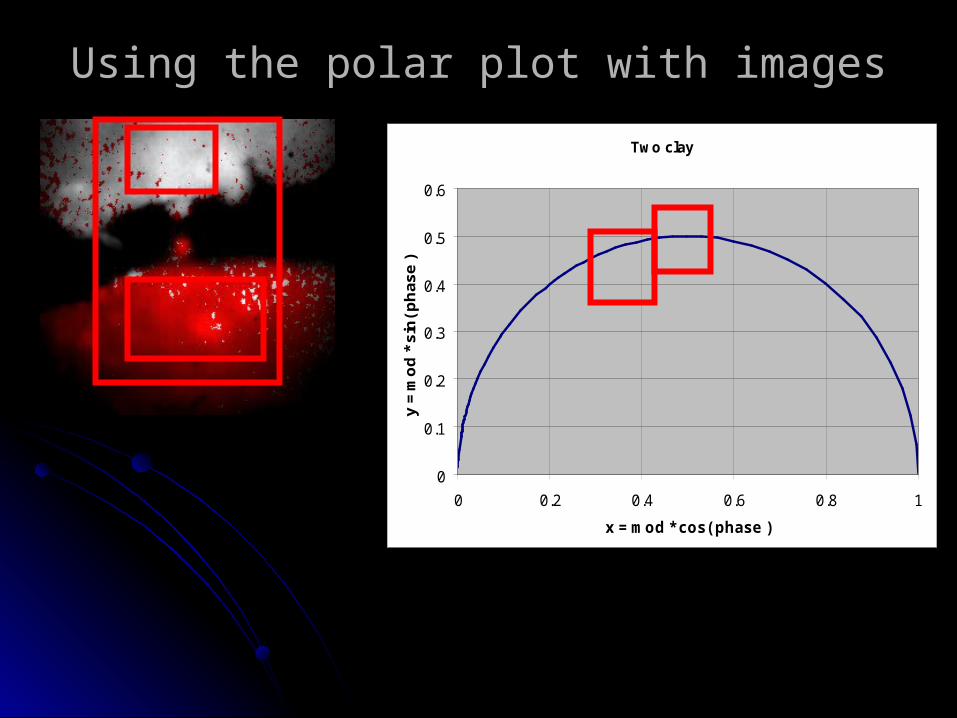
Using the polar plot with imagesUsing the polar plot with images
Two clay
0
0.1
0.2
0.3
0.4
0.5
0.6
0 0.2 0.4 0.6 0.8 1
x = mod * cos( phase )
y =
mo
d *
sin
( p
ha
se
)
Two clay
0
0.1
0.2
0.3
0.4
0.5
0.6
0 0.2 0.4 0.6 0.8 1
x = mod * cos( phase )
y =
mo
d *
sin
( p
ha
se
)
Two clay
0
0.1
0.2
0.3
0.4
0.5
0.6
0 0.2 0.4 0.6 0.8 1
x = mod * cos( phase )
y =
mo
d *
sin
( p
ha
se
)
R101 and Cy3Polar
0
0.2
0.4
0.6
0 0.2 0.4 0.6 0.8 1
x = mod * cos( phase )
y =
mo
d *
sin
( p
has
e )
R101 and Cy3Tau Tau
0
1
2
3
4
5
6
0 1 2 3 4 5 6
phase lifetime (ns)
mo
d li
feti
me
(ns)
R101 and Cy3Polar
0
0.2
0.4
0.6
0 0.2 0.4 0.6 0.8 1
x = mod * cos( phase )
y =
mo
d *
sin
( p
has
e )
Phase LifetimeMod Lifetime2 Component FitDistance from Point
1ns
5ns
R101 and Cy3Polar
0
0.2
0.4
0.6
0 0.2 0.4 0.6 0.8 1
x = mod * cos( phase )
y =
mo
d *
sin
( p
has
e )
R101 and Cy3Polar
0
0.2
0.4
0.6
0 0.2 0.4 0.6 0.8 1
x = mod * cos( phase )
y =
mo
d *
sin
( p
has
e )
R101 and Cy3Tau Tau
0
1
2
3
4
5
6
0 1 2 3 4 5 6
phase lifetime (ns)
mo
d li
feti
me
(ns)
R101 and Cy3Tau Tau
0
1
2
3
4
5
6
0 1 2 3 4 5 6
phase lifetime (ns)
mo
d li
feti
me
(ns)
R101 and Cy3Tau Tau
0
1
2
3
4
5
6
0 1 2 3 4 5 6
phase lifetime (ns)
mo
d li
feti
me
(ns)
Cy3
Cy3
R101R101
Mix
Mix
x
R101 distortR101 distort
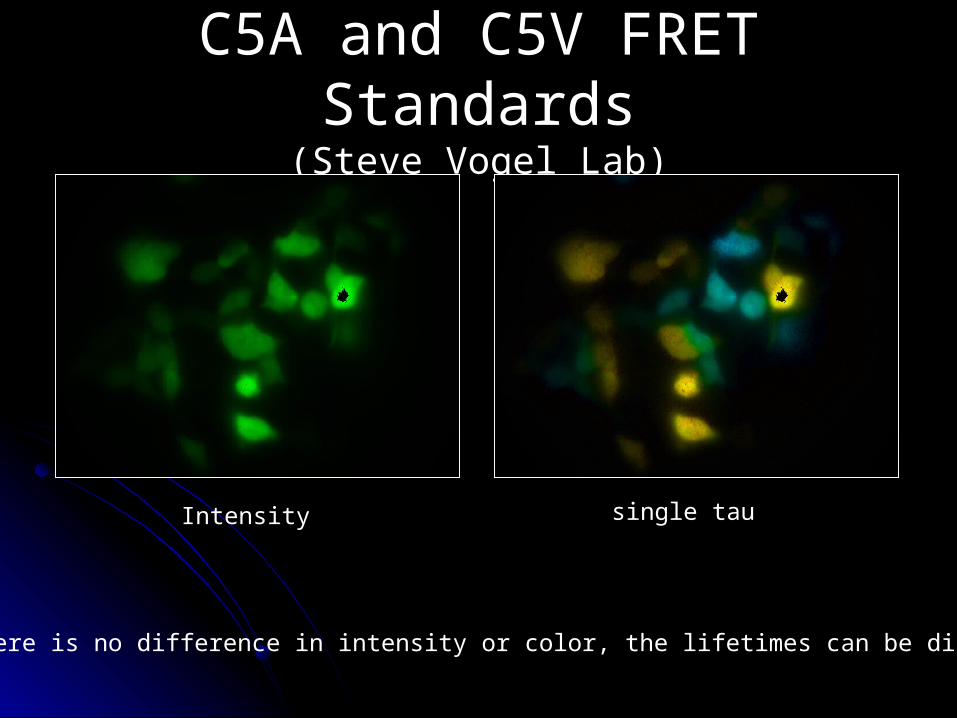
C5A and C5V FRET StandardsC5A and C5V FRET Standards(Steve Vogel Lab)(Steve Vogel Lab)
Intensity single tau
Where there is no difference in intensity or color, the lifetimes can be different
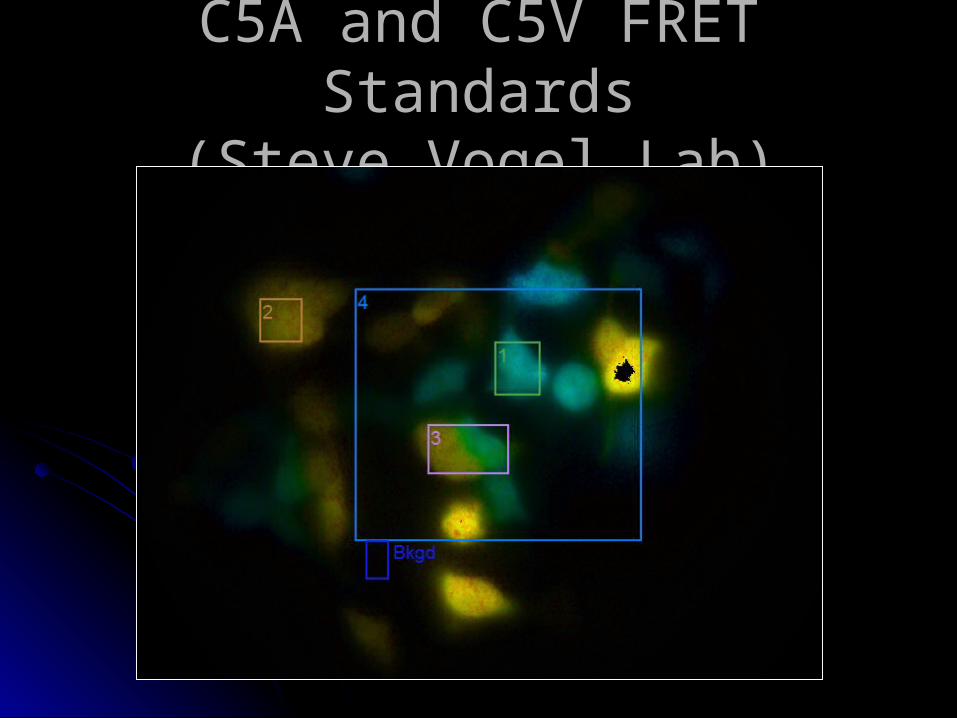
C5A and C5V FRET StandardsC5A and C5V FRET Standards(Steve Vogel Lab)(Steve Vogel Lab)
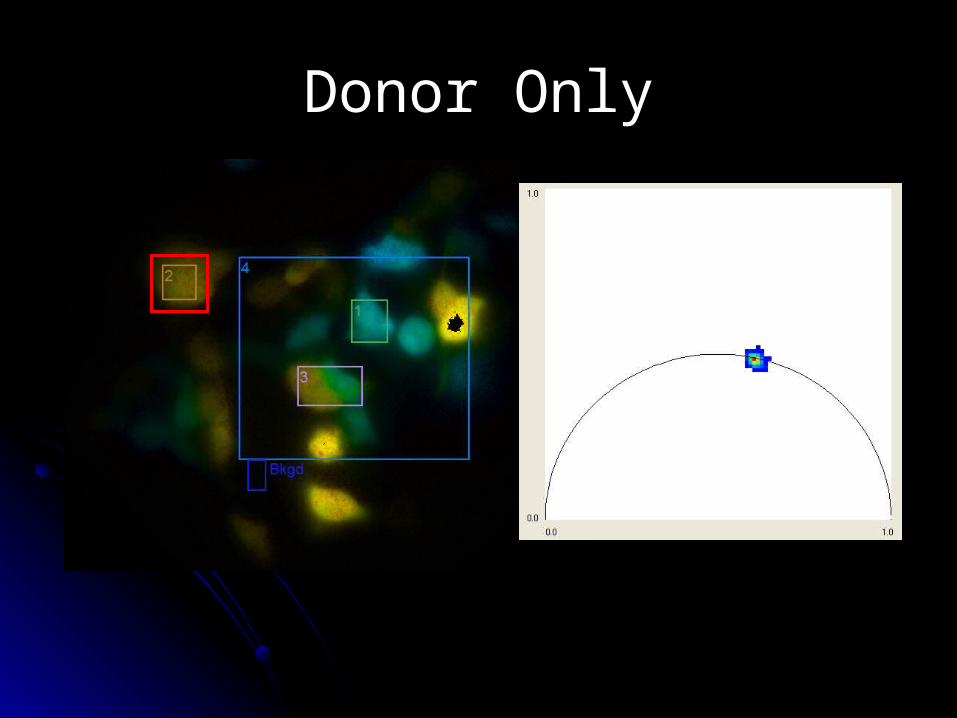
Donor OnlyDonor Only
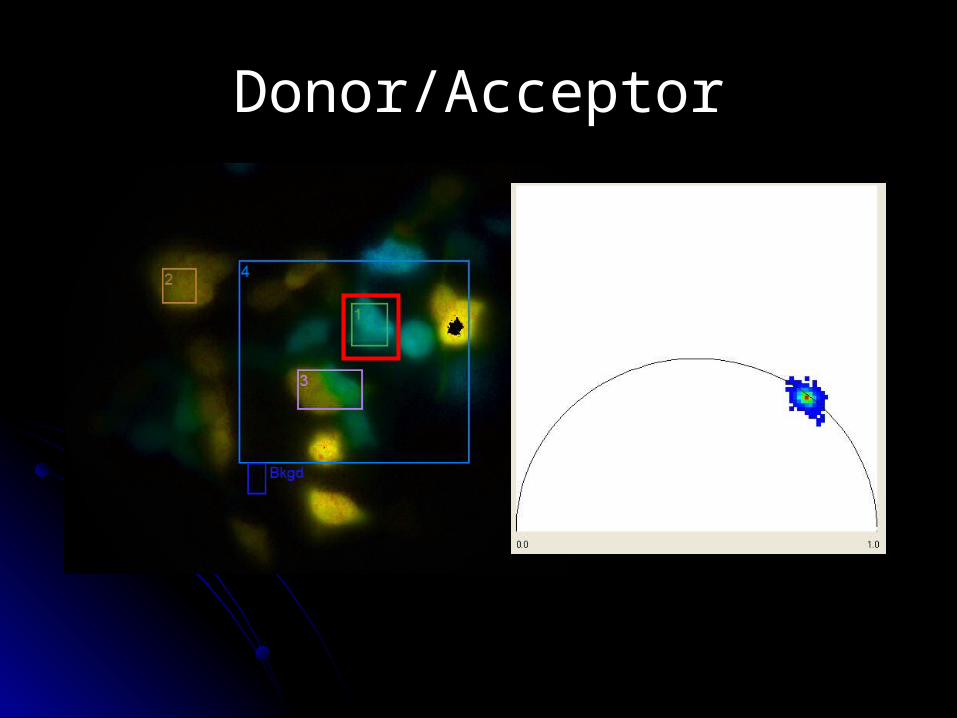
Donor/AcceptorDonor/Acceptor
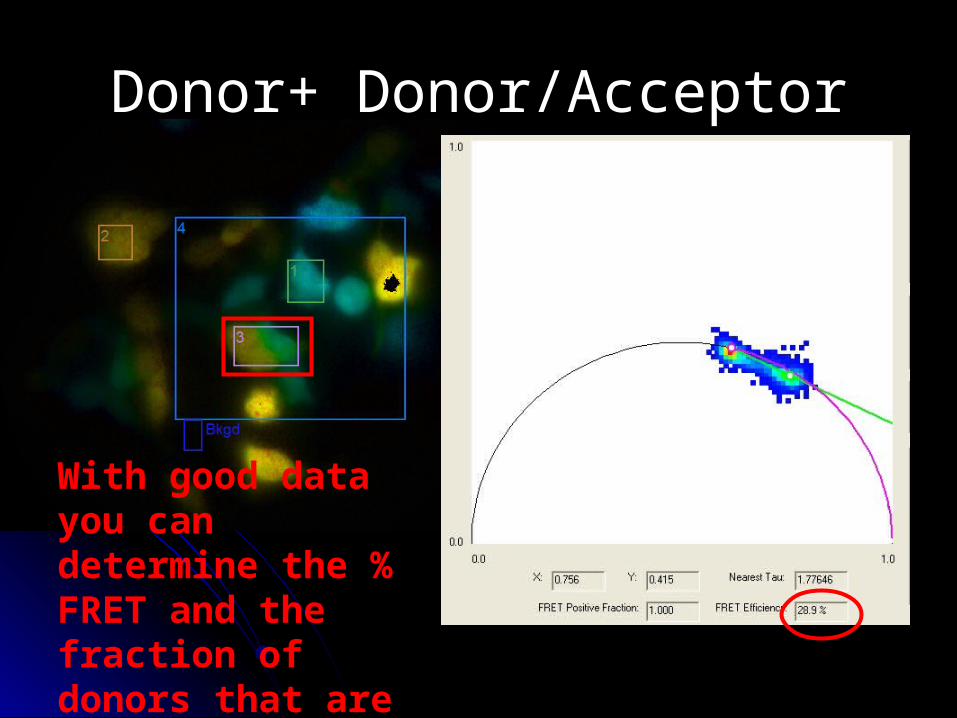
Donor+ Donor/AcceptorDonor+ Donor/Acceptor
With good data you can determine the % FRET and the fraction of donors that are FRETting
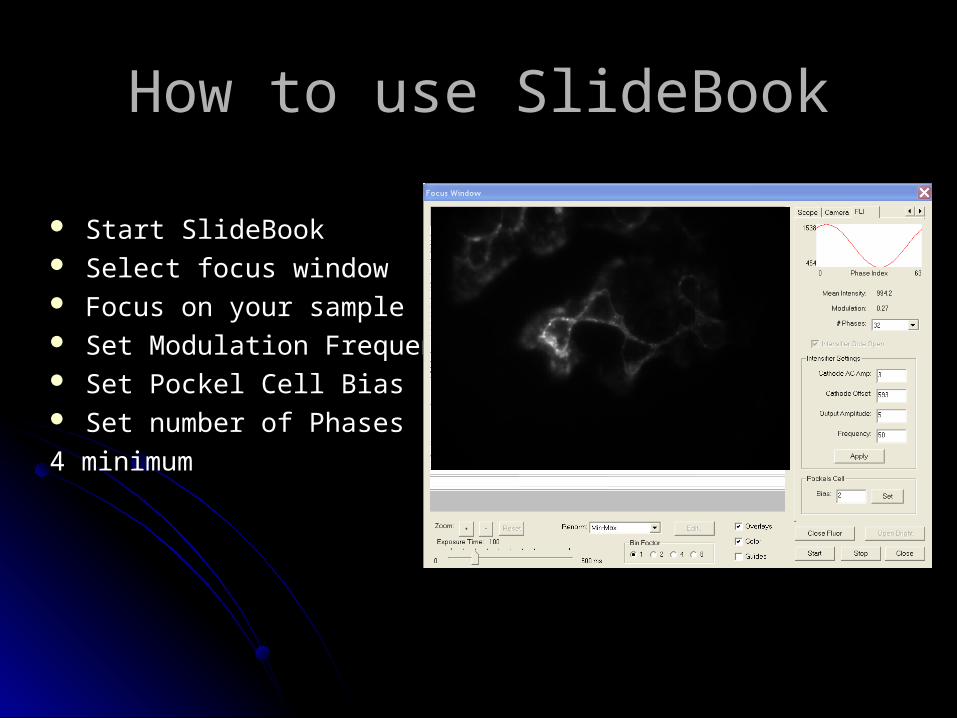
How to use SlideBookHow to use SlideBook
Start SlideBookStart SlideBook Select focus windowSelect focus window Focus on your sampleFocus on your sample Set Modulation FrequencySet Modulation Frequency Set Pockel Cell BiasSet Pockel Cell Bias Set number of PhasesSet number of Phases
4 minimum4 minimum
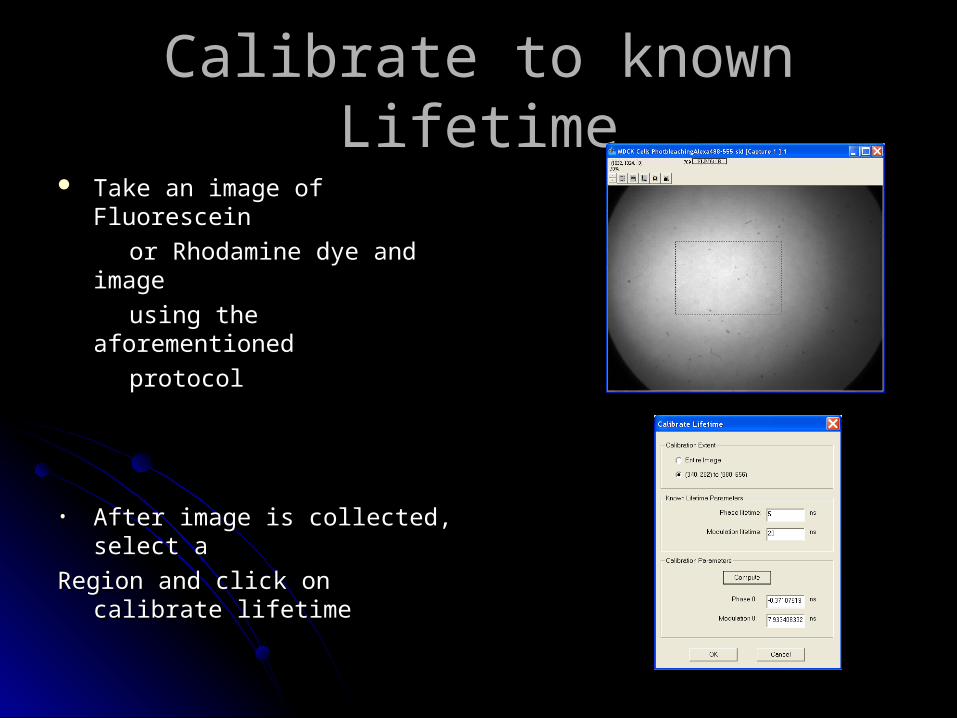
Calibrate to known LifetimeCalibrate to known Lifetime Take an image of FluoresceinTake an image of Fluorescein
or Rhodamine dye and imageor Rhodamine dye and image
using the aforementioned using the aforementioned
protocolprotocol
• After image is collected, select a After image is collected, select a
Region and click on calibrate lifetimeRegion and click on calibrate lifetime
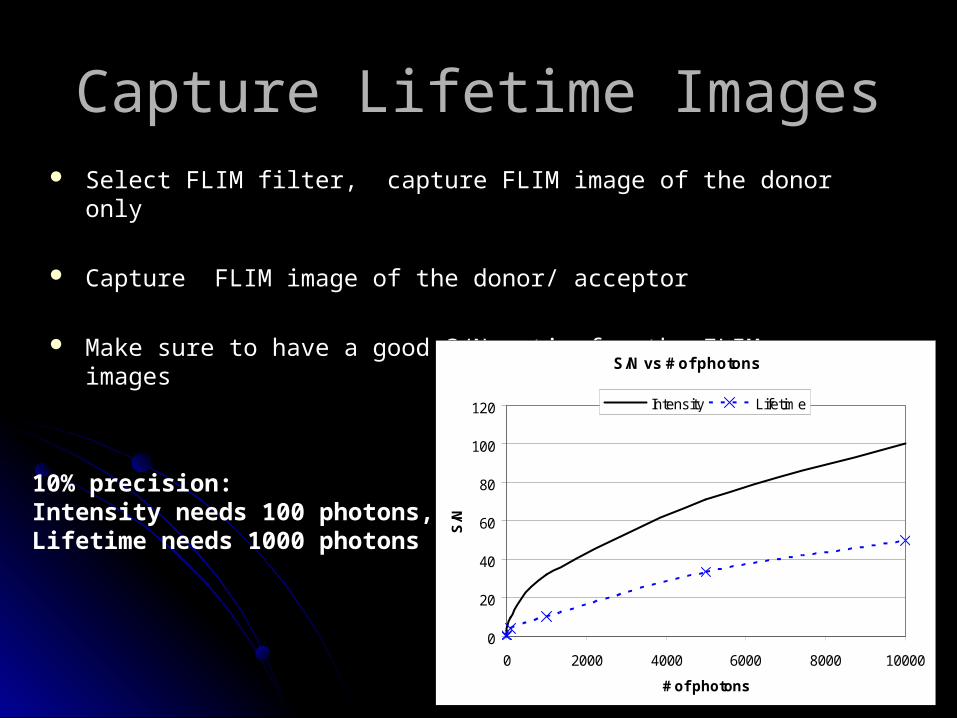
Capture Lifetime ImagesCapture Lifetime Images Select FLIM filter, capture FLIM image of the donor onlySelect FLIM filter, capture FLIM image of the donor only
Capture FLIM image of the donor/ acceptorCapture FLIM image of the donor/ acceptor
Make sure to have a good S/N ratio for the FLIM imagesMake sure to have a good S/N ratio for the FLIM images
S/N vs # of photons
0
20
40
60
80
100
120
0 2000 4000 6000 8000 10000
# of photons
S/N
Intensity Lifetime
10% precision: Intensity needs 100 photons,Lifetime needs 1000 photons
Lifetime Vector AnalysisLifetime Vector Analysis
The microscope captures a series of The microscope captures a series of images at different phasesimages at different phases
From these, 3 images are created:From these, 3 images are created:
1.1. Lifetime XLifetime X
2.2. Lifetime YLifetime Y
3.3. Fluorescence IntensityFluorescence Intensity Real physical measurements (such as Real physical measurements (such as
FRET) are calculated from these imagesFRET) are calculated from these images
Lifetime Vector AnalysisLifetime Vector Analysis
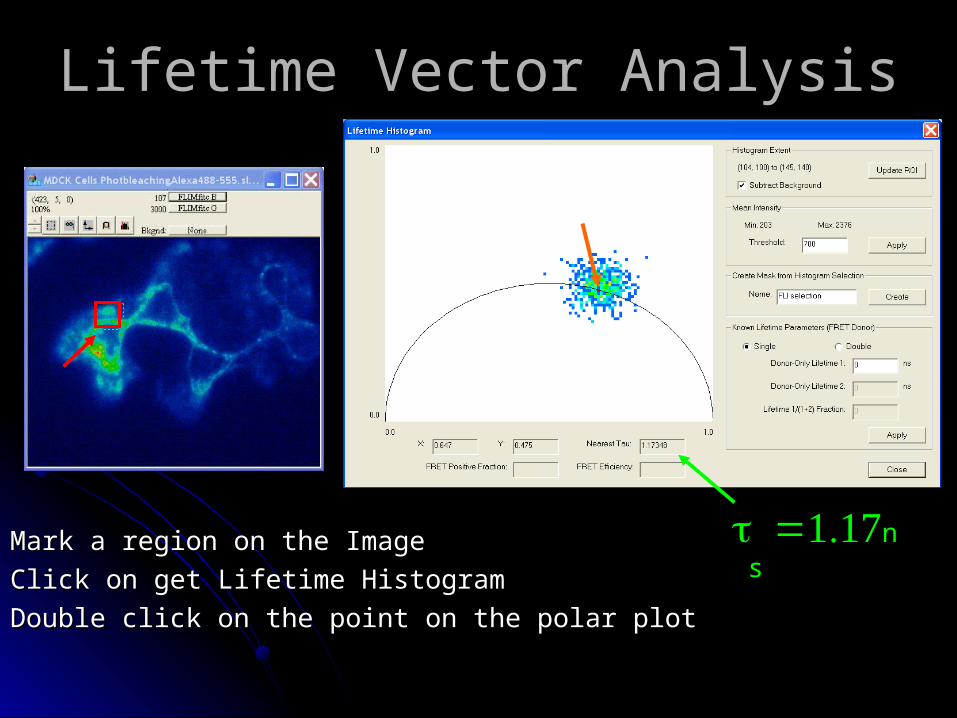
• Mark a region on the Image Mark a region on the Image • Click on get Lifetime Histogram Click on get Lifetime Histogram • Double click on the point on the polar plotDouble click on the point on the polar plot
nnss
Lifetime Vector AnalysisLifetime Vector Analysis
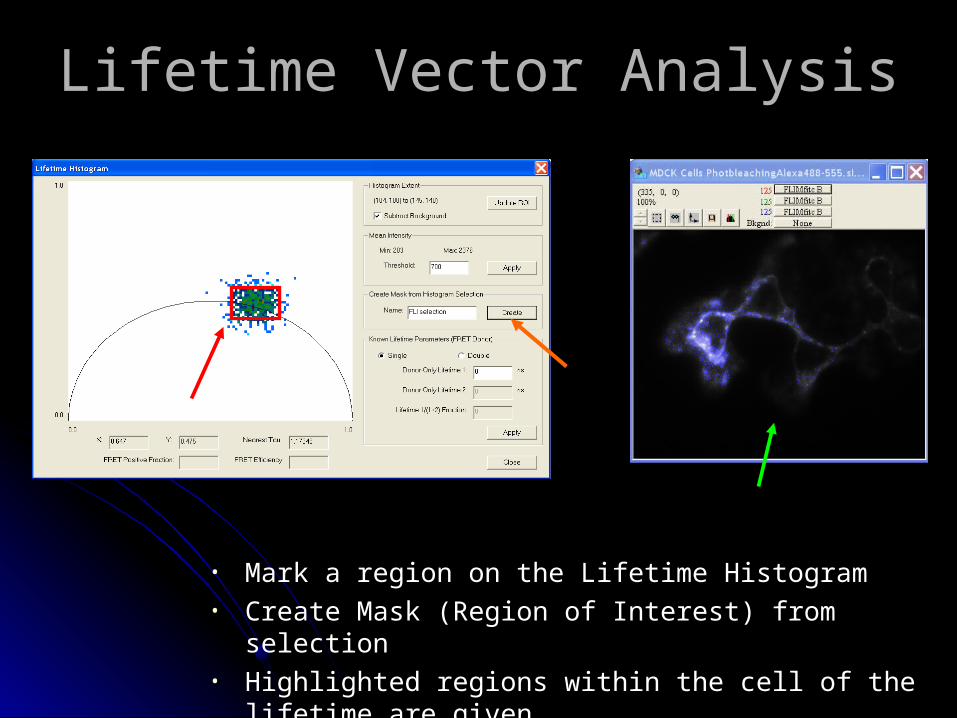
• Mark a region on the Lifetime Histogram • Create Mask (Region of Interest) from selection • Highlighted regions within the cell of the lifetime are given
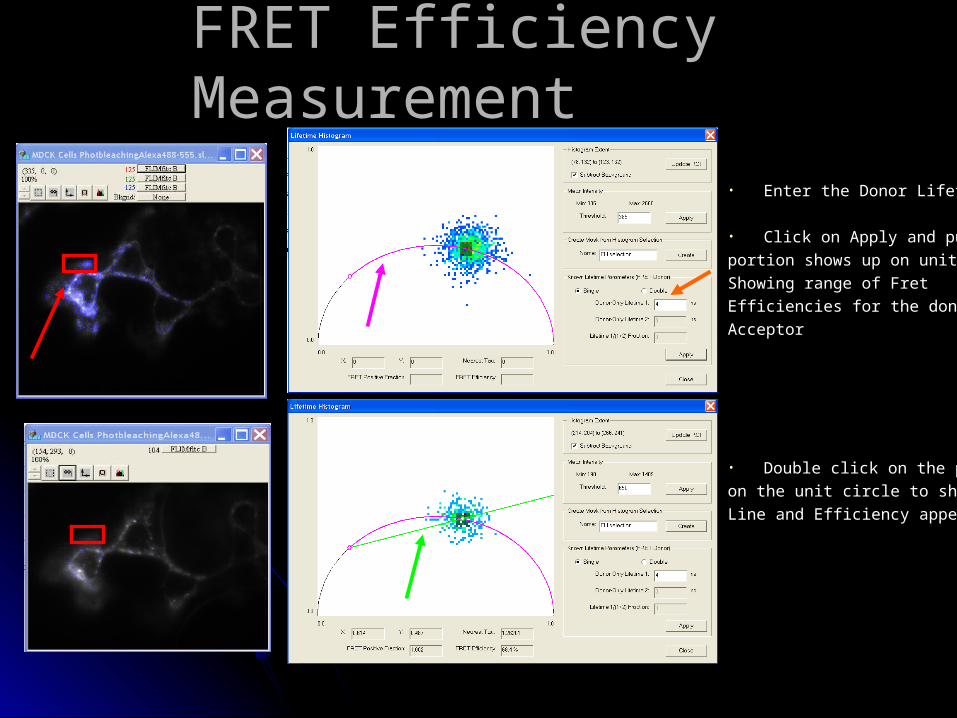
FRET Efficiency MeasurementFRET Efficiency Measurement
• Enter the Donor Lifetime
• Click on Apply and purple
portion shows up on unit circle
Showing range of Fret
Efficiencies for the donor to
Acceptor
• Double click on the point
on the unit circle to show green
Line and Efficiency appears

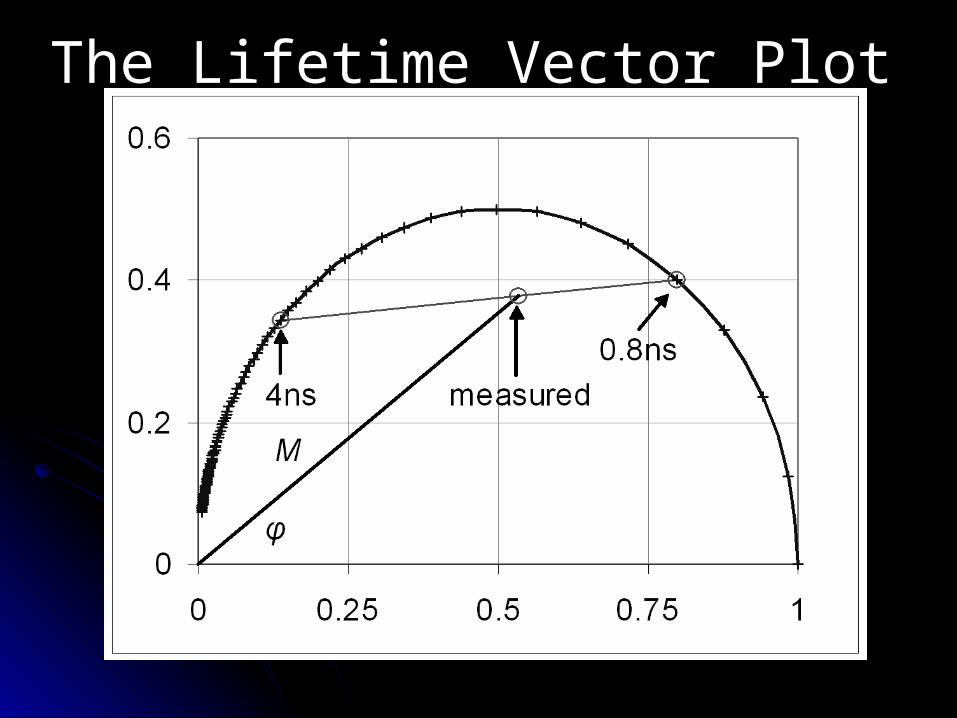
The Lifetime Vector PlotThe Lifetime Vector Plot
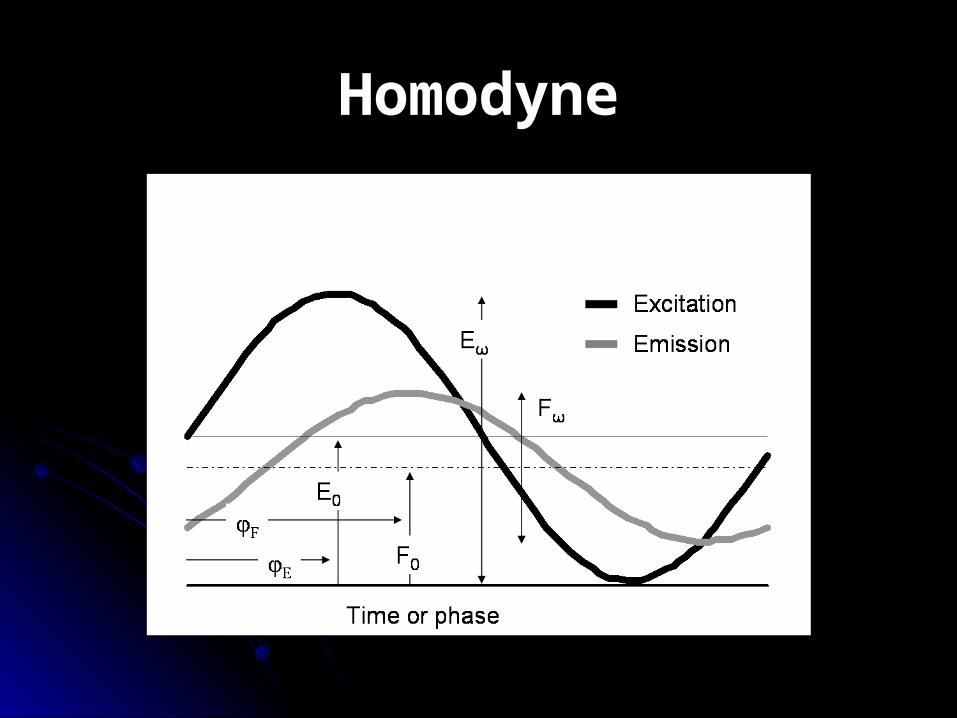
HomodyneHomodyne
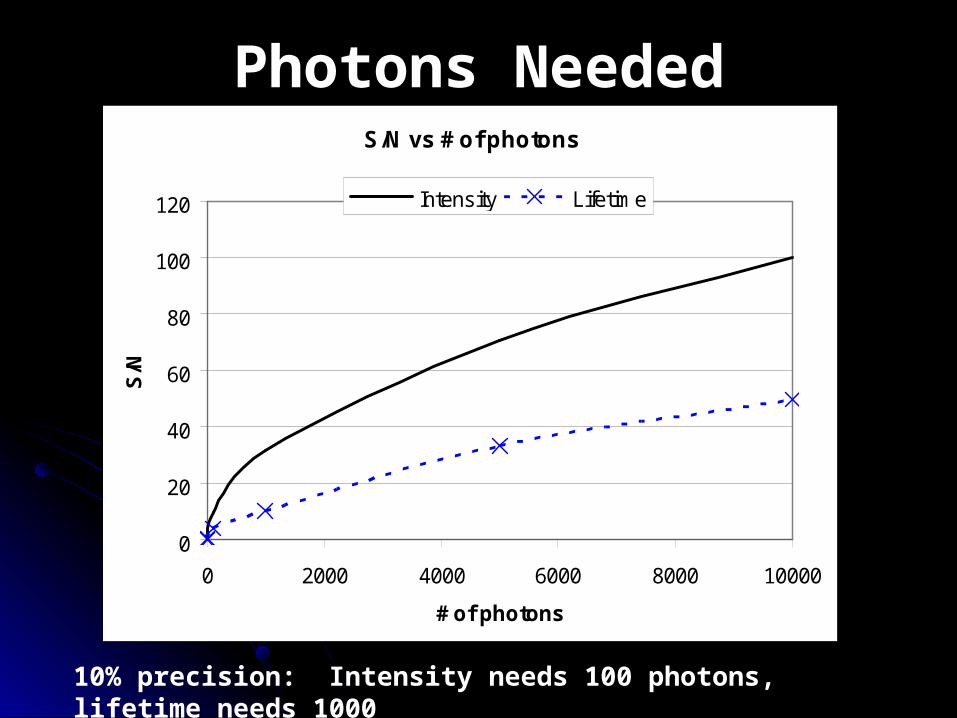
Photons NeededPhotons NeededS/N vs # of photons
0
20
40
60
80
100
120
0 2000 4000 6000 8000 10000
# of photons
S/N
Intensity Lifetime
10% precision: Intensity needs 100 photons, lifetime needs 1000
FRET ExampleFRET Example
Lifetime of the Donor with no Lifetime of the Donor with no Acceptor = Acceptor = TTdd
Lifetime of the Donor with Lifetime of the Donor with Acceptor = TdaAcceptor = Tda
FRET efficiency = (Td- Tda) / TdFRET efficiency = (Td- Tda) / Td
![FLIM Systems for Zeiss LSM-710 / 780 / 880 · [1] FLIM Systems for Zeiss LSM 710 / 780 / 880 family laser scanning microscopes, user handbook. 7th edition (2017), [2] FLIM systems](https://img.pdfslide.us/doc/110x75/611b3f26ede66b1f2323f888/flim-systems-for-zeiss-lsm-710-780-880-1-flim-systems-for-zeiss-lsm-710-.jpg)