Embed Size (px)
Citation preview

A R E W E F I N A N C I A L LY P R E PA R E D F O R T H E F U T U R E ?SAVING AND INVESTMENT STRATEGIES AROUND THE WORLD
JANUARY 2014
2 GLOBAL SAVING & INVESTING REPORT
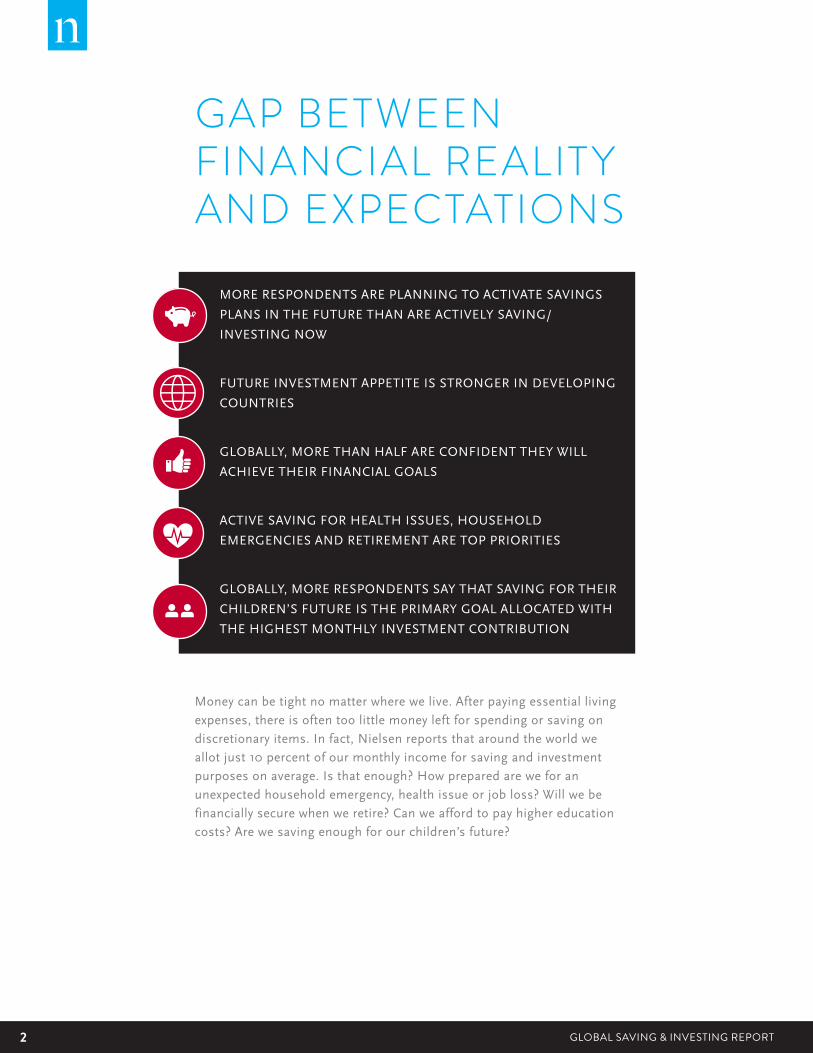
GAP BETWEEN FINANCIAL REALITY AND EXPECTATIONS
MORE RESPONDENTS ARE PLANNING TO ACTIVATE SAVINGS
PLANS IN THE FUTURE THAN ARE ACTIVELY SAVING/
INVESTING NOW
FUTURE INVESTMENT APPETITE IS STRONGER IN DEVELOPING
COUNTRIES
GLOBALLY, MORE THAN HALF ARE CONFIDENT THEY WILL
ACHIEVE THEIR FINANCIAL GOALS
ACTIVE SAVING FOR HEALTH ISSUES, HOUSEHOLD
EMERGENCIES AND RETIREMENT ARE TOP PRIORITIES
GLOBALLY, MORE RESPONDENTS SAY THAT SAVING FOR THEIR
CHILDREN’S FUTURE IS THE PRIMARY GOAL ALLOCATED WITH
THE HIGHEST MONTHLY INVESTMENT CONTRIBUTION
Money can be tight no matter where we live. After paying essential living
expenses, there is often too little money left for spending or saving on
discretionary items. In fact, Nielsen reports that around the world we
allot just 10 percent of our monthly income for saving and investment
purposes on average. Is that enough? How prepared are we for an
unexpected household emergency, health issue or job loss? Will we be
financially secure when we retire? Can we afford to pay higher education
costs? Are we saving enough for our children’s future?
3GLOBAL SAVING & INVESTING REPORT Copyright © 2014 The Nielsen Company
To help answer these questions, Nielsen conducted a global study to
understand current and future financial goals and the strategies we
use to prepare for them. The findings revealed that more respondents
around the world are focused on future saving or investing intentions
than on active or current plans. While current and future saving and
investment sentiment was relatively strong, there was a sizeable gap
between the two, as well as among those who said they had no plans
to save now or in the future. Closing the gap between desire and action
depends on a variety of reasons, least of which is earning enough money
to stash cash. Either way, both scenarios have economic consequences
to consider.
“Preparing for one’s financial future has implications that go beyond
personal needs,” said Oliver Rust, senior vice president, Global Financial
Services, Nielsen. “Particularly in mature economies, there are growing
concerns about reliance on governments to support expenses such
as retirement, health care and education as growing numbers of the
population enters retirement age. Understanding consumer sentiment
on the saving strategies used to fund financial goals now and in the
future provides insight to help close the gap between reality and
expectations.”
The Nielsen Global Survey of Saving and Investment Strategies polled
more than 30,000 Internet respondents in 60 countries to evaluate
how consumers around the world were preparing for current and future
financial expenses. We evaluated 16 different saving and investment
strategies used to fund 14 financial goals that range from unexpected
life events and shorter-term goals, such as unexpected household
emergencies and buying a house, to longer-term objectives, such as
saving for retirement and for their children’s future.
ABOUT THE GLOBAL SURVEY METHODOLOGY
The findings in this survey are based on respondents with online
access across 60 countries. While an online survey methodology
allows for tremendous scale and global reach, it provides a
perspective only on the habits of existing Internet users, not total
populations. In developing markets where online penetration has
not reached majority potential, audiences may be younger and more
affluent than the general population of that country. Additionally,
survey responses are based on claimed behavior, rather than actual
metered data.
4 GLOBAL SAVING & INVESTING REPORT
FUTURE INVESTMENT PLANS ARE STRONGER THAN CURRENT INTENTIONSThere’s always tomorrow was the sentiment that applied to the greatest
percentage of respondents around the world who plan to save or invest
to meet financial goals in the future, compared with those who were
actively saving or investing now. Across all 14 goals reviewed, intentions
to save in the future were stronger than active intentions for all but one
financial goal—health issues, whereby global active savers outnumbered
future savers by just one percentage point (42% active savers vs. 41%
future savers). For those who were actively saving now, particular life
events, such as health issues or unexpected household emergencies
were priorities among more respondents at the global level (42% and
41%, respectively) versus saving for a longer-term financial goal, such as
retirement (35%).
Overall, plans to save in the future were strongest among respondents
in the Asia-Pacific, Latin America and Middle East/Africa regions,
especially for intentions to fund their children’s futures, higher
education, first- and second-time property purchases, personal luxuries,
financial legacy, and new businesses. In North America and Europe,
future saving intentions were comparatively lower for funding higher
education, starting a business and preparing for certain live events, such
as marriage or having a baby.
“The greater number of respondents planning to save in the future
versus saving now suggests an opportunity to better educate consumers
on saving and investment strategies that will help them meet their
financial goals,” said Rust. “It also shines a light on the growing wealth
accumulation among consumers in the more developing regions of
the world and their aspirations for upward mobility with a more secure
financial future.”
5GLOBAL SAVING & INVESTING REPORT Copyright © 2014 The Nielsen Company
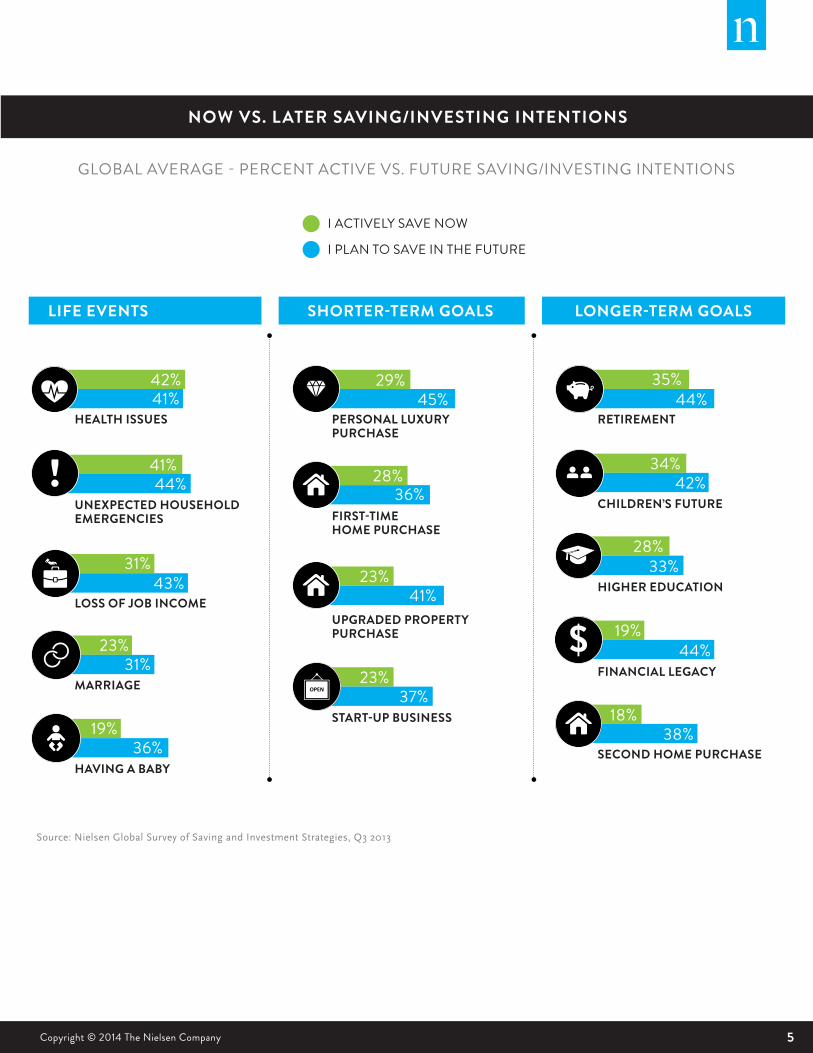
GLOBAL AVERAGE - PERCENT ACTIVE VS. FUTURE SAVING/INVESTING INTENTIONS
NOW VS. LATER SAVING/INVESTING INTENTIONS
Source: Nielsen Global Survey of Saving and Investment Strategies, Q3 2013
LIFE EVENTS SHORTER-TERM GOALS LONGER-TERM GOALS
I ACTIVELY SAVE NOW
I PLAN TO SAVE IN THE FUTURE
HEALTH ISSUES PERSONAL LUXURY PURCHASE
RETIREMENT
CHILDREN’S FUTURE
HIGHER EDUCATION
FINANCIAL LEGACY
SECOND HOME PURCHASE
UNEXPECTED HOUSEHOLD EMERGENCIES FIRST-TIME
HOME PURCHASE
LOSS OF JOB INCOMEUPGRADED PROPERTY PURCHASE
MARRIAGE
START-UP BUSINESS
HAVING A BABY
42%41%
29% 35%45% 44%
28%36%
23%41%
23%37%
41%44%
31%43%
23%31%
19%36%
34%42%
28%33%
19%44%
18%38%
OPEN

6 GLOBAL SAVING & INVESTING REPORT
HIGH CONFIDENCE IN ACHIEVING FINANCIAL GOALS The glass was half full for nearly seven out of 10 global respondents
(69%) who believed they would achieve all of their financial goals for
the future. Yet, of those, only 28 percent felt that their current financial
planning would get them there. Most of the group (41%) was less self-
assured, conceding that in order to best meet financial expectations,
they would need to closely monitor and adjust investments from time to
time. Nearly one-third of global respondents (31%) had no confidence
they would meet their financial goals with either current or modified
asset allocations.
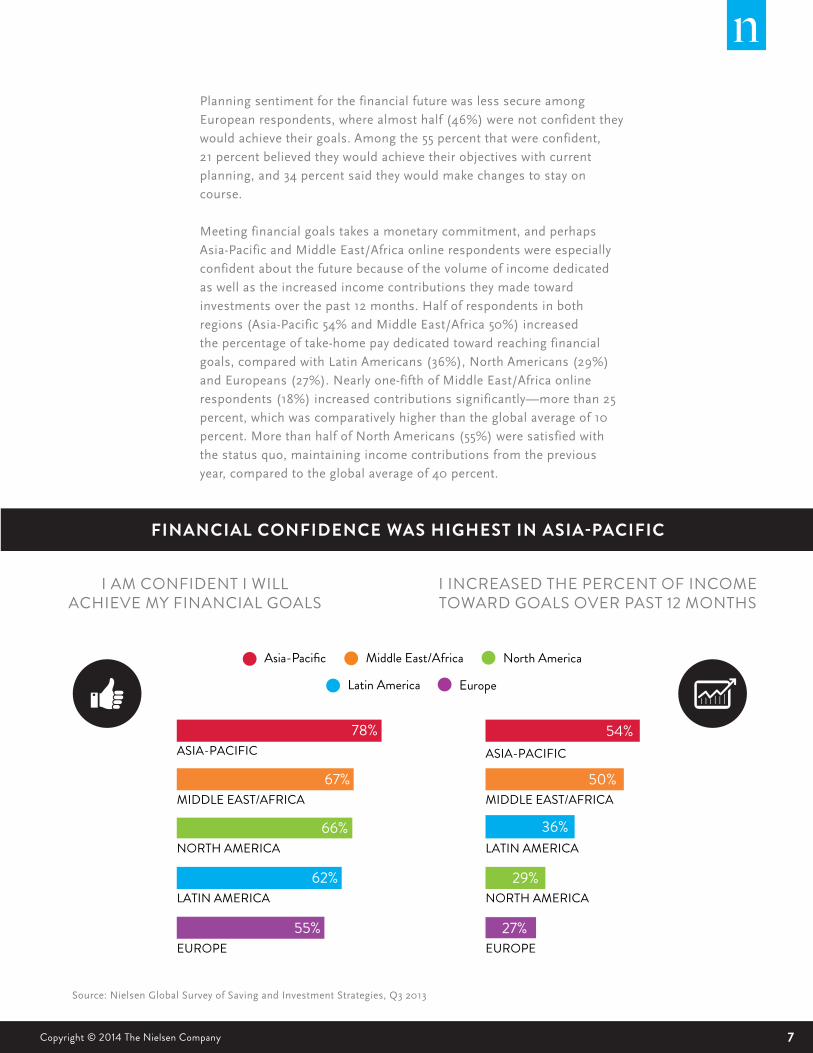
Overall, financial confidence was highest in Asia-Pacific, where more
than two-thirds (78%) of respondents said their planning was sound
and on track for the future (32% were satisfied with their current plan
and 46% would make adjustments). Financial planning was also in good
standing among two-thirds of respondents in Middle East/Africa (67%),
North America (66%) and Latin America (62%), with about one-fourth in
each region saying they were satisfied with their existing strategies.
7GLOBAL SAVING & INVESTING REPORT Copyright © 2014 The Nielsen Company
Planning sentiment for the financial future was less secure among
European respondents, where almost half (46%) were not confident they
would achieve their goals. Among the 55 percent that were confident,
21 percent believed they would achieve their objectives with current
planning, and 34 percent said they would make changes to stay on
course.
Meeting financial goals takes a monetary commitment, and perhaps
Asia-Pacific and Middle East/Africa online respondents were especially
confident about the future because of the volume of income dedicated
as well as the increased income contributions they made toward
investments over the past 12 months. Half of respondents in both
regions (Asia-Pacific 54% and Middle East/Africa 50%) increased
the percentage of take-home pay dedicated toward reaching financial
goals, compared with Latin Americans (36%), North Americans (29%)
and Europeans (27%). Nearly one-fifth of Middle East/Africa online
respondents (18%) increased contributions significantly—more than 25
percent, which was comparatively higher than the global average of 10
percent. More than half of North Americans (55%) were satisfied with
the status quo, maintaining income contributions from the previous
year, compared to the global average of 40 percent.
I AM CONFIDENT I WILL ACHIEVE MY FINANCIAL GOALS
I INCREASED THE PERCENT OF INCOME TOWARD GOALS OVER PAST 12 MONTHS
FINANCIAL CONFIDENCE WAS HIGHEST IN ASIA-PACIFIC
Source: Nielsen Global Survey of Saving and Investment Strategies, Q3 2013
Asia-Pacific Middle East/Africa North America
Latin America Europe
78%
67%
66%
62%
55%
ASIA-PACIFIC
MIDDLE EAST/AFRICA
NORTH AMERICA
LATIN AMERICA
EUROPE
54%
50%
36%
29%
27%
ASIA-PACIFIC
MIDDLE EAST/AFRICA
LATIN AMERICA
NORTH AMERICA
EUROPE
8 GLOBAL SAVING & INVESTING REPORT
GOOD HEALTH EQUALS GOOD LIFESTRATEGIES TO SAVE FOR HEALTH ISSUES
An apple a day keeps the doctor away. China, which is on pace to
produce 37.5 million metric tons of apples* in 2013, is covering its bases
as the country with the highest percent of active savers for health-
related issues (63%). In fact, in the Asia-Pacific region, 55 percent
of respondents were actively saving for health concerns, which was
comparatively higher than the global average of 42 percent. Saving now
for health issues was also a priority among the more-developing regions,
encompassing 41 percent of respondents in the Middle East/Africa
and 38 percent in Latin America, while North Americans (33%) and
Europeans (24%) were less likely to save now for health-related issues.
Asia-Pacific respondents also reported one of the most diversified
strategies of saving for health issues, using a mix of local bank accounts
(55%), whole life insurance (39%), pure-term life insurance (28%) and
saving plans (24%). The highest rate of diversification, however, was
reported in the Middle East/Africa region, where focus was put less
on local bank accounts and more on a greater number of investment
products to achieve their goal. In this region, eight investment products
prompted response rates from at least 20 percent of respondents, which
included: local bank accounts (39%), whole life insurance, government-
initiated products (both at 25%), pure-term life insurance (22%),
company pension (22%), private pension (22%) and investment-linked
insurance (21%).
* Source: 2012 Apple Association Crop Outlook and Marketing Conference
9GLOBAL SAVING & INVESTING REPORT Copyright © 2014 The Nielsen Company
Latin American respondents largely utilized local bank accounts (43%)
to save for health-related issues, but also found value in whole life
insurance (26%), pure-term life insurance (22%) and government-
initiated retirement products (20%). Conversely, Europeans and North
Americans were the least diversified when it came to saving strategies
used to fund health issues. Half of Europeans (50%) and North
Americans (52%) utilized local bank accounts and one-fifth in each
region relied on whole life insurance.
Time was of the essence when it came to considering the amount of
time needed to fund health-related issues among more than half of Latin
American (55%) and Middle Eastern/African (54%) online respondents
who said they were less than one year away from achieving this goal. A
longer time span was necessary for half of respondents in Asia-Pacific
(50%), North America (50%) and Europe (46%), who were three or
more years away from feeling secure that they have saved enough to
achieve this goal.
“Funding for health care is a significant issue among consumers in
many developing countries where assistance from health plans or
government sources are not heavily relied upon or available,” said Rust.
“These consumers are taking their health seriously and aren’t hesitating
to take the necessary means to reach the next level of financial security.
They’re actively investing at a higher rate, diversifying their investments
to create more predictable outcomes, and focusing on achieving them
sooner rather than later.”
10 GLOBAL SAVING & INVESTING REPORT
ASIA-PACIFIC EUROPE MIDDLE EAST / AFRICA LATIN AMERICA NORTH
AMERICA
55% Local bank
accounts
50% Local
bank accounts
39% Local bank
accounts43% Local bank accounts
52% Local bank
accounts
39% Whole life
insurance
22% Whole
life insurance
25% Whole life
insurance and
Government-initiated
retirement products
26% Whole life insurance20% Whole life
insurance
28% Pure-term
life insurance
22% Pure-term life
insurance, Savings
plans, Private pension
and Company pension
22% Pure-term life
insurance
24% Savings
plans
21% Investment-linked
insurance 20% Government-initiated
retirement products
21% Company
pension and
Investment-linked
insurance
TOP METHODS TO SAVESTRATEGIES USED BY +20% OF RESPONDENTS
Source: Nielsen Global Survey of Saving and Investment Strategies, Q3 2013 Due to rounding, numbers may not equal 100%
HEALTH ISSUES
NOW VS. LATER SAVING / INVESTING INTENTIONS
TIME FRAME TO ACHIEVE FINANCIAL GOALS
ASIA-PACIFIC EUROPE MIDDLE EAST /
AFRICALATIN
AMERICANORTH
AMERICA
I Actively Save/Invest Now 55% 24% 41% 38% 33%
I Plan to Save/Invest in the Future 38% 41% 46% 48% 46%
I Will Not Save/Invest Now or in Future 7% 35% 13% 14% 21%
Less than 1 year 35% 37% 54% 55% 31%1 year to less than 5 years 31% 30% 27% 24% 33%5 years to less than 20 years 24% 22% 13% 15% 26%20 years or more 11% 10% 5% 7% 11%
SCORECARD
11GLOBAL SAVING & INVESTING REPORT Copyright © 2014 The Nielsen Company
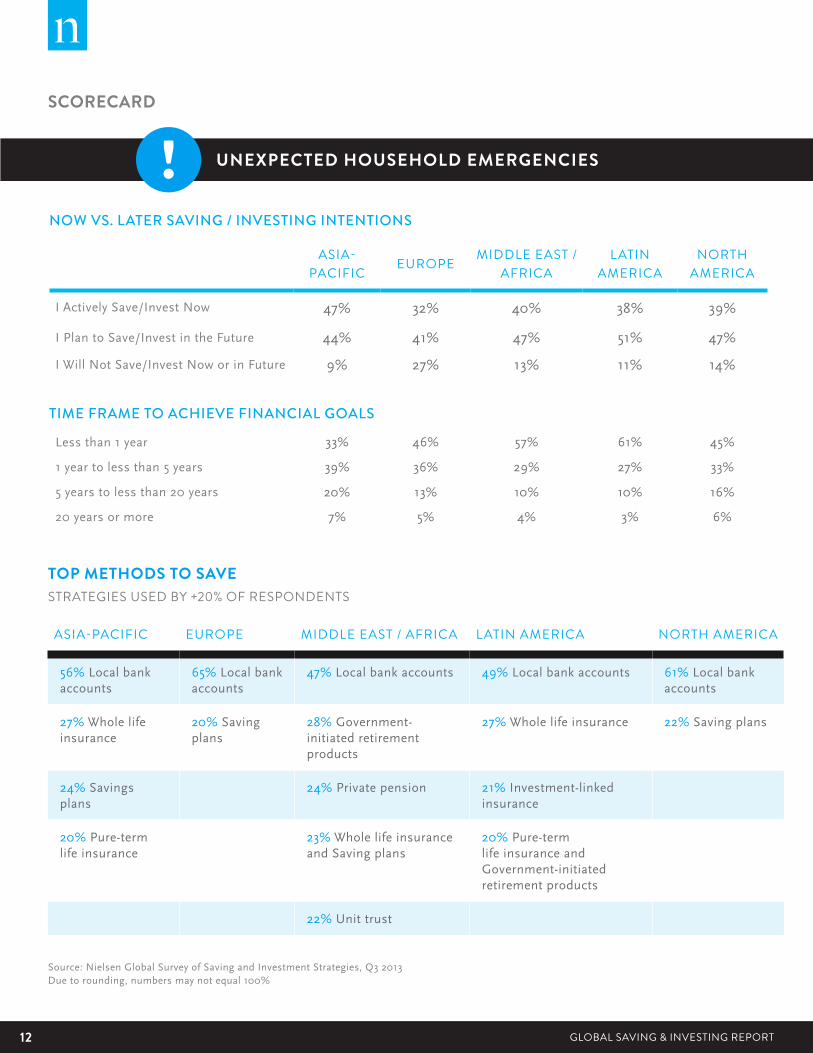
EXPECTING THE UNEXPECTEDSTRATEGIES TO SAVE FOR UNEXPECTED HOUSEHOLD EMERGENCIES
As the single financial goal with the highest percentage of active savers
in North America, Latin America and Europe, and the second-highest
percentage in Asia-Pacific and Middle East/Africa, it seemed that saving
for unexpected household emergencies was anything but unexpected.
Nearly half of Asia-Pacific respondents (47%) were actively investing to
fund this financial goal, followed by Middle East/Africa (40%), North
America (39%), Latin America (38%) and Europe (32%).
Whether dollars, euros or yen, it’s always helpful to have cash on hand
when emergencies pop up. The common thread across all regions was
the use of local currency as the primary investment strategy to fund
this goal: Europe (65%), North America (61%), Asia-Pacific (56%),
Latin America (49%) and Middle East/Africa (47%). Aside from cash,
other methods to save varied. Asia-Pacific respondents were more
likely to utilize whole life insurance (27%), and saving plans (24%),
and pure-term life insurance (20%). Latin Americans relied on whole
life insurance (27%), pure-term life insurance (20%) and government-
initiated products (20%) most commonly. One-fifth of Europeans and
North Americans counted on saving plans.
Much like the time span necessary to achieve funding for health-related
issues, online respondents in the Middle East/Africa and Latin America
had shorter-term success in mind when meeting goals for household
emergencies. Forty-percent of respondents in Latin America and 37
percent in the Middle East/Africa believed they were less than six
months away from saving enough, while roughly the same percentages
in Europe (45%), Asia-Pacific (41%), and North America (37%) needed
between six months and three years to reach this saving goal.
12 GLOBAL SAVING & INVESTING REPORT
ASIA-PACIFIC EUROPE MIDDLE EAST / AFRICA LATIN AMERICA NORTH AMERICA
56% Local bank accounts
65% Local bank accounts
47% Local bank accounts 49% Local bank accounts 61% Local bank accounts
27% Whole life insurance
20% Saving plans
28% Government-initiated retirement products
27% Whole life insurance 22% Saving plans
24% Savings plans
24% Private pension 21% Investment-linked insurance
20% Pure-term life insurance
23% Whole life insurance and Saving plans
20% Pure-term life insurance and Government-initiated retirement products
22% Unit trust
UNEXPECTED HOUSEHOLD EMERGENCIES
Source: Nielsen Global Survey of Saving and Investment Strategies, Q3 2013 Due to rounding, numbers may not equal 100%
NOW VS. LATER SAVING / INVESTING INTENTIONS
TIME FRAME TO ACHIEVE FINANCIAL GOALS
ASIA-PACIFIC EUROPE MIDDLE EAST /
AFRICALATIN
AMERICANORTH
AMERICA
I Actively Save/Invest Now 47% 32% 40% 38% 39%
I Plan to Save/Invest in the Future 44% 41% 47% 51% 47%
I Will Not Save/Invest Now or in Future 9% 27% 13% 11% 14%
Less than 1 year 33% 46% 57% 61% 45%
1 year to less than 5 years 39% 36% 29% 27% 33%
5 years to less than 20 years 20% 13% 10% 10% 16%
20 years or more 7% 5% 4% 3% 6%
TOP METHODS TO SAVESTRATEGIES USED BY +20% OF RESPONDENTS
SCORECARD

13GLOBAL SAVING & INVESTING REPORT Copyright © 2014 The Nielsen Company
UNEXPECTED HOUSEHOLD EMERGENCIES
MAKING THE GOLDEN YEARS MORE GOLDENSTRATEGIES TO SAVE FOR RETIREMENT
How golden our golden years will be depends largely on how well we
invest for our retirement. North American and Asia-Pacific respondents
were the most actively engaged savers, with 39 percent of respondents
in both regions currently saving to fund this goal. North America’s
strong focus on saving for retirement was also evidenced by the 30
percent of respondents who said that this was the one financial goal
that received the highest monthly contribution—more than double the
global average of 12 percent that said the same. Less than one-third of
respondents in Latin America (32%), Middle East/Africa (30%), and one-
fourth in Europe (26%) were presently saving for retirement. In Europe,
40 percent of respondents indicated that they had no intention to save
for retirement at all, compared to the global average of 22 percent.
“The difference in public and private retirement benefit programs gives
context to retirement saving sentiment reported by consumers around
the world,” said Rust. “When Americans retire, public-issued retirement
benefits are typically much less than the amount they earned while they
were employed; by comparison, Europeans rely on a greater share of
their income. But that is changing in some European markets where
mandatory employer pension plans are put in place in order to replace
government plans in the longer term. Now more than ever, a greater
reliance on private savings is needed to compensate.”
14 GLOBAL SAVING & INVESTING REPORT
A diverse portfolio of products and services were deployed when it came
to the saving and investment strategies used to fund retirement. In the
Middle East/Africa, 14 of 16 different investment products were used by
more than 20 percent of respondents, with local bank accounts (60%),
company pension (41%), government-initiated products (40%) and
whole life insurance (40%) the most popular options. In Asia-Pacific, 12
products were deployed among more than 20 percent of respondents,
with local bank accounts (64%), company pension (49%), whole life
insurance (37%), private pension (36%) and government initiated
products (35%) most relied on.
In Latin America and North America, eight products were used among
more than 20 percent of respondents. Latin Americans largely utilized
local bank accounts (55%), but also valued government-initiated
products (40%), whole life insurance (35%) and company pension
(35%). Most North Americans used local bank accounts (58%), followed
by company pension (38%), stocks (33%) and bonds (28%). Europeans
were the least diversified of the regions, with only five products used
by more than 20 percent of respondents: local bank accounts (59%),
private pension (39%), whole life insurance (32%), company pension
(32%) and government-initiated products (27%).
As would be expected, the time frame to achieve financial goals
for retirement was longer than other shorter-term goals. Half of all
respondents said it would take 10 years or more to save enough for
retirement, with Europeans (56%), North Americans (52%) and Latin
Americans (52%) exceeding that average.
15GLOBAL SAVING & INVESTING REPORT Copyright © 2014 The Nielsen Company
RETIREMENT
NOW VS. LATER SAVING / INVESTING INTENTIONS
ASIA-PACIFIC EUROPE MIDDLE EAST /
AFRICALATIN
AMERICANORTH
AMERICA
I Actively Save/Invest Now 39% 26% 30% 32% 39%
I Plan to Save/Invest in the Future 47% 35% 49% 52% 41%
I Will Not Save/Invest Now or in Future 14% 40% 22% 16% 20%
Less than 1 year 18% 12% 30% 17% 19%1 year to less than 5 years 17% 17% 17% 16% 16%5 years to less than 20 years 40% 35% 27% 36% 41%20 years or more 24% 36% 26% 31% 25%
TOP METHODS TO SAVESTRATEGIES USED BY +20% OF RESPONDENTS
Source: Nielsen Global Survey of Saving and Investment Strategies, Q3 2013 | Due to rounding, numbers may not equal 100%
TIME FRAME TO ACHIEVE FINANCIAL GOALS
SCORECARD
ASIA-PACIFIC EUROPE MIDDLE EAST / AFRICA LATIN AMERICA NORTH AMERICA
64% Local bank accounts 59% Local bank accounts 60% Local bank accounts 55% Local bank
accounts58% Local bank accounts
49% Company pension 39% Private pension 41% Company pension
40% Government-initiated retirement products
38% Company pension
37% Whole life insurance
32% Whole life insurance and Company pension
40% Whole life insurance and Government-initiated retirement products
35% Whole life insurance and Company pension
33% Stock trading
36% Private pension
27% Government-initiated retirement products 33% Private pension 32% Private pension 28% Bonds and
Private pension
35% Government-initiated retirement products
26% Unit trust, Property investment and Saving plans
21% Unit trust, Pure term life insurance and Saving plans
26% Structured investment products
26% Savings plans 23% Bonds 24% Whole life insurance
24% Stock trading, Pure term life insurance
25% Foreign currency, Stock trading, Pure term life insurance, Investment-linked insurance
22% Savings plans
23% Bonds 23% Structured investment products
21% Investment-linked insurance 22% Bonds
20% Unit trust
16 GLOBAL SAVING & INVESTING REPORT
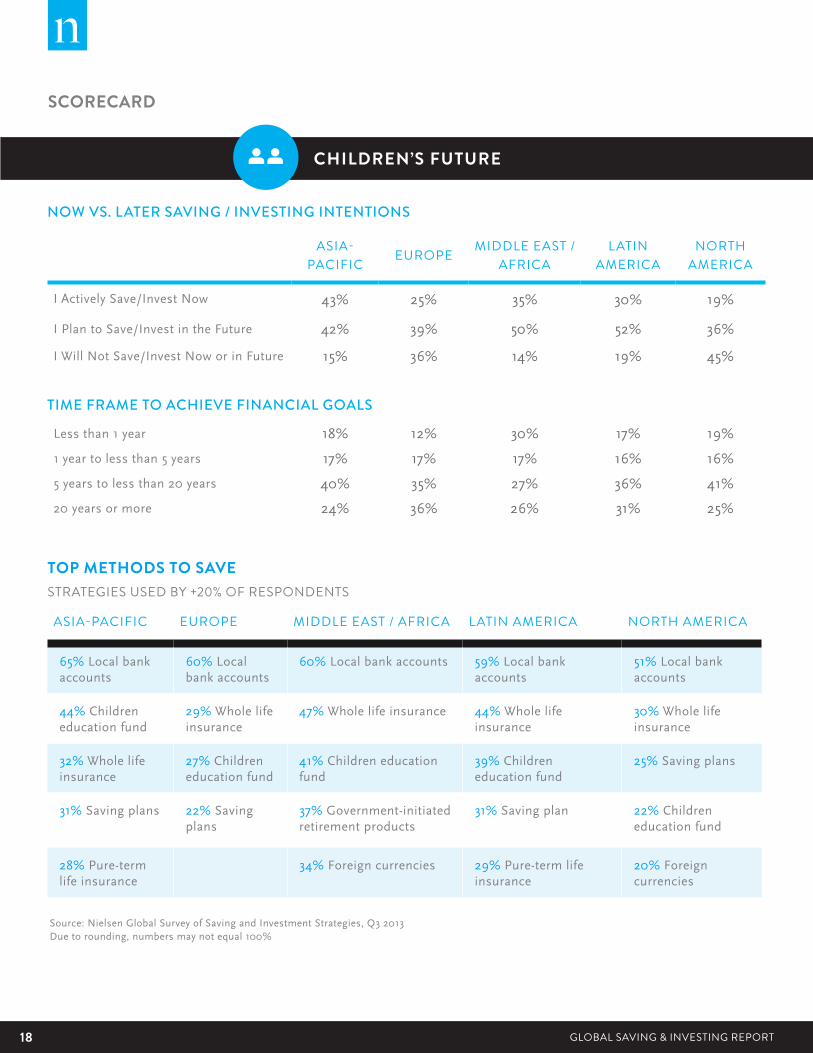
PAVING THE WAY FOR OUR CHILDRENSTRATEGIES TO SAVE FOR THE CHILDREN’S FUTURE
“A person’s a person, no matter how small,” famously written by
Dr. Seuss in his children’s classic, HORTON HEARS A WHO. That
sentiment rang truest among respondents in Asia-Pacific (43%) and
the Middle East/Africa (35%), where saving for their children’s future
exceeded the global average of 34 percent. Latin Americans (30%),
Europeans (25%) and North Americans (19%) were not as immediately
engaged. It was also one goal that rose above the others in every
region (except North America) as receiving the highest monthly income
allocation among active savers.
Middle East/African respondents utilized a diversified saving strategy
for their children’s future, with all 20 investment products used by more
than 25 percent of respondents. Local bank accounts (60%), whole life
insurance (47%), children’s education fund (41%) and government-
initiated products (37%) were the top methods used. More than 20
percent of Latin Americans deployed 18 investment products—most
popular strategies included local bank accounts (59%), whole life
insurance (44%), children’s education fund (39%), and saving plans
(31%). In Asia-Pacific, local bank accounts (65%), children’s education
fund (44%), whole life insurance (32%) and saving plans (31%) were the
most popular investment products deployed.
17GLOBAL SAVING & INVESTING REPORT Copyright © 2014 The Nielsen Company
Comparatively, respondents in North America and Europe were not
as diversified in funding their children’s future. More than 20 percent
of North Americans were satisfied with five of 20 products, while
Europeans relied upon only four. North Americans utilized local bank
accounts (51%), followed by whole life insurance (30%), saving plans
(25%), children’s education fund (22%) and foreign currencies (20%).
Top investment strategies in Europe included, local bank accounts
(60%), whole life insurance (29%), children’s education fund (27%) and
saving plans (22%).
The majority of online respondents in the Middle East/Africa (58%) and
Latin America (52%) believed they were less than five years away from
achieving their financial goal for saving for the children’s future, while
half European (59%), North American (57%) and Asia-Pacific (49%)
respondents needed more time—five or more years.
“Saving priorities are largely dictated by local market dynamics,” said
Rust. “In markets where consumers are hit by high school fees and
the lack of public school availability, a significantly larger proportion
of income and savings is dedicated towards ensuring children receive
a good education from an early age. For consumers in markets where
public schools are the norm, we do tend to see longer-term saving
strategies that are dedicated specifically to the high cost of ensuring
children receive tertiary-level education.”
18 GLOBAL SAVING & INVESTING REPORT
CHILDREN’S FUTURE
NOW VS. LATER SAVING / INVESTING INTENTIONS
TIME FRAME TO ACHIEVE FINANCIAL GOALS
ASIA-PACIFIC EUROPE MIDDLE EAST /
AFRICALATIN
AMERICANORTH
AMERICA
I Actively Save/Invest Now 43% 25% 35% 30% 19%
I Plan to Save/Invest in the Future 42% 39% 50% 52% 36%
I Will Not Save/Invest Now or in Future 15% 36% 14% 19% 45%
Less than 1 year 18% 12% 30% 17% 19%
1 year to less than 5 years 17% 17% 17% 16% 16%
5 years to less than 20 years 40% 35% 27% 36% 41%
20 years or more 24% 36% 26% 31% 25%
ASIA-PACIFIC EUROPE MIDDLE EAST / AFRICA LATIN AMERICA NORTH AMERICA
65% Local bank accounts
60% Local bank accounts
60% Local bank accounts 59% Local bank accounts
51% Local bank accounts
44% Children education fund
29% Whole life insurance
47% Whole life insurance 44% Whole life insurance
30% Whole life insurance
32% Whole life insurance
27% Children education fund
41% Children education fund
39% Children education fund
25% Saving plans
31% Saving plans 22% Saving plans
37% Government-initiated retirement products
31% Saving plan 22% Children education fund
28% Pure-term life insurance
34% Foreign currencies 29% Pure-term life insurance
20% Foreign currencies
TOP METHODS TO SAVESTRATEGIES USED BY +20% OF RESPONDENTS
Source: Nielsen Global Survey of Saving and Investment Strategies, Q3 2013 Due to rounding, numbers may not equal 100%
SCORECARD
19GLOBAL SAVING & INVESTING REPORT Copyright © 2014 The Nielsen Company
CHILDREN’S FUTURE
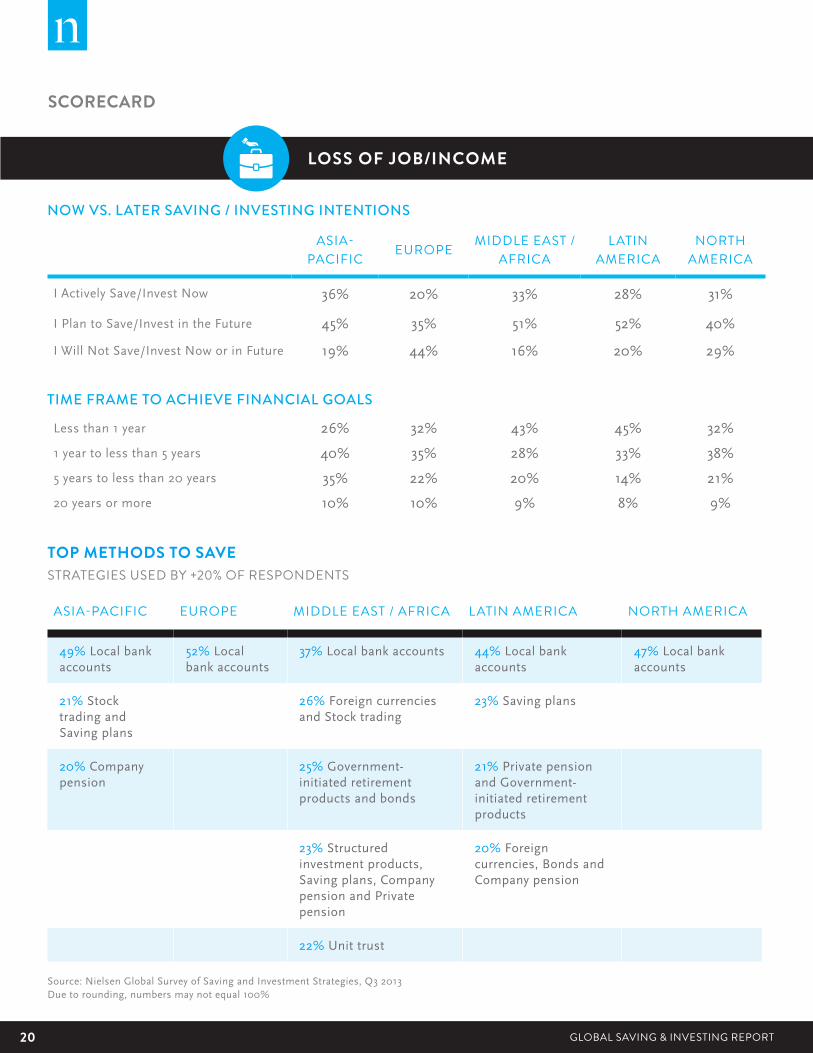
A SAFETY NET IF WE ARE DROPPEDSTRATEGIES TO SAVE FOR THE LOSS OF A JOB/INCOME
Whether it is interest rates, gas prices or the cost of milk, many of the
financial decisions we make exist on a sliding scale. While we plan
and adjust our expectations regularly, what happens when the bottom
drops out? Planning for unemployment while you’re employed provides
a necessary parachute to soften the landing. Asia-Pacific respondents
were most actively building a safety net, with 36 percent in the region
currently saving for the loss of income. Respondents in Middle East/
Africa (33%), North America (31%) and Latin America (28%) were
close behind, but Europe trailed all the regions substantially at 20
percent. The number of European respondents actively not planning for
retirement (44% compared to a global average of 26%) only magnified
this finding.
“While increasing the awareness of good financial planning is critical,
the difference in severance payments mandated by the governments in
these respective regions may explain some of the differences in savings
plans,” said Rust. “In regions where high levels of mandated employee
protections are in place in the event of severance, we see lower levels
of planning associated with such events—however this safety net
isn’t provided to all consumers. Trust is also a factor, and there is still
trepidation ever since the economic downturn in relying too heavily on
investments.”
Local bank accounts were used by fewer Middle East/Africa respondents
(37%) than the other regions to plan for the loss of a job, but they relied
on alternate methods at higher rates to compensate. One-fourth of
respondents used foreign currency (26%), stock trading (26%), stocks
(25%) and bonds (25%). In Latin America, local bank accounts (44%),
saving plans (23%), private pensions (21%) and government-initiated
products (21%) were among the most commonly utilized products in
the region. Asia-Pacific respondents were slightly less diversified, but
still counted local bank accounts (49%), stock trading (21%), saving
plans (21%) and company pension (20%). Conversely, Europe and North
America were the least diversified regions, where half of respondents
(52% and 47%, respectively) relied upon local bank accounts to save
for possible unemployment. The majority of respondents globally (52%)
believed they were less than three years away from saving enough to
sustain a job loss.
20 GLOBAL SAVING & INVESTING REPORT
LOSS OF JOB/INCOME
NOW VS. LATER SAVING / INVESTING INTENTIONS
TIME FRAME TO ACHIEVE FINANCIAL GOALS
ASIA-PACIFIC EUROPE MIDDLE EAST /
AFRICALATIN
AMERICANORTH
AMERICA
I Actively Save/Invest Now 36% 20% 33% 28% 31%
I Plan to Save/Invest in the Future 45% 35% 51% 52% 40%
I Will Not Save/Invest Now or in Future 19% 44% 16% 20% 29%
Less than 1 year 26% 32% 43% 45% 32%
1 year to less than 5 years 40% 35% 28% 33% 38%
5 years to less than 20 years 35% 22% 20% 14% 21%
20 years or more 10% 10% 9% 8% 9%
ASIA-PACIFIC EUROPE MIDDLE EAST / AFRICA LATIN AMERICA NORTH AMERICA
49% Local bank accounts
52% Local bank accounts
37% Local bank accounts 44% Local bank accounts
47% Local bank accounts
21% Stock trading and Saving plans
26% Foreign currencies and Stock trading
23% Saving plans
20% Company pension
25% Government-initiated retirement products and bonds
21% Private pension and Government-initiated retirement products
23% Structured investment products, Saving plans, Company pension and Private pension
20% Foreign currencies, Bonds and Company pension
22% Unit trust
TOP METHODS TO SAVESTRATEGIES USED BY +20% OF RESPONDENTS
Source: Nielsen Global Survey of Saving and Investment Strategies, Q3 2013 Due to rounding, numbers may not equal 100%
SCORECARD
21GLOBAL SAVING & INVESTING REPORT Copyright © 2014 The Nielsen Company
LOSS OF JOB/INCOME
THE JOY OF HOME OWNERSHIPSTRATEGIES TO SAVE FOR A FIRST-TIME HOME
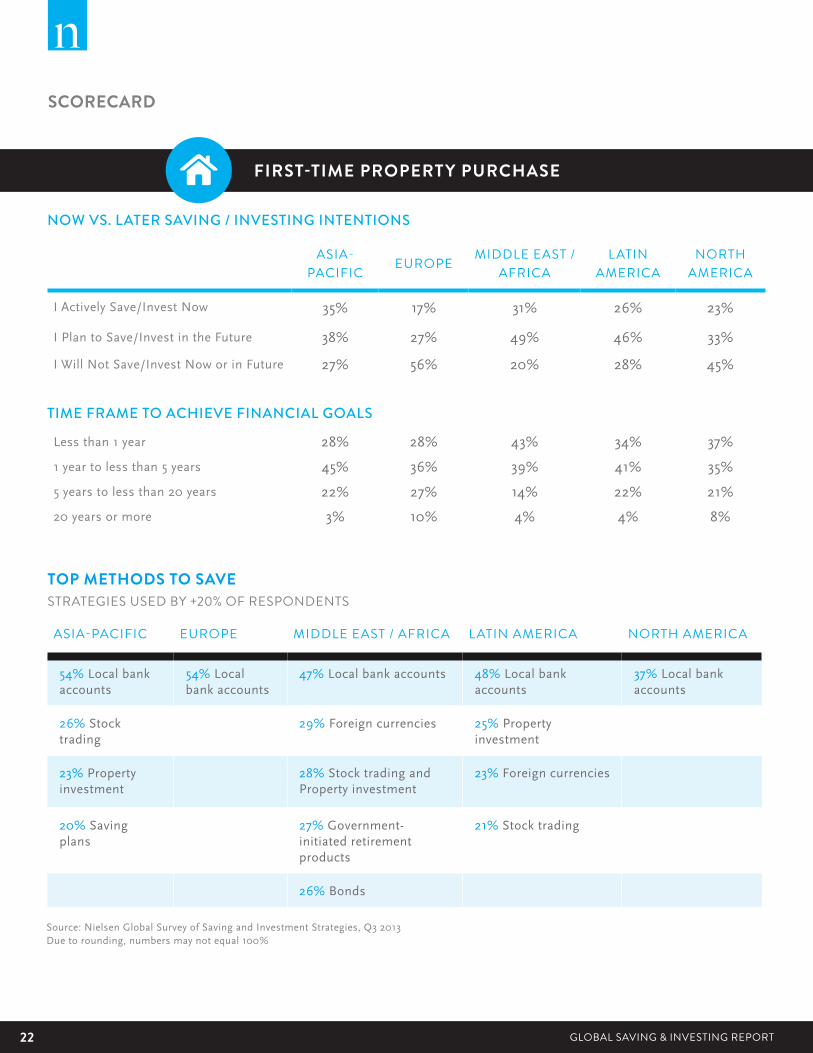
Buying a first home can be overwhelming, exciting, scary, rewarding
and most of all, hard work. A lot of strategic planning goes into what
is typically a longer-term financial commitment for most first-time
home buyers. The greatest percentage of active savers were found in
Asia-Pacific (35%), followed closely by respondents in Middle East/
Africa (31%), Latin America (26%) and North America (23%). European
respondents trailed the other regions at 17 percent.
Using local bank accounts to fund a first-time home purchase was the
dominant source across the regions, but a mix of stocks and bonds were
also deployed. In the Middle East/Africa region, the most commonly
used products were local bank accounts (47%), foreign currency (29%),
stock trading (28%), property investment (28%) and government-
initiated products (27%). Latin Americans relied on local bank accounts
(48%), property investment (25%), foreign currencies (23%) and
stock trading (21%). Asia-Pacific respondents relied on local bank
accounts (52%), stock trading (26%) and property investment (23%).
Respondents in North America and Europe utilized local bank accounts
(37% and 54%, respectively) at the highest rates.
The majority of respondents in all regions believed they would meet their
goals for a first-time property purchase in less than three years, with the
exception of Europe, where expectations were longer— less than five
years. One-fifth of respondents in Middle East/Africa (22%) and North
America (21%) had high expectations that they would achieve this goal
in less than six months.
“The aspirations of upward mobility and the opportunity to own a home
is apparent in some of the more developing regions of the world,” said
Rust. “But due to the cost of housing, affordability and the amount of
disposable income makes it easier to attain in some markets more than
others.”
22 GLOBAL SAVING & INVESTING REPORT
FIRST-TIME PROPERTY PURCHASE
Source: Nielsen Global Survey of Saving and Investment Strategies, Q3 2013 Due to rounding, numbers may not equal 100%
NOW VS. LATER SAVING / INVESTING INTENTIONS
TIME FRAME TO ACHIEVE FINANCIAL GOALS
ASIA-PACIFIC EUROPE MIDDLE EAST /
AFRICALATIN
AMERICANORTH
AMERICA
I Actively Save/Invest Now 35% 17% 31% 26% 23%
I Plan to Save/Invest in the Future 38% 27% 49% 46% 33%
I Will Not Save/Invest Now or in Future 27% 56% 20% 28% 45%
Less than 1 year 28% 28% 43% 34% 37%
1 year to less than 5 years 45% 36% 39% 41% 35%
5 years to less than 20 years 22% 27% 14% 22% 21%
20 years or more 3% 10% 4% 4% 8%
ASIA-PACIFIC EUROPE MIDDLE EAST / AFRICA LATIN AMERICA NORTH AMERICA
54% Local bank accounts
54% Local bank accounts
47% Local bank accounts 48% Local bank accounts
37% Local bank accounts
26% Stock trading
29% Foreign currencies 25% Property investment
23% Property investment
28% Stock trading and Property investment
23% Foreign currencies
20% Saving plans
27% Government-initiated retirement products
21% Stock trading
26% Bonds
TOP METHODS TO SAVESTRATEGIES USED BY +20% OF RESPONDENTS
SCORECARD
23Copyright © 2014 The Nielsen Company
COUNTRIES INCLUDED IN THIS STUDY
Estonia 78%
Finland 89%
France 80%
Germany 83%
Greece 53%
Hungary 65%
Ireland 77%
Israel 70%
Italy 58%
Latvia 72%
Lithuania 65%
Netherlands 93%
Norway 97%
Poland 65%
Portugal 55%
Romania 44%
Russia 48%
Serbia 56%
Slovakia 79%
Slovenia 72%
Spain 67%
Sweden 93%
Switzerland 82%
Turkey 46%
United Kingdom 84%
Ukraine 34%
Source: Internet World Stats, June 30, 2012
LATIN AMERICAMARKET INTERNET
PENETRATION
Argentina 66%
Brazil 46%
Chile 59%
Colombia 60%
Mexico 37%
Peru 37%
Venezuela 41%
MIDDLE EAST / AFRICAMARKET INTERNET
PENETRATION
Egypt 36%
Pakistan 15%
Saudi Arabia 49%
South Africa 17%
United Arab Emirates
71%
NORTH AMERICA
MARKET INTERNET PENETRATION
Canada 83%
United States 78%
ASIA-PACIFICMARKET INTERNET
PENETRATION
Australia 89%
China 40%
Hong Kong 75%
India 11%
Indonesia 22%
Japan 80%
Malaysia 61%
New Zealand 88%
Philippines 32%
Singapore 75%
South Korea 83%
Taiwan 75%
Thailand 30%
Vietnam 34%
EUROPEMARKET INTERNET
PENETRATION
Austria 80%
Belgium 81%
Bulgaria 51%
Croatia 71%
Czech Republic 73%
Denmark 90%
ASIA PACIFIC
EUROPE
LATIN AMERICA
MIDDLE EAST/AFRICA
NORTH AMERICA
GLOBAL SAVING & INVESTING REPORT
ABOUT THE NIELSEN GLOBAL SURVEY
The Nielsen Global Survey of Saving and Investment Strategies was
conducted between August 14 and September 6, 2013, and polled
more than 30,000 consumers in 60 countries throughout Asia-Pacific,
Europe, Latin America, the Middle East, Africa and North America. The
sample has quotas based on age and sex for each country based on
their Internet users, and is weighted to be representative of Internet
consumers and has a maximum margin of error of ±0.6%. This Nielsen
survey is based on the behavior of respondents with online access only.
Internet penetration rates vary by country. Nielsen uses a minimum
reporting standard of 60 percent Internet penetration or 10M online
population for survey inclusion. The Nielsen Global Survey, which
includes the Global Consumer Confidence Survey, was established in
2005.
ABOUT NIELSEN Nielsen Holdings N.V. (NYSE: NLSN) is a global information and
measurement company with leading market positions in marketing
and consumer information, television and other media measurement,
online intelligence and mobile measurement. Nielsen has a presence in
approximately 100 countries, with headquarters in New York, USA and
Diemen, the Netherlands.
For more information, visit www.nielsen.com.
Copyright © 2014 The Nielsen Company. All rights reserved. Nielsen and
the Nielsen logo are trademarks or registered trademarks of CZT/ACN
Trademarks, L.L.C. Other product and service names are trademarks or
registered trademarks of their respective companies. 14/7300

25GLOBAL SAVING & INVESTING REPORT Copyright © 2014 The Nielsen Company


![Be Prepared [NOT] To Be Financially Repressed](https://img.pdfslide.us/doc/110x75/577cdfec1a28ab9e78b249b8/be-prepared-not-to-be-financially-repressed.jpg)