Embed Size (px)
Citation preview
July 14, 2006
Are Protective Labor Market Institutions Really at the Root of Unemployment? A Critical Perspective on the Statistical Evidence1
David R. Howell, Dean Baker, Andrew Glyn and John Schmitt
It is widely accepted that the rigidities created by labor market institutions explain the pattern of unemployment across countries. A rapidly expanding recent literature has explored the statistical support for this orthodox view. This paper offers a critical perspective on the evidence. We focus on the protective institutions that are the usual suspects: unemployment benefit entitlements, employment protection laws, and trade unions. Given the dominance of this view, the simple correlation evidence offers remarkably little support. The most robust finding of the cross-country regression literature points to a potentially important role for unemployment benefits generosity, but there are reasons to doubt the strength of this relationship and even the direction of causation. The micro evidence on the effects of major changes in benefit generosity on the duration of unemployment (and the exit rate into employment) is much less supportive of a sizable impact of benefit generosity on the aggregate unemployment rate than is often suggested. Finally, we find little evidence to suggest that changes in the strength of these protective labor market institutions can explain either the success of the “success stories” or the continued high unemployment of the four large continental European countries.

2
1. Unemployment and Institutions: The Basic Facts 2. Measurement Issues 2.1 Unemployment 2.2 Labor Market Institutions 3. Correlation Evidence 3.1 Casual Associations 3.2 Simple Correlations 4. Macroeconometric Evidence 4.1 The Consensus View: Centrality of Labor Market Institutions 4.2 Early OECD Studies 4.3 Other Early Cross-Country Studies 4.4 Explaining Changes over Time with Annual Data 4.5 Time Series Evidence from the UK 4.6 Assessment 5. Unemployment Benefit Compensation and Unemployment 5.1 Some Initial Considerations 5.2 Interpretation of Benefit Effects 5.3 The Microeconometric Evidence 5.3.1 Evidence from Literature Surveys 5.3.2 Micro Evidence on Unemployment Duration 5.4 Assessment 6. Comprehensive Labor Market Reform and Unemployment 6.1 Nickell’s Reforms Index 6.2 OECD Reforms Indices 7. Conclusion
3
As recently as 1979, only Ireland and Portugal among the 20 most developed (OECD-
member) countries reported unemployment rates above 8 percent (each at about 8.5%). Just
four years later, 11 of these 20 countries posted higher rates and six reached double-digit
levels, ranging from Belgium (10.7%) to Ireland (14.9%). This collapse in employment
performance persisted throughout the 1980s and 1990s. Between 1995 and 1997, as the U.S.
was showing rates between 5.6 to 4.9 percent, OECD-Europe ranged from 10.1 to 9.7
percent. By 2005, the OECD-Europe rate had dropped to 8.6 percent, but both core
economies of continental Europe, France and Germany, had rates of 9.5 percent.2
Much like the response of economists to the Great Depression, the dominant
explanation for persistent high unemployment has centered on supply-side rigidities
generated by protective labor market institutions, and correspondingly, the proposed solution
has been greater (downward) wage flexibility and stronger work incentives. As Fitoussi
(2006) has put it, “The reference model, in the plea for structural reforms, is centered on an
economy with perfect competition and rational expectations. In such a model full
employment is always assured absent rigidities...”. Spurred in particular by the influence of
the Layard, Nickell and Jackman (1991) and the OECD’s Jobs Study (1994), this orthodox
rigidity account thoroughly ruled the field by the late 1990s with quite straightforward policy
implications. The IMF (2003, p. 129) points out that “leading international institutions – the
IMF, OECD and the European Commission – have long argued that the causes of
unemployment can be found in labor market institutions. Accordingly, countries with high
unemployment have been repeatedly urged to undertake comprehensive structural reforms to
reduce ‘labor market rigidities.’” This view has become so widely accepted that a leading
scholar could recently claim in the Journal of Economic Perspectives that “evidence supports
the traditional view that rigidities that reduce competition in labor markets are typically
responsible for high unemployment” without actually citing any peer-reviewed evidence (St.
Paul, 2004, p. 53).
Three labor market institutions have been held to play the premier roles in the
promotion of employment-unfriendly rigidities: unemployment benefit entitlements,
employment protection laws, and trade unions.3 Not coincidentally, these are the key
institutional mechanisms most developed countries have relied upon to shelter less-skilled
workers from the most harmful effects of competitive labor markets. We will refer to them as
4
“protective labor market institutions” (PLMIs) and distinguish them from other key
institutions that have important labor market effects. These include active labor market
policies (ALMP), which are concerned with matching and preparing workers for jobs; tax
policy, which influences behavior and affects labor costs, but is principally designed to raise
revenue, not protect workers; and housing policies, which affect ownership rates and could
affect worker mobility, but are not designed to protect workers as workers.
The dominance of the orthodox rigidities explanation of unemployment and the recent
focus on macroeconometric testing reflects a striking evolution in mainstream economics. As
recently as 1994, Charles Bean’s influential survey of European unemployment allocated
little space to evidence on the effects of these key PLMIs on employment performance,
finding little compelling empirical support in the literature for any of them.4 Bean concluded
with three recommendations for future research, the first of which was to discourage
macroeconometric testing: “There is simply not enough information in the data to give clear
signals on the relative merits of the competing hypotheses” (p. 615). Ignoring this advice,
cross-country macroeconometric studies have expanded at an increasing rate (e.g., see
OECD, 2006; Blanchard, 2006).
This paper critically assesses the empirical evidence on the effects of labor market
institutions on the cross country pattern of unemployment, focusing on the role played by the
three core protective institutions – unemployment benefits, employment protection, and trade
unions. After outlining the basic facts on the cross-country pattern of unemployment and
labor market institutions, section 2 considers some issues of measurement. Section 3 then
evaluates the simple correlation evidence between standard measures of labor market
institutions and unemployment. Section 4 addresses the macroeconometric evidence. Since
the most robust evidence in favor of the orthodox rigidity view concerns the role played by
unemployment benefit generosity, Section 5 takes a closer look at the interpretation of
benefit effects in the macroeconometric research. It also reviews the microeconometric
evidence, which has often been cited as supporting evidence. Section 6 then assesses recent
efforts to develop aggregate indicators of labor market reform with the goal of showing the
payoff of comprehensive labor market reform for employment performance. We conclude in
Section 7 with a summary and a brief discussion of the interplay between theory, evidence
and policy recommendations.
5
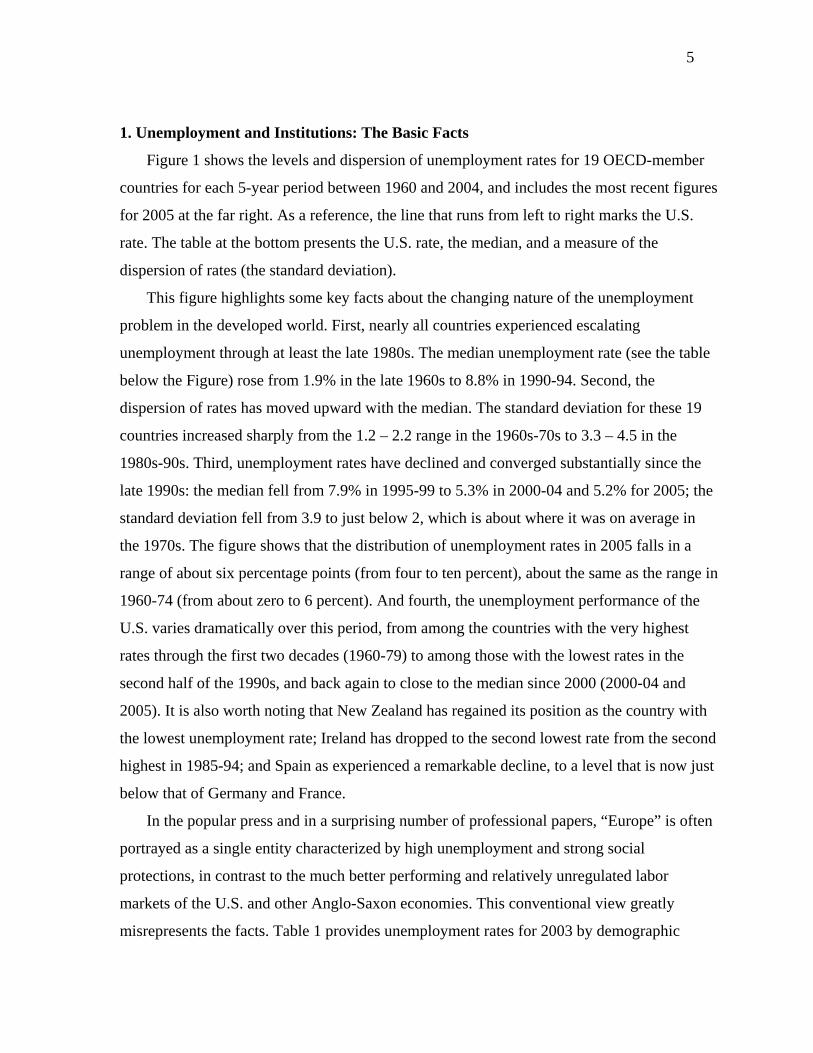
1. Unemployment and Institutions: The Basic Facts
Figure 1 shows the levels and dispersion of unemployment rates for 19 OECD-member
countries for each 5-year period between 1960 and 2004, and includes the most recent figures
for 2005 at the far right. As a reference, the line that runs from left to right marks the U.S.
rate. The table at the bottom presents the U.S. rate, the median, and a measure of the
dispersion of rates (the standard deviation).
This figure highlights some key facts about the changing nature of the unemployment
problem in the developed world. First, nearly all countries experienced escalating
unemployment through at least the late 1980s. The median unemployment rate (see the table
below the Figure) rose from 1.9% in the late 1960s to 8.8% in 1990-94. Second, the
dispersion of rates has moved upward with the median. The standard deviation for these 19
countries increased sharply from the 1.2 – 2.2 range in the 1960s-70s to 3.3 – 4.5 in the
1980s-90s. Third, unemployment rates have declined and converged substantially since the
late 1990s: the median fell from 7.9% in 1995-99 to 5.3% in 2000-04 and 5.2% for 2005; the
standard deviation fell from 3.9 to just below 2, which is about where it was on average in
the 1970s. The figure shows that the distribution of unemployment rates in 2005 falls in a
range of about six percentage points (from four to ten percent), about the same as the range in
1960-74 (from about zero to 6 percent). And fourth, the unemployment performance of the
U.S. varies dramatically over this period, from among the countries with the very highest
rates through the first two decades (1960-79) to among those with the lowest rates in the
second half of the 1990s, and back again to close to the median since 2000 (2000-04 and
2005). It is also worth noting that New Zealand has regained its position as the country with
the lowest unemployment rate; Ireland has dropped to the second lowest rate from the second
highest in 1985-94; and Spain as experienced a remarkable decline, to a level that is now just
below that of Germany and France.
In the popular press and in a surprising number of professional papers, “Europe” is often
portrayed as a single entity characterized by high unemployment and strong social
protections, in contrast to the much better performing and relatively unregulated labor
markets of the U.S. and other Anglo-Saxon economies. This conventional view greatly
misrepresents the facts. Table 1 provides unemployment rates for 2003 by demographic
6
group for countries in three groupings: six English-speaking countries with generally low
unemployment (Canada remains at higher levels); six high unemployment continental
European countries; and six European low unemployment countries.
This table shows that the six liberal, English speaking countries had average
unemployment rates nearly identical to those of the six low-unemployment European
countries for all four demographic groups – male and female young and prime age workers.
The five high-unemployment Continental countries show substantially higher unemployment
for each age-gender group. With the exception of Germany, each has experienced extremely
high youth unemployment. Female youth show rates of 17.5% in Belgium, 22.8% in France,
27.2% in Spain, and 30.9% in Italy; male youth rates range from 18-23%. Clearly, young
people in these four countries account for an important part of the European unemployment
problem. It should be recognized, however, that using an alternative measure of
unemployment – as a share of the youth population rather than as a share of the youth labor
force – the picture looks quite a bit different. With this alternative measure, for example,
France and the U.S. have similar youth unemployment rates (Howell, 2005, chapter 1).
The similarity between unemployment rates for the liberal English-speaking countries
and low-unemployment Europe is notable because the latter remain characterized by strong
welfare states and highly protective labor market institutions. Table 2 shows that while both
of the European groups are characterized by much higher levels of social protection and
regulation (rows 4-9) and much higher tax revenue shares (row 10), only the
conservative/corporatist economies of ‘high-unemployment Europe” show worse
employment performance than the liberal economies. Indeed, on both unemployment and
employment rates, the northern European welfare states show, on average, superior labor
market performance to the liberal ones (rows 1-3), and they do so with much lower wage
inequality (row 11). As Nickell (1997; 2003) has pointed out, many Europeans live in regions
with lower unemployment rates than the U.S. and most of the unemployed of Europe live in
four large countries (France, Spain, Italy and Germany).
2. Measurement Issues
7
Before examining considering the statistical evidence on the relationships between
unemployment and labor market institutions, it is worth taking a brief look at the
construction and quality of the measures. While the literature has been characterized by a
steady increase in the sophistication of econometric techniques, remarkably little attention
has been paid to the quality and consistency of the data. This is particularly curious, since,
thanks largely to the efforts of the OECD, there have been impressive improvements in both
the quality of the institutional measures and the consistency of the unemployment series.
2.1 Unemployment
For the most part, empirical work on unemployment has proceeded under the assumption
that the dependent variable – the unemployment rate – is well-measured and comparable
(“harmonized” or “standardized”) over time and across countries. Indeed, rarely do authors
offer more than simply a citation for the source of the variable. But a closer look at the data
shows that comparability is often limited and that the many different series in use can
produce quite different results.
The source data are collected at the national level, both as “registered” unemployment
(collected by the national employment service) and from household surveys (similar to the
U.S. Current Population Survey). Over time, OECD countries have adopted international
standards that establish the criteria for who is “unemployed” based on household surveys, but
some series refer to those between 15-64 (for the U.S. it is age 16) and others to those over
age 15. While comparability has increased as data collection and processing methods and
criteria have converged across countries, both the OECD and the U.S. Bureau of Labor
Statistics have developed additional series that attempt to make the rates more comparable
(Sorrentino, 2000).
But full comparability remains elusive. Since the unemployed cannot be employed,
how a respondent replies to the question asking whether or not he/she was employed for at
least an hour for pay in the reference week will reflect to some degree local social norms and
levels of economic development (Howell, 2005). What is considered “real” employment may
differ substantially across regions and countries, and this may help explain, for example, how
Mexico and the U.S. could have similar unemployment rates, calculated with similar
definitions and methods (Howell, 2005; Martin, 2000).
8
In the early unemployment-institutions tests by Layard, Nickell and Jackman (1991) a
simple cross section of unemployment rates averaged over the 1984-89 period was used. As
the literature has progressed, analysts have demanded annual series covering a much longer
period, often stretching back to the early 1960s, and aimed at explaining changes in
unemployment over time with changes in institutional and policy measures, with fixed
country effects (see section 4). This empirical strategy relies heavily on the use of historically
consistent unemployment rate series for each country.5 For many countries, this consistency
criterion is clearly not satisfied. National methods have changed substantially over this
period and there is no standardized or even historically consistent series that comes close to
dating back even to the 1970s for many of the 19 or so OECD countries that usually appear
in the cross-country tests. For example, the OECD’s standardized data extend back to 1980
for just 9 OECD countries. The OECD’s longest historical unemployment series (not
standardized) is available for just 9 countries for 1970 and 4 countries for 1965.6
Our attempt to determine the change in the OECD’s unemployment rate for The
Netherlands over the last two decades offers an illustration of the problem with the historical
statistics. The Bassanini-Duval (2006) macroeconometric tests provide the empirical basis
for Chapter 7 of the new OECD Employment Outlook (2006). This research focuses on the
1982-2003 period, and in both the Bassanini-Duval report and the Employment Outlook
Chapter, a cross-country scatter plot of predicted against “observed” changes in
unemployment is presented for 1982-2003 (OECD 2006, Figure 7.3). The conclusion drawn
from this correlation is that a small number of labor market policies and institutions can
largely account for cross-country differences in how unemployment has evolved since the
early 1980s.
The Bassanini-Duval figure shows a decline in unemployment over the 1982-2003 period
for Holland of over 9 percentage points, based on a 1982 rate of 13.2 percent. The referenced
source is the OECD’s Labour Force Statistics, but in the OECD’s Labour Force Statistics
publication (OECD, 2004) the change is just 7.4 percentage points (11.6% in 1982 to 4.2% in
2003). Another OECD series – the standardized rates that appear in the OECD’s
Employment Outlook - shows a still smaller change of 4 points (7.68 to 3.68). By way of
comparison, the series used by the IMF (2003) and Nickell et al. (2001) shows a 4.8 point
change (8.5 to 3.7).7 The poorly performing countries are located at the other end of the
9
Bassanini-Duval figure. The worst among these is Switzerland, which shows an increase in
observed unemployment for 1982-2003 of about 4 percentage points. The problem is that it is
computed on the basis of an implausibly low 1982 unemployment rate of 0.2 percent. Prior to
1991, the Swiss data referred only to registered unemployment, and for this reason the OECD
publishes no standardized figures for Switzerland prior to that date. In short, the 4 point
increase in Swiss unemployment reflects a comparison of a registered rate of 0.2 percent in
1982 and a household survey based rate of 4.2 percent in 2003. The change between them
has little meaning, either for changes in employment performance within the country or for
cross-country comparisons. Switzerland is by no means unique in relying on administrative
data for historical time series.8
The Dutch and Swiss are extreme examples that illustrate the weaknesses in the historical
time series on unemployment for many countries. The comparability of the unemployment
rate numbers declines substantially the further back the time series runs – it is not until the
early 1990s that nearly all major OECD member countries generally adopted the ILO
standard (the broad definition of unemployment based on household surveys). But even for
recent years, differences remain both across countries and over time within countries over
exactly how the ILO unemployment rate is calculated (such as what qualifies as “active” job
search), which may have important effects on the calculated rate. At a minimum, since the
quality and consistency of the data have evolved and the use of different series can produce
different results, it seems appropriate for studies to provide more documentation and
justification for their data.
2.2 Labor Market Institutions
Statistical tests of the effects of labor market institutions on the pattern of unemployment
required the development of measures of institutions and policies. This effort was pioneered
by Nickell and Layard, whose measures appeared in a series of papers and books in the early-
and mid-1990s (Layard, Nickell, and Jackman, 1991 and 1994; Nickell and Bell, 1994;
Layard and Nickell, 1996). Considerable subjective judgment was required for many of these
inherently difficult-to-measure institutions.
For example, the measure of unemployment benefits duration that was employed
extensively in the 1990s was an estimate of the number of years a representative unemployed
10
worker was eligible for benefits. Thus, Layard et al. (1994, p. 74) gave the U.S. a score of .5,
Denmark 2.5, and France 3.75. With eight other countries, The Netherlands received a 4,
indicating “indefinite” duration of benefits. In their survey of the benefit entitlement
literature, Atkinson and Micklewright (1991) single out these data for criticism, pointing out
that the institutional design of each of the countries with “indefinite” duration scores are
quite different, and these differences have substantial effects on how generous the systems
really are for which parts of the unemployed population.9 To take one example, Atkinson
and Micklewright (Table 3, p. 1696) explain that the reality behind the “indefinite” score for
the Netherlands in the mid-1980s is considerably more complicated and certainly not
indefinite: “UI at 70% of last earned wage for between 6 months and 5 years depending on
contribution record, plus one year of benefit at 70% of minimum wage… On expiry of UI,
(there is a) possibility of means-tested assistance.”
The creation of measures of institutions and policies like benefit duration, employment
protection, and bargaining coordination requires considerable subjective judgment, and this
has raised additional concerns. If the empirical tests are designed to confirm strongly held
theoretical priors (institution-caused rigidities explain unemployment) and the same
researchers generate the measures of the key explanatory variables (the institutions), it would
be likely that measures that do the best job of confirming the guiding hypotheses will be
preferred. Blanchard and Wolfers warn of this “Darwinian” effect:
One must worry however that these results are in part the result of research Darwinism. The measures used by Nickell have all been constructed ex-post facto, by researchers who were not unaware of unemployment developments. When constructing a measure of employment protection for Spain, it is hard to forget that unemployment in Spain is very high… Also, given the complexity in measuring institutions, measures which do well in explaining unemployment have survived better than those that did not (Blanchard and Wolfers, 2000, p. c22).
The 1994 Jobs Study triggered a major OECD effort to produce better quality
institutional measures. The objective was, like the first generation efforts, to facilitate tests of
the orthodox cornerstone of the Jobs Study, that strong labor market institutions explains
employment performance across countries. But the creation of these improved measures took
time, and meanwhile researchers demanded longer time series.
11
In the case of a measure of the strictness of employment protection laws, Blanchard and
Wolfers took the recently developed OECD country estimates (OECD, 1999) and merged
them with an entirely different series produced by Lazear (1990) to create an EPL score for
each 5-year period from the early 1960s to the mid-1990s. The extraordinarily detailed and
carefully constructed OECD EPL measures were available for just two data points: “the late
1980s” and “the late 1990s.” From these two estimates for each country, Blanchard and
Wolfers created another for 1990-94 by interpolating between the OECD’s late 1980s and
late 1990s scores, and still another for the early 1980s simply by using the late 1980s figures,
on the grounds that they did not have information to suggest that there were any changes
between the early and late 1980s. Thus, from two multi-year averages for the late 1980s and
late 1990s (OECD), four 5-year averages were created.
Blanchard and Wolfers (2000) then the Lazear data to do the same for the first two
decades (1960s and 1970s). But the Lazear and OECD measures are quite different, an issue
not addressed by either Blanchard-Wolfers or the many subsequent studies that also relied on
this EPL series. For the late 1980s and late 1990s, the OECD (1999) took into account three
dimensions of employment protection: “procedural inconveniences which the employer faces
when trying to dismiss; notice and severance pay provisions; and prevailing standards of and
penalties for unfair dismissal.” Further, their estimates were designed to cover both white and
blue collar workers. In contrast, Lazear's index is narrowly confined to just one of the three
OECD dimensions, severance pay and notice, and was further limited to “the number of
months of severance pay or notice a blue collar worker with ten years of service received
upon termination without ‘cause’” (emphasis added, p. 707-8).
By merging the OECD and Lazear series, Blanchard and Wolfers produced an EPL
measure for 5-year periods from the early 1960s to the late 1990s. Nickell et al. (2001, 2003,
2005) then annualized these data by simple interpolation. For consistency and lack of an
alternative, this mongrel EPL measure was then used (either in its annual or 5-year format)
for the tests published by many of the most influential subsequent studies, including the IMF
(2003), Belot and van Ours (2004), Baker et al. (2004 and 2005), and Baccaro and Rei
(2005). In contrast, the Bassanini-Duval (2006) employs what must be a far superior annual
EPL series that has recently been generated by the OECD, in large part because they limit the
analysis to the post 1982 period.
12
Again, due to the efforts of the OECD, the quality and comparability of unemployment
benefits data for OECD countries improved dramatically after the mid-1990s. The OECD
produces an average gross replacement rate (across family types, income levels, and for
different durations of unemployment) for every second year since 1961 and this has become
the measure of choice for empirical work in this area. This measure allows researchers to
capture both the replacement rate and duration in a single measure of benefit generosity.
More recently, the OECD has constructed net replacement rates, which take into account
unemployment compensation after taxes and various related benefits. These are far more
appropriate than the gross replacement rates for measuring the incentives facing workers. Net
replacement rates have been constructed for selected dates between the early 1990s and 2003,
but the OECD is only now (2006) coming out with a historical time series. These new net
benefit figures are particularly attractive because they will measure generosity relative to
average wages, not the average production worker wage (which, with the shift to services, is
increasingly misleading). The question is whether the new, much improved measures of
benefit generosity will perform as well as the average gross replacement rate in regression
tests (section 4).
There is some reason for doubt. Currently, these new net replacement rates can be
compared over time for just 8 of the countries typically included in cross-country tests, and
only for 1995-2004. If changes in the standard gross replacement rate are good measures of
the change in benefit generosity likely to have major effects on labor supply decisions and
wage pressure (and therefore on employment and unemployment rates), they should be
closely correlated with the new and superior net replacement rates. It turns out that there is
little correspondence between the two. Three countries show changes roughly similar in
magnitudes, France (NRR: +4 pts; GRR: +2), Austria (NRR: -2; GRR: -1), and the UK
(NRR: -1; GRR: -2). But three other countries show changes in opposite directions: the U.S.
(NRR: -6; GRR: +2); Japan (NRR: +2; GRR: -2); and Germany (NRR: +1; GRR: -3). The
two remaining countries show huge differences in the size of the change: Italy (NRR: +2;
GRR: +15) and Finland (NRR: -9: GRR: 0).10 These are not results that give us much
confidence that when the improved net rates become available for the full set of 19 OECD
countries, the measured change in benefit generosity will show a close correspondence to

13
changes in the measure that many studies have found associated with changes in
unemployment.
But even a net replacement rate measure that reflects both levels and the duration of
benefit relative to the average wage, other critical features of unemployment benefit systems
are left unmeasured. There is no cross-country measure of eligibility, but we know that the
share of the unemployed who are receiving unemployment-related benefits varies
dramatically across countries. For example, younger workers, who in many countries account
for a large part of the unemployment problem and who may be most sensitive to work
incentives, may be either ineligible for benefits in the first place (e.g., Spain and Italy) or are
eligible only for much lower levels of benefit. Closely related, enforcement of eligibility
rules is a critical dimension of benefit generosity, but there is no reliable historical series that
can be used for cross-country comparisons.
Finally, the bargaining power workers gain from trade union led collective action is
poorly measured. The most commonly used measure is union density – the share of
employees who are union members. But union density is not closely correlated with
collective bargaining coverage – the share of employees whose wages and employment
conditions are set through collective bargaining. The most extreme example is France, which
had a union density rate of just 10% in 2000, below that of even the U.S. (13%), but a
collective bargaining coverage rate of over 90 percent. Countries with less than 40 percent
union density and more than 80 percent collective coverage included Austria, Australia,
Portugal Spain and The Netherlands. The coverage measure is much harder to produce,
which helps explain why it is available for fewer countries and many fewer years than the
union density measure. In any case, it is not clear that a perfectly measured union coverage
rate would be a particularly good measure of the power of unions to affect market outcomes.
This skepticism is suggested by the fairly robust finding that bargaining coordination is
associated with lower unemployment (see section 4), which is usually interpreted as
indicating that the bargainers have incorporated the effect of wage bargains on employment
in their bargaining objectives.
Given these considerable inadequacies in measurement on both sides of the relationship
– for the unemployment rate as well as the key labor market institutions – it might be viewed
to be surprising if any statistical fit was uncovered. Interestingly, as Section 4 (Table 3) will

14
show, as the quality of the labor market institution measures has improved, the strength of
the reported statistical association between these measures and the pattern of unemployment
has fallen. This may reflect some combination of Blanchard’s “Darwinian” effect in the early
literature (the measures that best produce results consistent with particular theoretical
expectations are the ones finally used), the use of improved econometric techniques, and the
much greater attention to robustness in recent studies.
3. Correlation Evidence
3.1 Casual Associations
Where the conventional wisdom is so dominant that there is no competing account to
speak of, the standards for evidence are likely to suffer. This may explain the frequent resort
to casual association in making the case for the orthodox rigidity explanation. The OECD’s
Jobs Study offers an example. Although no evidence of a statistically significant relationship
between unemployment benefit generosity and unemployment is presented for any particular
point in time, Chapter 5 of the Jobs Study states confidently that “increases in a more
comprehensive measure of unemployment compensation has typically been followed by an
increase in unemployment but usually with a considerable lag” (p. 44). Support for this
conclusion on lagged effects is provided in Chapter 8, and two kinds of evidence are
presented. We consider the first one here, in which unemployment increases are explained by
earlier increases in unemployment benefits (the replacement rate). According to Chapter 8 of
the Jobs Study (OECD 1994, p. 178):
In some countries, there have been major reforms in benefit entitlements which give some more specific idea of how long lags may be. In Canada, entitlements rose in 1972 and unemployment rose unusually in 1978 and more strongly around 1983. In Finland, entitlements rose in 1972 and unemployment rose sharply (in contrast to its Scandinavian neighbors) through to 1978; in Ireland, changes increasing entitlements occurred over 1971 to 1985, and its rise in unemployment was particularly large (as compared to other European countries) from 1980 to 1985. In Norway, major increases in entitlements occurred in 1975 and 1984 (although also before and after these dates), and unemployment rose exceptionally around 1989. Entitlements rose in Sweden in 1974 and in Switzerland in 1977, with major rises in unemployment in 1991 in both cases. These experiences suggest lags between rises in entitlements and later sharp rises in unemployment of 5-10 years for Canada, Ireland and Finland but perhaps 10 to 20 years in Norway, Sweden and Switzerland.
15
Such breathtaking leaps in association must require extremely strong theoretical priors.
As Manning (1998, p. 144) puts it, “I think that we would all agree that this is absurd. In fact,
one could write a very similar paragraph relating performance in the Eurovision Song
Contest to unemployment.”
To take another example, Heckman (2003, p. 373) suggests that an important part of the
German employment performance problem can be traced to what he terms “substantial”
unemployment net benefit replacement rates (79%), because “Germans, like all people,
respond to these incentives (not to work).” More substantial evidence of a causal relationship
running from benefits to unemployment for Germany is not offered. Although it goes
unmentioned, Heckman’s figure also shows that Denmark (80%), the Netherlands (82%),
Switzerland (84%) and Sweden (85%) all had higher net replacement rate generosity than
Germany (1995). But unemployment rates for these four high generosity countries have
consistently been lower than Germany’s since 1995. Three of the four (Sweden is the
exception, but just barely) have shown lower unemployment rates than the U.S. since the late
1990s, despite a much lower U.S. net replacement rate.
Similar reliance on casual association can be found in discussion of the labor market
effects of employment protection laws. The OECD’s Economic Survey of France (OECD
2005b) notes that employment protection is relatively strict in France and, for this reason,
calls for a series of reforms. But no evidence or references are offered to establish that EPL
strictness actually helps explain French unemployment, or that the recommended reforms
would reduce it. Similarly, the OECD’s Economic Survey of the Netherlands (OECD 2005c,
p. 25) recommends “increasing the responsiveness of employment to economic conditions by
easing strict EPL or regular contracts, (and) making real wages even more responsive to
unemployment by phasing down unemployment benefit replacement rates as unemployment
spells lengthen.” As in the French country survey, this policy recommendation for the
Netherlands (a very low unemployment country) is made without reference to any evidence
on the links between either EPL strictness and employment responsiveness or benefit
replacement rates and the responsiveness of real wages to unemployment.
3.2 Simple Correlations
16
Between these examples of assumed relationships based, presumably, on theoretical
common-sense, and the macroeconometric exercises that we review below, lie simple
bivariate correlations, most commonly represented by scatter plots. One would expect that if
the expected effects of protective labor market institutions on employment performance are
as direct and strong as commonly believed, we should observe some evidence of it with
simple correlations. Indeed, scatter plots have been frequently employed to show the links
between unemployment and various labor market institutions.
For instance, it has been argued that extended duration of generous benefits will have
particularly strong effects on long-term unemployment. Layard et al. (1994) put particular
emphasis on this source of the unemployment crisis: “The unconditional payment of benefits
for an indefinite period is clearly a major cause of high European unemployment” (p. 92,
italics in the original). The authors present a plot of a measure of the maximum duration of
benefit in years against the long-term share of unemployment for the mid-1980s (1991,
Figure 13; 1994, Figure 13) and remark that “all the countries where long-term
unemployment has escalated have unemployment benefits of some kind that are available for
a very long period, rather than running out after 6 months (as in the USA) or 14 months (as in
Sweden)” (p. 59). This evidence leads to their conclusion that “In countries in which benefits
are indefinitely available, employment is much less likely to rebound after a major
downwards shock” (1991, p. 40; 1994, p. 62). As we noted above, Atkinson and
Micklewright (1991) have been quite critical of these “indefinite duration” measures of
benefits.
Other examples appear in the published literature. Heckman (2003) presents several
scatter plots showing a negative relationship between employment rates and the strictness of
employment protection laws. In another example, Blanchard (2004) has used scatter plots of
cooperation in labor relations in the late 1990s against unemployment to suggest the
importance of the quality of labor relations for labor market performance.
The OECD’s Jobs Study made frequent use of scatter plot and simple correlation
evidence. After the passage linking increasing unemployment to increases in benefit
generosity quoted above, Chapter 8 proposes to “examine correlations more systematically”
(p. 178). Here they show scatter plots of “cycle-to-cycle changes in unemployment rates and
the summary measure of benefit entitlements” (p. 180). For three periods (1973-77, 1979-85,
17
and 1987-93) the OECD presents scatter plots for the change in unemployment against the 6-
year average (“summary”) benefits level as well as against the change in the benefits measure
over the previous cycle. This produces 6 correlation tests. They do this both for a full set of
21 countries and for a reduced set of 14 countries, on the grounds that standardized
unemployment data were unavailable for 7 of the 21 countries before the 1980s, resulting in a
total of 12 tests. They find that “In data for 21 countries, none of the individual correlations
are statistically significant at the 5 percent level.” For the 14-country data, two of the six tests
produce the expected positive correlation: 1973-77 using the level of benefit entitlements
measure, and 1987-93 using the change in benefits measure.11 In sum, this is the correlation
evidence that supports the OECD’s Chapter 5 contention that increases in unemployment
tends to follow increases in unemployment compensation (see above).
It turns out that as a general rule, simple cross-country correlations between
unemployment and the standard measures of the key labor market institutions offer little
support for the orthodox account. Using five-year averages for the 1980s and 1990s for 20
OECD countries, Baker et al. (2005) found no statistical association between unemployment
and OECD measures of employment protection laws, unemployment benefit replacement
rates, the duration of unemployment benefits, union density or union coverage.
To further illustrate what the correlation evidence shows, we present some simple scatter
plots of unemployment and various measures of unemployment benefit entitlement
generosity. We limit these to benefit entitlements both for reasons of space and because our
survey of the regression literature (below) indicates that the benefit system is the single labor
market institution with the strongest and most robust unemployment-increasing effects.
If unemployment benefit entitlement generosity is one of the key institutions at the root
of unemployment, the strongest evidence should appear with the use of the OECD’s net
replacement measure of unemployment benefits. Net benefit is measured as the after-tax
value of unemployment assistance and other social assistance, such as housing and child
support. The net replacement rate takes this after-tax measure as a share of after-tax
household earnings. If workers are calculating the tradeoff between the dole and work, such
an after-tax measure is clearly the most appropriate. Figure 2 shows that there is, indeed, a
relationship, but it is perverse: in 2002, more generous after-tax benefits (measured as the
overall average over 60 months for two earnings levels and three family types) is associated
18
with lower unemployment across these 20 countries. As the figure shows, Italy is an outlier
(it offers no benefits after the first phase of unemployment), but even without Italy there is a
negative relationship. The figure shows eleven countries (in two groups) with unemployment
below the US in 2002 but with net replacement rates more than twice as high (60-80% vs
30%). With data from an OECD paper by John Martin (1996), we also found a negative
relationship for 1994/5 (not shown).
Long duration of benefits is also expected to help explain high unemployment. Figure 3
shows benefit duration plotted against unemployment, with duration measured as the ratio of
the net replacement rate in the 60th month of benefit receipts to the “initial phase” on the
entitlement (effectively the 1st month). This duration measure can be greater than one
because for the generally smaller group still eligible for assistance in the 60th month, more
kinds of social assistance may be available than in the initial phase. The data are shown for
2001, the most recent data available for short and long term net replacement rates. Figure 3
shows that higher levels of benefit duration are associated with lower unemployment. Spain
and Italy offered relatively ungenerous long term benefits but have high unemployment;
Ireland, Denmark, the UK and Austria had similar or lower unemployment than the U.S., but
much more generous long-term unemployment-linked net benefits.
As noted above, Layard et al. (1991, 1994) argue that there is a close fit between benefit
entitlement duration and long-term unemployment. Figure 4 shows a plot of long-term
unemployment against the same duration measure used in Figure 3. The data again fail to
show the predicted positive association between benefit generosity and unemployment.
Germany and Belgium show high net benefit duration and high long term unemployment, but
Ireland, the UK, New Zealand, Denmark and Austria are at least as generous with much
lower shares of long-term unemployment. Italy has no long term benefits, but has the highest
level of long-term unemployment.
A number of the most influential panel data studies that we survey below have focused
on the extent to which changes in labor market institutions can account in a substantial way
for changes in the pattern of unemployment across countries (e.g., Nickell et al., 2005).
Along these lines, changes in benefit duration generosity might be expected to be associated
with changes in long-term unemployment. Figure 5 explores this possibility for the 1991-
2001 period (the longest period the available data permit). The data show no correlation. The
19
Netherlands and Norway experienced large declines in both duration and long term
unemployment, but Ireland had the largest decline in unemployment at the same time that it
had the largest increase in benefit duration. Although Canada had the largest decline in
duration of benefits, its share of long-term unemployment showed little change.
The benefits measure used in nearly all of the recent time series regression tests is the
average gross replacement rate, for which there are now measures from 1961 to 2003. The
change in this measure has typically been found to be significantly associated with the
change in unemployment (see below). Figure 6 shows that the simple correlation between the
1982-2002 percentage point change in unemployment and the gross replacement rate has the
expected positive sign. Many countries show small changes in the benefits replacement rate
(both up and down) and large changes in unemployment (from -7 percentage points for
Ireland to +3 points for Japan). In Section 5 we will return to the question of how much
weight ought to be assigned to these changes in the gross replacement rate.
4. Macroeconometric Evidence
4.1 The Consensus View: Centrality of Labor Market Institutions
As employment performance across much of Europe worsened, economists turned their
attention to the links between institutions, rigidities, and unemployment (Bruno and Sachs,
1984?; Blanchard and Summers, 1986; Lindbeck and Snower, 1988). This early research, in
turn, spawned a rapidly growing literature aimed at explaining both cross-country differences
in unemployment and the evolution of these differences over time with regression tests. The
most influential studies share the same broad conclusion: in the final analysis, the evidence
offers support for the orthodox theoretical expectation that labor market institutions have
played a key role in cross-country unemployment differences. For example:
• “Thus, with six institutional variables plus the change in inflation, we can explain over 90 per cent of the differences in unemployment between countries” (Layard, Nickell and Jackman, 1994, p. 82).
• “The broad empirical conclusions suggest that policy variables (labor market
institutions) and the institutional mechanisms of wage determination do matter for the level of structural unemployment as well as for the speed of labour market adjustment in the OECD countries” (Scarpetta, 1996, p. 45).

20
• “This paper has identified a number of policy settings and institutional features of the labour market which are associated with high structural unemployment… (we) assign significant roles to unemployment benefits, collective bargaining structures, active labour market policies … and the tax wedge…. It requires strong political will and leadership to convince electorates that it is necessary to swallow all of the (deregulation) medicine and that it will take time before this treatment leads to improved labour market performance and falling unemployment. But the success stories show that it can be done!” (Elmeskov et al., 1998, pp )
• “To sum up, reductions in replacement rates, lower tax wedges, liberalized
employment protection regulations, and improved active labor market policies remain essential ingredients of a comprehensive labor market strategy geared to reducing Europe’s high structural unemployment rate” (IMF, 2003, p. 141).
• “Our results indicate … (that) broad movements in unemployment across the OECD
can be explained by shifts in labour market institutions” (Nickell et al., 2005, p. 22). In the next several sections (4.2-4.4), we survey a number of influential cross-country
econometric studies for the purpose of assessing the consistency and robustness of the
findings. The case for treating protective labor market institutions as the principal
determinants of high unemployment will be stronger the more consistent the findings are
across studies and the more care taken to ensure that the published results are robust. Table 3
provides a summary of the implied effects of changes in eight of the most commonly
employed institutional measures from eleven panel data regression studies published since
1996. While broadly representative, this is by no means a comprehensive list. In some cases
studies were not included because it was difficult to make comparable the implied effects.
ayed by labor market institutions in the striking decline in UK unemployment in the 1990s.
4.2 Early OECD Studies
In “Key Lessons for Labor Market Reforms,” Elmeskov, Martin and Scarpetta (1998)
(hereafter, EMS) aim to “distill the main lessons for labour market reforms from the
(country) “successes” and “failures” revealed by recent OECD research” (p. 1). The authors,
three senior OECD economists, note that their econometric work is “essentially an update
and extension” of Scarpetta’s (1996) earlier work. As Table 3 shows, both Scarpetta and
EMS find a significant effect of EPL and unemployment benefit replacement rates, but differ
on union density (significant for Scarpetta but not for EMS), the tax wedge (significant for
21
EMS but not Scarpetta) and bargaining coordination (same direction, but the implied effect
is twice as large in Scarpetta).
These rather substantial differences are not addressed in the EMS paper, which is notable
since the results of these exercises have been highly influential for the way other researchers
and policy makers understand the sources of poor employment performance. Indeed,
Elmeskov et al. (1998, p. 2) point to the key role played by Scarpetta’s regression results:
“The OECD work since 1994 has produced a series of additional publications…. This work
has enabled the Organization to identify a number of country “success stories” as well as
“failures” in terms of implementing the OECD recommendations and the resulting labour
market outcomes. In assessing the needs for reform, the work has relied heavily on the
econometric work of Scarpetta (1996)…”. If this influential work is found to be inconsistent
in a substantial way with the same author’s work a few years later (in EMS, 1998), it would
do readers, particularly researchers and policy makers, a considerable service to highlight and
explain the differences. EMS compare their findings only to those of Nickell and Layard
(1997), noting that while generally similar, the findings for EPL are inconsistent (Nickell and
Layard find no significant effect).
4.3 Other Early Cross-Country Tests
In many papers and books published in the 1990s, Nickell (in many cases with Layard)
reported results from relatively simple cross-country regressions based on the same grouped
data (1984-89, 1989-94). The results shown in row 3 of Table 3 for Nickell (1997) are
representative. Although all the variables except EPL are strongly significant with the
expected sign, his conclusion in this paper is cautious: “It is clear that the broad-brush
analysis that says that European unemployment is high because European labor markets are
“rigid” is too vague and probably misleading.”
Baker et al. (2005) explored the sensitivity of the main results in Nickell's influential
(1997) paper to newer versions of the institutional variables. We replaced six of the eight
institutional variables used in the 1997 tests with improved measures that were employed by
the same author in more recent work (Nickell et al., 2003; 2005). We also used alternative
measures of union coverage (from Blanchard and Wolfers, 2000) and active labor market
policies (OECD).12 With these newer versions of the same institutional measures, the
22
regression produces markedly different results. In Nickell (1997), seven of the eight
institutional variables had the expected sign and were statistically significant at standard
levels. The only exception was the employment protection variable, which was close to zero
and not statistically significant. With the new data, only union coverage is significant (at the
10 percent level), and three of the remaining seven institutional variables have the wrong
sign.13
In the late 1990s, a number of empirical studies appeared that improved upon the
Nickell/Layard institutional measures, added others, changed the time period covered, and
experimented with the specification and econometric method (see Baker et al., 2005, for a
detailed review of this literature). Among the most influential, Blanchard and Wolfers (2000)
(BW) shifted the focus of the empirical tests from simple institution effects in panel data
cross-sections to the interaction of institutions with macroeconomic shocks. The idea, which
had in fact been around for some time, was that labor market institutions may produce higher
unemployment by limiting the ability of labor markets to respond to adverse shocks, and that
this can help explain why the same institutions were not employment-unfriendly in previous
decades. The BW study was also distinguished by a much longer time period (8 five-year
periods from 1960 to 1996; the last two years are treated as a full period), and while it relies
heavily on Nickell’s institutional measures, it also employs alternative, OECD-generated
measures of benefit replacement rates and employment protection laws that varied over time.
While Nickell (1997) and Blanchard-Wolfers (2000) (BW) show broadly similar results for
the two unemployment benefit measures, union density, coordination, and taxes, this is not
the case for EPL (BW get an unemployment-increasing effect), ALMP and bargaining
coordination (both insignificant for BW).
Using Nickell’s (1997) time invariant measures of institutions (the average for 1983-88
and 1989-94) and accounting for time and country effects, Blanchard and Wolfers obtained
results for the entire 1960-96 period that were similar to Nickell’s for the late 1980s and early
1990s. But the authors point out that the results are quite sensitive to the specification.
Indeed, it appears that the use of alternative, arguably much superior OECD-generated
measures of unemployment benefit replacement rates and employment protection laws
actually weaken the results. According to the authors, the table showing these results
“suggests two conclusions, both worrisome: replacing the Nickell measures by alternative,

23
but still time invariant measures, substantially decreases the R2. Going from the time
invariant to the time varying measures further decreases the fit.”
For example, in a regression that uses alternative measures of benefit replacement rates
from the OECD (the average 1985-89 value), the employment protection and tax wedge
variables become insignificant, while union density is only significant at a 10 percent
confidence level (Blanchard and Wolfers, 2000, table 6, column 1). Further, when the time
series version of the same OECD replacement rate measure is used (as it clearly should be),
all three of these variables become insignificant, as do the two replacement rate variables
themselves (table 6, column 2). But in regressions that use an alternative, time-varying
measures of employment protection, the replacement rate, benefit duration, tax wedge, and
union density variables all become highly significant (table 6, columns 3 and 4). It is worth
emphasizing that only bargaining coordination (a “good” labor market institution) has a
significant coefficient in every regression, regardless of specification.
Belot and van Ours (2002; 2005) shift the focus to the roles played by interactions
among labor market institutions. They report the results of seven regressions, four of which
test just the direct impact of institutions on unemployment, while the last three include
various interacted measures. Their four direct impact tests differ only in that they include
different combinations of fixed time and country effects (column 1 shows results with neither
time nor country effects; column 4 shows results when both are included), but the results are
dramatically different.
While it should be recognized that their objective is to use the differences across tests to
show the importance of interactions among institutions (shown in the last three tests in their
Table 7), these differences across tests 1-4 serve to highlight how sensitive the results for
each institutional measure is to the other variables included in the test. For example, the
benefits replacement rate has the expected sign and is strongly significant in the first test, the
right sign but not significant in their second and third tests, and has the wrong sign in their
fourth test. When the three interacted variables are introduced, the direct effect of the
replacement rate is large and significant with the wrong sign (it is unemployment-reducing).
The coefficients on employment protection have the wrong sign (it reduces unemployment)
in all six tests in which it appears, with substantial variation in the size of both the coefficient
and the level of statistical significance.

24
4.4 Explaining Changes over Time with Annual Data
Following earlier OECD research (Scarpetta, 1996; Elmeskov, 1998), Nickell and
colleagues (Nickell et al., 2001; 2003; 2005) shift to the use of annual data to explain the
change in the pattern of unemployment with time-varying measures of institutions, extending
the analysis back to 1961. As noted above (Section 2), the use of annual data extended back
to the 1960s and 1970s raises serious concerns about the historical consistency of the
unemployment time series and the meaningfulness of annual changes in the institutional
measures (due to the quality of the measurements, the heavy reliance on interpolation, and
the typical small or non-existent year-to-year changes in most of the institutions under
investigation). What is clear is that increasing the number of observations will increase the
degrees of freedom and thus reduce the apparent standard errors of the estimated coefficients.
There has been little effort to justify this use of long annual time series and it is notable that
the most recent work by the OECD has been much more conservative in this regard, limiting
the span covered to 1982-2003.
The Nickell et al. tests are distinguished by the use of a lagged dependent variable and
country specific time trends, arguing that their inclusion “is to ensure that the estimated
coefficients on the institution variables are not distorted by omitted trended variables in each
country or common shocks” (2005, p. 15). The use of country trends is of interest since it
implies that important secular movements in the unemployment rate have occurred in the
absence of changes in key labor-market institutions. While the paper notes that most of the
estimated coefficients for these trends are not close to being statistically significant, because
of the presence of a lagged dependent variable, the trends actually account for much of the
change in unemployment in many countries.14 If the magnitudes of their estimates are taken
at face value, the question becomes why the mainstream research program has failed to focus
on explaining these underlying country trends.
Because Nickell et al. (2005) include a lagged dependent variable (the unemployment
rate), their estimates of the unemployment impact of various labor market institutions have a
long-run multiplier effect and the implied effects shown in Table 3 reflect this by assuming a
five-year horizon (the implied effects after 5 years). Nickell et al. finds that the replacement
ratio, benefit duration, and employment tax variables have positive significant effects. Unlike
25
previous studies, Nickell et al. replace the standard union density measure (for which they
fail to get a significant effect in the 2001 version) with the change in union density, which
gets the expected positive and significant effect (a 10% increase in union density produces a
.3 percentage point increase in unemployment after 5 years). Unlike the Scarpetta and
Elmeskov et al. studies, however, they find no effect for EPL. Consistent with much of this
literature, Nickell et al. find that higher levels of bargaining coordination significantly reduce
unemployment.
Nickell et al.’s study (2005) offers another example of rather large effects of what appear
to be fairly minor changes, this time across different versions of the same basic paper. The
main difference between the published versions (2003; 2005) and the original working paper
(2001) appears to be the replacement of the level of union density with its change and the
addition of three years to the time series (ending with 1995 instead of 1992). The
consequences are substantial: the effect of EPL on unemployment changes from highly
significant to small and insignificant; the level of union density was insignificant but its
change becomes highly significant. In addition, the new version reports much smaller effects
of taxes, coordination, and benefit duration, but a larger effect for the unemployment benefit
replacement rate. It is also notable that these seemingly minor changes in specification
change the coefficient of the interest rate variable from insignificant to significant.
Particularly given the strong conclusions and implications for public policy (that shifts in
labor market institutions explain movements in unemployment), it is notable that there is no
discussion of robustness.
Using Nickell et al. (2001) as their starting point, researchers at the International
Monetary Fund (IMF, 2003) addressed the same question – the effects of changes in
institutions on changes in unemployment - with much the same data but with some notable
differences in specification.15 The IMF (2003) finds a strong unemployment-increasing effect
for EPL (like Scarpetta and Elmeskov et al., but unlike Nickell, Belot and van Ours, and
Nickell et al.). The IMF also identifies a large effect for union density, which is more than
seven times larger than the Nickell et al. (2005) estimate. Interestingly, they also find, in
contrast to Nickell et al., that labor taxes tend to significantly reduce unemployment.
By reporting four alternative specifications, the IMF report illustrates the difficulty of
making generalizations about the effects of labor market institutions from cross-country

26
regression. The implied impact of given changes in labor market institutions for each of their
four alternative specifications are shown in Table 4.16 There are several differences in results
across these tests worth noting:
• The results in column 1 imply that the impact of employment protection is almost three times as large as the results shown in column 3, whereas the results shown in the fourth column actually indicate that increased employment protection leads to lower unemployment.
• In column 1, increases in bargaining coordination at levels below the cross-country mean
are found to substantially reduce unemployment; more modest reductions are implied by the results shown in second and third columns; and the fourth test (the one used for the simulations in the paper) implies that higher levels of bargaining coordination has essentially no effect on the unemployment rate.
• The implied impact of changes in union density has the same sign in all four sets of
regression results, but the magnitude of the implied impact varies substantially. The results from the regression shown in column 2 imply an impact of changes in union density that is nearly twenty times as large as the results from the regression in column 4.
• Only the coefficients for the unemployment benefit replacement rate variable are roughly
similar across the four regressions, but only in variant 4 is the coefficient statistically significant (at just the 10% level).
With nearly identical data, Baker et al. (2004) further explored the robustness of the
IMF’s results. After replicating the results of the IMF's three most important specifications,
we ran an alternative based on a composite of specifications used in earlier research in this
area. The alternative specification differs from the IMF variants in using common time
dummies, rather than country-specific time trends.17 It also included a somewhat different set
of institutional variables and interactions: slight differences (improvements) in the union
density, the benefit replacement ratio, and the tax wedge measures (typically involving
changes to a few countries in a few years); an additional variable for the duration of benefits;
and two new interaction variables – one interaction between benefit duration and the benefit
replacement rate, and another between the tax wedge and bargaining coordination. In this
alternative test, we found only one of the direct institutional variables to be statistically
significant (the tax wedge, at the 10% level).
To the extent that the relationships posited in the original IMF model are true in the
levels of unemployment and labor-market institutions, these relationships should also hold in

27
changes in unemployment and labor-market institutions.18 In this alternative specification,
only union density and bargaining coordination have a statistically significant effect on
unemployment. Employment protection, benefit replacement, the tax wedge, and the
interactions terms have no statistically discernible impact on the cross-country pattern of
unemployment. In sum, minor changes to a few variables and reasonable changes in
specification produce results that show no meaningful relationship between labor-market
institutions and unemployment.
Baccaro and Rei (2005), in turn, build on the methods and data used by Nickell et al.
(2001) and the IMF (2003). But Baccaro and Rei are distinctive in this literature for their
extreme attention to robustness, exploring both static and dynamic models, yearly vs.
averaged data, numerous alternative estimation techniques, and a myriad of variable
specifications. For example, they point out that “We started off with dynamic fixed effects
models in levels using yearly data. We then shifted to dynamic models in first differences
with yearly data. We then grouped our data in five-year averages and estimated fixed effects
models in levels, random effects models in levels, as well as models in first differences (p.
40). No fewer than 72 tests are presented in 12 tables.
Although many of these tests were quite similar to those published by Nickell et al. and
the IMF, essentially the same data produced dramatically different results (see Table 3).
Baccaro and Rei (2005, p. 44) conclude that
“Changes in employment protection, benefit replacement rates, and (the) tax wedge seem negatively associated with changes in Unemployment, even though the coefficients are (mostly but not always) insignificant. The one institutional variable we find to be positively associated with changes in unemployment is the union density change variable…. What transpires from these findings is that unemployment is mostly increased by policies and institutions that lead to restrictive macroeconomic policies… the claim that systematic deregulation of labour markets would solve the unemployment problem faced by several advanced countries appears unwarranted based on our results.”
As of this writing, the latest entry is the OECD’s effort to reassess the Jobs Study, which
comes shortly after its 10th anniversary. The relevant empirical analysis appears in Bassanini
and Duval (2006), which forms the basis for Chapter 7 of the OECD’s 2006 Employment
Outlook (OECD 2006). This research uses the latest OECD data (in annual form), which is
particularly significant for two measures: EPL, which for the first time is a truly annual series

28
(not just interpolated from a small number of years for which the OECD had estimates); and
product market regulation, a measure that has been developed very recently (but covers just
seven non-manufacturing industries). The authors control for cyclical effects with a measure
of the output gap, and control for both time and country effects. Unlike Nickell et al. (2005),
these OECD tests do not include lagged unemployment as an explanatory variable. Like
Baccaro and Rei (2005), it is notable that the authors pay considerable attention to the
robustness of the results.
We focus here only on their “baseline” test. Four institution and policy variables are
found to be highly significant in the predicted (orthodox) direction: the benefit replacement
rate (a summary measure of benefit generosity), the tax wedge on labor incomes, high
corporatism (highly centralized or coordinated bargaining), and the strictness of product
market regulation. Thus, among labor market institutions typically blamed for poor labor
market performance, only the unemployment benefits replacement rate is found to have a
significant effect. As the authors put it, a key policy conclusion is that “high unemployment
benefits are found to amplify the unemployment effects of adverse shocks” (p. 36).
This analysis, as careful and comprehensive as it is, leaves many key policy-relevant
questions unanswered. While the “risk of reverse causality” is briefly acknowledged, the
authors simply note that “there is no straightforward way to address this issue” (OECD 2006,
p. 11). This is of particular concern for the interpretation of the estimated coefficients on both
unemployment benefits and the tax wedge. Like all the studies we have surveyed, the text or
this report implies that significant coefficients reflect causal relationships that run from
benefit generosity and the size of the tax wedge to the level of unemployment. Obviously, for
policy purposes establishing that the effects run in this direction, and to what extent, is
critically important.
4.5 Time Series Evidence from the UK
A number of studies have attempted to explain long run trends in unemployment with
country-specific time series tests. Perhaps the most extensive work has been done on the
U.K., which has experienced large swings in unemployment, sharp declines in union
membership and power, and fairly substantial labor market deregulation.19 It is worth a brief
29
detour to see what the time series evidence says about the role played by protective labor
market institutions for UK unemployment.
Extending his earlier work on Britain (Nickell, 1988; Nickell and Bell, 1995), Nickell
(1998) accounts for changes from 1964 to 1992 with measures of industrial turbulence, the
replacement ratio, terms of trade, skill mismatch, the union mark-up and the real interest rate.
It is notable that the benefit replacement rate is not significant and the union power accounts
for 19 percent of the overall rise in unemployment. But Nickell judges the equation as a
qualified success, since it “comfortably explains the four fold rise in unemployment...
Despite the fact that it seems quite easy to explain long-run trends in unemployment in
Britain using wage pressure variables, there remains a feeling of dissatisfaction. Seven
variables is a lot, so it is hard to tell a simple story. And, because of this, many remain
unpersuaded” (p. 815).
Several more recent studies have had a harder time explaining the trend in UK
unemployment. Henry and Nixon (2000) extend Nickell (1998) and find that UK
unemployment can be well-explained not by institutional measures but by a small number of
transitory shock variables: oil prices, terms of trade, and real interest rates. More recently,
Henry (2004) finds that wage pressure variables do not explain the UK experience: “To
summarise the overall findings reported in the tables above, these show that the labour
supply variables (institutions) do not figure strongly in the behaviour of wages and
employment.20 Similarly, focusing on the 1960-98 period, a Bank of England study (Cassino
and Thornton, 2002, p. 34) concludes that
A wide range of equations with different combinations of structural variables was examined. Overall, the estimation work has shown that it is extremely difficult to link movements in the natural rate to structural economic variables. It is generally difficult to derive robust coefficient estimates for structural variables that have the expected sign and are statistically significant.”
In sum, the recent time series evidence suggests that the deregulation of the UK’s labor
market accounts for little if any of the observed changes in unemployment since the 1970s.
4.6 Assessment
Not surprisingly, the two most recent studies we have considered, Baccaro and Rei
(2005) and Bassanini and Duval (2006), have taken advantage of the availability of improved
30
institutional measures and methodological innovations of earlier studies. But they are also
characterized by paying much more attention to issues of robustness. It is notable, therefore,
that these latest studies have each found much less support for the orthodox rigidity view
than the earlier studies. For example, Scarpetta (1996) finds significant effects for EPL, the
replacement rate, and union density, and Nickell (1997) finds the same for the replacement
rate, benefit duration, union density and union coverage. In contrast, with better data and
more apparent attention to robustness issues, among protective labor market institutions,
Baccaro-Rei and Bassanini-Duval find just one measure of protective labor market
institutions to be significant (union density and the average replacement rate, respectively).
Despite Baccaro and Rei’s (2005) findings, we are not convinced that there is a
meaningful direct union density effect. While Table 3 shows that seven of the eleven studies
considered have found a significant effect for union density, the OECD’s recent literature
survey (2006a, table 3.9) concludes that only five of the sixteen studies they cover show
unequivocal positive (unemployment-increasing) effects. For two of these studies, Nickell
(1977) and the IMF (2003), the positive union effect disappeared in our replication tests (see
below). In addition, as noted in section 2, it is not clear what this variable actually measures.
At best, it measures what it is supposed to measure - worker bargaining power – quite poorly.
The effect of union density on employment performance is complicated by vast differences
between density and coverage in some countries, and by the role of the centralization and
coordination of bargaining, which in most tests are associated with lower unemployment. As
the OECD’s Employment Outlook chapter on collective bargaining (1999, Box 2.3, p. 55)
concludes, “Notably there is little evidence of an effect of union density … on
unemployment once other features of the collective bargaining system are taken in to
account.”
It is widely accepted that strict employment protection regulations are central to any
explanation of persistent high unemployment in Europe, but the panel data offer little
supporting evidence. The evidence that appears in Table 3 is quite mixed. With the exception
of the IMF (2003), the studies covered in this Table that find the predicted positive and
significant effect on unemployment were all published before 2001. In these four studies, the
implied effects of a one unit increase in EPL strictness on unemployment are substantially
different, ranging from .24 to 1.43 percentage points. On the other hand, Nickell (1997),

31
Nickell et al. (2005), Belot and Van Ours (2004), Baker et al. (2004; 2005), Baccaro and Rei
(2005) and the OECD (2005) all find no effect, or even unemployment-reducing effects. In
the 1999 Employment Outlook, OECD researchers reached a similar conclusion: “The basic
finding appears robust: overall unemployment is not significantly related to EPL strictness”
(OECD, 1999, p. 77). Negative employment-related effects of current employment protection
laws are likely to be found mainly among subgroups of workers – particularly youth and the
least skilled, but the evidence remains thin (OECD, 2004a).
The results in Table 3 indicate that the Bassanini-Duval finding for benefit generosity is,
with just a few exceptions, consistent with the results of earlier studies, and for this reason
we will address its relationship to unemployment in more detail in the next section.
In sum, the cross-country panel data regression evidence as well as the recent time series
evidence for the UK produces little compelling statistical evidence that protective labor
market institutions are at the root of persistent high unemployment. The possible exception is
generous unemployment benefit entitlements. The next section takes a closer look at the
evidence on the role played by the unemployment benefit entitlement system.
5. Unemployment Benefit Compensation and Unemployment
5.1 Some Initial Considerations
Most attempts t o explain the cross-country pattern of unemployment with panel data
have found a statistically significant relationship for one or more measures of unemployment
benefit generosity (see Table 3). This finding has been interpreted almost universally as
empirical support for the orthodox prediction that generous benefits systems are at the root of
persistent high unemployment. Indeed spurred by the growing influence of job search theory,
the availability of unemployment benefits has become the cornerstone of the orthodox theory
of wages and unemployment (Holmlund, 1998, p. 115). As the costs of unemployment to
workers decline, so does the incentive to search for work and take a job. This disincentive, in
turn, could help increase the bargaining power of both new job applicants and current
employees, and higher wages may in turn reduce labor demand and thus raise unemployment
(and/or joblessness).
A good example of the application of this theory to the real world of high European
unemployment is Lungquist and Sargent’s (1998, p. 547) influential paper. At the heart of
32
their model is the proposition that high unemployment in European welfare states can be
explained by the “adverse effects of generous unemployment compensation” when their
economies face “turbulent times.” Without reference to policy endogeneity, and with little
reference to direct empirical evidence, they conclude with a recommendation that welfare
states redesign their safety nets “to incorporate incentives to work” (548). This echoes, as
Lundquist and Sargent point out, Layard, Nickell and Jackman’s (1991; 1994) view that
“unconditional payment of benefits for an indefinite period is clearly a major cause of high
European unemployment.”21
On the other hand, one might expect a social system designed to provide insurance
against unemployment would become more generous as the unemployment rate increased:
with a decline in employment or the rate of employment creation, taxpayers could reasonably
want to give unemployed workers additional time to search for the right job, thereby
improving the quality of the match between workers and jobs. More generous benefits would
reduce the harmful effects of lost income on workers and their families. This additional
income would help sustain aggregate demand during economic slowdowns. The social,
psychological, and health-related costs of unemployment are well established (Korpi, 2002)
and there can be little doubt that many workers would choose employment over the dole, no
matter how generous (Gallie and Alm, 1997).
Yet, it is perhaps indicative of the dominance of the orthodox view that, while briefly
mentioned in the underlying working paper (Bassanini and Duval, 2006), there is no mention
of the possibility of policy endogeneity in the OECD’s Employment Outlook (2006, Chapter
7). This section begins with some reasons for caution in the interpretation of regression
coefficients between benefit generosity and unemployment. We then turn to the
microeconometric evidence, which has frequently been employed in support of the orthodox
interpretation of the macro results.
5.2 Interpretation of Benefit Effects
Table 3 suggests a broad consensus finding that a 10 percentage point change in the
OECD’s overall measure of benefit generosity will generate a change in the unemployment
rate of about 1 percentage point. Applied to the median rate of 5.2 percent for 19 OECD
countries (see figure 1), this suggests that the median country could reduce its unemployment
33
rate by about 20 percent (to about 4 percent) by reducing the average replacement rate from,
say, 40 to 30 percent. But there are some reasons to believe that this is an implausibly large
effect.
First, given the small share of workers directly affected by benefits system, the size of
the effect seems implausibly large. A substantial number of unemployed workers do not
actually receive benefits in the first place. Atkinson and Mickelwright (1991, p. 1692)
flagged this long ago: “nearly one in five of those registered as claimants in Britain in
November 1988 were in receipt of neither UA nor UI. In West Germany in December 1988
over a third of registered unemployed received neither Arbeitslosengeld (UI) nor
Argbeitslosenhilfe (UA).” According to the Eurostat Labour Force Survey, in 1995 the
percentage of unemployed receiving any benefit or assistance was: Italy, 7%; Greece, 9%;
Spain, 24%; Portugal, 27%; France, 45%; the Netherlands, 50%; Germany, 70%; Austria and
Denmark, 66%; Ireland, 67%; Sweden, 70%; and Belgium, 81% (Manning, 1999, p. 144).
According to the most recent evidence, the share of “ILO unemployed” actually in receipt of
unemployment benefits in OECD-member countries ranges from around 20 to 80 percent
(Immervoll et al., 2004, fig 3.6).
That recipiency rates tend to be much smaller than unemployment rates reflects the
effects of two factors. The first is the “take-up” rate – the number of eligible workers who,
for whatever reason, do not collect their benefits – which is estimated by the OECD to range
from 60-80 percent (Hernanz et al. 2004, p. 4). The second is eligibility for benefits, which is
particularly important for youth.
Younger workers, who in many countries account for a large part of the unemployment
problem and who may be most sensitive to work incentives, may be either ineligible for
benefits in the first place or eligible only for lower levels of benefits. The OECD’s Jobs
Study (1994, p. 184) explored the association across countries between the maximum
duration of wage-related insurance benefits (for a worker with a good employment record at
age 20) and the share of long-term unemployment for ages 14-24: “For young people there is
no correlation, perhaps because of the limited relevance for them of insurance benefits.”
More recent evidence supports this conclusion. Table 5 shows youth unemployment rates
and net replacement rates for 20 year old single workers for 1999. Among the four largest
continental European countries, three have by far the highest youth unemployment rates
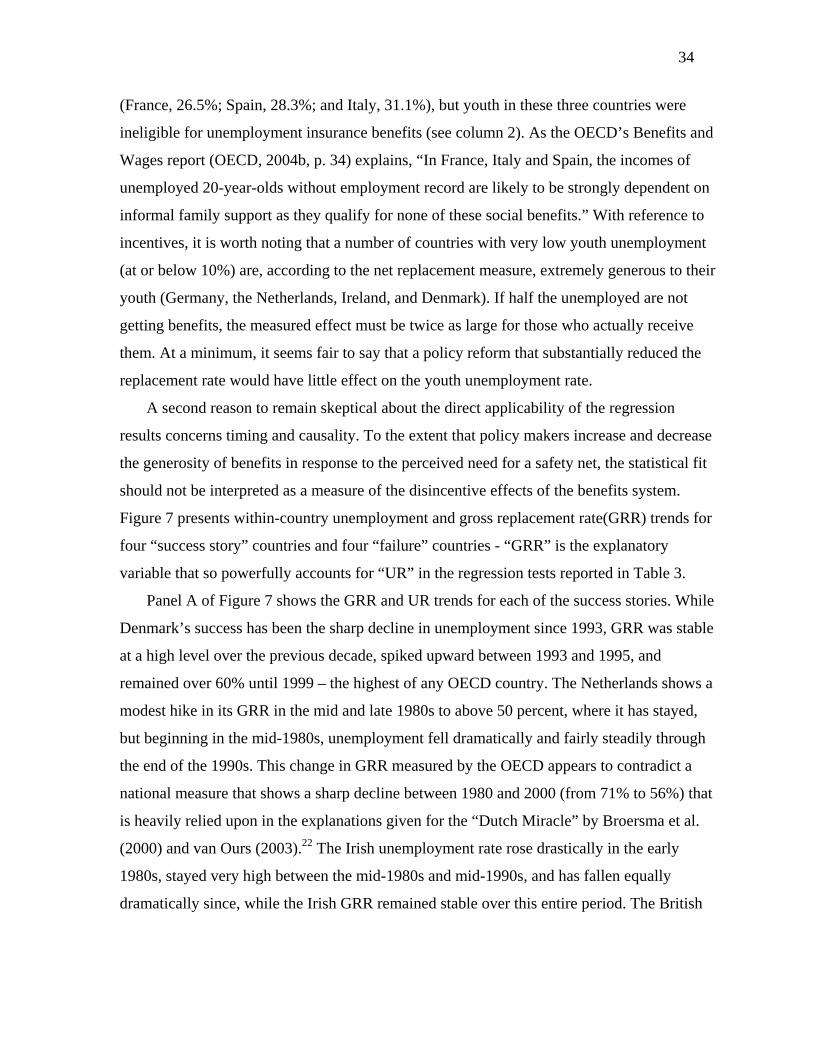
34
(France, 26.5%; Spain, 28.3%; and Italy, 31.1%), but youth in these three countries were
ineligible for unemployment insurance benefits (see column 2). As the OECD’s Benefits and
Wages report (OECD, 2004b, p. 34) explains, “In France, Italy and Spain, the incomes of
unemployed 20-year-olds without employment record are likely to be strongly dependent on
informal family support as they qualify for none of these social benefits.” With reference to
incentives, it is worth noting that a number of countries with very low youth unemployment
(at or below 10%) are, according to the net replacement measure, extremely generous to their
youth (Germany, the Netherlands, Ireland, and Denmark). If half the unemployed are not
getting benefits, the measured effect must be twice as large for those who actually receive
them. At a minimum, it seems fair to say that a policy reform that substantially reduced the
replacement rate would have little effect on the youth unemployment rate.
A second reason to remain skeptical about the direct applicability of the regression
results concerns timing and causality. To the extent that policy makers increase and decrease
the generosity of benefits in response to the perceived need for a safety net, the statistical fit
should not be interpreted as a measure of the disincentive effects of the benefits system.
Figure 7 presents within-country unemployment and gross replacement rate(GRR) trends for
four “success story” countries and four “failure” countries - “GRR” is the explanatory
variable that so powerfully accounts for “UR” in the regression tests reported in Table 3.
Panel A of Figure 7 shows the GRR and UR trends for each of the success stories. While
Denmark’s success has been the sharp decline in unemployment since 1993, GRR was stable
at a high level over the previous decade, spiked upward between 1993 and 1995, and
remained over 60% until 1999 – the highest of any OECD country. The Netherlands shows a
modest hike in its GRR in the mid and late 1980s to above 50 percent, where it has stayed,
but beginning in the mid-1980s, unemployment fell dramatically and fairly steadily through
the end of the 1990s. This change in GRR measured by the OECD appears to contradict a
national measure that shows a sharp decline between 1980 and 2000 (from 71% to 56%) that
is heavily relied upon in the explanations given for the “Dutch Miracle” by Broersma et al.
(2000) and van Ours (2003).22 The Irish unemployment rate rose drastically in the early
1980s, stayed very high between the mid-1980s and mid-1990s, and has fallen equally
dramatically since, while the Irish GRR remained stable over this entire period. The British

35
unemployment rate has increased sharply twice and fallen sharply twice since the late 1970s
while its GRR has edged gradually downward.
It is notable that if there is any relationship between GRR and UR trends for these four
success stories, Granger-causality tests indicate that it is the unemployment rate that drives
the benefits level in each case – just the reverse of the orthodox prediction. The first four
columns of Table 6 show the F-statistics of Granger tests that unemployment rates predict
the benefit replacement rate, while the four columns in Panel B test the reverse – that
unemployment benefit generosity predicts unemployment. To allow for the broadest
reasonable test of the relationships, we present results separately for Granger tests that
include one, two, three, and four lags of the gross replacement rate. Changes in
unemployment predict changes in the benefits measure (GRR) for Denmark with significance
at the 5-10 percent level for all four lags; for the UK at the 5-10 percent level for each of the
first 3 lags; for the Netherlands at the 1 percent level for the first 2 lags and at the 5-10
percent level over the 3rd and 4th year; and for Ireland with significance at the 1 percent level
in the first year. Interestingly, another success story – the U.S. – shows this “reverse
causality" as well for lags 3-4.
Returning to the GRR and UR time series in Figure 7, Panel B shows the trends for the
four “failure” countries. At least until the late 1990s, the trends for France appear to move
roughly together, but it is clear that unemployment took off in the 1970s well before GRR
began to edge up. Despite the pro-market policy shift in the early 1980s, French
unemployment rates continued to rise, and in response to political protests, “the authorities
expanded social spending to help protect workers from dislocation and to undercut resistance
to measures of economic liberalization” (Levy 309; see also Blanchard, 2006). This is
consistent with the Granger results shown in Table 6 for France: all four lags show a
significant relationship from unemployment to GRR, and this is particularly strong for the
first two years.
Nor do the trends in Panel B of Figure 7 suggest the orthodox account for the other three
large high unemployment countries. Germany shows a steadily rising UR but a stable GRR.
The trends for Spain show that since the mid-1980s GRR remained stable at a moderate rate
of just above 30%, while unemployment shows a huge increase from the late 1970s through
the 1980s, peaked at over 20% in 1994, and then fell sharply and steadily to 10.9% in 2004.
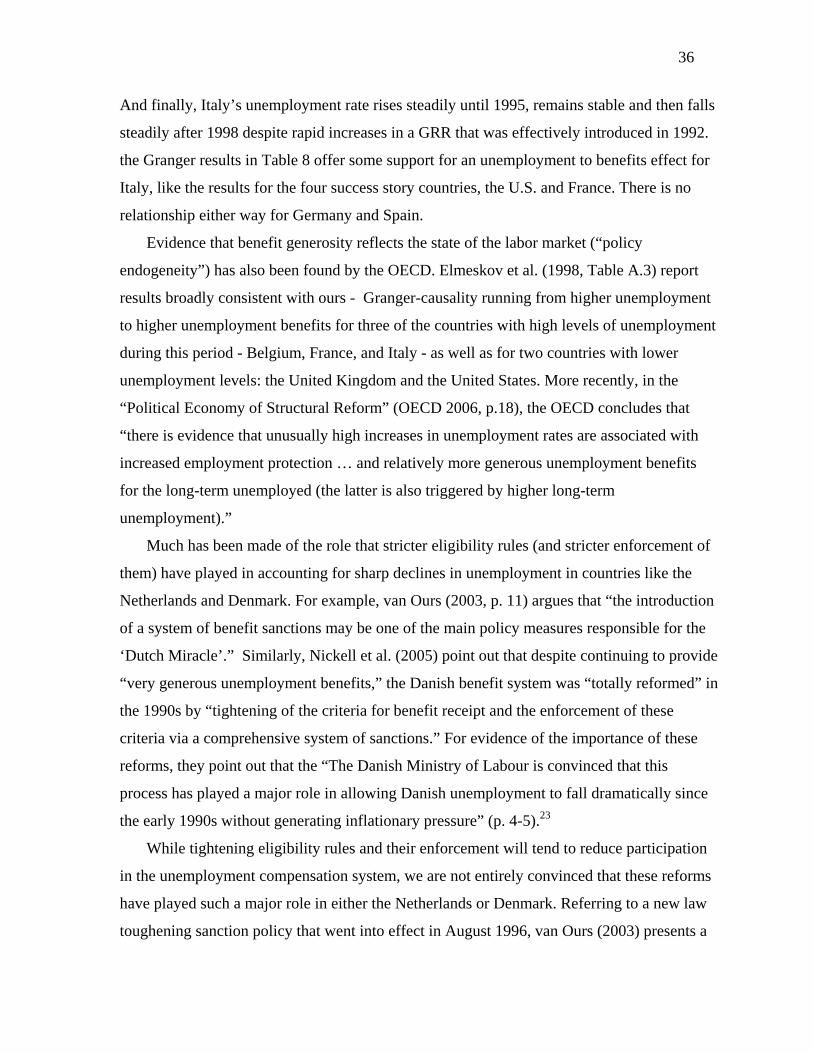
36
And finally, Italy’s unemployment rate rises steadily until 1995, remains stable and then falls
steadily after 1998 despite rapid increases in a GRR that was effectively introduced in 1992.
the Granger results in Table 8 offer some support for an unemployment to benefits effect for
Italy, like the results for the four success story countries, the U.S. and France. There is no
relationship either way for Germany and Spain.
Evidence that benefit generosity reflects the state of the labor market (“policy
endogeneity”) has also been found by the OECD. Elmeskov et al. (1998, Table A.3) report
results broadly consistent with ours - Granger-causality running from higher unemployment
to higher unemployment benefits for three of the countries with high levels of unemployment
during this period - Belgium, France, and Italy - as well as for two countries with lower
unemployment levels: the United Kingdom and the United States. More recently, in the
“Political Economy of Structural Reform” (OECD 2006, p.18), the OECD concludes that
“there is evidence that unusually high increases in unemployment rates are associated with
increased employment protection … and relatively more generous unemployment benefits
for the long-term unemployed (the latter is also triggered by higher long-term
unemployment).”
Much has been made of the role that stricter eligibility rules (and stricter enforcement of
them) have played in accounting for sharp declines in unemployment in countries like the
Netherlands and Denmark. For example, van Ours (2003, p. 11) argues that “the introduction
of a system of benefit sanctions may be one of the main policy measures responsible for the
‘Dutch Miracle’.” Similarly, Nickell et al. (2005) point out that despite continuing to provide
“very generous unemployment benefits,” the Danish benefit system was “totally reformed” in
the 1990s by “tightening of the criteria for benefit receipt and the enforcement of these
criteria via a comprehensive system of sanctions.” For evidence of the importance of these
reforms, they point out that the “The Danish Ministry of Labour is convinced that this
process has played a major role in allowing Danish unemployment to fall dramatically since
the early 1990s without generating inflationary pressure” (p. 4-5).23
While tightening eligibility rules and their enforcement will tend to reduce participation
in the unemployment compensation system, we are not entirely convinced that these reforms
have played such a major role in either the Netherlands or Denmark. Referring to a new law
toughening sanction policy that went into effect in August 1996, van Ours (2003) presents a
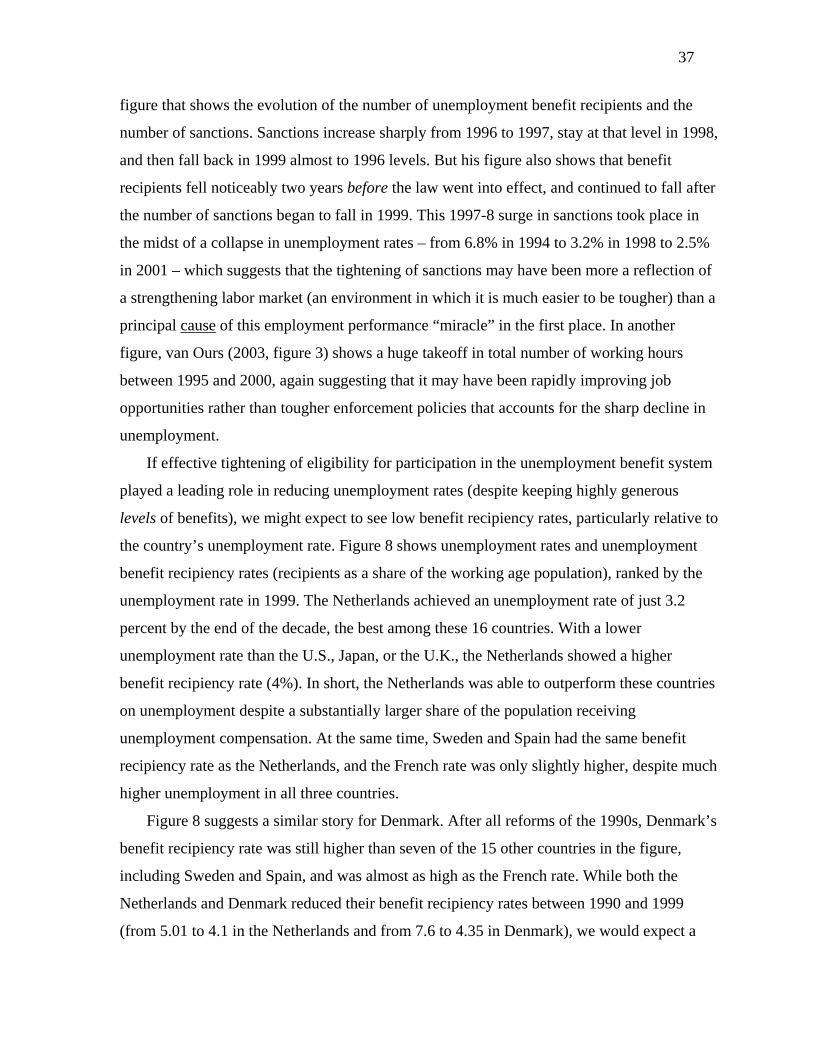
37
figure that shows the evolution of the number of unemployment benefit recipients and the
number of sanctions. Sanctions increase sharply from 1996 to 1997, stay at that level in 1998,
and then fall back in 1999 almost to 1996 levels. But his figure also shows that benefit
recipients fell noticeably two years before the law went into effect, and continued to fall after
the number of sanctions began to fall in 1999. This 1997-8 surge in sanctions took place in
the midst of a collapse in unemployment rates – from 6.8% in 1994 to 3.2% in 1998 to 2.5%
in 2001 – which suggests that the tightening of sanctions may have been more a reflection of
a strengthening labor market (an environment in which it is much easier to be tougher) than a
principal cause of this employment performance “miracle” in the first place. In another
figure, van Ours (2003, figure 3) shows a huge takeoff in total number of working hours
between 1995 and 2000, again suggesting that it may have been rapidly improving job
opportunities rather than tougher enforcement policies that accounts for the sharp decline in
unemployment.
If effective tightening of eligibility for participation in the unemployment benefit system
played a leading role in reducing unemployment rates (despite keeping highly generous
levels of benefits), we might expect to see low benefit recipiency rates, particularly relative to
the country’s unemployment rate. Figure 8 shows unemployment rates and unemployment
benefit recipiency rates (recipients as a share of the working age population), ranked by the
unemployment rate in 1999. The Netherlands achieved an unemployment rate of just 3.2
percent by the end of the decade, the best among these 16 countries. With a lower
unemployment rate than the U.S., Japan, or the U.K., the Netherlands showed a higher
benefit recipiency rate (4%). In short, the Netherlands was able to outperform these countries
on unemployment despite a substantially larger share of the population receiving
unemployment compensation. At the same time, Sweden and Spain had the same benefit
recipiency rate as the Netherlands, and the French rate was only slightly higher, despite much
higher unemployment in all three countries.
Figure 8 suggests a similar story for Denmark. After all reforms of the 1990s, Denmark’s
benefit recipiency rate was still higher than seven of the 15 other countries in the figure,
including Sweden and Spain, and was almost as high as the French rate. While both the
Netherlands and Denmark reduced their benefit recipiency rates between 1990 and 1999
(from 5.01 to 4.1 in the Netherlands and from 7.6 to 4.35 in Denmark), we would expect a
38
decline in benefit recipients as labor markets improve. Nevertheless, both countries show
quite high recipient rates relative to their unemployment rates, suggesting, after the spate of
1990s reforms, that each has achieved its successful employment performance while
maintaining a relatively large and generous unemployment benefit entitlements system.
Benefit generosity as measured by recipiency rates is uncorrelated with unemployment.
Indeed, it is particularly striking how large the gap is between these two rates for the high
unemployment countries (Spain, France and Italy).
5.3 The Microeconometric Evidence
5.3.1 Evidence from Literature Surveys
Evidence of the effects of unemployment benefit entitlements on individual behavior has
frequently been cited in support of the orthodox interpretation of the macro evidence. A good
example is Elmeskov et al. (1998, p. ):
Turning to the role of labour market policies, there is strong evidence that more generous unemployment benefits (UB) lead to higher structural unemployment. The implicit average elasticity of unemployment with respect to the OECD summary measure of benefit entitlements is around 0.4, a value which is close to those often found in the microeconometric literature (Holmlund, 1998). These findings suggest that the effects of generous benefits on the reservation wage of unemployed job-seekers and/or on wage bargaining dominate any positive impact of benefits on search effectiveness.
Nickell et al. (2005, p. 4) and the OECD (2006, Chapter 3, p. 59) also cite Holmlund (1998)
for microeconometric evidence that more generous unemployment benefits lead to higher
unemployment.
It is notable that a close look at what Holmlund actually writes produces a strikingly
different picture. The only reference to an elasticity estimate of “.4” comes in a critical
discussion of a paper by Mortensen. Holmlund refers to Mortensen’s “simulation results of
UI policies in a parameterized version of the Mortensen and Pissarides (1996) model… A
rise in the replacement rate from 30 to 40 percent would increase unemployment by at least 4
percentage points, and possibly by more than 10 percentage points, according to these
simulations” (Holmlund, p. 124). Holmlund then suggests that these estimates are
implausibly large:
“The most likely reason why benefit hikes apparently have a much stronger impact in Mortensen’s experiments than in those reported in Table 1 is because Mortensen

39
imputes a non-trivial value to leisure… Unfortunately, economists know virtually nothing about a reasonable estimate of the leisure value of unemployment. A liberal interpretation of some empirical evidence on unemployment and psychological well-being suggests that the value may well be negative (emphasis in the original); see e.g., Blanchflower and Oswald (1997). Policy simulation that hinge crucially on assumptions concerning unobservables should therefore be used with more than the usual caution as prediction so what is likely to happen if a particular policy is implemented” (p. 124-5).
So, far from being a consensus estimate of the microeconometric literature by Holmlund,
this .4 estimate is actually an example of an implausibly large estimate from what Holmlund
suggests are rather fanciful policy simulations. Indeed, the Elmeskov et al. (1998) reference
to Holmlund appears to directly contradict Holmlund’s own assessment: “Do the estimates
from micro data give reliable answers to general-equilibrium questions about the effects UI
on unemployment? In general, the answer is no” (p. 125). Holmlund goes on to conclude that
“The weight of the evidence suggests that increased benefit generosity causes longer spells of
unemployment and probably higher overall unemployment as well. But there remains a
considerable degree of uncertainly regarding the magnitudes of these effects” (p. 137).
Holmlund presents no direct evidence in support of effects on “overall unemployment” and
makes clear that his conclusion reflects, not the balance of the statistical evidence, but “my
own judgment” (p. 126).
Two responses to Holmlund’s survey were published in the same issue of the
Scandinavian Journal of Economics. Manning (1998, p. 143) suggests that Holmlund’s “own
judgment” in the absence of compelling evidence reflects the dominance of orthodox
renditions of mainstream theory: “the strength of the evidence linking the generosity of the
benefit system and unemployment is not as strong as we would like and our belief in such a
link derives more from the theory than from the evidence.” In a second comment, Strom
(1998, p. 151) also stresses the weak character of the evidence: “Neither microeconometric
nor macroeconometric results give strong and/or convincing support to the predictions of a
strong positive relationship between unemployment and unemployment benefits as indicated
in microeconomic and macroeconomic theory.”
This is probably a stronger negative position than Holmlund would accept, but he
presents little microeconometric support in his survey for “major effects” of unemployment
benefit generosity on the unemployment rate. Holmlund (p. 138) concludes that “We are a
40
long way from a situation where economists can with any confidence provide policymakers
with reliable menus for choice among key UI parameters.”
5.3.2 Micro Evidence on Unemployment Duration
At least after some threshold, more generous benefits can be expected to increase
unemployment duration, and all else equal, this should increase unemployment rates. But all
else is not equal and too frequently higher (lower) unemployment duration is conflated with
higher (lower) aggregate and unemployment rates. In fact, higher levels and duration of
benefits not only tend to increase the incentive to remain unemployed, but also tend to
counter the effect of this increased incentive by influencing the inflows into both
unemployment and employment.
Regarding inflows into unemployment, Atkinson and Mickelwright (1991, p. 1710) point
out that greater benefit generosity may affect only the composition, not the level of
unemployment: “Suppose for example that ceteris paribus we observe that persons with
higher benefits exit unemployment more slowly. This does not necessarily mean that
aggregate unemployment is higher since the refusal of jobs by one group may lead to the
work being offered to others. In other words it is the composition of unemployment which is
altered.”
Higher unemployment benefit generosity can also affect inflows into employment, which
could limit or offset the effect of longer unemployment duration on the aggregate
unemployment rate. Often referred to as the “entitlement effect,” Holmlund (1998, p. 116)
explains that “for some workers, in particular those who do not qualify (or have ceased to
qualify), higher benefits will make work more attractive relative to unemployment. The
effect of higher benefits on the duration of unemployment is therefore, in general,
ambiguous.” And if work becomes more attractive because it qualifies workers for more
generous benefits should they become unemployed, this lower duration might actually tend
to reduce the unemployment rate. The possibility of “composition” and “entitlement” effects
means that there is no necessary direct relationship between average unemployment duration
and the unemployment rate.
Early research suggested that benefit generosity had a strong positive effect on
unemployment duration and that this, in the words of Lancaster and Nickell (1980) “is now a

41
rather firmly established parameter.” This same assessment appears in Layard et al. (1991).
But the evidence from the 1970s and 1980s was in fact quite mixed. According to Atkinson
and Mickelwright (1991, p. 1712), “As with the U.S. and the U.K., the evidence (from the
rest of the OECD) does not suggest that the effects of benefits on transitions out of
unemployment (however defined) are large or measured with precision.” At about the same
time, Barr (1992, cited by Hammer, 1999, p. 132), comes to a similar conclusion: “Despite
continuing controversy, the general conclusion is that though the duration of unemployment
is likely to be slightly longer at higher replacement rates, the magnitude of the effect is not
large.” With the benefit of research done in the 1990s on this question, Holmlund (1998, p.
118) contends that the Lancaster and Nickell conclusion “was surely premature. The effect of
benefits on unemployment duration is far from a firmly established parameter that is
comparable in robustness to, say, estimates of the returns to schooling.”
Over the last decade, many studies have taken advantage of the natural experiment-like
quality of major policy shifts, and these have tended to find more convincing evidence for a
benefits effect on unemployment duration, though the magnitudes of the effects can be
surprisingly small. Among studies finding fairly large effects is Roed and Zhangs (2003, p.
204), whose study of Norwegian data suggested that a 10 percent decline in benefits “may
cut a 10-month duration by approximately one month for men and 1-2 weeks for women.”
Lalive and Zweimuller (2004) examine a massive Austrian policy change that provided
what they argue is an ideal natural experiment. Anticipating deteriorating labor market
conditions in regions with heavy steel industry employment, the Austrian government
“dramatically increased benefit generosity” for some workers in certain regions from 30 to
209 weeks. They found a reduction in the transition rate to jobs of 17 percent, which meant
“increasing unemployment duration by about 9 weeks, leading to an increase in
unemployment duration per week of additional benefits of .055” (p. 2610).24 In another study
of this dramatic Austrian policy shift, Lalive et al. (2004) found that extending benefits from
30 to 39 weeks for 40-49 year olds “tends to increase expected unemployment duration by
.45 weeks… increasing replacement rates by 6 percentage points tends to increase
unemployment duration by .38 weeks” (p. 18). The nature of the policy shift allowed the
authors to assess the effects of the joint effect of raising the duration and level of benefits: a
33 percent increase in potential benefit duration and a 15% increase in the level of benefits
42
combined to raise unemployment duration by 3-4 days. Whether this seemingly modest
effect of a substantial increase in unemployment benefit generosity had any effect on
aggregate unemployment rates would depend, as noted above, on the extent of composition
and entitlement effects.
Jan van Ours and Vodopivec (2005, p. 3) investigate a 1998 reform of the benefits
system in Slovenia that “drastically reduced the potential duration of unemployment
benefits” and find “important and sizeable disincentive effects” (p. 17). With the drop in the
maximum duration of entitlements from 12 to 6 months, they found that the share of
unemployed who found a job within 6 months rose from 44 percent to 52.4 percent, an 8.4
percentage point gain. But interestingly, those who exited unemployment but not into
employment (out of the labor force) increased from 6 percent to 15.1 percent, an increase of
9.1 percent. As the authors point out, the benefits of the rise in exits to employment “have to
be weighted against possible additional hardship created by the curtailment of benefit
entitlement, as well as worse quality of post-unemployment jobs in terms of their stability,
type of appointment, and precariousness” (p. 17). In research on West Germany, Pollmann-
Schult and Buchel (2005) explore the effects of the duration of benefits on the quality of
post-unemployment jobs. They conclude that “although receipt of benefits delays exits from
unemployment, it raises aspiration levels and hence improves the quality of the eventual job
match” (p. 35).
Evidence from micro data suggests that unemployment benefit generosity has quite
limited effects on youth, consistent with the evidence presented above. In their study of cross
country differences in the transition from unemployment to employment for youth, Russell
and O’Connell (2001) find that successful transitions are positively related to unemployment
generosity – controlling for differences in individual characteristics, Denmark and France
show the highest exit rates to jobs while Spain, Italy and Greece show the lowest rates. “Of
the institutional factors considered, only unemployment compensation payments did not
operate in the expected manner: contrary to economic orthodoxy, lower levels of benefit
coverage were associated with lower rates of exit to employment.” Part of this finding may
be explained by the more extensive use of active labor market policies (ALMP) in the
northern European countries, which facilitate job preparation and search. This is certainly the
case for Denmark, which has perhaps the most generous benefits system but combines with it
43
an effective ALMP and strict enforcement of participation in these programs (Danish
Ministry of Finance, 1998).
In sum, references to micro evidence for support of macro findings that show a positive
relationship between unemployment benefit generosity and unemployment rates have, in our
view, tended to greatly overstate the case. The evidence surveyed by Atkinson and
Mickelwright (1991) and Holmlund (1998) on the relationship between benefit duration and
unemployment duration was mixed, particularly for European countries. Although more
recent “natural experiment” studies report fairly consistent effects in the expected direction,
several of the examples cited above also show surprisingly modest effects from very large
shifts in benefit generosity.
5.4 Assessment
This section has outlined some reasons for caution in concluding from the available
regression evidence that benefit generosity is at the root of the pattern of unemployment and
its change over time in OECD countries.
Concerning the interpretation of the macroeconometric evidence, it should be recognized
that in many countries, especially the high unemployment countries of Southern Europe
(Spain, France, Italy), only a portion of the unemployed receive benefits. This means the
presumed effects of benefit generosity on the supply (work incentives) and demand (wage
pressure) sides apply to as little as 20-50 percent of the unemployed. Further caution is
suggested by the timing and causality in the relationship between benefit generosity and
unemployment rates. Time trends between gross replacement rates and unemployment show
little correspondence for either the “success” or the “failure” countries, and Granger tests
indicate that in most cases it is unemployment that predicts benefits, not the reverse (the case
in all four success stories, two of the four failure countries, and the U.S.). And finally, the
absence of any relationship between benefit recipiency rates and unemployment rates
suggests that benefit generosity, strictness of eligibility rules, and the tough enforcement of
those rules do not distinguish the “success stories.”
The microeconometric evidence offers some support for the predicted effects of changes
in benefit entitlement generosity, eligibility rules, and enforcement strictness on the duration
on unemployment benefit and the exit rate out of unemployment. But the results are
44
surprisingly mixed with often quite modest effects. In any case, such evidence does not imply
that reductions in generosity or tightening eligibility rules would necessarily have any effect
on the overall unemployment rate since changes in benefit generosity may have offsetting
effects via inflows into unemployment and employment (“composition” and “entitlement”
effects).
The orthodox prediction rests on large effects of the benefit system on the reservation
wage and worker search behavior, and consequently on aggregate unemployment rates.
There is very little direct evidence that establishes these links. What has been demonstrated
is that most studies have found a significant statistical relationship between measures of
benefit generosity and cross country patterns of unemployment. But we know of no research
that has established that the direction of causation runs primarily in the orthodox direction, or
that micro evidence linking benefit generosity and unemployment duration translates to
aggregate unemployment rates. On the basis of the available evidence, it seems reasonable to
remain skeptical that any conceivable change in typical European benefits systems could
alter wage pressure and search behavior sufficiently to have substantial effects on the
unemployment rate.
6. Comprehensive Labor Market Reform and Unemployment
It has become increasingly recognized that the institutions that distinguish national labor
markets tend to be complementary. In this case, reforms are likely to be more effective if
implemented in a comprehensive manner across labor market institutions. The regression
approach is not particularly well-suited for testing alternative models defined by differently
designed mixes of institutions, although recent studies have attempted to allow for
complementarity by interacting selected sets of institutions (e.g., the replacement rate and
EPL; EPL and union density). In recent work on “varieties of capitalism” (Esping-Andersen,
1999; Freeman, 2000; Hall and Soskice, 2003; Amable, 2003), it has been argued that
dramatically different combinations of institutions can produce equally effective employment
results, ranging from highly laissez-faire markets (the “American” model) to far more
regulated markets and a large state role (the “Nordic” model).
This section critically assesses two recent efforts to show statistical support for a payoff
from the implementation of comprehensive reform policies. In the research considered here,
45
“reform” generally means deregulation: less product market regulation, less unemployment
benefit generosity, less employment protection, and lower trade union membership and
coverage. Lower taxes are also viewed as reform. The same goes for increases in active labor
market policy spending and the degree of coordinated bargaining, despite the fact that these
last two “reforms” are in fact interventions designed to improve outcomes by moving away
from decentralized markets. Still, the guiding hypothesis is that more comprehensive
deregulatory reform will produce lower levels of unemployment.
6.1 Nickell’s Reforms Index
In a recent paper, Nickell (2003) points out that European unemployment is
concentrated in “the big four” countries (France, Germany, Italy and Spain). The goal of the
paper is to “see how these institutional variables have changed over time and what these
changes can tell us about why the European Big four countries have performed less well than
most other countries on the unemployment front in the 1990s.” Based on his best judgments
about the magnitude of changes in various labor market institutions and what changes qualify
as either employment-enhancing or employment-unfriendly, Nickell develops a labor market
reforms scorecard and explores its correlation with changes in unemployment between the
early 1980s and the late 1990s.
Nickell accounts for 51% of the variation in unemployment over these two decades for
20 OECD countries by regressing the sums of “ticks” (good changes) and “crosses” (bad
changes) on nine institutional measures. On the basis of this evidence “We may reasonably
conclude that the countries which had very high unemployment in the early 1980s and still
have high unemployment today simply have too few ticks and/or too many crosses” (Nickell,
2003). It is this evidence alone that Gilles St. Paul (2004: 53) cites for his conclusion that
“rigidities that reduce competition in labor markets are typically responsible for high
unemployment.”
But Nickell’s policy reforms scorecard – the net sum of ticks and crosses – actually fails
to identify three of the four big high-unemployment countries. 25 As Figure 9 shows,
according to his net totals of ticks/crosses, only France gets more bad than good marks, and
there is some question about the appropriateness of its score.26 The Nickell scorecard
indicates that both Austria and Switzerland should have shown about the same poor

46
performance as France. The three other high unemployment countries (Germany, Spain and
Italy) get the same scores in the middle of the distribution (0 to 1) as the U.S. and Norway.
This figure suggests that, for at least three of Nickell’s four persistent high unemployment
countries, it is not reasonable to conclude that the problem has been simply too few ticks and
too many crosses.
6.2 OECD Reforms Indices
A central pillar of OECD labor market policy has been that reforms that reduce labor
market rigidities are the answer to persistent high unemployment. An enumeration of such
reforms was carried out by the OECD (1999b) as part of its follow-up to The OECD Jobs
Study (OECD 1994) and provides a comprehensive listing of changes in the generosity of
unemployment benefits, the strictness of employment protection laws, the level of minimum
wages and the like, focused on the period from 1995 but also with summary data from the
early 1990s. The OECD also listed all the reforms recommended for each country in its labor
market reviews, developed a weighting system for assessing their significance, and then
analyzed whether the recommended reform had been fully implemented, partially
implemented, ignored, or even flouted (in the sense that policy had moved in the “wrong”
direction). The OECD’s “follow-through” measure was defined as the share of
recommendations actually adopted, wholly or partially by each country.
The OECD found a significant positive relation between this measure of “follow-
through” and the extent to which the unemployment (the NAIRU) fell in the 1990s (OECD
1999b: figure 2.7). This is presented as evidence that there has, indeed, been a payoff to
countries that have implemented the Jobs Strategy recommendations.
Apart from any issues of the definition or weighting of reforms, the problem with this
approach is that it ignores the very different number of recommendations for labor market
reforms that each country received from the OECD.27 Accordingly, we constructed an
alternative index showing the “volume” of labor market deregulation recommendations that
were actually carried out, which depends on both the number of measures advocated by the
OECD and their “follow-through” by the countries. We limited our index to the OECD’s list
of reforms related to unemployment benefits, employment protection, and wage bargaining
systems, as these constitute the key labor market institutions typically regarded as
47
employment-unfriendly (see Baker et al., 2005). Figure 10 compares this alternative index of
labor market deregulation in the 1990s with the OECD’s estimate of the change in structural
unemployment over the same period for 21 OECD member countries. The figure shows no
significant relationship between this narrower and more appropriately defined measure of
deregulation and the change in unemployment across OECD countries.
The most recent OECD effort of this sort replaces these rather ad hoc measures of
“reforms” with the coefficients from the Bassanini-Duval (2006) baseline regression.
According to the OECD’s Figure 7.3b in the latest Employment Outlook (OECD, 2006), the
unemployment predicted by changes in institutions and policies alone is highly correlated
(.69) with changes in observed unemployment over the 1982-2003 period. We have
decomposed this overall effect to determine the role played by protective labor market
institutions (PLMIs). Figure 11 shows that the change in unemployment predicted by PLMI
changes is far less strongly correlated to observed unemployment (less than .36). Two
persistently low unemployment countries contribute to this modest correlation (Norway and
Switzerland). As noted above in Section 2, Switzerland’s position in the Figure reflects the
use of an unemployment rate in the base year calculated from administrative records which is
wholly incomparable with the end year rate. Adding the tax wedge improves the correlation
dramatically (to .65).
The country level changes underlying these correlations results appear in Appendix 1.
Based on the Bassanini-Duval coefficients, this table shows the contributions of PLMIs
(benefit entitlement levels, employment protection strictness, and trade union density) to the
1982-2003 change in unemployment (column 1); this effect plus the effect of changes in the
tax wedge (column 2); and the effect of changes product market regulation (column 3). These
effects can be compared to changes in the observed standardized unemployment rate (column
4). The table is sorted by these column 4 changes.
The top of the table shows that reforms in PLMIs played virtually no role in the success
of the “success stories.” In Ireland and The Netherlands – two of the four countries with the
largest declines in unemployment, changes in "bad" institutions actually increased
unemployment (1.5 and 1.1 percentage points respectively). Among the top 8 performers,
where unemployment declined from 2.6 points to 7.4 points, the effect of these “bad” labor
market institutions was negligible (.1 -.2 points, or from 1/26th to 1/74th of the total change).

48
And finally, it is notable that among the four big high-unemployment countries, only Italy
shows a large contribution of PLMIs to unemployment (4.8 points), but this mainly reflects
the fact that Italy only adopted a benefits system in the early 1990s, after most of the increase
in unemployment had occurred (see figure 7b). As for France, the 1.2 point contribution or
PLMIs to French unemployment was more than offset by the effects of reduced product
market regulation. On balance, the new Bassanini-Duval results suggest that core protective
labor market institutions have played little role in cross-country changes in unemployment
since the early 1980s.
7. Conclusions
In his survey on the labor market effects of the unemployment benefit system, Holmlund
(1998, p. 114) writes that “a hallmark of modern labor economics is the close interplay
between the development of theory, data sources and econometric testing.” There can be
little doubt that this interplay has greatly advanced our knowledge in many areas. At the
same time, as Manning (1998) suggests in his comment on the Holmlund survey, theory
seems the dominant partner in this interplay, playing a “disturbingly large part in informing
the discussion” (p. 145).28
Our survey was motivated by a concern that empirical research on the determinants of
high unemployment has become increasingly driven by efforts to verify, or confirm, received
theory, rather than by efforts to confront and critically test it, a general concern about
empirical work in economics raised many years ago Mark Blaug and Robert Solow (Blaug
1992).29 As Blaug points out, it is rather easy to confirm; the test of a hypothesis is whether
it stands up to critical scrutiny. As a result, our approach has been to take a skeptical stance
and confront the orthodox view that protective labor market institutions and their changes
over time can explain the evolution of differences in unemployment across countries since
the early 1980s.
We began by noting that the cross-country pattern of unemployment has changed
dramatically over the last three decades. For the major OECD countries, the overall picture is
one of sharp increases in the level and dispersion of rates through the mid-1990s, followed by
a striking decline in level and dispersion since. At the same time, we have seen large swings
in unemployment in countries with very different institutional settings: the U.K, Ireland,

49
Canada and New Zealand among the English-speaking market-oriented countries; Spain and
Germany among the continental European countries; and Denmark, the Netherlands, Sweden
and Finland among the Northern European and Nordic countries. These are among the most
extreme examples of the changes in employment performance that protective labor market
institutions (PLMIs) are presumed to explain.
Given the difficulty of developing consistent time series of unemployment rates over
time and across countries, and the perhaps even more daunting task of generating consistent
time series of policies and institutions, it is a striking feature of this literature that hardly any
attention has been placed on the consistency and quality of the data. There have been
considerable efforts to improve the institutional variables, notably by the OECD, but gains
from these improvements (and from the use of more sophisticated econometric methods) may
have been compromised in studies that have extended the time series analysis back to the
early 1960s with annual data, a research strategy that requires much better data than are
currently available. For these reasons, the most recent entry into this field by the OECD
examined just the period since 1982 (Bassanini and Duval, 2006; OECD, 2006). It is notable
that as the data and econometric methods have improved, the number of PLMI measures
found to be significant in the expected direction has plummeted: compare for example
Scarpetta (1996) and Nickell (1997) with Baccaro and Rei (2005) and Bassanini and Duval
(2006).
The widely accepted centrality of PLMIs for labor market performance might lead the
unwary to believe that there would be some strong cross country relationships between the
two. Indeed, simple scatter plots have frequently been employed in this literature to establish
the connection between, for example, benefit duration and unemployment rates. But a closer
look shows that, especially with the shift from the more subjective early institutional
measures to the more carefully constructed OECD data that replaced them, such significant
simple correlations do not show up in the data.
A large and increasingly sophisticated literature has employed measures of PLMIs in
panel data models to explain cross country differences in unemployment. While significant
impacts for employment protection, benefit generosity, and union strength have been
reported, our review of these studies indicates that the effects for key PLMIs are distinctly
unrobust, with widely divergent coefficients and levels of significance. The one possible

50
exception to this broad conclusion is the role played by unemployment benefit generosity,
but little attention has been paid to the direction of causation – both common sense political
economy considerations and granger test results suggest that much of any statistical
association runs mainly from changes in unemployment to changes in benefit generosity.
The microeconometric evidence has frequently been cited as confirmation of the
dominant macroeconometric findings. It is certainly not controversial that, at least after some
threshold, greater benefit generosity will tend to discourage work. The question is whether
politically realistic changes in benefit generosity (from, say, an average gross replacement
rate of 40% to 30%) are likely to affect worker labor supply decisions and wage pressure
sufficiently to have large, or even measurable impacts on the aggregate unemployment rate.
Our review of this evidence indicates a wide range of effects and surprisingly small effects
on behavior of what have been termed “drastic” changes in benefit generosity in recent
“natural experiment” studies. In any case, it is important to recognize that the predicted
effects of changes in benefit generosity will have no necessary effect on the overall
unemployment rate since changes in generosity may have offsetting effects via inflows into
unemployment and employment (“composition” and “entitlement” effects).
It is increasingly recognized that labor market institutions and policies are interdependent
and that successful employment performance is likely to reflect coordinated reform efforts.
Our final section looked at recent attempts to measure the impact of overall labor market
reform on unemployment rates over the past decade or so. We find that the positive
conclusion in these studies reflects more the initial orthodox presumption of a strong positive
relationship than the actual statistical evidence presented, particularly concerning the impacts
of the key PLMIs.
Such lack of robustness may very well be an inevitable feature of attempts to find
uniform and reliable economic relationships with imperfectly measured institutions and
policies, imperfectly measured macroeconomic shocks and shifting economic structures, and
small numbers of (country) observations. But in the bulk of this literature there has been a
striking contrast between the fragility of the findings (both within and across studies) and the
confidence with which it is concluded from them that labor market rigidities are indeed at
the root of poor employment performance.

51
This survey suggests that the interplay is disturbingly unbalanced – data resources and
econometric testing have been employed too much towards the end of confirming the
orthodox presumption that decentralized and unregulated labor markets produce better
employment outcomes. Getting the real impacts of key protective labor market institutions
right is of particular importance since presumptions about their size have guided so much
policy advice over recent decades. Reforms that demonstrably reduce the well being of many
workers should be undertaken only with compelling evidence about the magnitude of
offsetting benefits.
52
References Amable, Bruno. 2003. The Diversity of Modern Capitalism, (Oxford: Oxford University
Press). Atkinson, Anthony and J. Micklewright. 1991. “Unemployment Compensation and labor
market transitions: a critical review,” Journal of Economic Literature 29, pp. 1697-1727.
Baccaro, Lucio and Diego Rei. 2005. “Institutional determinants of unemployment in OECD countries: A time series cross-section analysis,” International Institute for Labour Studies Discussion Paper, DP/160/2005, International Institute for Labour Studies, Geneva.
Baker, Dean, Andrew Glyn, David R. Howell, and John Schmitt. 2005. “Labor Market Institutions and Unemployment: A Critical Assessment of the Cross-Country Evidence,” chapter 3 of D. R. Howell, ed., Fighting Unemployment: The Limits of Free Market Orthodoxy, (Oxford University Press).
Barr, Nicholas. 1992. Economic Theory and the Welfare State: A Survey and Interpretation. Journal of Economic Literature 30, 741-803. Barr, Nicholas.1998. The Economics of the Welfare State (Stanford: Stanford University
Press). Bassanini, Andrea and Romain Duval. 2006. “Employment Patterns in OECD Countries:
reassessing the role of policies and institutions,” OECD Social, Employment and Migration Working Paper No. 35, and OECD Economics Department Working Paper No. 486, Paris.
Bean C. 1994. “European Unemployment: A Survey,” Journal of Economic Literature, XXXII, 573-619.
Belot, Mchele and Jan C. van Ours. 2004. “Does the recent success of some OECD countries in lowering their unemployment rates lie in the clever design of their labor market reforms?,” Oxford Economic Papers 56, pp. 621-642.
Blanchard, Olivier J. 2003. Comments on Ljungqvist and Sargent. In Knowledge, Information, and Expectations in Modern Macroeconomics: In Honor of Edmund S. Phelps, ed. Philippe Aghion, Roman Frydman, Joseph Stiglitz, and Michael Woodford, 351-356. Princeton: Princeton University Press.
Blanchard, Olivier and Justin Wolfers. 2000. “The Role of Shocks and Institutions in the Rise of European Unemployment: the Aggregate Evidence,” The Economic Journal 110 (March): C1-C33.
Blaug, Mark. 1992. The Methodology of Economics: Or How Economists Explain, (Cambridge: Cambridge University Press, 2nd edition).
Broersma, Lourens, Jan Koeman, and Coen Teulings. 2000. “Labour supply, the natural rate, and the welfare state in The Netherlands: the wrong institutions at the wrong point in time,” Oxford Economic Papers 52, 96-118.
Cassino, Vincenzo and Richard Thornton. 2002. “Do Changes in Structural Factors Explain Movements in the Equilibrium Rate of Unemployment?,” Working Paper #153, Bank of England.
Danish Ministry of Finance. 1999. “The Danish Economy: Medium Term Economic Survey,” Copenhagen: Ministry of Finance.

53
Elmeskov, J., J. Martin, and S. Scarpetta. 1998. “Key Lessons for Labor Market Reforms: Evidence from OECD Countries Experience,” manuscript (published in the Swedish Economic Policy Review 5(2) 205-252).
Esping-Andersen, Gosta. 1999. Social Foundations of Postindustrial Economics, (Oxford: Oxford University Press).
Fitoussi, Jean-Paul. 2003. “Comments on Nickell, Nunziata, Ochel, and Quintini,” in Aghion et al., Knowledge, Information, and Expectations in Modern Macroeconomics: In Honor of Edmund S. Phelps, (Princeton University Press).
Fitoussi, Jean-Paul. 2006. “Macroeconomic Policies and Institutions,” Document de travail No. 2006-06, OFCE.
Freeman, Richard B. 2000. “Single peaked vs. diversified capitalism: The relation between economic institutions and outcomes.” Working Paper 7556 (February), National Bureau of Economic Research.
Gallie, D. and S. Alm. 1997. “Unemployment, Gender and Attitudes to Work in the European Union,” paper presented to the ESA Conference, University of Essex, August 26-30.
Hall, Peter A. and David Soskice, eds. 2001. Varieties of Capitalism: The Institutional Foundations of Comparative Advantage, (Oxford University Press).
Hammer, T. 1999. “The Influence of Different Compensation Levels of Unemployment Benefits on Job Chances Among Unemployed Youth: A Comparative Study of the Nordiic Countries,” Acta Sociologica 42: 123-34.
Heckman, James J. 2003. Flexibility and Job Creation: Lessons from Germany. In Knowledge, Information, and Expectations in Modern Macroeconomics: In Honor of Edmund S. Phelps, ed. Philippe Aghion, Roman Frydman, Joseph Stiglitz, and Michael Woodford, 357-93 (Princeton: Princeton University Press).
Henry, S. G. B. 2004. “Unemployment in the UK: Assessing the Roles of Shocks and Institutions,” manuscript, Oxford University (May).
Henry, S. G. B. and J. Nixon. 2000. “Unemployment Dynamics in the UK,” Oxford Economic Papers 52, pp. 224-47.
Hernanz, Virginia, Franck Malherbet and Michele Pellizzari. 2004. “Take-up of Welfare Benefits in OECD Countries: A Review of the Evidence,” OECD Social, Employment and Migration Working Papers No. 17, (March).
Holmlund, Bertil. 1998. “Unemployment Insurance in Theory and Practice,” Scandinavian Journal of Economics 100 (1), pp 143-45.
Howell, David R., ed. 2005. Fighting Unemployment: The Limits of Free Market Orthodoxy (Oxford University Press).
International Monetary Fund (IMF). 2003. Unemployment and Labor Market Institutions: Why Reforms Pay Off. Chapter IV in World Economic Outlook (May?). Washington, DC: IMF.
Korpi, Walter. 2002. “The Great Trough in Unemployment: A Long Term View of Unemployment, Inflation, Strikes and the Profit/Wage Ratio,” Politics & Society, Vol 30, no. 3 (September), pp. 365-426.
Lalive, Rafael and Josef Zweimuller. 2003. “Benefit entitlement and unemployment duration: The role of policy endogeneity,” Journal of Public Economics 88, pp. 2587-2616.
Layard, Richard, Stephen Nickell and Richard Jackman. 1991. Unemployment:

54
Marcroeconomic Performance and the Labour Market (Oxford: Oxford University Press).
Layard, Richard, Stephen Nickell and Richard Jackman. 1994. The Unemployment Crisis, (Oxford: Oxford University Press).
Lazear, E. P. 1990. “Job Security Provisions and Employment,” Quarterly Review of Economics, vol 105, pp. 699-726. Levy, Jonah D. 2000. France: Directing Adjustment? In Welfare and Work in the Open
Economy, Vol. II: Diverse Responses to Common Challenges, ed. Fritz W. Scharpf and Vivien A. Schmidt, 308-350. Oxford: Oxford University Press.
Ljungqvist, L. and T. J. Sargent. 1998. “The European Unemployment Dilemma,” Journal of Political Economy, vol 106 (3), pp. 514-50.
Manning, Alan. 1998. “Comment on B. Holmlund, ‘Unemployment Insurance in Theory and Practice’”. Scandinavian Journal of Economics 100 (1), pp 143-45.
Martin, Gary. 2000. “Employment and Unemployment in Mexico in the 1990s,” Monthly Labor Review, November.
Nickell, Stephen. 1988. ‘The NAIRU: some theory and statistical facts,” in Cross, ed., Unemployment, Hysteresis and the Natural Rate Hypothesis (Oxford: Oxford University Press).
Nickell, Stephen. 1997. “Unemployment and Labor Market Rigidities: Europe versus North America,” Journal of Economic Perspectives, Summer, Vol. 11, No. 3, pp. 55-74.
Nickell, Stephen. 1998. “Unemployment: Questions and Some Answers,” The Economic Journal 108 (May), pp. 802-816.
Nickell, Stephen. 2003. “Labour Market Institutions and Unemployment in OECD Countries,” CESifo DICE Report 2/2003.
Nickell, S. and B. Bell. 1995. “The collapse in demand for the unskilled and unemployment across the OECD,” Oxford Review of Economic Policy, vol. 11 (1),
pp. 40-62. Nickell, Stephen, and Richard Layard. 1997. “Labour market institutions and economic
performance.” Discussion paper, Centre for Economic Performance, University of Oxford.
Nickell, Stephen, Luca Nunziata, Wolfgang Ochel, and Glenda Quintini. 2003. “The Beveridge Curve, Unemployment, and Wages in the OECD from the 1960s to the 1990s.” In Knowledge, Information, and Expectations in Modern Macroeconomics: In Honor of Edmund S. Phelps, ed. Philippe Aghion, Roman Frydman, Joseph Stiglitz, and Michael Woodford (Princeton University Press).
Nickell, Stephen, Luca Nunziata and W. Ochel. 2005. “Unemployment in the OECD Since the 1960s. What do We Know.” The Economic Journal, vol 115 no. 500, pp. 1-27.
OECD 1994. OECD Jobs Study (Paris: OECD). OECD. 1997. OECD Employment Outlook (Paris). OECD. 1999. OECD Employment Outlook (Paris). OECD. 1999b. “Implementing the OECD Jobs Strategy: Assessing Performance and
Policy” (Paris: OECD). OECD. 2002. OECD Employment Outlook (Paris). OECD. 2004a. OECD Employment Outlook (Paris). OECD. 2004b. Benefits and Wages (Paris).

55
OECD. 2005a. OECD Employment Outlook (Paris). OECD. 2005b. OECD Economic Survey of France (Paris). OECD. 2005c. OECD Economic Survey of The Netherlands (Paris). OECD. 2006a. OECD Employment Outlook (Paris). OECD. 2006b. Political Economy of Structural Reform, Working Paper No. 1 on
Macroeconomicand Structural Policy Analysis (March). Pollmann-Schult, Mathias and Felix Buchel. 2005. “Unemployment Benefits,
Unemployment Duration, and Subsequent Job Quality,” Acta Sociologica 48 (1), pp. 21-39.
Roed, K. and T. Zhang. 2003. “Does Unemployment Compensation Affect Unemployment Duration?,” Economic Journal 113, pp. 190-206.
Russell, Helen and Phillip J. O’Connell.2001. “Getting a Job in Europe: The Transition from Unemployment to Work among Young People in Nine European Countries,” Work, Employment & Society vol. 15, no. 1, pp. 1-24.
St. Paul, Gilles (2004), “Why are European Countries Diverging in their Unemployment Experience?,” Journal of Economic Perspectives, vol. 18, no. 4 (fall), pp. 49-68.
Scarpetta, S. 1996. “Assessing the role of labor market policies and institutional settings on unemployment: a cross country study,” OECD Economic Studies, vol 26, pp. 43-98.
Schmitt, John and Jonathan Wadsworth. 2005. “Is the OECD Jobs Strategy Behind U.S. and British Employment and Unemployment Success in the 1990s?,” Chapter 5 of Howell, ed. Fighting Unemployment: The Limits of Free Market Orthodoxy (Oxford University Press).
Siebert, Horst. 1997. Labor market rigidities: At the root of unemployment in Europe. Journal of Economic Perspectives 11, no. 3 (Summer): 37-54.
Sorrentino, Constance. 2000. “International Unemployment Rates: How Comparable are They?,” Monthly Labor Review, June.
Strom, Steiner. 1998. “Comment on B. Holmlund, ‘Unemployment Insurance in Theory and Practice’”. Scandinavian Journal of Economics 100 (1), pp 146-52.
van Ours, Jan C. 2003. “Has the Dutch Miracle Come to an End?,” CentER Discussion Paper No. 2003-32, Tilberg University (March).
van Ours, Jan C. and Milan Vodopivec. 2005. “How Changes in Benefits Entitlement Affect the Duration of Unemployment,” CentER Discussion Paper No. 2005-30, Tilberg University (February).

56
Figure 1: Standardized Unemployment Rates for 19 OECD Countries, 1960-2005
AUS
AUS
AUS
AUS
AUSAUS
AUS
AUSAUS
AUS
AUT
AUTAUT
AUTAUTAUT
AUT
AUT
AUTAUT
BEL BEL BEL
BEL
BEL BEL
BEL
BEL
BEL
BEL
CAN
CAN
CAN
CAN
CAN
CAN
CAN
CAN
CAN
CANDENDEN
DEN
DEN
DEN
DEN
DEN
DENDENDEN
FIN
FINFIN
FIN
FIN
FIN
FIN
FIN
FIN
FIN
FRAFRA
FRA
FRA
FRA
FRAFRA
FRA
FRAFRA
GER GER GER
GER
GER
GER GER
GERGER
GER
IRE IRE
IRE
IRE
IREIRE
IRE
IRE
IRE
IRE
ITA
ITA ITAITA
ITA
ITAITA
ITA
ITA
ITA
JPNJPN
JPN
JPNJPNJPNJPN
JPNJPNJPN
NL
NL
NL
NL
NLNL
NL
NL
NLNL
NZL
NZL
NZL
NZL
NZL
NZL
NZL
NZLNZLNZL
NOR
NORNOR
NOR
NORNOR
NORNORNOR
NOR
POR
POR
POR
POR
POR
POR
POR
SPA
SPA
SPASPA
SPA
SPA
SPA
SPASPASPA
SWE
SWE
SWE
SWE
SWE
SWE
SWESWE
SWESWESUI
UK UK
UK
UK
UKUK
UK
UK
UKUK
USAUSAUSA
USAUSA
USA
USA
USA
USA
USA
0
2
4
6
8
10
12
14
16
18
20
60-64 65-69 70-74 75-79 80-84 85-89 90-94 95-99 2000_04 2005
Perc
ent
U.S. Rate
US (%) 5.5 3.7 5.3 6.9 8.3 6.2 6.6 4.9 5.2 5.1
Median 2.2 1.9 2.4 5.1 7.6 7.3 8.8 7.9 5.3 5.2
Std. dev. 1.60 1.22 1.62 2.20 3.35 4.47 3.94 3.93 2.27 1.96 Sources: 5-year unemployment rates, 1960-99: Baker et. al., Appendix 2. Unemployment 2000-04: OECD Employment Outlook, July 2005, Statistical Annex. Unemployment 2005: OECD online (www.oecd.org). Medians/standard deviations: author’s calculations.

57
Figure 2: Net Unemployment Benefit Replacement Rates and Unemployment for 20 OECD Countries, 2002
y = -0.05x + 9.3R2 = 0.161
0
2
4
6
8
10
12
0 10 20 30 40 50 60 70 80 90
net replacement rate
unem
ploy
men
t rat
e
Spain
Italy
US
Finland
Australia
CanadaBelgium
SWZNL
France Germany
JapanPortugalNZUK
AustriaDenmarkIrelandNorwaySweden
Sources: replacement rates: OECD Benefits and Wages 2004, table 3.3b (overall average net replacement rates over 60 months of unemployment); unemployment rates: OECD standardized rates.
Figure 3: Unemployment Benefit Duration and Unemployment for 20 OECD Countries, 2001
y = -2.57x + 7.99R2 = 0.143
0.00
2.00
4.00
6.00
8.00
10.00
12.00
0.00 0.20 0.40 0.60 0.80 1.00 1.20 1.40 1.60
benefit duration index
unem
ploy
men
t rat
e
Italy
Ireland
US
Spain
Canada
Portugal
FranceFinland
Germany
BelgiumAustralia
Norway SWZ
NL
Austria
Denmark
UKJapan
Sweden NZ
Duration is measured as the ratio of the net replacement rate for the 60th to the rate for the “initial period” (1st month), for single earner married couple without children, at 100% of the average production worker wage (OECD 2004, table 3.1a and table 3.2a).
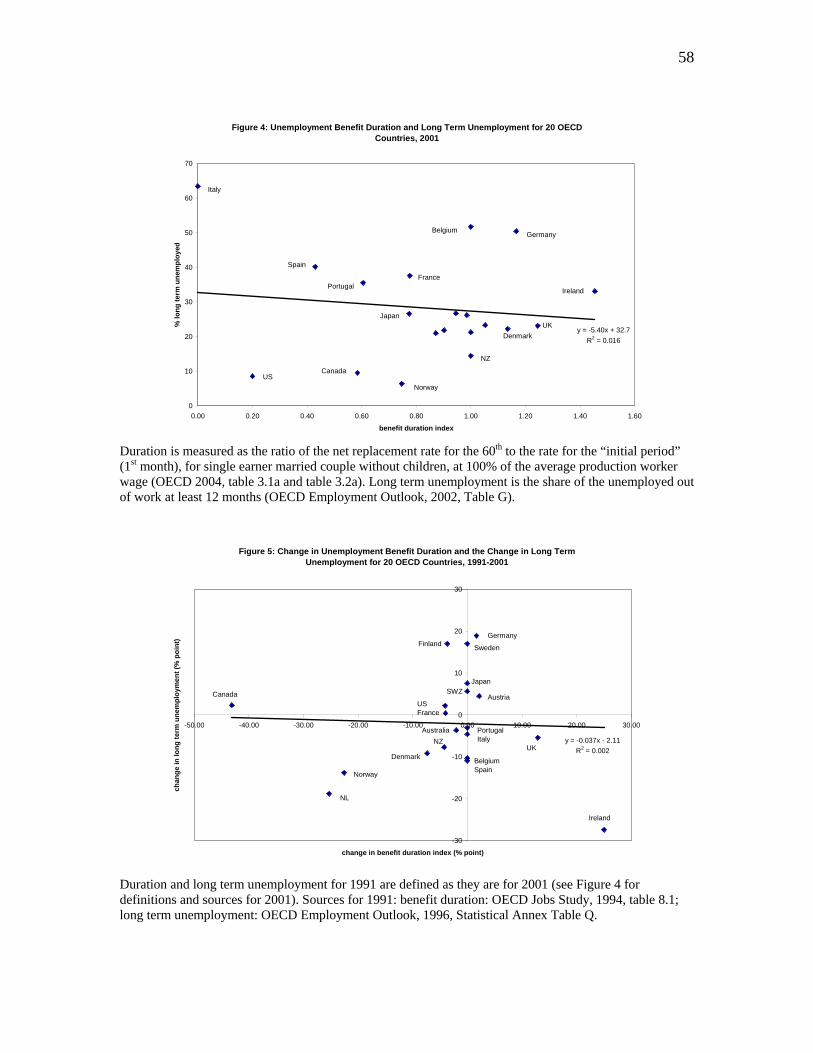
58
Figure 4: Unemployment Benefit Duration and Long Term Unemployment for 20 OECD Countries, 2001
y = -5.40x + 32.7R2 = 0.016
0
10
20
30
40
50
60
70
0.00 0.20 0.40 0.60 0.80 1.00 1.20 1.40 1.60
benefit duration index
% lo
ng te
rm u
nem
ploy
ed
Italy
Spain
US
Portugal
Canada
Norway
Japan
France
NZ
Belgium Germany
Ireland
UKDenmark
Duration is measured as the ratio of the net replacement rate for the 60th to the rate for the “initial period” (1st month), for single earner married couple without children, at 100% of the average production worker wage (OECD 2004, table 3.1a and table 3.2a). Long term unemployment is the share of the unemployed out of work at least 12 months (OECD Employment Outlook, 2002, Table G).
Figure 5: Change in Unemployment Benefit Duration and the Change in Long Term Unemployment for 20 OECD Countries, 1991-2001
y = -0.037x - 2.11R2 = 0.002
-30
-20
-10
0
10
20
30
-50.00 -40.00 -30.00 -20.00 -10.00 0.00 10.00 20.00 30.00
change in benefit duration index (% point)
chan
ge in
long
term
une
mpl
oym
ent (
% p
oint
)
Ireland
Canada
NL
Norway
UK
Finland Sweden
Germany
Denmark
NZ
Japan
AustriaSWZ
USFrance
BelgiumSpain
PortugalItaly
Australia
Duration and long term unemployment for 1991 are defined as they are for 2001 (see Figure 4 for definitions and sources for 2001). Sources for 1991: benefit duration: OECD Jobs Study, 1994, table 8.1; long term unemployment: OECD Employment Outlook, 1996, Statistical Annex Table Q.
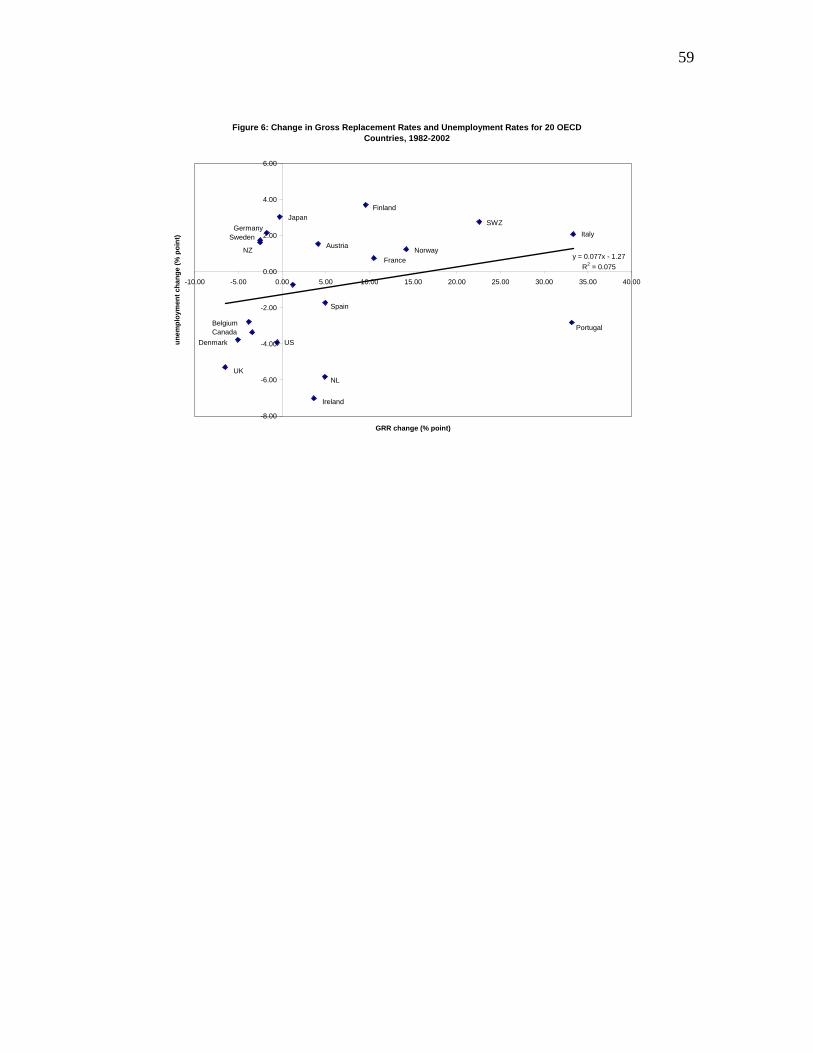
59
Figure 6: Change in Gross Replacement Rates and Unemployment Rates for 20 OECD Countries, 1982-2002
y = 0.077x - 1.27R2 = 0.075
-8.00
-6.00
-4.00
-2.00
0.00
2.00
4.00
6.00
-10.00 -5.00 0.00 5.00 10.00 15.00 20.00 25.00 30.00 35.00 40.00
GRR change (% point)
unem
ploy
men
t cha
nge
(% p
oint
) Italy
Portugal
SWZ
Norway
Finland
France
Austria
Spain
NL
Ireland
US
UK
Denmark
BelgiumCanada
JapanGermany
Sweden
NZ
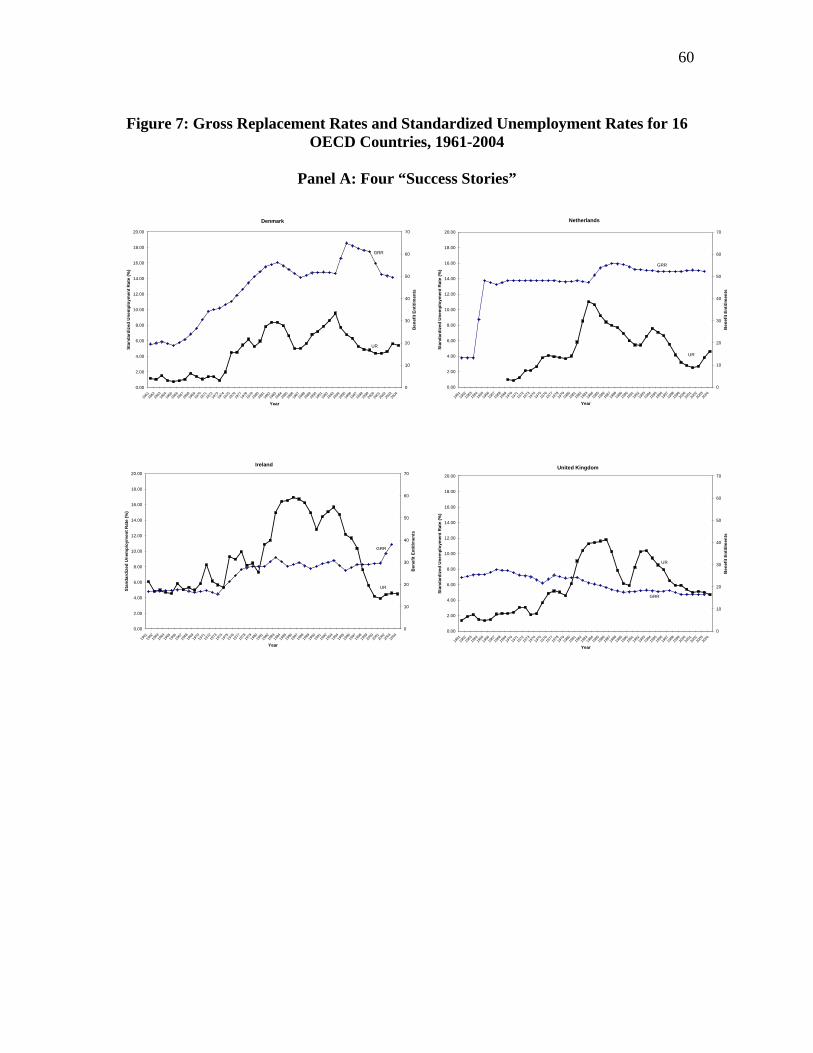
60
Figure 7: Gross Replacement Rates and Standardized Unemployment Rates for 16
OECD Countries, 1961-2004
Panel A: Four “Success Stories”
Denmark
0.00
2.00
4.00
6.00
8.00
10.00
12.00
14.00
16.00
18.00
20.00
1961
1962
1963
1964
1965
1966
1967
1968
1969
1970
1971
1972
1973
1974
1975
1976
1977
1978
1979
1980
1981
1982
1983
1984
1985
1986
1987
1988
1989
1990
1991
1992
1993
1994
1995
1996
1997
1998
1999
2000
2001
2002
2003
2004
Year
Stan
dard
ized
Une
mpl
oym
ent R
ate
(%)
0
10
20
30
40
50
60
70
Ben
efit
Entit
lmen
ts
UR
GRR
Ireland
0.00
2.00
4.00
6.00
8.00
10.00
12.00
14.00
16.00
18.00
20.00
1961
1962
1963
1964
1965
1966
1967
1968
1969
1970
1971
1972
1973
1974
1975
1976
1977
1978
1979
1980
1981
1982
1983
1984
1985
1986
1987
1988
1989
1990
1991
1992
1993
1994
1995
1996
1997
1998
1999
2000
2001
2002
2003
2004
Year
Stan
dard
ized
Une
mpl
oym
ent R
ate
(%)
0
10
20
30
40
50
60
70
Ben
efit
Entit
lmen
ts
GRR
UR
Netherlands
0.00
2.00
4.00
6.00
8.00
10.00
12.00
14.00
16.00
18.00
20.00
1961
1962
1963
1964
1965
1966
1967
1968
1969
1970
1971
1972
1973
1974
1975
1976
1977
1978
1979
1980
1981
1982
1983
1984
1985
1986
1987
1988
1989
1990
1991
1992
1993
1994
1995
1996
1997
1998
1999
2000
2001
2002
2003
2004
Year
Stan
dard
ized
Une
mpl
oym
ent R
ate
(%)
0
10
20
30
40
50
60
70
Ben
efit
Entit
lmen
ts
GRR
UR
United Kingdom
0.00
2.00
4.00
6.00
8.00
10.00
12.00
14.00
16.00
18.00
20.00
1961
1962
1963
1964
1965
1966
1967
1968
1969
1970
1971
1972
1973
1974
1975
1976
1977
1978
1979
1980
1981
1982
1983
1984
1985
1986
1987
1988
1989
1990
1991
1992
1993
1994
1995
1996
1997
1998
1999
2000
2001
2002
2003
2004
Year
Stan
dard
ized
Une
mpl
oym
ent R
ate
(%)
0
10
20
30
40
50
60
70
Ben
efit
Entit
lmen
ts
UR
GRR
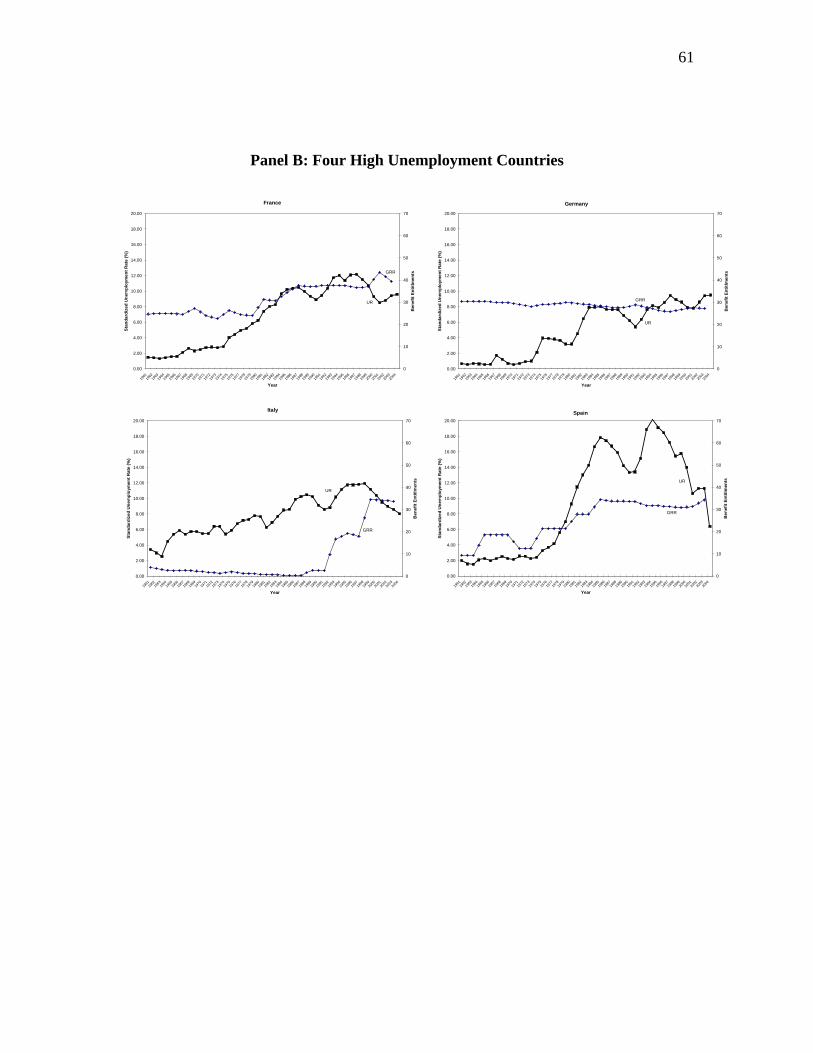
61
Panel B: Four High Unemployment Countries
France
0.00
2.00
4.00
6.00
8.00
10.00
12.00
14.00
16.00
18.00
20.00
1961
1962
1963
1964
1965
1966
1967
1968
1969
1970
1971
1972
1973
1974
1975
1976
1977
1978
1979
1980
1981
1982
1983
1984
1985
1986
1987
1988
1989
1990
1991
1992
1993
1994
1995
1996
1997
1998
1999
2000
2001
2002
2003
2004
Year
Stan
dard
ized
Une
mpl
oym
ent R
ate
(%)
0
10
20
30
40
50
60
70
Ben
efit
Entit
lmen
ts
UR
GRR
Italy
0.00
2.00
4.00
6.00
8.00
10.00
12.00
14.00
16.00
18.00
20.00
1961
1962
1963
1964
1965
1966
1967
1968
1969
1970
1971
1972
1973
1974
1975
1976
1977
1978
1979
1980
1981
1982
1983
1984
1985
1986
1987
1988
1989
1990
1991
1992
1993
1994
1995
1996
1997
1998
1999
2000
2001
2002
2003
2004
Year
Stan
dard
ized
Une
mpl
oym
ent R
ate
(%)
0
10
20
30
40
50
60
70B
enef
it En
titlm
ents
GRR
UR
Germany
0.00
2.00
4.00
6.00
8.00
10.00
12.00
14.00
16.00
18.00
20.00
1961
1962
1963
1964
1965
1966
1967
1968
1969
1970
1971
1972
1973
1974
1975
1976
1977
1978
1979
1980
1981
1982
1983
1984
1985
1986
1987
1988
1989
1990
1991
1992
1993
1994
1995
1996
1997
1998
1999
2000
2001
2002
2003
2004
Year
Stan
dard
ized
Une
mpl
oym
ent R
ate
(%)
0
10
20
30
40
50
60
70
Ben
efit
Entit
lmen
ts
UR
GRR
Spain
0.00
2.00
4.00
6.00
8.00
10.00
12.00
14.00
16.00
18.00
20.00
1961
1962
1963
1964
1965
1966
1967
1968
1969
1970
1971
1972
1973
1974
1975
1976
1977
1978
1979
1980
1981
1982
1983
1984
1985
1986
1987
1988
1989
1990
1991
1992
1993
1994
1995
1996
1997
1998
1999
2000
2001
2002
2003
2004
Year
Stan
dard
ized
Une
mpl
oym
ent R
ate
(%)
0
10
20
30
40
50
60
70
Ben
efit
Entit
lmen
tsUR
GRR
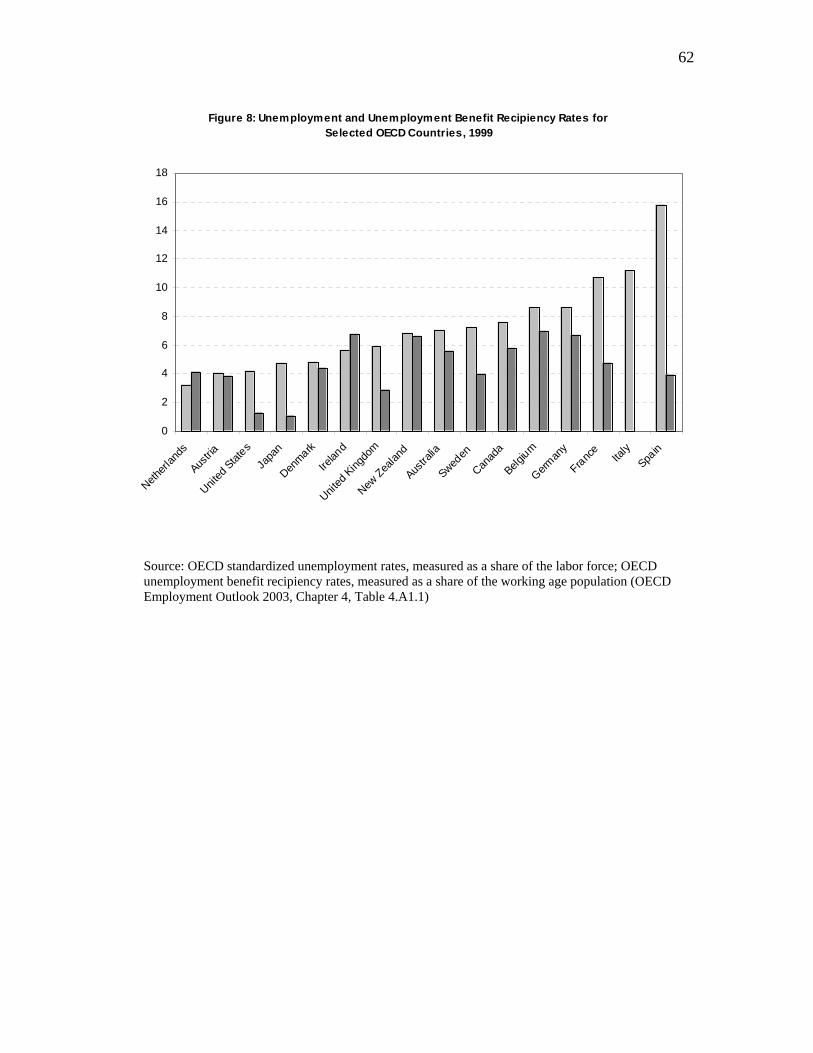
62
Figure 8: Unemployment and Unemployment Benefit Recipiency Rates for Selected OECD Countries, 1999
0
2
4
6
8
10
12
14
16
18
Netherl
ands
Austria
United
States
Japa
n
Denmark
Irelan
d
United
Kingdo
m
New Zea
land
Austra
lia
Sweden
Canad
a
Belgium
German
y
France
Italy
Spain
Source: OECD standardized unemployment rates, measured as a share of the labor force; OECD unemployment benefit recipiency rates, measured as a share of the working age population (OECD Employment Outlook 2003, Chapter 4, Table 4.A1.1)
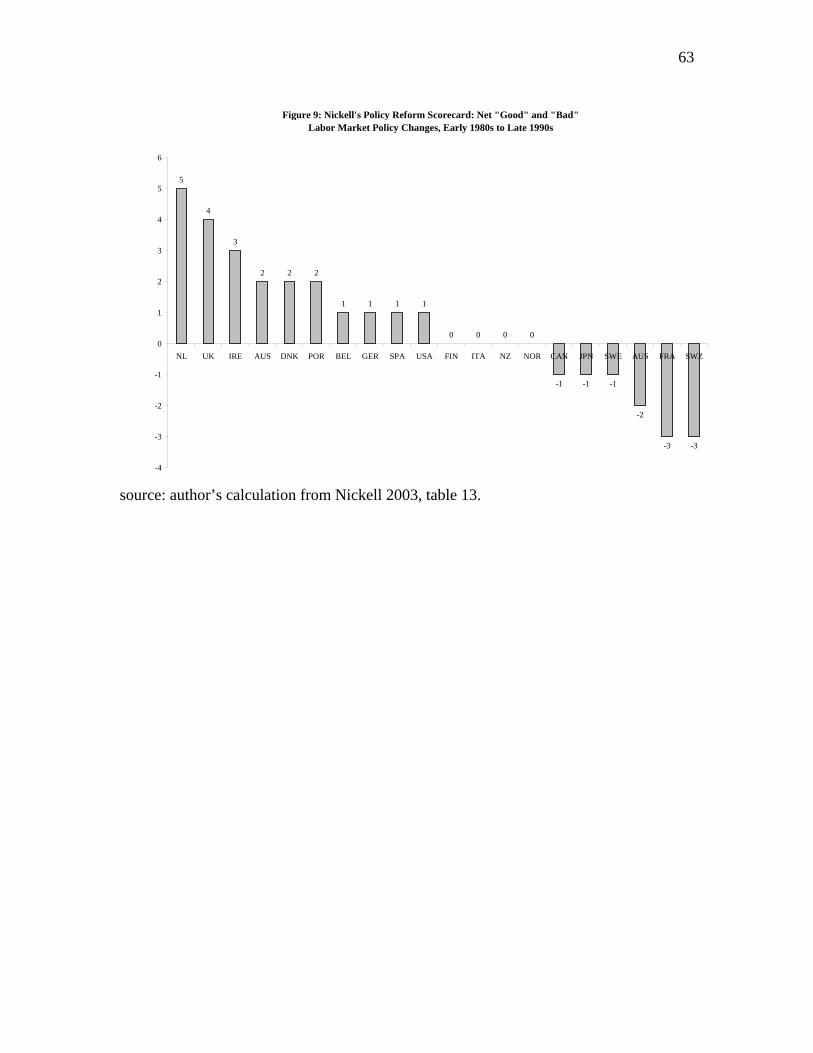
63
Figure 9: Nickell's Policy Reform Scorecard: Net "Good" and "Bad" Labor Market Policy Changes, Early 1980s to Late 1990s
5
4
3
2 2 2
1 1 1 1
0 0 0 0
-1 -1 -1
-2
-3 -3
-4
-3
-2
-1
0
1
2
3
4
5
6
NL UK IRE AUS DNK POR BEL GER SPA USA FIN ITA NZ NOR CAN JPN SWE AUS FRA SWZ
source: author’s calculation from Nickell 2003, table 13.
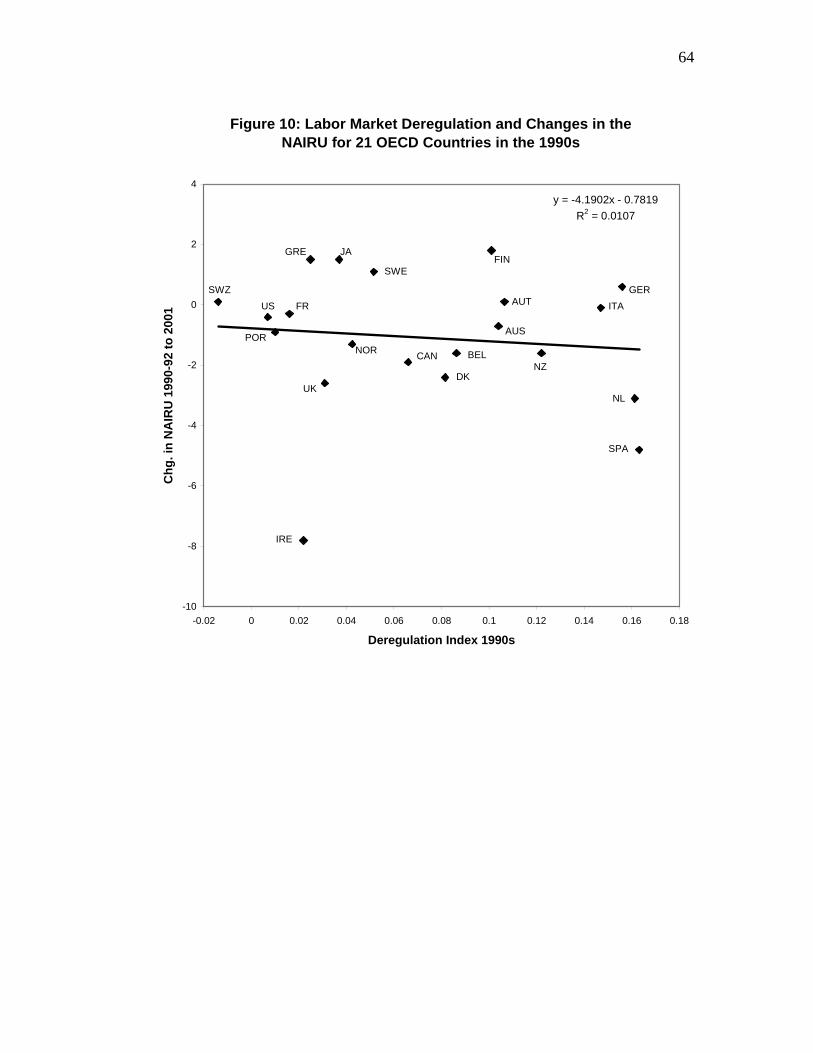
64
Figure 10: Labor Market Deregulation and Changes in the NAIRU for 21 OECD Countries in the 1990s
y = -4.1902x - 0.7819R2 = 0.0107
-10
-8
-6
-4
-2
0
2
4
-0.02 0 0.02 0.04 0.06 0.08 0.1 0.12 0.14 0.16 0.18
Deregulation Index 1990s
Chg
. in
NA
IRU
199
0-92
to 2
001
IRE
UK
POR
FRSWZ
US
FIN
SPA
NL
ITAGER
AUT
AUS
NZBEL
DK
CAN
SWE
NOR
JAGRE

65
Figure 11
Estimated effect of UB, EPL, and UDCorrelation: 0.355
O
bser
ved
chan
ge in
une
mpl
oym
ent
Predicted change in unemployment-10 -8 -6 -4 -2 0 2 4
-10
-8
-6
-4
-2
0
2
4
AUS
AUT
BELCAN
CHE
DEU_2
DEU_1
DNKESPFIN_1
FIN_2
FRA
GBRIRL
ITAJAP
NLD
NORNZL
PRTSWE_2
SWE_1
USA

66
Table 1: Standardized Unemployment Rates by Gender and Age, 2003
MALE FEMALE 15-24 25-54 15-24 25-54
Liberal OECD Countries
US 12.9 4.6 11 4.6 Australia 12.2 3.9 11.1 4.3 Canada 14.9 6.1 11.8 5.9 Ireland 8.7 4.5 7.4 3.1 New Zealand 8.7 2.5 10.1 3.3 UK 11.8 3.8 9.9 3.4 Average 11.5 4.2 10.2 4.1
High Unemployment European Countries
Belgium 15.8 6 19.5 7.4 Finland 22.2 7 19.4 7.6 France 20.8 7.4 22 9.8 Germany 13.3 9.8 9.7 9 Italy 20.7 5.2 27.2 9.2 Spain 18.7 6.9 26.4 13.8 Average 18.6 7.1 20.7 9.5 Lower Unemployment European Countries
Austria 11.3 4.3 10.7 4.4 Denmark 8.5 4.4 7.1 5.1 Netherlands 7.9 3.7 8.1 4.4 Norway 12.6 4.3 10.7 3.3 Sweden 17.8 5.7 16.1 5.2 Switzerland 8 3.5 7.3 4.6 Average 11.0 4.3 10 4.5
Source: OECD, 2005: Statistical Appendix, Table C.

67
Table 2: Measures of Employment Performance, Social Protection and Collective
Bargaining for 18 OECD Member Countries Six Liberal
OECD Countries
Six High Unemployment
European Countries
Six Low Unemployment
European Countries
Employment Outcomes: 1. Unemployment Rate 2004 (%) 5.2 9.1 5.0 2. Employment Rate 2004 (%) 70.8 62.6 73.7 3. Employment Rate <HS 2004 (%) 59.4 56.0 63.9 Labor Market Institutions: 4. Employment Protection Legislation 2003 (Index)
1.2 2.6 2.2
5. Unemployment Benefits – Net Replacement Rate 2002 (%)
52 72 77
6. Trade Union Density 2000 (% of employees)
26 36 47
7. Collective Bargaining Coverage 2000 (% of employees)
36 83 76
8. Co-ordination of Bargaining 2000 (index)
1.7 3.8 3.9
9. Active Labor Market Policy Spending YEAR? (% of GDP)
0.5 1.0 1.2
Other: 10. Tax Revenue Share 2004 (% GDP)
32 41 43
11. Wage Inequality 2000 (50/10 ratio)
1.9 1.6 1.5
12. < HS in population 2004 (%) 27 38 23 Data are mean values for country groups. Liberal OECD Economies: Australia, Canada, Ireland,New Zealand, UK, USA High unemployment Europe: Belgium, Finland, France,Germany,Italy,Spain Low unemployment Europe: Austria, Denmark, Netherlands, Norway, Switzerland, Sweden. Rows 1-3, 12: OECD Employment Outlook 2005 tables A and B Row 4: OECD Benefits and Wages 2004 Table 3.1.b Row 5: OECD Employment Outlook 2004 Table 2 A2.4 (calculated as average of benefits when unemployed after-tax to after-tax earnings and benefits in work for the average of 4 family types and 2 wage levels) Rows 6-8: OECD Employment Outlook 2004 Tables 3.3, 3.5 Row 9: OECD Earnings Dispersion Database Row 10: OECD Revenue Statistics 1965-2004 Table 8 Row 11: OECD Employment Outlook 2005 Table 8 Row 12: OECD Employment Outlook 2005 table D
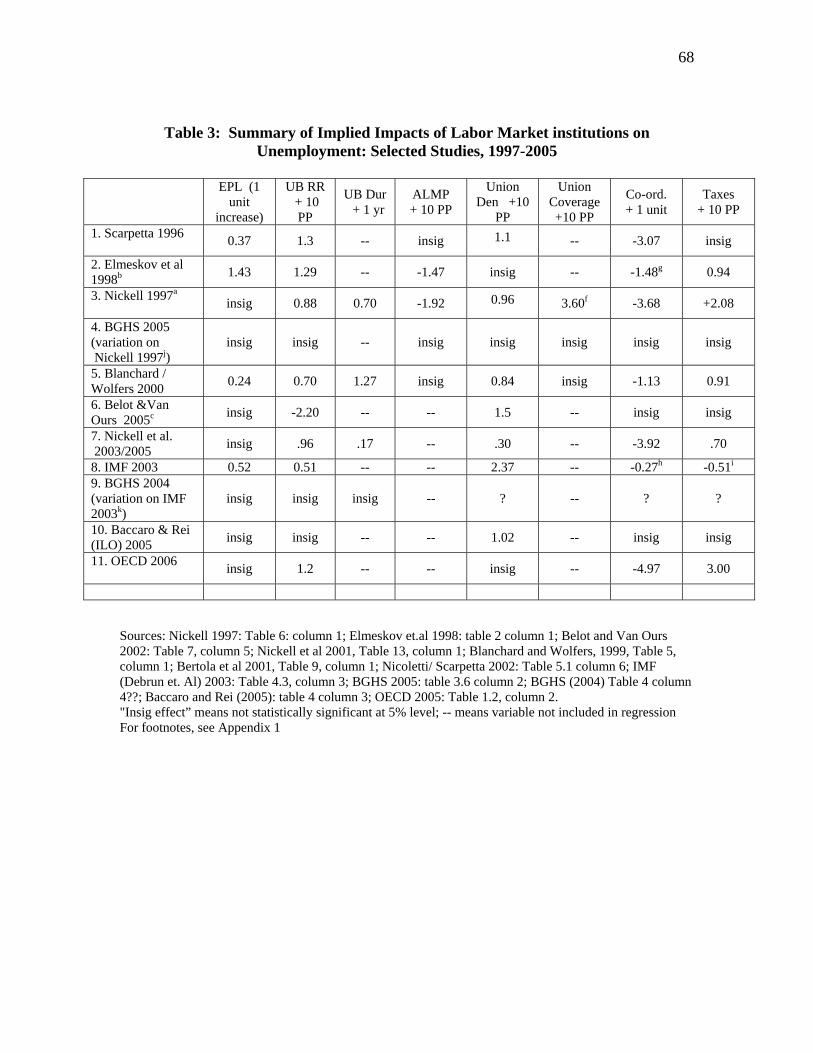
68
Table 3: Summary of Implied Impacts of Labor Market institutions on Unemployment: Selected Studies, 1997-2005
EPL (1
unit increase)
UB RR + 10 PP
UB Dur + 1 yr
ALMP + 10 PP
Union Den +10
PP
Union Coverage +10 PP
Co-ord. + 1 unit
Taxes + 10 PP
1. Scarpetta 1996 0.37 1.3 -- insig 1.1 -- -3.07 insig
2. Elmeskov et al 1998b 1.43 1.29 -- -1.47 insig -- -1.48g 0.94
3. Nickell 1997a
insig 0.88 0.70 -1.92 0.96 3.60f -3.68 +2.08
4. BGHS 2005 (variation on Nickell 1997j)
insig insig -- insig insig insig insig insig
5. Blanchard / Wolfers 2000 0.24 0.70 1.27 insig 0.84 insig -1.13 0.91
6. Belot &Van Ours 2005c insig -2.20 -- -- 1.5 -- insig insig
7. Nickell et al. 2003/2005 insig .96 .17 -- .30 -- -3.92 .70
8. IMF 2003 0.52 0.51 -- -- 2.37 -- -0.27h -0.51i
9. BGHS 2004 (variation on IMF 2003k)
insig insig insig -- ? -- ? ?
10. Baccaro & Rei (ILO) 2005 insig insig -- -- 1.02 -- insig insig
11. OECD 2006 insig 1.2 -- -- insig -- -4.97 3.00
Sources: Nickell 1997: Table 6: column 1; Elmeskov et.al 1998: table 2 column 1; Belot and Van Ours 2002: Table 7, column 5; Nickell et al 2001, Table 13, column 1; Blanchard and Wolfers, 1999, Table 5, column 1; Bertola et al 2001, Table 9, column 1; Nicoletti/ Scarpetta 2002: Table 5.1 column 6; IMF (Debrun et. Al) 2003: Table 4.3, column 3; BGHS 2005: table 3.6 column 2; BGHS (2004) Table 4 column 4??; Baccaro and Rei (2005): table 4 column 3; OECD 2005: Table 1.2, column 2. "Insig effect” means not statistically significant at 5% level; -- means variable not included in regression For footnotes, see Appendix 1
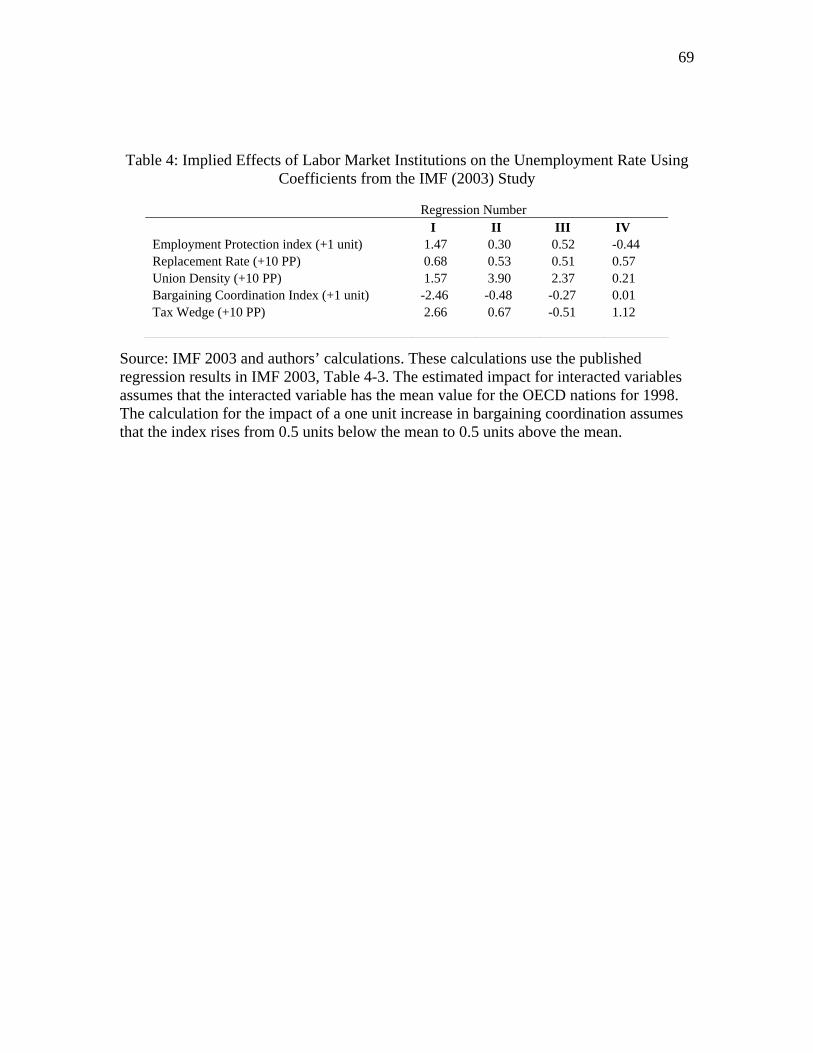
69
Table 4: Implied Effects of Labor Market Institutions on the Unemployment Rate Using Coefficients from the IMF (2003) Study
Source: IMF 2003 and authors’ calculations. These calculations use the published regression results in IMF 2003, Table 4-3. The estimated impact for interacted variables assumes that the interacted variable has the mean value for the OECD nations for 1998. The calculation for the impact of a one unit increase in bargaining coordination assumes that the index rises from 0.5 units below the mean to 0.5 units above the mean.
Regression Number I II III IV Employment Protection index (+1 unit) 1.47 0.30 0.52 -0.44 Replacement Rate (+10 PP) 0.68 0.53 0.51 0.57 Union Density (+10 PP) 1.57 3.90 2.37 0.21 Bargaining Coordination Index (+1 unit) -2.46 -0.48 -0.27 0.01 Tax Wedge (+10 PP) 2.66 0.67 -0.51 1.12
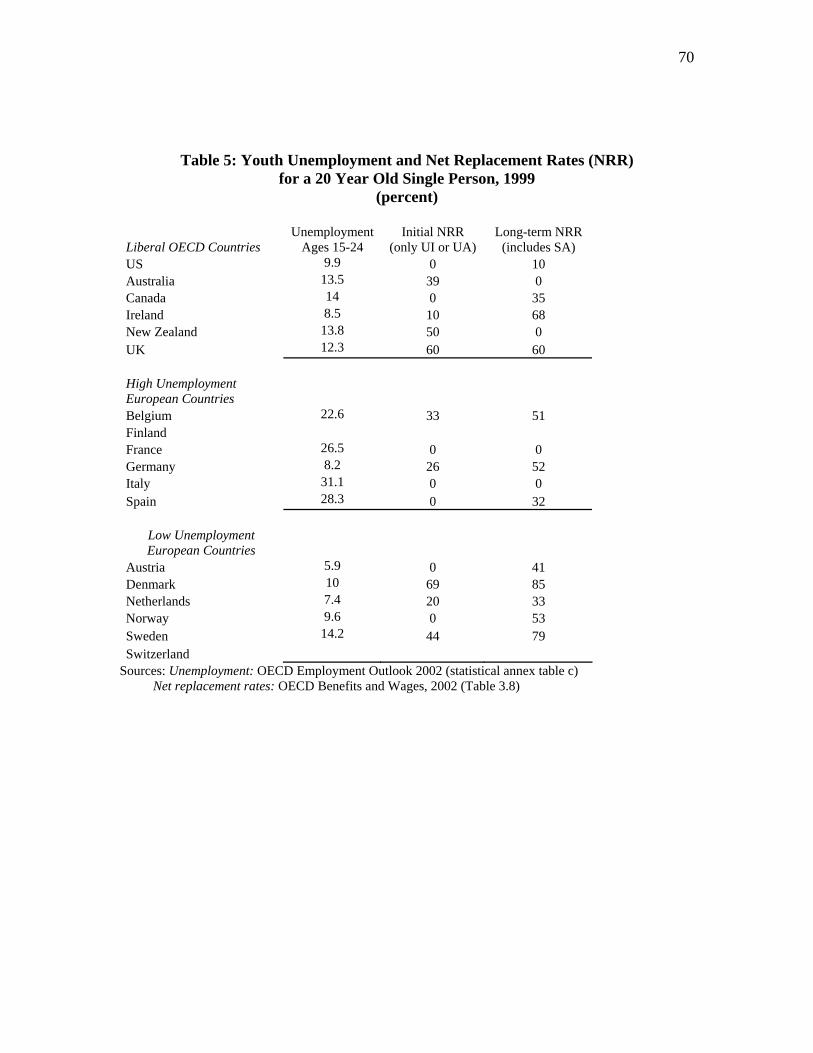
70
Table 5: Youth Unemployment and Net Replacement Rates (NRR) for a 20 Year Old Single Person, 1999
(percent)
Liberal OECD Countries Unemployment
Ages 15-24 Initial NRR
(only UI or UA) Long-term NRR
(includes SA) US 9.9 0 10 Australia 13.5 39 0 Canada 14 0 35 Ireland 8.5 10 68 New Zealand 13.8 50 0 UK 12.3 60 60 High Unemployment European Countries
Belgium 22.6 33 51 Finland France 26.5 0 0 Germany 8.2 26 52 Italy 31.1 0 0 Spain 28.3 0 32
Low Unemployment European Countries
Austria 5.9 0 41 Denmark 10 69 85 Netherlands 7.4 20 33 Norway 9.6 0 53 Sweden 14.2 44 79 Switzerland
Sources: Unemployment: OECD Employment Outlook 2002 (statistical annex table c) Net replacement rates: OECD Benefits and Wages, 2002 (Table 3.8)

71
TABLE 6 Granger-Causality Tests, Gross Replacement Rate and Unemployment Rate, 1962-2004 (F-tests) Unemployment Rate to Gross Replacement Rate Gross Replacement Rate to Unemployment Rate Lags 1 2 3 4 1 2 3 4 Australia 1.32 3.62 * 2.54 # 1.48 0.78 1.39 3.03 * 2.72 * Austria 1.48 2.37 0.62 0.87 1.78 2.06 1.30 1.37 Belgium 0.12 0.88 0.59 0.57 4.40 * 2.00 1.92 1.70 Canada 0.04 1.51 1.06 0.66 4.02 # 3.22 # 2.03 1.82 Denmark 6.67 * 3.10 # 2.14 2.17 # 0.18 1.35 1.81 1.50 Finland 1.62 0.08 0.76 0.66 3.50 # 3.49 * 1.52 1.32 France 6.48 * 7.86 ** 2.91 * 2.56 # 0.60 0.57 0.23 0.65 Germany 1.53 2.24 1.10 1.01 0.05 0.37 0.29 1.11 Ireland 10.06 ** 2.39 2.05 1.88 0.05 0.95 2.91 * 1.80 Italy 5.22 * 1.69 2.31 # 1.72 1.48 0.52 0.39 0.64 Japan 5.46 * 3.49 * 2.56 # 4.14 0.76 0.16 0.57 0.48 New Zealand 0.01 0.10 0.09 0.14 0.06 0.91 0.56 0.36 Netherlands 18.67 ** 5.82 ** 3.57 * 2.26 # 5.98 * 0.79 1.04 0.63 Norway 0.59 0.38 1.32 0.76 5.12 * 6.09 ** 2.76 # 4.37 Portugal 6.06 * 1.63 1.50 1.86 0.24 0.34 0.35 0.27 Spain 0.87 2.13 1.46 0.79 0.66 1.97 1.18 2.11 Sweden 1.82 0.04 0.28 0.76 1.74 1.54 0.95 0.74 Switzerland 1.48 0.32 0.45 0.49 1.74 4.76 * 3.52 * 4.08 ** UK 5.79 * 3.71 * 2.52 # 1.65 0.94 0.98 0.31 0.09 US 1.97 1.17 5.35 ** 3.87 * 0.88 0.35 0.75 0.94 Notes: Authors' analysis of OECD data. In the first four columns, F-tests are distributed under the null hypothesis that the unemployment rate does not Granger-cause the gross replacement rate; in the last four columns, under the null hypothesis that the gross replacement rate does not Granger-cause the unemployment rate. Results marked ** are statistically significant at the 1% level; *, at the 5% level; and # at the 10% level. Full sample for Netherlands is 1970-2004.

72
Endnotes
1 Special thanks to Paul Swaim for data and extensive comments and advice. We also thank Bruno Amable, Tony Atkinson, Andrea Bassanini, Romain Duval, Donatella Gatti, and Bob Pollin for valuable comments. Howell thanks the Gould Foundation and CEPREMAP for support. Corresponding author is Howell ([email protected]). 2 The 1979 and 1983 figures come from an OECD-based series received from IMF researchers (IMF 2003). The recent figures are taken from the OECD Employment Outlook 2005, Statistical Annex, Table A. OECD country membership has expanded greatly since the early 1980s and our reference to “OECD-Europe” refers to 19 European countries that appear in Table A. 3 If there is a single labor market institution at the heart of the rigidity account it is the unemployment benefit system. As Bertil Holmlund (1998, p. 114) has written, “The research devoted to UI in the past couple of decades is closely intertwined with the retreat of traditional Keynesian macroeconomics and the development of theories of the natural (or equilibrium) rate of unemployment… In fact, in many simple models, the wage replacement rate provided by UI is often the only explicit exogenous variable that determines unemployment.” 4 For example, “an exogenous increase in the generosity of benefits does not seem to have been a prime factor causing the rise in unemployment” (p. 594); “As well as failing to find any link between unionization and persistence (of unemployment)…” (p. 610).
5 We thank Paul Swaim for this point. 6 We thank Paul Swaim of the OECD for making these data available to us. 7 These differences largely reflect different adjustments made to account for both the shift from registered to household data between 1982-3 and another major break in the series in 1987, but the IMF data also show a significantly lower rate for 2003. 8 In the OECD’s LFS series (OECD 2004, Appendix: Notes by Country), unemployment rates are generated from administration-based sources prior to 1984 for Germany, prior to 1983 for The Netherlands, and prior to 1986 for New Zealand. For Belgium, the entire unemployment series is based on registration data. 9 Atkinson and Mickelwright (1991) actually refer to the “duration of benefit” scores from Layard (1989), which if not the same, are quite similar: all four countries that get an “indefinite” score in the Layard data that are reproduced in Atkinson and Micklewright get the same score in Table 5 of Layard et al. (1994), which is the source for the benefits variable in the scatter plot. 10 The change in the net replacement rate comes from Chapter 3 of the OECD Employment Outlook (OECD, 2006, table 3.2). This NRR is measured as the average
73
over 60 months of unemployment. The change in NRR is from 1995-2004; the change in GRR is from 1995-2003 (the most recent available). 11 It is not clear why this second test (for just 14 countries for 1987-93) was even run, except for the sake of symmetry, since the unemployment data were available for this more recent time period. 12 We use the data set on expenditures on ALMP as a share of GDP per unemployed person, provided to us by the OECD. In the regression analysis, following Nickell (1997), we instrument the potentially endogenous ALMP variable using the average level of expenditures over the full 1985-99 period for which we have data. 13 One additional difference between Nickell (1997) and the regressions in columns one and two is that Nickell (1997) uses the log of unemployment, while we use the level (in the line with most other studies). Using the log of the unemployment rate does not change qualitatively the results in Table 6. 14 For example, the -0.078 coefficient of the country specific trend estimated for Sweden would imply a drop of almost 3.0 percentage points in Sweden’s unemployment rate after ten years. The logic of this is that the time trend variable directly decreases the unemployment rate by 0.078 percentage points each year. The lagged dependent variable means that in addition to this direct effect, the current year’s unemployment rate Ut is equal to the 0.87 times the increment added directly or indirectly due to the trend in Ut-1. The implied effect of Sweden’s time trend after twenty years would be a drop in the unemployment rate of more than 7.0 percentage points. While the absolute value of the coefficient on Sweden’s time trend is considerably larger than the average, the coefficients for most of the country time-trends are large enough to imply an increase or decrease of at least 2 percentage points in the unemployment rate after two decades. 15 In addition to using country-specific time trends, the IMF also uses country-specific terms for the inflation-unemployment trade-off. In other words, unlike prior studies, the IMF does not impose the restriction that the trade-off between inflation and unemployment is identical for all countries. The IMF also includes somewhat novel specifications for the standard set of institutional variables. Specifically, the regressions include a quadratic term for bargaining coordination. This allows for the possibility that the effect of bargaining coordination on unemployment may not be linear. It also includes (like Nickell et al.) a lagged dependent variable. However, the IMF also separately includes interaction terms for the lagged unemployment rate multiplied by the benefit replacement rate and the lagged unemployment rate multiplied with the bargaining coordination level. In principle, these additional variables allow for the possibility that these institutions affect the persistence of unemployment through time. The other noteworthy departure of the specifications used by the IMF is the inclusion of a variable for central bank independence. This allows for the possibility that independent monetary policy may either lead to higher unemployment – possibly as a result of shielding central
74
bankers from political pressures to try to reduce unemployment – or alternatively, to lower unemployment as a result of consistent well-planned monetary policy. 16 The IMF states that all four specifications are reasonable representations of reality. For example, the IMF writes that "the very simple model [in variant one] does a good job in explaining unemployment variation across countries (although not across time)" (p. 148). The IMF's preferred specification is arguably variant three, but this equation includes complicated interactions between institutions and the lagged dependent variable that make it difficult to use in various simulation exercises. Variant four is based on variant three, but without these interaction terms. 17 We include a common set of time dummies in order to remove global shocks (good and bad) and common business-cycle effects over the 1960-98 period. We see little theoretical justification for imposing a common time trend, and even less justification for including a separate time trend for each country. To the extent that unemployment in OECD economies is trended over time, the role of this kind of modeling ought to be to explain such a trend, not to control for it. In the same spirit, models should seek to use institutions (and other economic variables) to explain differences in trends across countries. A common set of time dummies allows us to control for common global shocks, leaving national institutions to explain deviations from unemployment from the average pattern implied by these shocks. A common time trend or country-specific time trends leaves institutions (and other variables) only the task of explaining deviations from the typically rising trend in unemployment. We also use a common term for the change in the consumer price index (CPI), rather than country-specific CPI terms. Much of the interest in this kind of research is precisely on the way in which national institutions change the nature of the tradeoff between inflation and unemployment in particular countries. The argument that the data reject the common CPI (or time trend term) is not particularly persuasive since the data almost certainly reject common coefficients for the institutional variables (except in the case where the institutional results themselves are poorly defined). 18 The first-difference specification may also act as a crude guard against problems arising from the possibility that the series regressed here are not stationary and not cointegrated. If the variables follow a random walk with drift, differencing would yield stationary series. The IMF does not present any tests of stationarity or cointegration, but standard theory suggests that the coefficient estimates presented in the WEO and here would be invalid if the series are not stationary or cointegrated (see, for example, Davidson and MacKinnon (1993), Chapter 10). Junakar and Madsden (2004) and Baccaro and Rei (2004) discuss this issue in the context of OECD unemployment. 19 For example, Nickell (2003) allocates more “good” policy changes to the UK (6 ticks) than to any other country, getting credit for reducing the replacement rate (1 tick), increasing benefit system strictness (1 tick), reducing union coverage (2 ticks) and union density (1 tick), and for reducing labor taxes (1 tick).

75
20 The only variable which is significant and with the correct sign is the price and tax wedge in the wage equation. The interpretation we advance for this general finding on the supply-side variables is that when other variables which have figured in the debate on the determinants of medium term unemployment are also used, they regularly outperform the supply-side terms” (Henry, 2004, p. 22). 21 As we noted above, whatever the empirical strength of this relationship, Atkinson and Mickelwright (1991) definitively put to rest the notion that there has ever been any European country with unconditional and indefinite unemployment benefit entitlements. 22 According to van Ours (2003), “The decline in replacement rate had a clear effect on unemployment.” But before we can be sure of how clear this effect is, we would need an explanation for the stability of the OECD measure shown in Figure 9. 23 The Survey by the Danish Ministry of Finance (1999) does state that “The level of structural unemployment has evidently fallen over the last years, due to the extensive reforms of the labour market, cf. chapter 2” (p. 9). But turning to chapter 2 we find Box 2.1, titled “Labour market initiatives since 1993.” A close look at these initiatives reveals that what is being tightened are the links between benefit receipt and participation in active labor market programs, and the improvement and expansion of these programs. While it is not unreasonable to assume that these initiatives played an important role, Chapter 2 offers no direct statistical evidence on the relationship between the decline in the Danish unemployment rate and the tightening of the linkages between the benefit entitlement system and participation in active labor market programs. 24 The distinctiveness of this study was that they were able to take into account policy endogeneity – had they not been able to account for actual changes in the labor market, the decline in the transition rate to jobs would have appeared to have been much larger - 40 percent. 25 We do not take issue here with the reforms scorecard per se. This means we set aside questions regarding 1) which institutions to include (e.g., taxes and ALMP might not be considered, for reasons mentioned above); or 2) what threshold should determine a cross or a tick for each of the 9 measures; the poor quality of some of the measures (e.g., there is in fact no good cross-country measure of the strictness of eligibility rules for unemployment insurance, much less how this measure may have changed over time). 26 It could easily be argued that Nickell’s allocation of ticks and crosses for France is among the most problematic. For example, in Nickell’s table 5, France gets a cross on the basis of changes that took place in the 1980s, not the 1990s, and gets no credit (a tick) for reducing union density from 16% to 10%, a level below that of the U.S.. It gets another for increasing strictness of employment protection, which turns out to have been entirely due to changes in regulations that apply to temporary workers, who comprise just 15% of the workforce. Finally, Nickell’s criterion for a cross on EPL is a rise of more than .1; France’s score increases from 1.3 to 1.4 (exactly .1). France gets a cross.

76
27 For example, recommendations varied from 4 in the case of US and Australia to 21 for Finland and 23 for Germany. The effect of reforms on unemployment should presumably depend on how many were actually implemented, not simply the proportion of recommendations implemented. One would think that the implementation of 11-12 recommendations by Germany (50%) would have a greater payoff to employment performance than the implementation of just 2 by Australia (50%). 28 As Manning puts it, “the strength of the evidence linking the generosity of the benefit system is not as strong as we would like and our belief in such a link derives more from the theory than from the evidence” (1998, p. 143). 29 As Mark Blaug (1992, p. 241) puts it: “Modern economists all too frequently are satisfied to demonstrate that the real world conforms to their predictions, thus replacing falsification, which is difficult, with verification, which is easy.” Similarly, he quotes Robert Solow as saying that “Economists don’t ask themselves – and I think this is the worst sin of them all – whether there doesn’t exist a different model that would fit the data equally well, and what does that tell me? So I think that the problem with economists is that they do too much uncritical empirical work, and that they deceive themselves with the refinements of their methods” (p. 242).