Embed Size (px)
Citation preview
International Journal of Economics and Financial Issues
Vol. 5, No. 1, 2015, pp.212-229
ISSN: 2146-4138
www.econjournals.com
212
Are Linear and Nonlinear Exchange Rate Exposures Aggravating Agents to
Corporate Bankruptcy in Nigeria? New Evidence from the “U” Test
Analysis
Abdulkadir Abdulrashid Rafindadi
Department of Accounting, Usmanu Danfodiyo
University, Sokoto, Nigeria. Email: [email protected]
Zarinah Yusof
Department of Economics, University of Malaya,
Kuala Lumpur, Malaysia. Email: [email protected]
ABSTRACT: Several pioneering studies have established that the effect of exchange rate exposure to
corporate entities in periods of the financial crisis is no longer linear. To this end, this study explores
the position of this argument in a developing country like Nigeria and investigates if the phenomenon
could lead to the escalation of corporate survival threats, particularly in crisis and non-crisis periods.
In order to ensure this, we analyzed the data of 102 companies consisting of indigenous and
multinationals entities’ from 20 sectors of the Nigerian economy from1980-2011. The study employed
the ARDL bounds test approach to cointegration and the “U” test methodologies in determining the
linear and non-linearity effects of the exposural position of the selected entities’ value. The findings of
the study established the existence of non-monotonic relationships between the indigenous entities
values and the exchange rate position. The “U” shape relationship was discovered to be the most
aggravating agent to these entities survival threats. Surprisingly the relationship between the corporate
value of multinational companies in Nigeria and official exchange rate (ERS) is only having a linear
relationship. This means that these entities are not heavily exposed to the vagaries of exchange rate
changes, meaning they cannot be threatened by bankruptcy in both the crisis and non-crisis periods,
which is in contrast to the findings on indigenous entities. As a result of these findings, we recommend
to policy makers, the establishment of exchange rate frame-work that is feasible towards enhancing
productivity in the real sector corporate entities of the country.
Keywords: exposure; linear and non-linear; monotonic and non-monotonic; financial crisis.
JEL Classifications: F3; F4; G3
1. Introduction
New rising empirical evidence indicates that, the trend of exchange rate exposure,
specifically to those corporate entities that have strong international economic linkages and
integration in terms of products and global financial market participation is no longer linear. Within
this framework, key empirical research findings have indicated that corporate profits are critically
affected by currency movement through a significant exposural pass through via two principal
channels, namely competitive effect and net worth or balance sheet effect. These effects combine to
make the corporate financial structure too weak to withstand the exogenous shocks which in turn
render the balance sheet of corporate entities fragile and susceptible to derelictions (Bénassy et al.,
2009; Prasetyantoko, 2007; Claessens et al., 2000).
It is against this backdrop that this paper aims to investigate the effects of linear and non-
linear exchange rate exposure in a developing country like Nigeria. The study wishes to contribute
by determining (i) the effects of linear and non-linear exchange rate exposure in crisis and non-
crisis periods (ii) whether this could be an aggravating agent to the survival threats of the selected
entities (iii) an estimation of the nonlinearity effects of exchange rate exposure using the newly
developed “U” shaped methodology. Following the introduction in section 1, in section 2 the paper
focused on the theoretical and empirical literature reviews while, in section 3, we provided an
Are Linear and Nonlinear Exchange Rate Exposures Aggravating Gent to Corporate Bankruptcy in
Nigeria? New Evidence from The “U” Test Analysis
213
overview of the theoretical origin and complexities of the financial crisis. In section 4, the paper
delineates the theoretical framework of the study, and section 5 consists of the methodology of
estimating the model and section 6 presents the results and discussion. Finally, section 7 presents
the conclusion, recommendation and policy implication.
2. Theoretical and Empirical Literature Review
The theoretical review of Shapiro (1974) became the pioneering research on exchange rate
exposure literature. He argued that the values of multinational entities that operate within the niches of
varied economic circles are susceptible to the repercussions of economic fluctuations. He continued to
argue that, the likeliness of these entities to be influenced by the dynamics of foreign currency
movement is absolutely a factor which is dependent on the level of inflation, or the degree of currency
devaluation on the dollar value of these organizations; in comparison to the traditional historical
accounting definition of the entities net current assets. Hodder (1982), in his empirical findings,
established a landmark between corporate value and foreign currency exposure particularly those with
international dealings. The trend continued up to the seminal work of Adler and Dumas (1984) who
contradicted the findings of the two earlier researchers. They argued that corporate organisations that
operate in domestic markets can also be influenced by exchange rate fluctuations. This finding was
further validated by Jorion (1990). Luetherman (1991) studied how the hypothetical belief that local
currency depreciation provides an advantage for the competitive possibility of the domestic country
producers comparable to foreign competitors. The finding of the author was found to be contrary to
the established hypothesis that depreciation of domestic currency strengthens the competitive abilities
of domestic companies. He then argued that firms do not obtain significant or insignificant benefits
from depreciation of their national currency. However, a large fall in the turnover of their industries
was found as a result of the depreciation of the home currency. Complimenting this finding, Bodner
and Gentry (1993) studied foreign currency influence at the firm level for Canada, Japan and USA.
The findings of the authors revealed that real manufacturing entities’ values in all the three countries
are significantly exposed. In an attempt to confirm the above findings, Choi and Prasad (1995)
devised a model that helped them to analyse the effect of the influence of foreign currency exposure
on 409 U.S transnational companies. At the end, they established how movements in foreign currency
tend to affect these companies overall net worth. The research also found 60% of the firms under their
survey to be widely influenced by foreign currency variability. Following this interesting finding,
Domely and Sheehy (1996) found a similar relationship in foreign currency variability and how widely
it influences exports.
Supporting the work of Domely and Sheehy (1996), Miller and Reuer (1998) investigated the
repercussions of the effects of the changes in industrial hedging methodologies and strategies of firm’s
exposure to foreign currency fluctuations. Their findings revealed that 13% to 17% of U.S real sector
corporate entities are influenced by foreign exchange rate variability. The authors also indicated that
the influence of foreign direct investment will reduce the degree of firm’s exposure by stifling foreign
exchange fluctuation. Similarly, Brunner and Himmet (2000) studied the mechanics of currency
movement of German corporate entities with regard to the variability of German currency comparable
with those in the US. The findings established how these companies are heavily influenced by a
change in the Dutch Mark to the U.S Dollar. On the contrary, Choi and Cheol (2002) investigated the
exposure of US firms operating in the Asian continents. Their seminal work came after the 1997 Asian
financial crisis. The findings of the authors revealed that there were signs of both contemporaneous as
well as lagged variations in the level of exposure particularly during the crisis period. The authors
further asserted that the direction of foreign currency fluctuations are categorised into negative and
positive coefficients and this means that there is a clear reflection of the dynamic nature of exchange
rate movement. In another development, Aguiar (2004), in his empirical findings, indicated that the
fall in the value of a national currency could affect corporate entities in two prominent directions;
mostly through competitive effect and the total overall corporate value or balance sheet effect. The
author continued to assert that, in some cases, depreciation has a competitive effect when it is followed
by an increase in export which also spurs economic growth. However, if currency depreciation is
followed by a decline in production, such as tradable or exportable goods, then corporate entities will
be marred by a severe degradation of value due to contraction in earning stream.
International Journal of Economics and Financial Issues, Vol. 5, No. 1, 2015, pp.212-229
214
Priestley and Ødegaard (2007), in their innovative empirical research work titled ‘Linear and
Nonlinear Exchange Rate Exposure’, identified a flaw in the past theoretical literature and vast
empirical studies, where they asserted that the dimension between the overall corporate net worth and
exchange rate exposure generally has a nonlinear relationship. They established a number of
theoretical models that demonstrated how a firm’s exposural behaviour tends to be different when the
currency is depreciating, in comparison to when it is appreciating. Bartram (2007), in his seminal
empirical work studied the influence of foreign currency, and its management in relation to corporate
cash flow positions. The author demonstrated how foreign exchange rate exposures can be managed to
provide a hedging mechanism at the firm level. As a result of this, the residual net exposure on
corporate entities will be economically and statistically negligible, and this will hold particularly,
when operating cash flow positions of the firms are highly exposed to the industry risk position.
Contrary to the work of Batram (2007), Simbanegavi and Wilander (2008) conducted a study that
aimed to determine at which stage a minimum exchange rate pass-through is likely to have a direct
link to grievous corporate exposure level. Hence, they argued that the relationship between exchange
rate pass-through and exposure is likely to be positive across industries when and only if, cost
functions differ across industries. In another significant research contribution, Choi and Jiang (2009)
investigated how the collapse of the Bretton Woods arrangement was followed by varied continental
financial economic systems the authors pointed out that, this produced ground breaking mechanism
which saw the back ground for currency and market dis-unification which in turn led to the arousal of
the current economic lingering of currency movement. As a result of this, it became an established fact
that the influence of foreign currency on corporate entities will increase commensurate with its
echelons of international dealings.
Fratzscher (2009), in his sharp research focus, conducted an investigation with the aim of
ascertaining how the financial crises tend to trigger persistent and unprecedented foreign exchange
rate movements. The findings of the author revealed that economic fundamentals and financial
exposure are key aggravating agents to the transmission process. In essence, countries that have high
direct financial exposure with the U.S and those that also have an insignificant reserve holding and
persistent current account deficit suffer more when it comes to currency depreciation. In another
dimension, Batram and Boardnar (2012) studied the link between estimating foreign currency
exposure and returns on invested stocks mostly in non-financial companies for 37 countries. The
authors discovered that 30% to 40% of most corporate entities operating in developing and emerging
market economies like Brazil, South Africa, Indonesia, Argentina and Thailand are significantly
influenced by foreign exchange rate exposure. The authors established that the menace of exchange
rates on these countries’ corporate profitability could in principle stem from an effect on the firms’
cash flows or discount rate and that the impacts of the risk inherent in the exchange rate variability on
stock returns is absolutely driven by a predominant position of corporate cash flow sway due largely to
economic fundamentals prevailing in these countries.
In another development which comparatively studied the three regions of Africa, Asia and the
Middle East, Rafindadi and Yusof (2014a) attempted to determine a common position that may be
regarded as an entrepreneurial haven in periods of currency devaluation and currency collapse. The
authors applied the concept of catastrophe theory modeling in their study. The theoretical findings
concluded that, in theory, determining the best region that satisfied the full conditions of being an
entrepreneurial haven in the respective periods under survey is virtually impossible. However, while
using the empirical data of doing business provided by the World Bank, and by means of graphical
representation, the authors discovered how the African region demonstrated some key characteristics
that provided multiplicities of economic and other entrepreneurial opportunities as against the other
two regions. In contrast to the earlier development, Rafindadi and Yusof (2014b) established that a
moderate devaluation of the Nigerian local currency could have a stabilizing influence on the balance
of payment problem facing the country particularly when productive resources are optimally utilised.
As a result of this, the authors argued that a less contractionary monetary policy when combined with
an appropriate exchange rate policy can enable the country to achieve more effectively the objectives
of devaluation in Nigeria. They argued that moderate currency devaluation is cheaper than the
imposition of a high interest rate pursued by the Central Bank. In their explanations, they pointed out
that high interest rate will end up stippling economic growth prospects of the country in the long-run.
Are Linear and Nonlinear Exchange Rate Exposures Aggravating Gent to Corporate Bankruptcy in
Nigeria? New Evidence from The “U” Test Analysis
215
3. Complexities of the Financial Crisis
Financial crisis is a broad term commonly applied to continuums of economic situations,
which combine to lead to the deteriorations of the value of the financial assets and financial
institutions. It is a phenomenon that directly results in the loss of the quality of paper wealth, which in
turn creates currency collapse, banking panics, financial asset bubbles, stock market crisis, and
sovereign default, as well as the weakening of the prosperity of real sector corporate entities among
others. The menace of the financial crisis inversely affects the national economy through persistent
exchange rate instability, investment instability and a general market failure. This phenomenon
substantially precipitates into massive financial dissaving; weakening of international and domestic
trade, and often creates enormous capital repatriation by foreign investors. In his research findings,
Cavallo et al. (2002) documented that during, any period of the financial crisis and currency collapse,
corporate entities with substantial foreign currency liabilities tend to have whopping increases in the
value of their gearing level relative to revenues, thereby, crippling insufficiently hedged debtors and
leading to contractions of corporate fortunes, prospects and production optimality possibilities. In a
more reliable and detailed explanation, Gerald (2010:2) established that financial crisis:
“In recent years, the pace of change and innovation in financial markets and
institutions around the world has increased considerably in complexities as have
the speed, volume and value of financial transactions. The period has also seen a
greatly heightened degree of aggressive competition in the financial sector. All of
this is taking place in the context of a legal and a regulatory framework which is
increasingly outdated and ill-equipped to meet the challenges of the day. This has
led to…concern that the fragility of the system has increased, in part because the
degree of operational, liquidity and credit interdependency has risen sharply”
Similar to the above, Merali (2009:1) stated that:
“The global financial system as a CAS illustrates the importance of network
topology and diversity in system robustness and resilience. The density and
complexity of the financial network led to profound structural vulnerabilities and
amplified uncertainties in the pricing of assets, causing seizures in particular
financial markets. Network feedback effects under pressure (hoarding of liabilities
and fire-sales of assets) coupled with the dominant positions of leading players and
the erosion of diversity in institutions’ business and risk management strategies
resulted in the current crisis.”
In another perspective, Kaminsky et al. (1997) documented that financial crises can be
provoked by adverse world economic conditions that have to do with the market’s failure to have a
sustainable and steady international capital flows. The author further argues that crises in emerging
markets are of a different nature when compared with crisis in mature markets. On the other hand, the
crises in developing markets are critically worse if met with deteriorating economic fundamentals.
Similarly, crises triggered exclusively by adverse shocks from international capital markets and crises
from economies with immaculate fundamentals are found to be a mature-market driven phenomenon.
In contrast, crises in emerging economies are triggered by myriad vulnerabilities while those in
developing economies are triggered by the shallowness in the market, mono economic dependence and
poor macroeconomic management. In all the three instances, the degree of the crisis severity, is
usually measured by the range of output losses, the magnitude of the reserve losses of the central bank,
and the depreciation of the domestic currency are key prominent factors used to gauge the extent of
severity of most financial crisis. In essence the cumulative effects of the crisis totally depend on the
dysfunctional causes of the crisis to corporate entities and how it affects other segments of the
economy which constitutes the main stay of the system and subsystems. Kaminskey (2003) re-asserts
that the degree of the severity of currency crises is directly linked to the nature of the crises. He
documented that crises emanating from financial excesses will be having the worst effects on the real
sector entities than the rest of the economic system and has the tendencies of triggering sudden stops.
The author then laid a logical explanation on the models of most financial crisis. According to him,
the models of currency crisis constitute a spectacular position of most financial crisis theorisation. In
this respect, the theoretical assumptions of the first, second and third generation model of currency
International Journal of Economics and Financial Issues, Vol. 5, No. 1, 2015, pp.212-229
216
crisis, possesses a threefold theorisation mechanics. For instance, the first-generation model of
currency collapse argued that whenever, macroeconomic inconsistencies arise when fixed exchange
rate regime is pursued the situation could lead to financial operational dysfunctionalities which
impairs financial value. The theorisation of this model continued to re-echo the complications of fiscal
deficits and broad monetary dilation as principal confluence and aggravating agents to currency
collapse in the first instances (Krugman, 1979; Flood and Garber, 1984). On the contrary, the
theorization of the second-generation model takes into consideration the effects of the myriads of
countercyclical economic issues that relate to production optimality impediments which arise in an
attempt to control monetary dilation by the Central Bank. This situation then creates a hindrance
between credit facilities and the real sector entrepreneurial outlets. This situation in turn impedes on
entrepreneurial supply and hence acts as a restriction on production, innovation and resources
exploitation. The shortage of entrepreneurial supplies in turn breeds another crisis due to shortages in
production activities, as a result of current account depletion that ginger currency misalignment,
(Obstfeld, 1994; Eichengreen et al., 1997). The third-generation model has financial excesses as its
main focal point of argument (Krugman, 1999 and Aghion et al., 2001 and 2004). The culmination of
these three models piques economic sudden-stop which ends up creating international capital problems
that are capable of transcending into general financial crisis issues nationally and or regionally. Apart
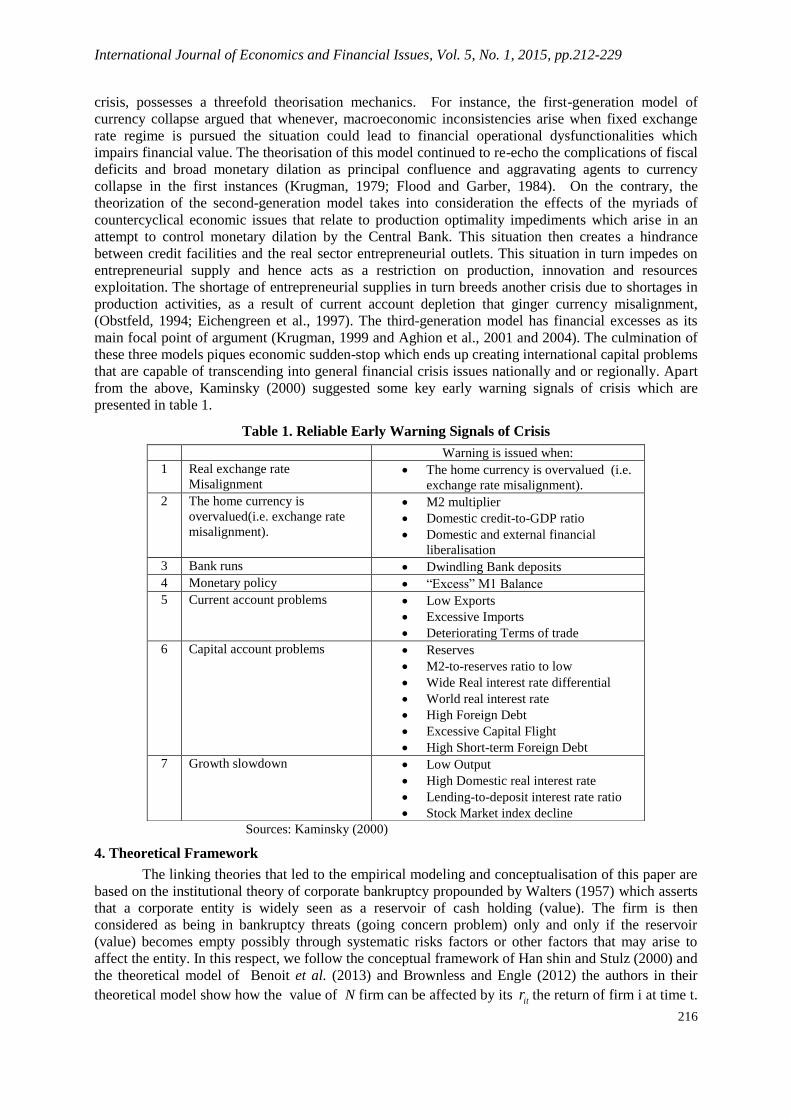
from the above, Kaminsky (2000) suggested some key early warning signals of crisis which are
presented in table 1.
Table 1. Reliable Early Warning Signals of Crisis
Sources: Kaminsky (2000)
4. Theoretical Framework
The linking theories that led to the empirical modeling and conceptualisation of this paper are
based on the institutional theory of corporate bankruptcy propounded by Walters (1957) which asserts
that a corporate entity is widely seen as a reservoir of cash holding (value). The firm is then
considered as being in bankruptcy threats (going concern problem) only and only if the reservoir
(value) becomes empty possibly through systematic risks factors or other factors that may arise to
affect the entity. In this respect, we follow the conceptual framework of Han shin and Stulz (2000) and
the theoretical model of Benoit et al. (2013) and Brownless and Engle (2012) the authors in their
theoretical model show how the value of N firm can be affected by its itr the return of firm i at time t.
Warning is issued when:
1 Real exchange rate
Misalignment The home currency is overvalued (i.e.
exchange rate misalignment).
2 The home currency is
overvalued(i.e. exchange rate
misalignment).
M2 multiplier
Domestic credit-to-GDP ratio
Domestic and external financial
liberalisation
3 Bank runs Dwindling Bank deposits
4 Monetary policy “Excess” M1 Balance
5 Current account problems Low Exports
Excessive Imports
Deteriorating Terms of trade
6 Capital account problems Reserves
M2-to-reserves ratio to low
Wide Real interest rate differential
World real interest rate
High Foreign Debt
Excessive Capital Flight
High Short-term Foreign Debt
7 Growth slowdown Low Output
High Domestic real interest rate
Lending-to-deposit interest rate ratio
Stock Market index decline

Are Linear and Nonlinear Exchange Rate Exposures Aggravating Gent to Corporate Bankruptcy in
Nigeria? New Evidence from The “U” Test Analysis
217
through periods of crisis or rising economic uncertainties, they continued to argued that the market
return is the value-weighted average of the total firm return 1
N
i it itrmt r where it denote the
relative total corporate value in this context. Following to this, the concept of systematic risk can
affect an entity i through systematic risk as measured by Expected Shortfall (ES) of the system
equation proposed by Acharya et al (2010). By definition, the ES is a position where the firm value
can be affected at an α % level and also the expected return in the worst scenario can also be affected
by α%. Theoretically this can be expressed in the following equation form:
ESmt (C)=Et-1 (rmt | rmt ˂ C) =1
1( ( )
N
it t it mti
E r r C …….1
MESit = (C) = 1
( )( )mt
t mt
it
ES CE r C
…….. 2
The MES is a coherent risk measure formulated by Artzner et al (1999) this measures the increase in
the risk of an entity which is measured by ES which try to identify the level of a firm’s risk factor to
the entirety of the risks factors inherent in the financial system. These can also be extended by the
following System Expected Shortfall SES as in:
1 1 11 ( ( N Nitit t it i i it
it
SESkL E r W k A
W
……. 3
Where itL the leverage is ( ),it
it
it
AA
Wrefers to the total asset of the firm and
itW is the total corporate
value in this study. According to Acharya (2010) the above term can also be expressed in a linear
form: SES = (k itL - 1 + θ MESit + ∆i ) itW ……..4. Where θ and ∆i are constant term. Graphically,
we use the concepts of Han shin and Stulz (2000) in demonstrating how firm value and risk can arise
to escalate the total corporate risk to bankruptcy. These concepts are graphically illustrated in:
Figure 1 Figure 2 Figure 3
In the above figures, figure 1 explains the assumption that marginal cost of bearing unhedged
risk is increasing the unhedged risk, while the marginal cost of hedging risk is decreasing in unhedged
risk. While figure 2 explains the assumption that all firms have the same marginal cost function of
hedging risk, but have different marginal cost functions of bearing unhedged risk as the risk factors
continued to escalate. Finally, in figure 3 the impact of optimal unhedged risk increase to the firm's
risk stream. .Meaning that as the firm's unhedged risk increases, the marginal cost for a given amount
of risk reduction is kept the same so that the marginal cost curve of hedging risk shifts to the right. As
the firm's unhedged risk increases, the marginal cost of bearing unhedged risk is kept constant for each
level of unhedged risk.
In figure 4, a description of the ecosystem is provided by trying to depict the high level of
inter-connectedness between the economic system and its subsystems. Following this, an assumption
is made by using the anatomy of an economic system to be synonymous with that of an atom. The
other inter connectedness here is refered to as the nucleus these consists of the markets (macro-level)
and the firms (micro-level). accordingly, the red elements (herein called electron) that revolve
around the markets tend to create a macro-flow, whereas the orbit that revolves around the firms
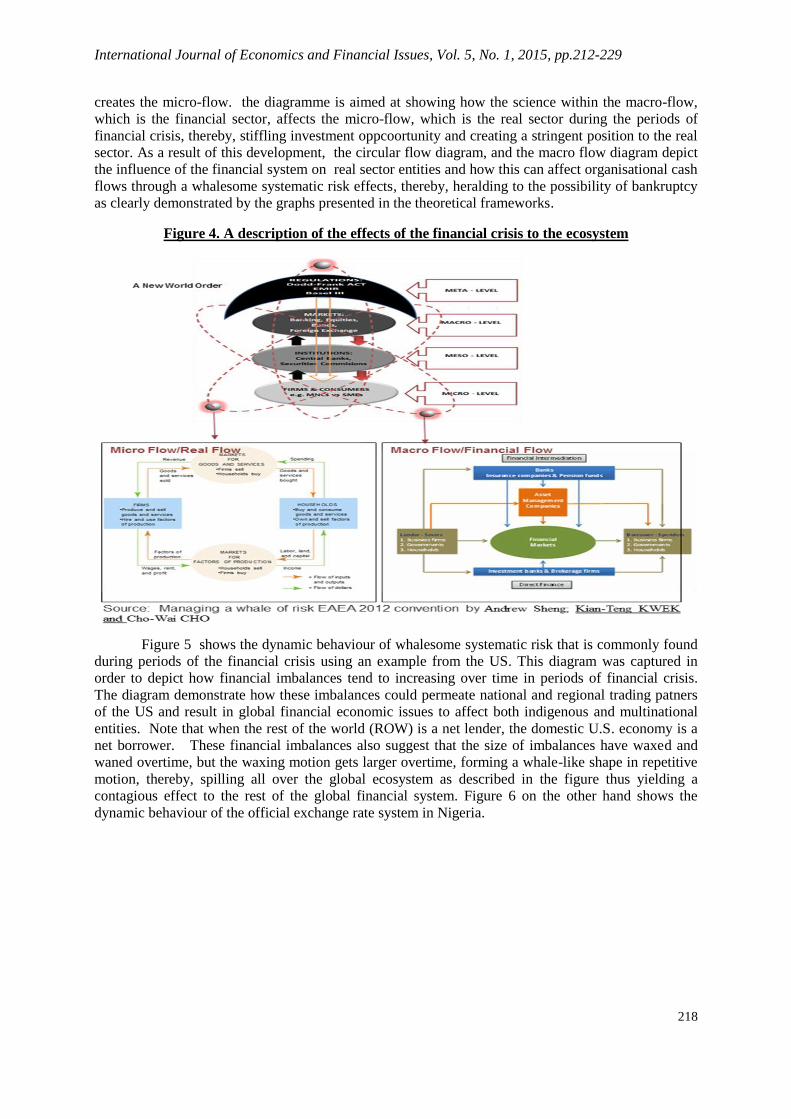
International Journal of Economics and Financial Issues, Vol. 5, No. 1, 2015, pp.212-229
218
creates the micro-flow. the diagramme is aimed at showing how the science within the macro-flow,
which is the financial sector, affects the micro-flow, which is the real sector during the periods of
financial crisis, thereby, stiffling investment oppcoortunity and creating a stringent position to the real
sector. As a result of this development, the circular flow diagram, and the macro flow diagram depict
the influence of the financial system on real sector entities and how this can affect organisational cash
flows through a whalesome systematic risk effects, thereby, heralding to the possibility of bankruptcy
as clearly demonstrated by the graphs presented in the theoretical frameworks.
Figure 4. A description of the effects of the financial crisis to the ecosystem
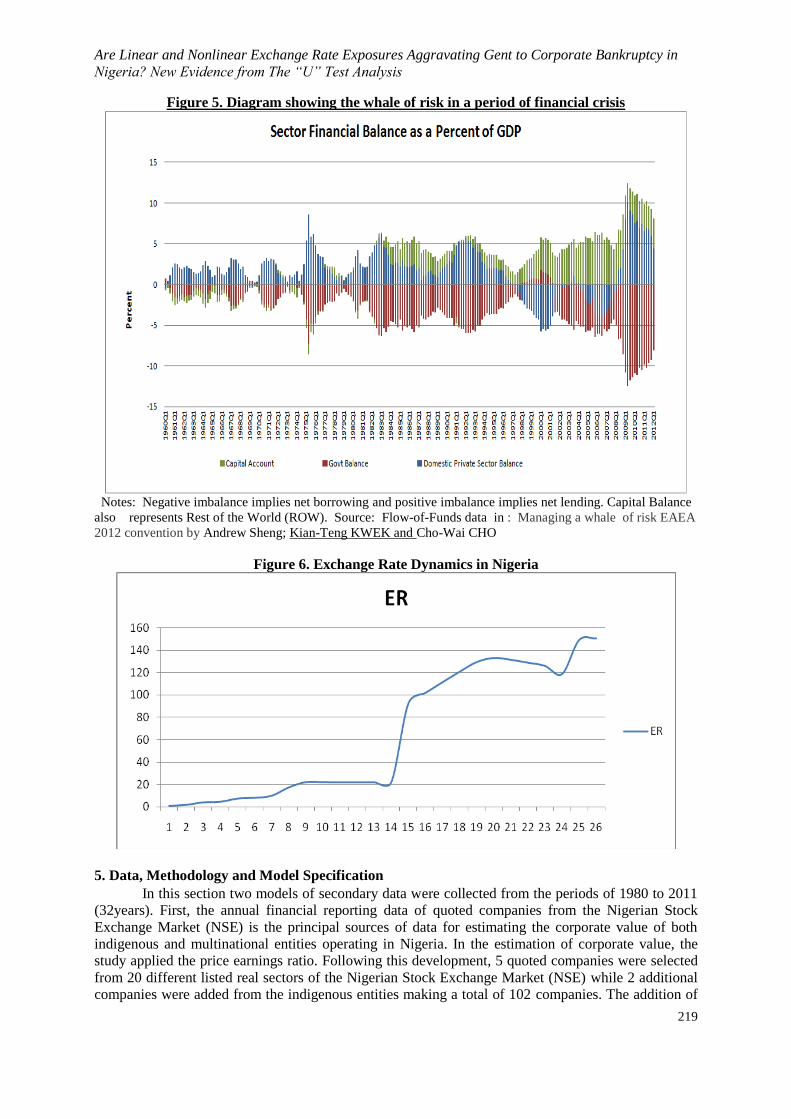
Figure 5 shows the dynamic behaviour of whalesome systematic risk that is commonly found
during periods of the financial crisis using an example from the US. This diagram was captured in
order to depict how financial imbalances tend to increasing over time in periods of financial crisis.
The diagram demonstrate how these imbalances could permeate national and regional trading patners
of the US and result in global financial economic issues to affect both indigenous and multinational
entities. Note that when the rest of the world (ROW) is a net lender, the domestic U.S. economy is a
net borrower. These financial imbalances also suggest that the size of imbalances have waxed and
waned overtime, but the waxing motion gets larger overtime, forming a whale-like shape in repetitive
motion, thereby, spilling all over the global ecosystem as described in the figure thus yielding a
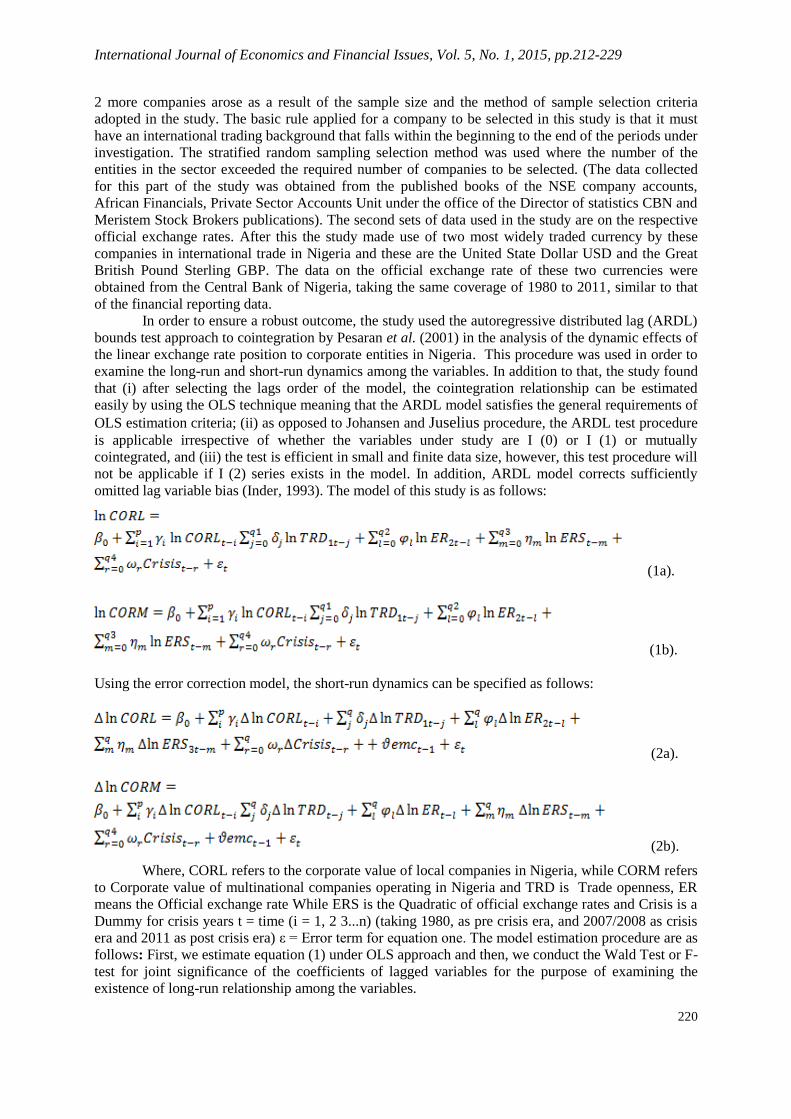
contagious effect to the rest of the global financial system. Figure 6 on the other hand shows the
dynamic behaviour of the official exchange rate system in Nigeria.
Are Linear and Nonlinear Exchange Rate Exposures Aggravating Gent to Corporate Bankruptcy in
Nigeria? New Evidence from The “U” Test Analysis
219
Figure 5. Diagram showing the whale of risk in a period of financial crisis
Notes: Negative imbalance implies net borrowing and positive imbalance implies net lending. Capital Balance
also represents Rest of the World (ROW). Source: Flow-of-Funds data in : Managing a whale of risk EAEA
2012 convention by Andrew Sheng; Kian-Teng KWEK and Cho-Wai CHO
Figure 6. Exchange Rate Dynamics in Nigeria
5. Data, Methodology and Model Specification
In this section two models of secondary data were collected from the periods of 1980 to 2011
(32years). First, the annual financial reporting data of quoted companies from the Nigerian Stock
Exchange Market (NSE) is the principal sources of data for estimating the corporate value of both
indigenous and multinational entities operating in Nigeria. In the estimation of corporate value, the
study applied the price earnings ratio. Following this development, 5 quoted companies were selected
from 20 different listed real sectors of the Nigerian Stock Exchange Market (NSE) while 2 additional
companies were added from the indigenous entities making a total of 102 companies. The addition of
International Journal of Economics and Financial Issues, Vol. 5, No. 1, 2015, pp.212-229
220
2 more companies arose as a result of the sample size and the method of sample selection criteria
adopted in the study. The basic rule applied for a company to be selected in this study is that it must
have an international trading background that falls within the beginning to the end of the periods under
investigation. The stratified random sampling selection method was used where the number of the
entities in the sector exceeded the required number of companies to be selected. (The data collected
for this part of the study was obtained from the published books of the NSE company accounts,
African Financials, Private Sector Accounts Unit under the office of the Director of statistics CBN and
Meristem Stock Brokers publications). The second sets of data used in the study are on the respective
official exchange rates. After this the study made use of two most widely traded currency by these
companies in international trade in Nigeria and these are the United State Dollar USD and the Great
British Pound Sterling GBP. The data on the official exchange rate of these two currencies were
obtained from the Central Bank of Nigeria, taking the same coverage of 1980 to 2011, similar to that
of the financial reporting data.
In order to ensure a robust outcome, the study used the autoregressive distributed lag (ARDL)
bounds test approach to cointegration by Pesaran et al. (2001) in the analysis of the dynamic effects of
the linear exchange rate position to corporate entities in Nigeria. This procedure was used in order to
examine the long-run and short-run dynamics among the variables. In addition to that, the study found
that (i) after selecting the lags order of the model, the cointegration relationship can be estimated
easily by using the OLS technique meaning that the ARDL model satisfies the general requirements of
OLS estimation criteria; (ii) as opposed to Johansen and Juselius procedure, the ARDL test procedure
is applicable irrespective of whether the variables under study are I (0) or I (1) or mutually
cointegrated, and (iii) the test is efficient in small and finite data size, however, this test procedure will
not be applicable if I (2) series exists in the model. In addition, ARDL model corrects sufficiently
omitted lag variable bias (Inder, 1993). The model of this study is as follows:
(1a).
(1b).
Using the error correction model, the short-run dynamics can be specified as follows:
(2a).
(2b).
Where, CORL refers to the corporate value of local companies in Nigeria, while CORM refers
to Corporate value of multinational companies operating in Nigeria and TRD is Trade openness, ER
means the Official exchange rate While ERS is the Quadratic of official exchange rates and Crisis is a
Dummy for crisis years t = time (i = 1, 2 3...n) (taking 1980, as pre crisis era, and 2007/2008 as crisis
era and 2011 as post crisis era) ε = Error term for equation one. The model estimation procedure are as
follows: First, we estimate equation (1) under OLS approach and then, we conduct the Wald Test or F-
test for joint significance of the coefficients of lagged variables for the purpose of examining the
existence of long-run relationship among the variables.
Are Linear and Nonlinear Exchange Rate Exposures Aggravating Gent to Corporate Bankruptcy in
Nigeria? New Evidence from The “U” Test Analysis
221
The null hypothesis (H0): , establish that there is no cointegration
among the variables, was compared against the alternative hypothesis (Ha):
. The F statistics is then compared with the critical value (upper and lower
bounds) given by Pesaran et al. (2001). If the F-statistic is above the upper critical value, the null
hypothesis of no cointegration is rejected which indicates that long-run relationship exists among the
variables and converse will be the case, if the F-statistic is smaller than the lower critical value, in that
respect the null hypothesis cannot be rejected and this is implying that there is no cointegration among
the variables. However, if the F-statistic lies between lower and upper critical values, the test is
inconclusive. In the second step, after establishing the existence of cointegration relationship among
the variables, long-run coefficient of the ARDL model can be estimated. Note that the asymptotic
critical value bounds will be obtained from Table F in appendix C, (Pesaran and Pesaran, 1997,
p.478). In this process, we use SIC criteria for selecting the appropriate lag length of the ARDL model
for all the variables except the crisis dummy. Apart from that, the study conducted key diagnostic tests
which comprise of testing for the serial correlation, functional form, normality, and the
heteroscedasticity (Pesaran and Pesaran, 1997). To ensure the stability of the variables the study
performed two tests of stability for the long-run coefficients together with the short-run dynamics,
following the suggestion by Pesaran (1997) to check the stability of short and long-run parameters of
selected ARDL model after estimating the error correction model the study applied the cumulative
sum of recursive residuals (CUSUM) and the cumulative sum of squares of recursive residuals
(CUSUMSQ) tests.
The U test methodology
Lind and Mehlum (2010) argued that it is clear that nonlinear relationships exist in economic
theory, and such relationships are also frequently tested empirically. However, the way they are tested
in modern times is fraught with flaws. As a result, the newly invented U shape test of a nonlinear
relationship aims to remedy these deficiencies. The main focus of the U shape model rest on its
parsimonious attempt to determine the points where the given relationship of variables (i.e. dependent
and independent) is decreasing at low values within a certain interval and or increasing at high values
and what are the magnitude of the effects on the dependent variable, within a given interval, and
particularly when the distribution of the estimated slope at any point is readily discernible. The
operational adequacy of the U test is based on the likelihood ratio test which is known as the
Sasabuchi-Lind-Mehlum (SLM) Test. To accomplish the test, we have to estimate the following
model:
,
CORMi = αER + bERi2 + Zi C +εi
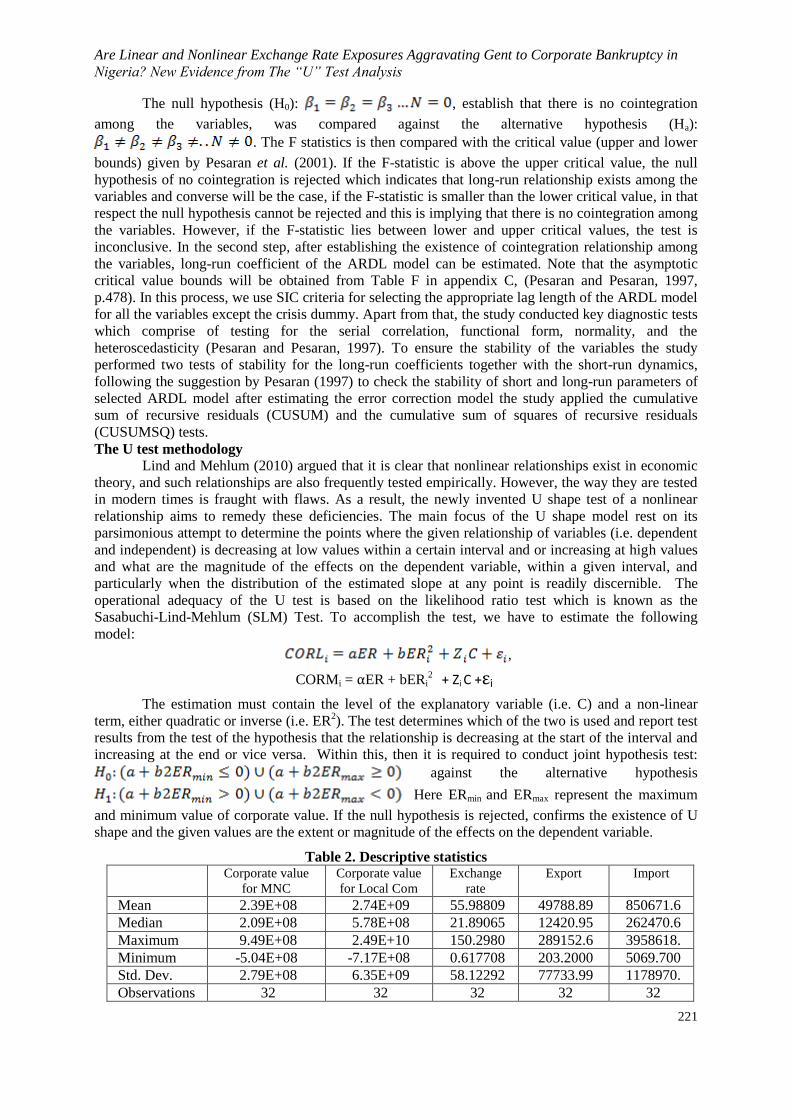
The estimation must contain the level of the explanatory variable (i.e. C) and a non-linear
term, either quadratic or inverse (i.e. ER2). The test determines which of the two is used and report test
results from the test of the hypothesis that the relationship is decreasing at the start of the interval and
increasing at the end or vice versa. Within this, then it is required to conduct joint hypothesis test:
against the alternative hypothesis
Here ERmin and ERmax represent the maximum
and minimum value of corporate value. If the null hypothesis is rejected, confirms the existence of U
shape and the given values are the extent or magnitude of the effects on the dependent variable.
Table 2. Descriptive statistics
Corporate value
for MNC
Corporate value
for Local Com
Exchange
rate
Export Import
Mean 2.39E+08 2.74E+09 55.98809 49788.89 850671.6
Median 2.09E+08 5.78E+08 21.89065 12420.95 262470.6
Maximum 9.49E+08 2.49E+10 150.2980 289152.6 3958618.
Minimum -5.04E+08 -7.17E+08 0.617708 203.2000 5069.700
Std. Dev. 2.79E+08 6.35E+09 58.12292 77733.99 1178970.
Observations 32 32 32 32 32
International Journal of Economics and Financial Issues, Vol. 5, No. 1, 2015, pp.212-229
222
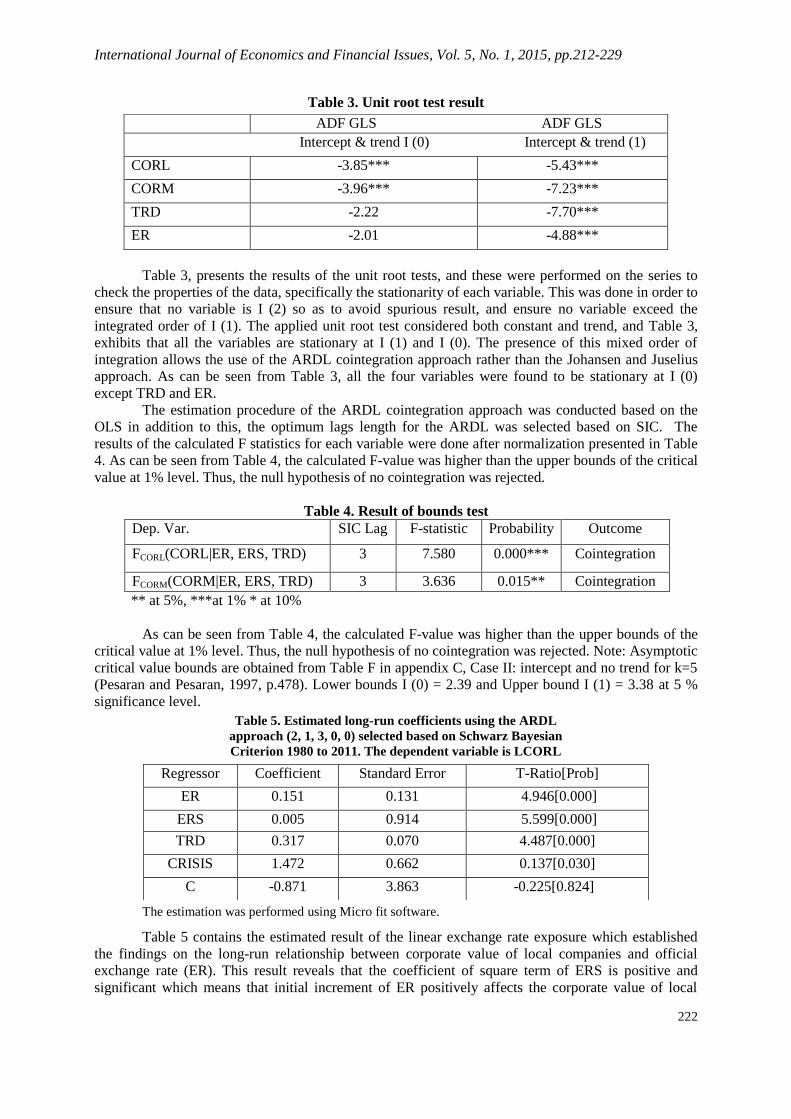
Table 3. Unit root test result
Table 3, presents the results of the unit root tests, and these were performed on the series to
check the properties of the data, specifically the stationarity of each variable. This was done in order to
ensure that no variable is I (2) so as to avoid spurious result, and ensure no variable exceed the
integrated order of I (1). The applied unit root test considered both constant and trend, and Table 3,
exhibits that all the variables are stationary at I (1) and I (0). The presence of this mixed order of
integration allows the use of the ARDL cointegration approach rather than the Johansen and Juselius
approach. As can be seen from Table 3, all the four variables were found to be stationary at I (0)
except TRD and ER.
The estimation procedure of the ARDL cointegration approach was conducted based on the
OLS in addition to this, the optimum lags length for the ARDL was selected based on SIC. The
results of the calculated F statistics for each variable were done after normalization presented in Table
4. As can be seen from Table 4, the calculated F-value was higher than the upper bounds of the critical
value at 1% level. Thus, the null hypothesis of no cointegration was rejected.
Table 4. Result of bounds test
Dep. Var. SIC Lag F-statistic Probability Outcome
FCORL(CORL|ER, ERS, TRD) 3 7.580 0.000*** Cointegration
FCORM(CORM|ER, ERS, TRD) 3 3.636 0.015** Cointegration
** at 5%, ***at 1% * at 10%
As can be seen from Table 4, the calculated F-value was higher than the upper bounds of the
critical value at 1% level. Thus, the null hypothesis of no cointegration was rejected. Note: Asymptotic
critical value bounds are obtained from Table F in appendix C, Case II: intercept and no trend for k=5
(Pesaran and Pesaran, 1997, p.478). Lower bounds I (0) = 2.39 and Upper bound I (1) = 3.38 at 5 %
significance level.
Table 5. Estimated long-run coefficients using the ARDL
approach (2, 1, 3, 0, 0) selected based on Schwarz Bayesian
Criterion 1980 to 2011. The dependent variable is LCORL
The estimation was performed using Micro fit software.
Table 5 contains the estimated result of the linear exchange rate exposure which established
the findings on the long-run relationship between corporate value of local companies and official
exchange rate (ER). This result reveals that the coefficient of square term of ERS is positive and
significant which means that initial increment of ER positively affects the corporate value of local
ADF GLS ADF GLS
Intercept & trend I (0) Intercept & trend (1)
CORL -3.85*** -5.43***
CORM -3.96*** -7.23***
TRD -2.22 -7.70***
ER -2.01 -4.88***
Regressor Coefficient Standard Error T-Ratio[Prob]
ER 0.151 0.131 4.946[0.000]
ERS 0.005 0.914 5.599[0.000]
TRD 0.317 0.070 4.487[0.000]
CRISIS 1.472 0.662 0.137[0.030]
C -0.871 3.863 -0.225[0.824]
Are Linear and Nonlinear Exchange Rate Exposures Aggravating Gent to Corporate Bankruptcy in
Nigeria? New Evidence from The “U” Test Analysis
223
companies. In addition, local companies also benefit from trade openness as the coefficient is positive
and significant. This result suggests that whenever, trade openness dwindles the corporate value of
local companies suffers. The findings also show that crisis has positive effects to the local corporate
values in the long-run.
Table 6. Error Correction model for indigenous corporate value model
(2, 1, 3, 0, and 0) selected based on Schwarz Bayesian criterion
1980 to 2011. The dependent variable is dLCORL
Regressor Coefficient Standard Error T-Ratio[Prob]
dLCORL1 -0.328 0.132 -2.474[0.022]
dER 0.165 0.294 0.563[0.580]
dERS 0.190 0.002 0.095[0.925]
dERS1 -0.003 0.822 -3.928[0.001]
dERS2 -0.003 0.898 -3.706[0.001]
dTRD 0.009 0.132 3.846[0.001]
dCrisis -0.859 0.411 0.341[0.003]
C -1.396 6.206 -0.225[0.824]
ecm(-1) -0.602 0.206 -13.764[0.000]
ecm = LCORL+0.65198*ER0.0051188*ERS0.31777*TRD+1.4723*CRISIS +0.87128*C
The estimation was performed by the researchers using Micro fit software.
Table 6 reports the results of Error Correction model for indigenous corporate value using the
ARDL model (2, 1, 3, 0, 0) selected based on Schwarz Bayesian criterion from 1980 to 2011. The
dependent variable is dLCORL. The results from Table 6 reports that CORL is positively affected by
previous year’s CORL in the short-run as the coefficient of CORL is positive and significant.
However, the different terms of ER and ERS do not have any impact on dCORL but the previous two
years of ERS have had a short term negative impact on dCORL. Likewise, short-run, changes in trade
openness have positive impact on dCORL. Moreover, crisis was also found to have negative effect on
dCORL in the short-run. The estimate of ECMt-1 is negative and statistically significant. The
negative value of ECM is theoretically correct, which shows the speed of convergence from
short-run toward the long run. It implies that short-run variations are corrected by 60% speed
of adjustment towards equilibrium after any shock every year.
Table 7. Diagnostic tests R-Squared= .654 R-Bar-Squared 0.632
A:Serial Correlation CHSQ(1) 0.69101.406] B:Functional Form CHSQ(1) 2.1932[.139]
C:Normality CHSQ(2) 1.2571[.533] D:HeteroscedasticityCHSQ(1) 4.2689[.390]
A: Lagrange multiplier test of residual serial correlation; B: Ramsey’s RESET test using the square of the fitted values; C:
Based on a test of skewness and kurtosis of residuals; D: Based on the regression of squared residuals on squared fitted
values.
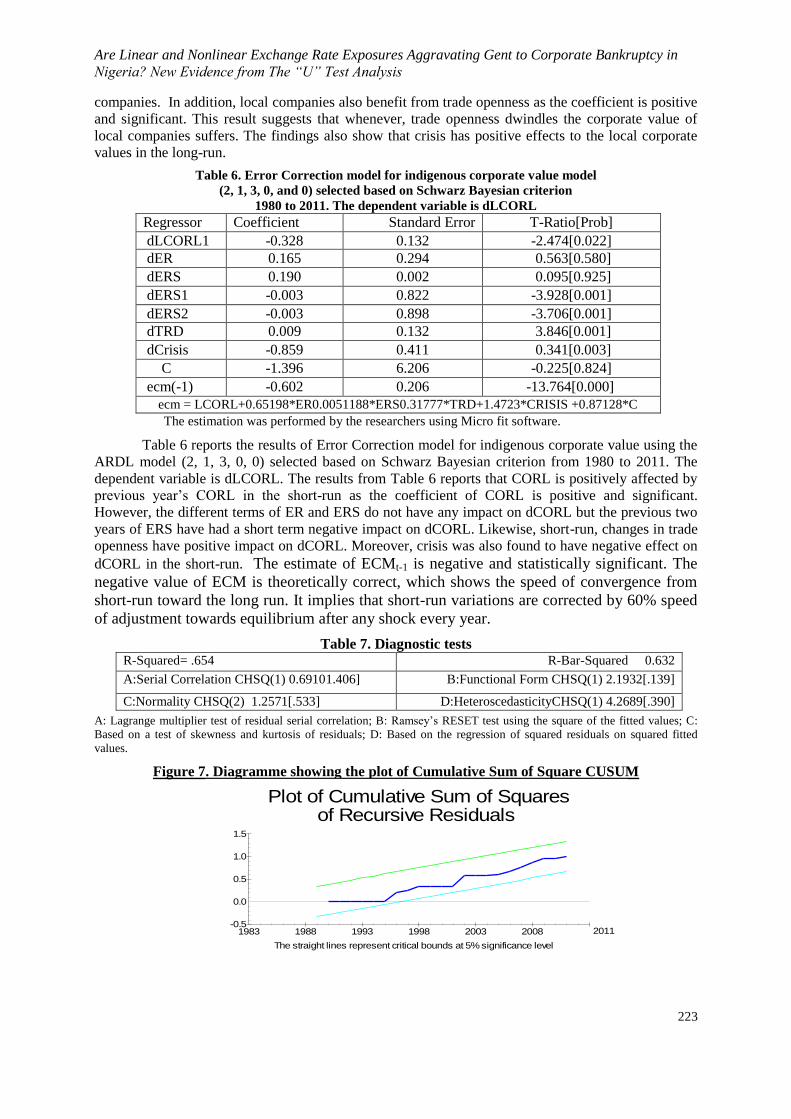
Figure 7. Diagramme showing the plot of Cumulative Sum of Square CUSUM
Plot of Cumulative Sum of Squaresof Recursive Residuals
The straight lines represent critical bounds at 5% significance level
-0.5
0.0
0.5
1.0
1.5
1983 1988 1993 1998 2003 2008 2011
International Journal of Economics and Financial Issues, Vol. 5, No. 1, 2015, pp.212-229
224
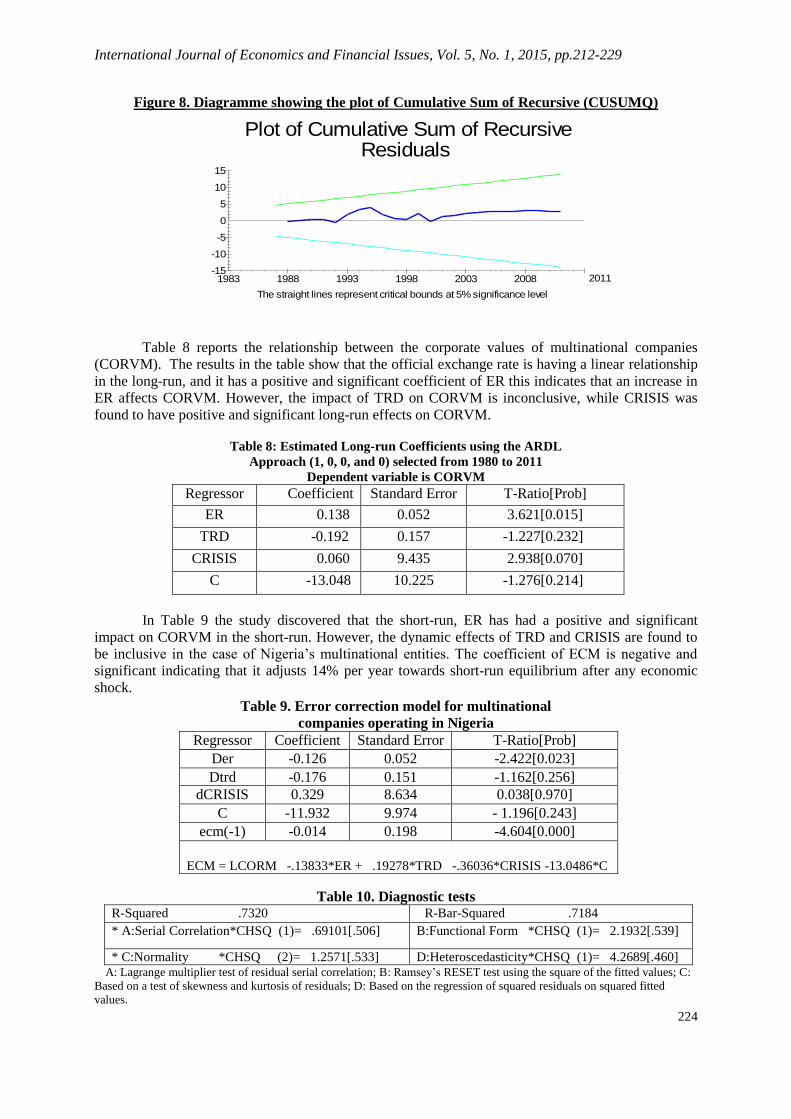
Figure 8. Diagramme showing the plot of Cumulative Sum of Recursive (CUSUMQ)
Plot of Cumulative Sum of RecursiveResiduals
The straight lines represent critical bounds at 5% significance level
-5
-10
-15
0
5
10
15
1983 1988 1993 1998 2003 2008 2011
Table 8 reports the relationship between the corporate values of multinational companies
(CORVM). The results in the table show that the official exchange rate is having a linear relationship
in the long-run, and it has a positive and significant coefficient of ER this indicates that an increase in
ER affects CORVM. However, the impact of TRD on CORVM is inconclusive, while CRISIS was
found to have positive and significant long-run effects on CORVM.
Table 8: Estimated Long-run Coefficients using the ARDL
Approach (1, 0, 0, and 0) selected from 1980 to 2011
Dependent variable is CORVM
Regressor Coefficient Standard Error T-Ratio[Prob]
ER 0.138 0.052 3.621[0.015]
TRD -0.192 0.157 -1.227[0.232]
CRISIS 0.060 9.435 2.938[0.070]
C -13.048 10.225 -1.276[0.214]
In Table 9 the study discovered that the short-run, ER has had a positive and significant
impact on CORVM in the short-run. However, the dynamic effects of TRD and CRISIS are found to
be inclusive in the case of Nigeria’s multinational entities. The coefficient of ECM is negative and
significant indicating that it adjusts 14% per year towards short-run equilibrium after any economic
shock.
Table 9. Error correction model for multinational
companies operating in Nigeria
Regressor Coefficient Standard Error T-Ratio[Prob]
Der -0.126 0.052 -2.422[0.023]
Dtrd -0.176 0.151 -1.162[0.256]
dCRISIS 0.329 8.634 0.038[0.970]
C -11.932 9.974 - 1.196[0.243]
ecm(-1) -0.014 0.198 -4.604[0.000]
ECM = LCORM -.13833*ER + .19278*TRD -.36036*CRISIS -13.0486*C
Table 10. Diagnostic tests R-Squared .7320 R-Bar-Squared .7184
* A:Serial Correlation*CHSQ (1)= .69101[.506] B:Functional Form *CHSQ (1)= 2.1932[.539]
* C:Normality *CHSQ (2)= 1.2571[.533] D:Heteroscedasticity*CHSQ (1)= 4.2689[.460] A: Lagrange multiplier test of residual serial correlation; B: Ramsey’s RESET test using the square of the fitted values; C:
Based on a test of skewness and kurtosis of residuals; D: Based on the regression of squared residuals on squared fitted
values.
Are Linear and Nonlinear Exchange Rate Exposures Aggravating Gent to Corporate Bankruptcy in
Nigeria? New Evidence from The “U” Test Analysis
225
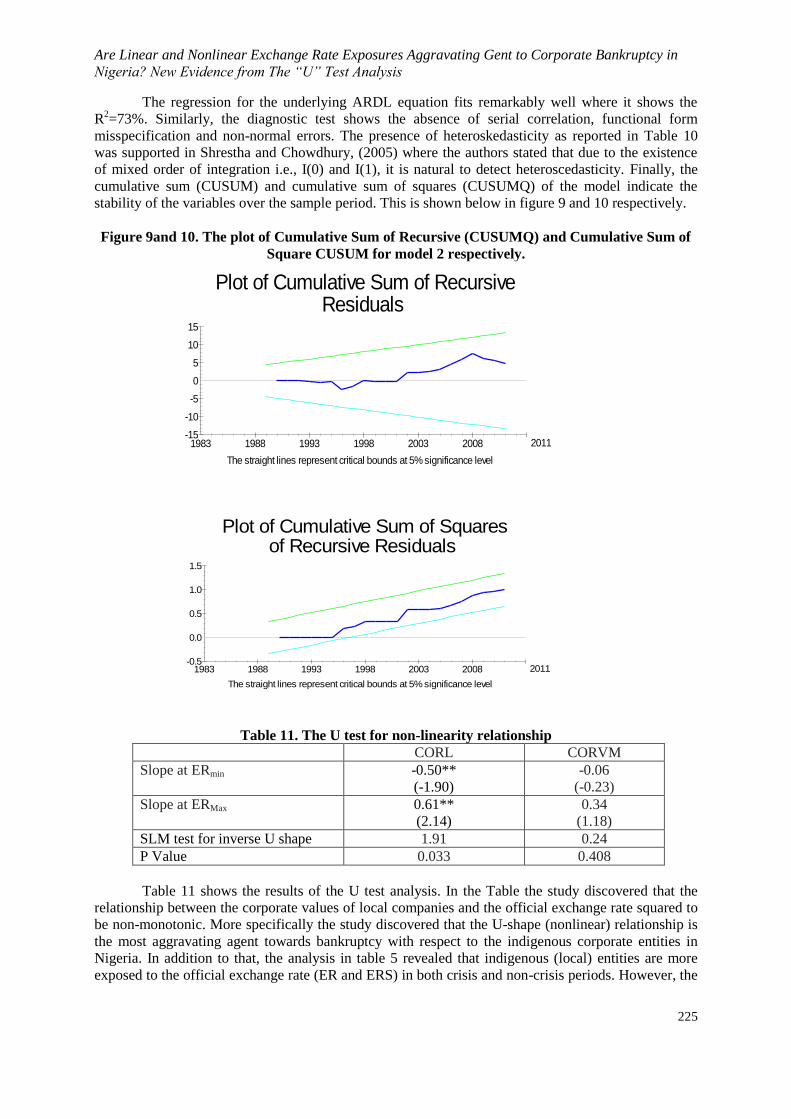
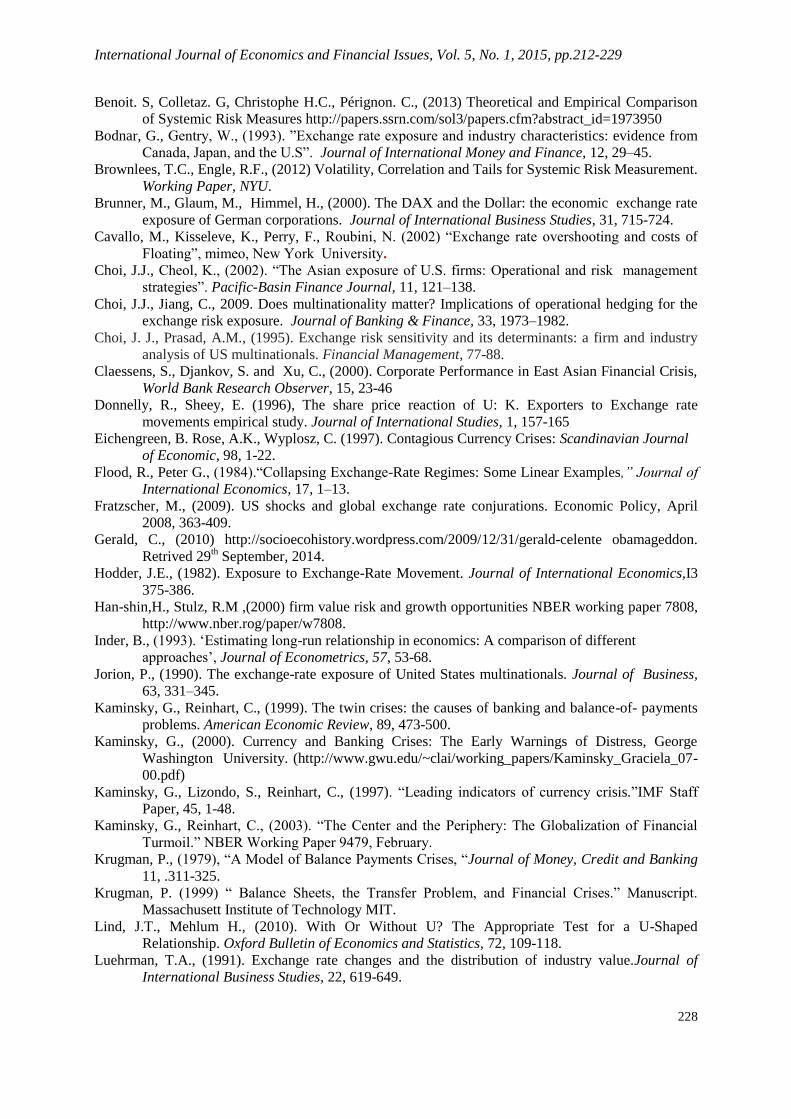
The regression for the underlying ARDL equation fits remarkably well where it shows the
R2=73%. Similarly, the diagnostic test shows the absence of serial correlation, functional form
misspecification and non-normal errors. The presence of heteroskedasticity as reported in Table 10
was supported in Shrestha and Chowdhury, (2005) where the authors stated that due to the existence
of mixed order of integration i.e., I(0) and I(1), it is natural to detect heteroscedasticity. Finally, the
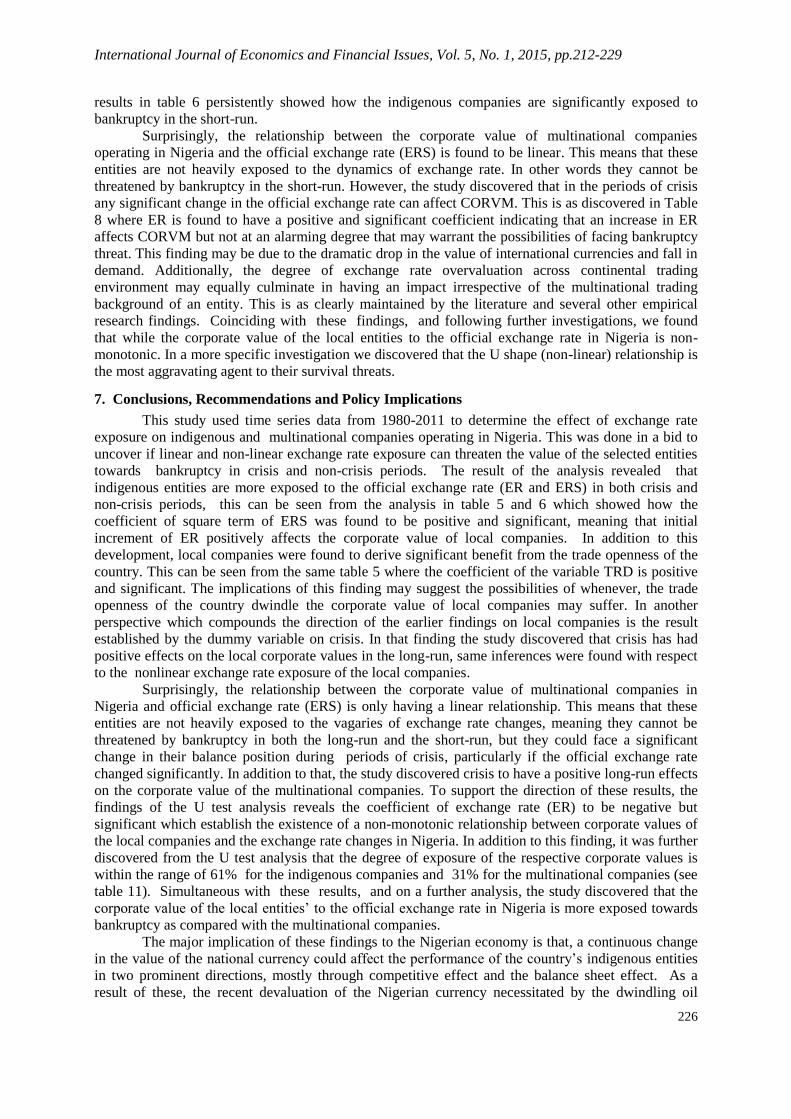
cumulative sum (CUSUM) and cumulative sum of squares (CUSUMQ) of the model indicate the
stability of the variables over the sample period. This is shown below in figure 9 and 10 respectively.
Figure 9and 10. The plot of Cumulative Sum of Recursive (CUSUMQ) and Cumulative Sum of
Square CUSUM for model 2 respectively.
Plot of Cumulative Sum of RecursiveResiduals
The straight lines represent critical bounds at 5% significance level
-5
-10
-15
0
5
10
15
1983 1988 1993 1998 2003 2008 2011
Plot of Cumulative Sum of Squaresof Recursive Residuals
The straight lines represent critical bounds at 5% significance level
-0.5
0.0
0.5
1.0
1.5
1983 1988 1993 1998 2003 2008 2011
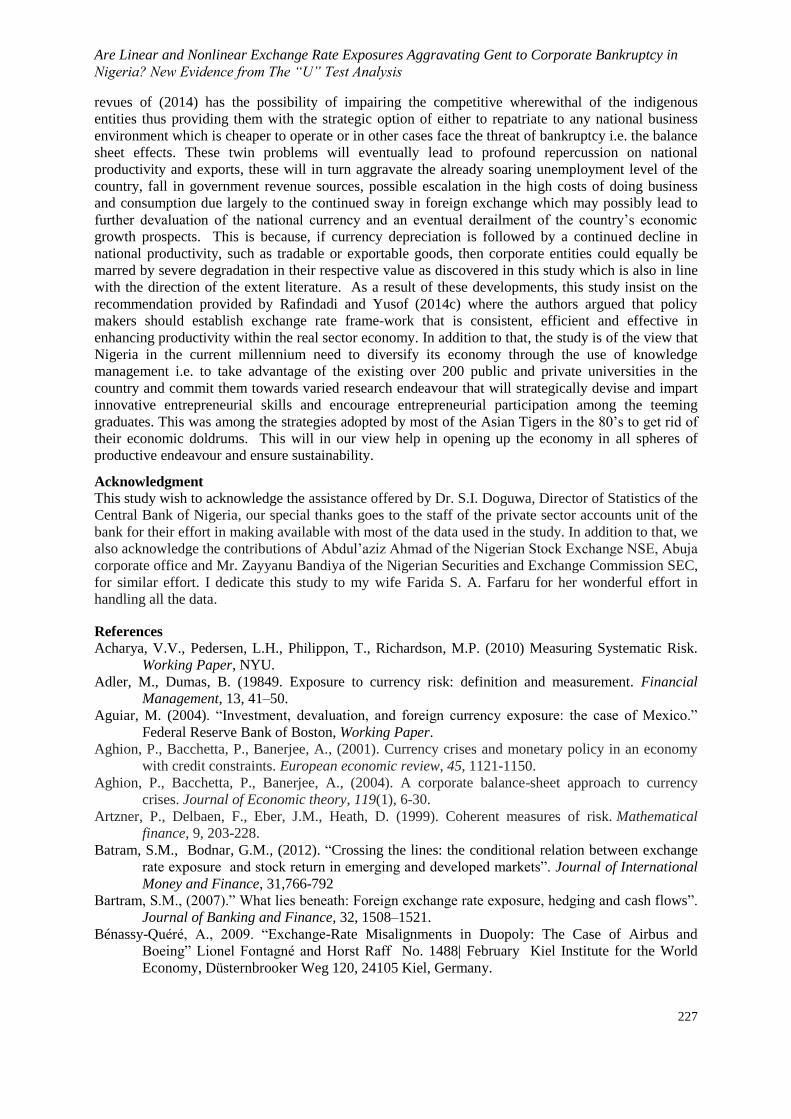
Table 11. The U test for non-linearity relationship
CORL CORVM
Slope at ERmin -0.50**
(-1.90)
-0.06
(-0.23)
Slope at ERMax 0.61**
(2.14)
0.34
(1.18)
SLM test for inverse U shape 1.91 0.24
P Value 0.033 0.408
Table 11 shows the results of the U test analysis. In the Table the study discovered that the
relationship between the corporate values of local companies and the official exchange rate squared to
be non-monotonic. More specifically the study discovered that the U-shape (nonlinear) relationship is
the most aggravating agent towards bankruptcy with respect to the indigenous corporate entities in
Nigeria. In addition to that, the analysis in table 5 revealed that indigenous (local) entities are more
exposed to the official exchange rate (ER and ERS) in both crisis and non-crisis periods. However, the
International Journal of Economics and Financial Issues, Vol. 5, No. 1, 2015, pp.212-229
226
results in table 6 persistently showed how the indigenous companies are significantly exposed to
bankruptcy in the short-run.
Surprisingly, the relationship between the corporate value of multinational companies
operating in Nigeria and the official exchange rate (ERS) is found to be linear. This means that these
entities are not heavily exposed to the dynamics of exchange rate. In other words they cannot be
threatened by bankruptcy in the short-run. However, the study discovered that in the periods of crisis
any significant change in the official exchange rate can affect CORVM. This is as discovered in Table
8 where ER is found to have a positive and significant coefficient indicating that an increase in ER
affects CORVM but not at an alarming degree that may warrant the possibilities of facing bankruptcy
threat. This finding may be due to the dramatic drop in the value of international currencies and fall in
demand. Additionally, the degree of exchange rate overvaluation across continental trading
environment may equally culminate in having an impact irrespective of the multinational trading
background of an entity. This is as clearly maintained by the literature and several other empirical
research findings. Coinciding with these findings, and following further investigations, we found
that while the corporate value of the local entities to the official exchange rate in Nigeria is non-
monotonic. In a more specific investigation we discovered that the U shape (non-linear) relationship is
the most aggravating agent to their survival threats.
7. Conclusions, Recommendations and Policy Implications
This study used time series data from 1980-2011 to determine the effect of exchange rate
exposure on indigenous and multinational companies operating in Nigeria. This was done in a bid to
uncover if linear and non-linear exchange rate exposure can threaten the value of the selected entities
towards bankruptcy in crisis and non-crisis periods. The result of the analysis revealed that
indigenous entities are more exposed to the official exchange rate (ER and ERS) in both crisis and
non-crisis periods, this can be seen from the analysis in table 5 and 6 which showed how the
coefficient of square term of ERS was found to be positive and significant, meaning that initial
increment of ER positively affects the corporate value of local companies. In addition to this
development, local companies were found to derive significant benefit from the trade openness of the
country. This can be seen from the same table 5 where the coefficient of the variable TRD is positive
and significant. The implications of this finding may suggest the possibilities of whenever, the trade
openness of the country dwindle the corporate value of local companies may suffer. In another
perspective which compounds the direction of the earlier findings on local companies is the result
established by the dummy variable on crisis. In that finding the study discovered that crisis has had
positive effects on the local corporate values in the long-run, same inferences were found with respect
to the nonlinear exchange rate exposure of the local companies.
Surprisingly, the relationship between the corporate value of multinational companies in
Nigeria and official exchange rate (ERS) is only having a linear relationship. This means that these
entities are not heavily exposed to the vagaries of exchange rate changes, meaning they cannot be
threatened by bankruptcy in both the long-run and the short-run, but they could face a significant
change in their balance position during periods of crisis, particularly if the official exchange rate
changed significantly. In addition to that, the study discovered crisis to have a positive long-run effects
on the corporate value of the multinational companies. To support the direction of these results, the
findings of the U test analysis reveals the coefficient of exchange rate (ER) to be negative but
significant which establish the existence of a non-monotonic relationship between corporate values of
the local companies and the exchange rate changes in Nigeria. In addition to this finding, it was further
discovered from the U test analysis that the degree of exposure of the respective corporate values is
within the range of 61% for the indigenous companies and 31% for the multinational companies (see
table 11). Simultaneous with these results, and on a further analysis, the study discovered that the
corporate value of the local entities’ to the official exchange rate in Nigeria is more exposed towards
bankruptcy as compared with the multinational companies.
The major implication of these findings to the Nigerian economy is that, a continuous change
in the value of the national currency could affect the performance of the country’s indigenous entities
in two prominent directions, mostly through competitive effect and the balance sheet effect. As a
result of these, the recent devaluation of the Nigerian currency necessitated by the dwindling oil
Are Linear and Nonlinear Exchange Rate Exposures Aggravating Gent to Corporate Bankruptcy in
Nigeria? New Evidence from The “U” Test Analysis
227
revues of (2014) has the possibility of impairing the competitive wherewithal of the indigenous
entities thus providing them with the strategic option of either to repatriate to any national business
environment which is cheaper to operate or in other cases face the threat of bankruptcy i.e. the balance
sheet effects. These twin problems will eventually lead to profound repercussion on national
productivity and exports, these will in turn aggravate the already soaring unemployment level of the
country, fall in government revenue sources, possible escalation in the high costs of doing business
and consumption due largely to the continued sway in foreign exchange which may possibly lead to
further devaluation of the national currency and an eventual derailment of the country’s economic
growth prospects. This is because, if currency depreciation is followed by a continued decline in
national productivity, such as tradable or exportable goods, then corporate entities could equally be
marred by severe degradation in their respective value as discovered in this study which is also in line
with the direction of the extent literature. As a result of these developments, this study insist on the
recommendation provided by Rafindadi and Yusof (2014c) where the authors argued that policy
makers should establish exchange rate frame-work that is consistent, efficient and effective in
enhancing productivity within the real sector economy. In addition to that, the study is of the view that
Nigeria in the current millennium need to diversify its economy through the use of knowledge
management i.e. to take advantage of the existing over 200 public and private universities in the
country and commit them towards varied research endeavour that will strategically devise and impart
innovative entrepreneurial skills and encourage entrepreneurial participation among the teeming
graduates. This was among the strategies adopted by most of the Asian Tigers in the 80’s to get rid of
their economic doldrums. This will in our view help in opening up the economy in all spheres of
productive endeavour and ensure sustainability.
Acknowledgment
This study wish to acknowledge the assistance offered by Dr. S.I. Doguwa, Director of Statistics of the
Central Bank of Nigeria, our special thanks goes to the staff of the private sector accounts unit of the
bank for their effort in making available with most of the data used in the study. In addition to that, we
also acknowledge the contributions of Abdul’aziz Ahmad of the Nigerian Stock Exchange NSE, Abuja
corporate office and Mr. Zayyanu Bandiya of the Nigerian Securities and Exchange Commission SEC,
for similar effort. I dedicate this study to my wife Farida S. A. Farfaru for her wonderful effort in
handling all the data.
References
Acharya, V.V., Pedersen, L.H., Philippon, T., Richardson, M.P. (2010) Measuring Systematic Risk.
Working Paper, NYU.
Adler, M., Dumas, B. (19849. Exposure to currency risk: definition and measurement. Financial
Management, 13, 41–50.
Aguiar, M. (2004). “Investment, devaluation, and foreign currency exposure: the case of Mexico.”
Federal Reserve Bank of Boston, Working Paper.
Aghion, P., Bacchetta, P., Banerjee, A., (2001). Currency crises and monetary policy in an economy
with credit constraints. European economic review, 45, 1121-1150.
Aghion, P., Bacchetta, P., Banerjee, A., (2004). A corporate balance-sheet approach to currency
crises. Journal of Economic theory, 119(1), 6-30.
Artzner, P., Delbaen, F., Eber, J.M., Heath, D. (1999). Coherent measures of risk. Mathematical
finance, 9, 203-228.
Batram, S.M., Bodnar, G.M., (2012). “Crossing the lines: the conditional relation between exchange
rate exposure and stock return in emerging and developed markets”. Journal of International
Money and Finance, 31,766-792
Bartram, S.M., (2007).” What lies beneath: Foreign exchange rate exposure, hedging and cash flows”.
Journal of Banking and Finance, 32, 1508–1521.
Bénassy-Quéré, A., 2009. “Exchange-Rate Misalignments in Duopoly: The Case of Airbus and
Boeing” Lionel Fontagné and Horst Raff No. 1488| February Kiel Institute for the World
Economy, Düsternbrooker Weg 120, 24105 Kiel, Germany.
International Journal of Economics and Financial Issues, Vol. 5, No. 1, 2015, pp.212-229
228
Benoit. S, Colletaz. G, Christophe H.C., Pérignon. C., (2013) Theoretical and Empirical Comparison
of Systemic Risk Measures http://papers.ssrn.com/sol3/papers.cfm?abstract_id=1973950
Bodnar, G., Gentry, W., (1993). ”Exchange rate exposure and industry characteristics: evidence from
Canada, Japan, and the U.S”. Journal of International Money and Finance, 12, 29–45.
Brownlees, T.C., Engle, R.F., (2012) Volatility, Correlation and Tails for Systemic Risk Measurement.
Working Paper, NYU.
Brunner, M., Glaum, M., Himmel, H., (2000). The DAX and the Dollar: the economic exchange rate
exposure of German corporations. Journal of International Business Studies, 31, 715-724.
Cavallo, M., Kisseleve, K., Perry, F., Roubini, N. (2002) “Exchange rate overshooting and costs of
Floating”, mimeo, New York University.
Choi, J.J., Cheol, K., (2002). “The Asian exposure of U.S. firms: Operational and risk management
strategies”. Pacific-Basin Finance Journal, 11, 121–138.
Choi, J.J., Jiang, C., 2009. Does multinationality matter? Implications of operational hedging for the
exchange risk exposure. Journal of Banking & Finance, 33, 1973–1982.
Choi, J. J., Prasad, A.M., (1995). Exchange risk sensitivity and its determinants: a firm and industry
analysis of US multinationals. Financial Management, 77-88.
Claessens, S., Djankov, S. and Xu, C., (2000). Corporate Performance in East Asian Financial Crisis,
World Bank Research Observer, 15, 23-46
Donnelly, R., Sheey, E. (1996), The share price reaction of U: K. Exporters to Exchange rate
movements empirical study. Journal of International Studies, 1, 157-165
Eichengreen, B. Rose, A.K., Wyplosz, C. (1997). Contagious Currency Crises: Scandinavian Journal
of Economic, 98, 1-22.
Flood, R., Peter G., (1984).“Collapsing Exchange-Rate Regimes: Some Linear Examples,” Journal of
International Economics, 17, 1–13.
Fratzscher, M., (2009). US shocks and global exchange rate conjurations. Economic Policy, April
2008, 363-409.
Gerald, C., (2010) http://socioecohistory.wordpress.com/2009/12/31/gerald-celente obamageddon.
Retrived 29th September, 2014.
Hodder, J.E., (1982). Exposure to Exchange-Rate Movement. Journal of International Economics,I3
375-386.
Han-shin,H., Stulz, R.M ,(2000) firm value risk and growth opportunities NBER working paper 7808,
http://www.nber.rog/paper/w7808.
Inder, B., (1993). ‘Estimating long-run relationship in economics: A comparison of different
approaches’, Journal of Econometrics, 57, 53-68.
Jorion, P., (1990). The exchange-rate exposure of United States multinationals. Journal of Business,
63, 331–345.
Kaminsky, G., Reinhart, C., (1999). The twin crises: the causes of banking and balance-of- payments
problems. American Economic Review, 89, 473-500.
Kaminsky, G., (2000). Currency and Banking Crises: The Early Warnings of Distress, George
Washington University. (http://www.gwu.edu/~clai/working_papers/Kaminsky_Graciela_07-
00.pdf)
Kaminsky, G., Lizondo, S., Reinhart, C., (1997). “Leading indicators of currency crisis.”IMF Staff
Paper, 45, 1-48.
Kaminsky, G., Reinhart, C., (2003). “The Center and the Periphery: The Globalization of Financial
Turmoil.” NBER Working Paper 9479, February.
Krugman, P., (1979), “A Model of Balance Payments Crises, “Journal of Money, Credit and Banking
11, .311-325.
Krugman, P. (1999) “ Balance Sheets, the Transfer Problem, and Financial Crises.” Manuscript.
Massachusett Institute of Technology MIT.
Lind, J.T., Mehlum H., (2010). With Or Without U? The Appropriate Test for a U-Shaped
Relationship. Oxford Bulletin of Economics and Statistics, 72, 109-118.
Luehrman, T.A., (1991). Exchange rate changes and the distribution of industry value.Journal of
International Business Studies, 22, 619-649.
Are Linear and Nonlinear Exchange Rate Exposures Aggravating Gent to Corporate Bankruptcy in
Nigeria? New Evidence from The “U” Test Analysis
229
Merali, Y., (2009) http://aidontheedge.info/2009/12/16/bank-of-england-director-uses- complexity-
theory-to-explain-global-financial crisis/
Miller, K.D., Reuer, J.J., (1998). Firm Strategy and Economic Exposure to Foreign Exchange Rate
Movements. Journal of International Business Studies, 29, 493-513
Obstfeld, M., (1994). The logic of currency crises, Cahiers Economiques et Monetaires . Banque de
France 43, 189-213.
Prasetyantoko, A., (2007). "Debt Composition and Balance Sheet Effect of Currency Crisis in
Indonesia “MPRA Paper 6501, University Library of Munich, Germany.
Priestley, R., Ødegaard, B. A., (2007). Linear and nonlinear exchange rate exposure. Journal of
International Money and Finance, 26, 1016-1037.
Pesaran, M.H., Shin, Y., Smith, R.J., (2001). Bounds Testing Approaches to the Analysis of Level
Relationships. Journal of Applied Econometrics, 16, 289-326.
Pesaran, M. H., Pesaran, B., (1997).Working with Microfit 4.0: Interactive econometric analysis,
Oxford University Press, Oxford.
Rafindadi, A.A., Yusof, Z., (2014a). Are the Periods of Currency Collapse an Impediment to
Entrepreneurship and Entrepreneurial Haven? Evidence from Regional Comparison.
International Journal of Economics and Financial Issues, 4, 886-908.
Rafindadi, A.A., Yusof, Z., (2014b). An Econometric Estimation and Prediction of the Effects of
Nominal Devaluation on Real Devaluation: Does the Marshal-Lerner (ML) Assumptions Fits
in Nigeria? International Journal of Economics and Financial Issues, 4, 819-835.
Rafindadi, A.A.,Yusof, Z., (2014c). Do the dynamics of financial development spur economic growth
in Nigeria’s contemporal growth struggle? A fact beyond the figures. Quality & Quantity, 1-
20. DOI: 10.1007/s11135-014-9991-0
Shapiro, A.C., (1975). Exchange rate changes, inflation, and the value of the multinational
corporation. The Journal of Finance, 30, 485-502.
Sheng, A., Kwek, K.T., (2012) Managing a Whale of a Risk in Modern Financial Networks. The 13th
International Convention of the East Asian Economic Association Convention Theme:
"Opportunities and Challenges for Asian Economies in the New Millennium",19-20 October ,
Singapore.
Shrestha, M.B., Chowdhury, K., (2005) ARDL Modeling Approach to Testing the Financial
Liberalisation Hypothesis, Department of Economics, University of Wollongong,
http://ro.uow.edu.au/commwkpapers/121.
Simbanegavi, W., Floden, M., Wilander, F., (2008). When is a lower exchange rate pass-through
associated with greater exchange rate exposure? Journal of International Money and Finance,
27, 124-139.
Walters, J.E., (1957). The Determination of Technical Solvency. Journal of Business, 30, 30-45.