Embed Size (px)
Citation preview
IIM/LMP 8 7 - 8
An Essay on Exchange Rate Dynamics
Stephan Schulmeister
Ju li 1987
ISSN Nr. 0722-673X
discussion papers
Forschungsschwerpunkt Arbeitsmarkt und Beschäftigung (IIMV)
Research Unit Labour Market and Employment (IIM)
AbstractThere is rarely another field in economics where the prevailing theoretical models have been contradicted so strongly by the empirical evidence as exchange rate economics. This study therefore attempts to investigate exchange rate dynamics in an exploratory way. It is first demonstrated that the exchange rate does not follow a random walk as often postulated. There exists a systematic pattern in the process of exchange rate determination which at the same time does not conform to economic theory. In order to detect this pattern, the "gestalt" of exchange rate fluctuations is carefully explored. It is shown that a sequence of upward or downward price runs interrupted by some erratic fluctuations is most typical for exchange rate dynamics in the short run. Since such a pattern can be systematically exploited by certain trading rules, the importance of "technical analysis" for the expectations formation and consequently the determination of exchange rates is examined. It turns out that the trading rules implied by technical analysis, which are actually employed in the market, have systematically produced extra profits over the whole period without any relevant risk. The second part of the study focuses on the medium-term fluctuations in exchange rate dynamics. It is argued that these fluctuations can be explained as the result of interacting disequilibria in the goods market and the asset market wherein the exchange rate fluctuates around the purchasing power parity as its "center of gravity" without any tendency of convergence, i.e., towards a stable equilibrium. The study concludes with a discussion on the theoretical foundations of exchange rate instability.
ZusammenfassungIn kaum einem anderen Bereich der Wirtschaftswissenschaften sind die Widersprüche zwischen den Aussagen der theoretischen Modelle und der empirischen Evidenz so ausgeprägt wie im Bereich der Wechselkurse. Die vorliegende Studie unternimmt daher den Versuch, die Ursachen der Wechselkursschwankungen auf induktivem Weg herauszuarbeiten. Zunächst wird gezeigt, daß die Entwicklung der Wechselkurse keinem Zufallsprozeß entspricht, also ein systematisches Muster aufweist, das freilich nicht jenem der Theorien entspricht. In einem ersten Schritt werden daher die systematischen Komponenten der Wechselkursdynamik herausgearbeitet. Es wird gezeigt, daß das spezifische Muster der kurzfristigen Kursschwankungen eine systematisch profitable Devisenspekulation ermöglicht, und zwar aufgrund von Verfahren der "technical analysis". Umgekehrt wirkt die Anwendung dieser Spekulationstechniken auf das Preismuster verstärkend zurück. Im zweiten Teil der Studie wird gezeigt, daß die mittelfristigen Dollarkursschwankungen aus dem Zusammenwirken von Ungleichgewichten auf den Gütermärkten und den Finanzmärkten erklärt werden können. Abschließend werden jene Faktoren theoretisch herausgearbeitet, die erklären, warum die Wechselkurse in mehrjährigen Zyklen um die Kaufkraftparität als ihrem "Gravitationszentrum" schwanken, ohne gegen diesen langfristigen Gleichgewichtswert zu konvergieren.
An Essay on Exchange Rate Dynamics
I. Exchange Rate Movements and the Movements of Exchange Rate Theorizing
II. Overview of the StudyIII. Does the Exchange Rate Follow a Random Walk?IV. Some Aspects of the "Gestalt" of Exchange Rate FluctuationsV. Exchange Rate Dynamics in the Short Run
Empirical Evidence 1980 - 1986Technical Analysis and Exchange Rate InstabilityExpectation Formation and Determination of Exchange Rates in the Short RunThe Winners and the Losers in the Currency Game
VI. Exchange Rate Dynamics in the Medium RunEmpirical Evidence 1973 - 1986The Interaction of the Goods Market and the Asset MarketComparison of the Exchange Rate Dynamics in the Short Run and in the Medium Run
VII. The Theoretical Foundations of Exchange Rate InstabilityRational Expectations Formation and Rational Theory FormationExchange Rates and Interest RatesThe Issue of Destabilizing Currency Speculation and of Market EfficiencyGoods Market, Asset Market, and the Fundamental Indeterminacy of Exchange Rates
VIII. Conclusions
Stephan SchulmeisterAustrian Institute of Economic Research P.0.Box 91A-1103 Vienna/Austria
Stephan Schulmeister
An Essay on Exchange Rate Dynamics*
I. Exchange Rate Movements and the Movements of Exchange RateTheorizing
It seems that we witness the last phase of a Kondratieff cycle in the experience and reflection of exchange rate (in)stability. The analysis of the interwar period (Nurkse, 1944) stressed the need to ensure stable exchange rates through international coordination. This was achieved by the system established in Bretton Woods. There were some opponents to this system, however, who advocated a complete liberalization of the goods and financial markets. They argued that a system of flexible exchange rates would better solve the adjustment problems through an increase in the autonomy and efficiency of monetary policy (Friedman, 1953; Sohmen, 1961, among others). Destabilizing currency speculation as ascertained by Nurkse
*This essay was developed in two stages: during a sabbatical term as visiting scholar at New York University in spring 1983 and during a stay as visiting fellow at the Wissenschaftszentrum Berlin für Sozialforschung in the winter of 1986/87. I am heavily indebted to both institutions for their stimulating hospitality and for their financial support (in the case of the Wissenschaftszentrum) . All of the empirical work was done at my "home" institute, the Austrian Institute of Economic Research (WIFO).Many people have contributed to the development of this essay, though in very different ways: Kurt Bayer, Alois M. Becker, Tamara Eisikovic-Guttmann, Will and Lilian Davis, Peter Fischer-Erlach, Michael Funke, Robby Guttmann, Franz. Hahn, Heinz Handler, Walter Haines, Johannes Haushofer, Rolf Hengsteler, Hansjörg Herr, Charles P. Kindleberger, Wolfgang Klameth, Helmut Kramer, Egon Matzner, Peter Mooslechner, Kurt W. Rothschild, Andreas Ryll, Stefan Schleicher, Wolfgang Schröder, Jeffrey Shafer, Hans-Peter Spahn, Josef Steindl, Erich Streissler, Peter Szopo, Dieter Wermuth.
2
(1944) for the 1920's was considered a theoretical and consequently a practical impossibility since it would be self-eliminating (Friedman, 1953). By the end of the 1960's the majority of academic economists were convinced of the superiority of flexible exchange rates (thus Sohmen dropped the subtitle "Theory and Controversy" in the second edition of his book in 1969).
The developments since the collapse of the Bretton Woods system, however, have not followed the profession's expectations. On the contrary, the gap between exchange rate theories and the empirical evidence seems to have progressively widened. This is despite the fact that the profession has tried vigorously to keep pace with reality by adapting existing theories to the most recent and severe abnormally (adaptive theorizing). First, the deviations from the equilibrium condition in the goods market (purchasing power parity) proved to be greater than could be expected given the simple monetary model. This lack of efficacy was accounted for and explained by the overshooting model (Dornbusch, 1976). Second, the equilibrium condition in the asset market (uncovered interest parity) was continually
I am particularly grateful to Eva Horvath who did all of the statistical work with patience and engagement at the same time. Thanks go to Marianne Riese for writing the program for the analysis of the profitability of the technical trading rules. Erna Kernreich typed the manuscript carefully and energetically (i.e., in a very short time).Nobody has contributed more to this essay than Michael Goldberg (New York University); he provided essential ideas like the "expectational bias", he discussed with me every single aspect of this essay, he corrected the manuscript and he urged me on when I felt like giving up. However, he can not be held reponsible for every single aspect of this study (this concerns especially section VII).Last but not least: Ruth von Bonin.
3
violated (for a survey see Cumby and Obstfeld, 1984; Boothe and Longworth, 1986). This deviation could not be explained endogenously since it would have implied inefficient markets or nonrational expectations. Two adaptations were therefore offered which preserved economists' predilection for market efficiency and rational expectations; the role of the "news'1 and a time-varying risk premium. However, the appreciation of the dollar together with a positive dollar interest differential relative to the other reserve currencies was much too strong and too persistent to be explained by either concept (for the "news" explanation see Hoffman and Schlagenhauf, 1985; for the risk premium story see Frankel, 1986). Since all structural exchange rate models are based on the assumption of purchasing power parity (sometimes relaxed by the assumption of sticky prices), uncovered interest parity, rational expectations, and - in the case of the portfolio balance models - a risk premium, they performed poorly when tested empirically (Meese and Rogoff, 1983, 1985; Van der Kraats and Boothe, 1983; Backus, 1984; Frankel, 1984; Isard, 1987; Alexander and Thomas, 1987).
One consequence of the poor econometric performance was to consider the exchange rate as following a random walk (Meese and Rogoff, 1983, 1985; Backus, 1984). However, the almost monotonic path of the rise of the dollar 1980/1985 and particularly of its fall shed considerable doubts on the random walk hypothesis. This experience rendered the concept of bubbles - as a process of self-fulfilling expectations - fashionable in exchange rate theorizing. Some economists found support for the hypothesis that the dollar had been on a stochastic rational bubble, thus saving the assumption of rational expectations (Woo, 1984; Meese, 1986; Borensztein, 1987). Other economists, however, questioned such an approach on theoretical grounds (Obstfeld and Rogoff, 1985), on methodological grounds (Hamilton and Whiteman, 1985) as well as on empirical grounds (Frankel, 1985). Other studies have concluded from empirical surveys on exchange rate expectations that the hypothesis of rational expectations has to
4
be rejected (Dominguez, 1986; Frankel and Froot, 1986A) and that the dollar has been on a non-rational bubble (Frankel and Froot, 1986B). A similar interpretation had been suggested by Schulmeister (1983) and Evans (1986) based on the high and persistent extra profits on dollar assets in the early 1980’s. This conclusion, however, casts doubt on equilibrium economics and/or the rational expectations hypothesis in general since rarely does a market fit the theoretical requirements of a perfect market as well as that for foreign exchange.
In short, exchange rate theory is in a state of crisis in the sense of Kuhn (1962); the old '’paradigm” is progressively contradicted by the discovery of anomalies (notwithstanding several adjustments), but a novel theory has not yet emerged.
II. Overview of The Study
In order to explore the process of exchange rate determination in detail, the study is restricted to the two most traded currencies, namely the US dollar and the deutschemark. It covers the period from March 1973 to October 1986.
It is first demonstrated that the exchange rate does not follow a random walk as often postulated. There exists a systematic pattern in the process of exchange rate determination which at the same time does not conform to economic theory. In order to detect this pattern, the "gestalt" of exchange rate fluctuations is carefully explored. It is shown that a sequence of upward or downward price runs interrupted by some erratic fluctuations is most typical for exchange rate dynamics in the short run. Since such a pattern can be systematically exploited by certain trading rules, the importance of "technical analysis" for the expectations formation and consequently the determination of exchange rates is examined. It turns out that the trading rules implied by technical analysis, which are actually employed in the market, have systematically produced extra profits over the
5
whole period without any relevant risk. The second part of the study focuses on the medium-term fluctuations in exchange rate dynamics. It is argued that these fluctuations can be explained as the result of interacting disequilibria in the goods market and the asset market wherein the exchange rate fluctuates around the purchasing power parity as its "center of gravity" without any tendency of convergence, i.e., towards a stable equilibrium. The study concludes with a discussion on the theoretical foundations of exchange rate instability.
Ill. Does the Exchange Rate Follow a Random Walk?
One position in the adjustment process of exchange rate theorizing has been the contention that the exchange rate follows (approximately) a random walk (Mussa, 1979). Even though direct statistical tests for the most part have rejected this hypothesis, particularly for the most traded DM/$ rate (Poole, 1967; Dooley and Shafer, 1976, 1983; Burt, Kaen and Booth, 1977; Cornell and Dietrich, 1978; Tse, 1986) the random walk has remained popular for two reasons. First, because the forecasting performance of the random walk "model" compared favourably to the performance of the structural models, the former often outperforming the latter (Meese and Rogoff, 1983, 1985; Backus, 1984; Alexander and Thomas, 1987). This result, however, is more of a statement about the weakness of the structural models than about the relevance of the random walk hypothesis. Hence the second reason for the random walk's popularity seems to be the more important of the two: since the hypothesis of market efficiency had to be rejected in its semi-strong form as defined by Fama, 1970 (the deviations of exchange rates from uncovered interest parity were too strong to be explained by a time-varying risk premium), the random walk assumption would save market efficiency at least in its weak form (i.e., no extra profits can be earned by exploiting information about past exchange rate values). It therefore seems desirable as a point of departure to test the random walk hypothesis for the whole
D ic k e v - F u lle r - T e s t o f th e Random Walk Model U sing th e L in e a r R e g re ss io n
T a b le 1
= a+b TIME + c s t - i
( s t . . . lo g o f th e DM/$ exchange ra te )
M onthly Data(a d ju ste d f o r in t e r e s t ra te d i f f e r e n t ia l )
a b c R2 D W - s ta t is t ic F - s t a t i s t i c
1973/03-1986/09 0.03107 ( 1.92)
0.00004 ( 0.75)
0.96448(-1 .93)
0.95 1.95 6.04*)
1973/03-1980/09 0.11231 ( 2.50)
-0.00063(-2 .0 5 ,
0.85801(-2 .60)
0.95 1.74 7.71*)
1980/09-1985/02 0.19565 ( 2.70)
0.00148 ( 2.22)
0.80003(-2 .52)
0.96 1.67 62.10*)
1985/02-1986/09 0.89133 ( 4 .18)*)
-0.02483(-4 .1 8 )* )
0.04297(-4 .23 )* )
0.97 0.89 77.80*)
1980/09-1986/09 0.01457 ( 0.47)
-0 .00061(-2 .79 )
0.98975(-0 .30)
(unadjusted)
0.94 1.97 42.39*)
1973/03-1986/09 0.02298 ( I - « )
0.00002 ( 0.29)
0.97078(-1 .59)
0.95 1.98 6.44*)
1973/03-1980/09 0.10988 ( 2.44)
-0 .00071(-2 .2 8 )
0.85861(-2 .58)
0.95 2.01 8.67*)
1980/09-1985/02 0.19432 ( 2.70)
0.00152 ( 2.30)
0.79708(-2 .57)
0.96 1.66 61.92*)
1985/02-1986/09 0.88258 ( 4 .00)*)
-0 .02464(-4 .1 2 )* )
0.04965(-4 .21 )* )
0.97 1.78 76.27*)
1980/09-1986/09 0.01237 ( 0.40)
-0 .00057(-2 .6 3 )
0.98823(-0 .35)
D a ily Pata (unadjusted)
0.94 2.14 42.93*)
1973/04/02-1980/10/08 0.02445 ( 2.04)
-0 .00000(-1 .8 0 )
0.99544(-2 .06)
1.00 1.93 59.40*)
1980/10/08-1985/03/06 0.07506 ( 2.78)
0.00000 ( 2 .54)
0.98651(-2 .79)
1.00 2.10 39.99*)
1985/03/06-1986/09/19 0.35554 ( 3 .70)*)
-0 .00008(-3 .5 2 )* )
0.93560(-3 .66)
1.00 1.92 308.51*)
1980/10/08-1986/09/19
The t - s t a t i s t i c s (and
0.00529 ( 0.53)
F - s t a t i s t i c s )
-0 .00000(-2 .5 5 )
a re c a lc u la t e d
0.99906 1.00(-0 .52)
fo r th e h y p o th e s ize d
2.06 35.20*)
v a lu e s o f ze ro f o r a and b , and 1 f o r c . The s u p e r s c r ip t *) denotes r e je c t io n o f th e random w alk h y p o th e s is a t th e 95% le v e l .
6
period of floating rates (also because the most recent test for the reserve currencies covers only the period up to November 1981 - see Dooley and Shafer, 1983).
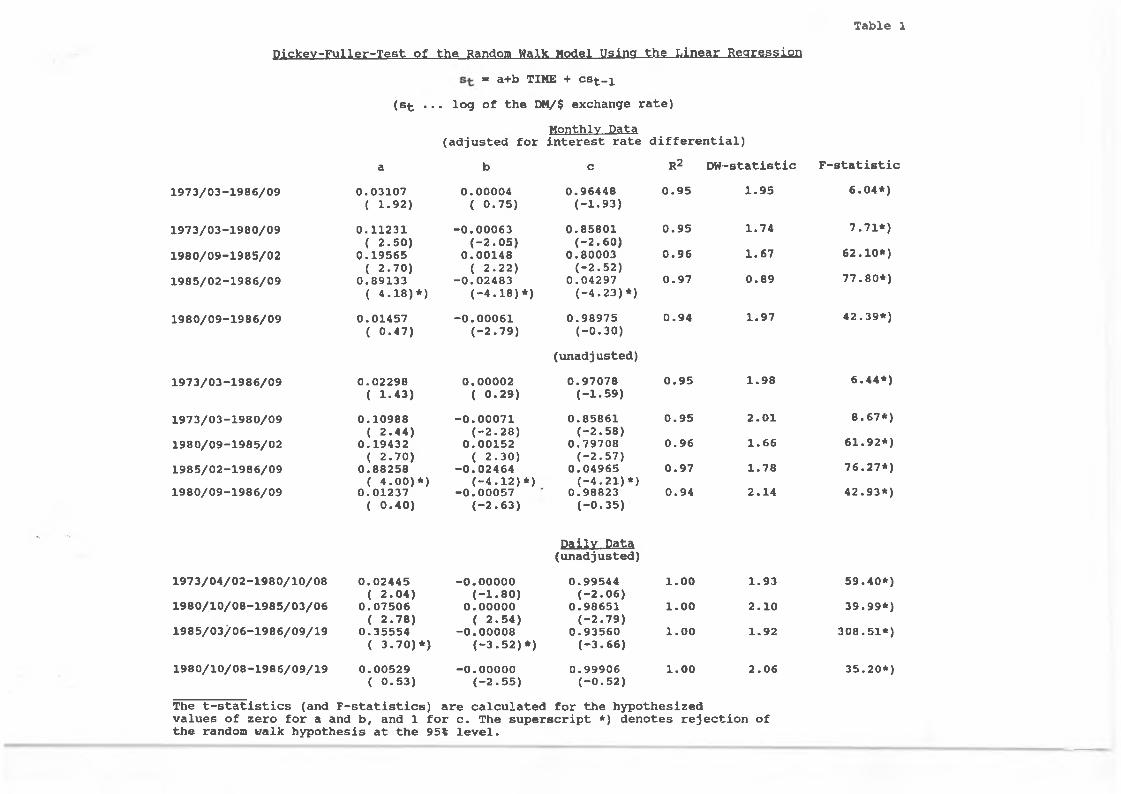
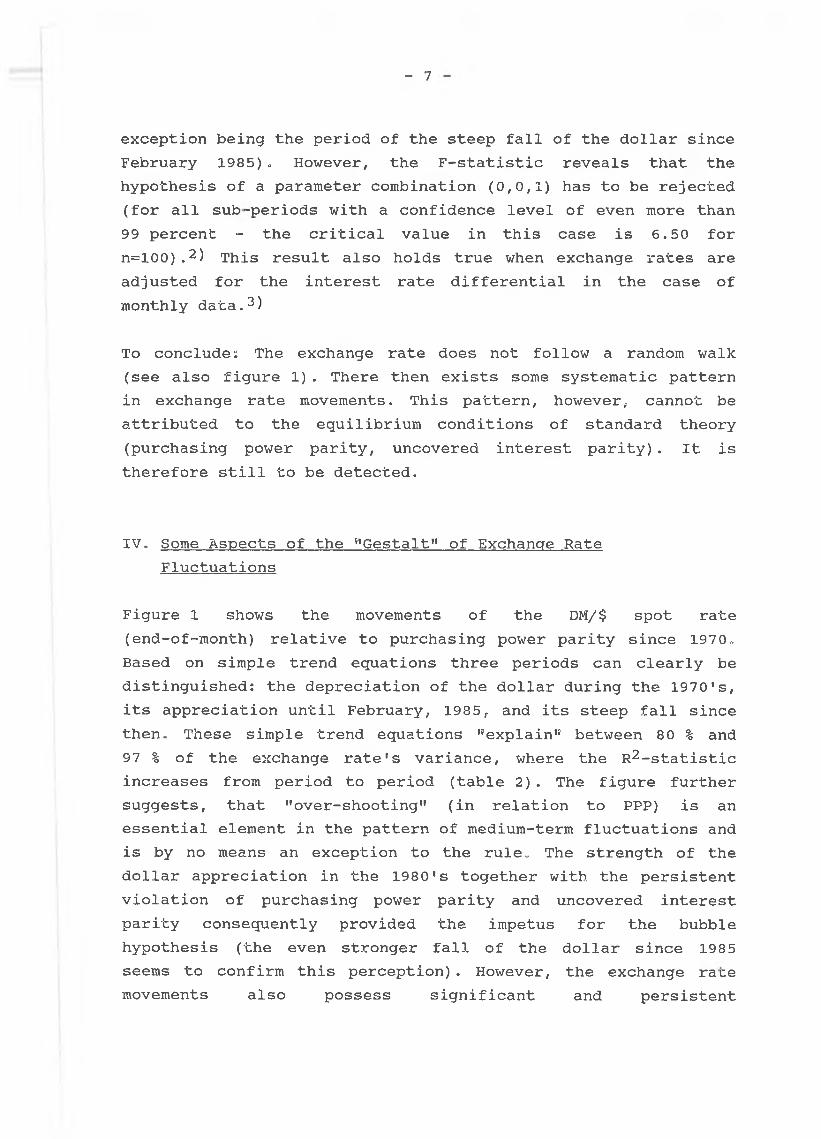
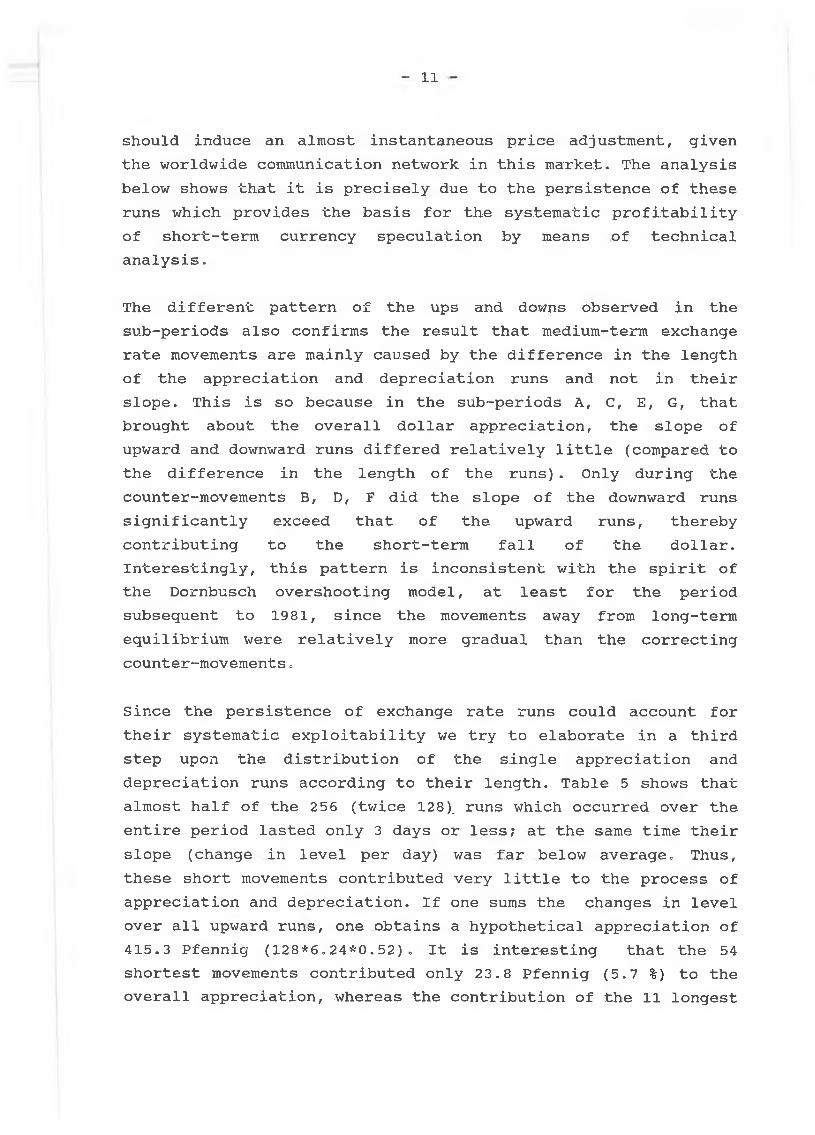
Dickey and Fuller (1979) have developed a test for the random walk hypothesis s-t=st-i+u-t. (where u- is white noise) that is more powerful than the usual Q-statistic (for a comparison see Dickey and Fuller, 1981) . The test is based on the linear regression model st=a+b TIME+cs-t-i+u-t where TIME is a trend variable with zero sample mean and u^ is white noise. The hypothesis of a random walk without drift is (a,b,c)=(O,0,1). To conduct inference tests, Fuller (1976) and Dickey and Fuller (1979) have calculated the empirical distribution of the t-statistic and the F-statistic when the random walk hypothesis is true (the usual t- and F-tables cannot be used in this case since the process is not stationary when c=l) .
For a test of market efficiency one must also account for the interest rate differential (Dooley and Shafer, 1983? Levich, 1985) . If one adjusts the actual spot rate for that part which represents the change expected one period before (given uncovered interest parity):
s(adj)t=st-(it_1-it*._1) ,
then the linear regression
s(adj)t=a+bTIME+cst~i+ut
should yield (a,b,c)=(0,0,l), if the random walk model is true (s denotes the price of one dollar in terms of deutschemark, i and i* represent the deutschemark and dollar interest rate).
Table 1 presents the results for the monthly and daily exchange rate.1) The t-statistics lie generally within the confidence interval as tabulated by Dickey and Fuller, 1979 (the only
Figure 1
- 7
exception being the period of the steep fall of the dollar since February 1985). However, the F-statistic reveals that the hypothesis of a parameter combination (0,0,1) has to be rejected (for all sub-periods with a confidence level of even more than 99 percent - the critical value in this case is 6.50 for n=100).2) This result also holds true when exchange rates are adjusted for the interest rate differential in the case of monthly data.3)
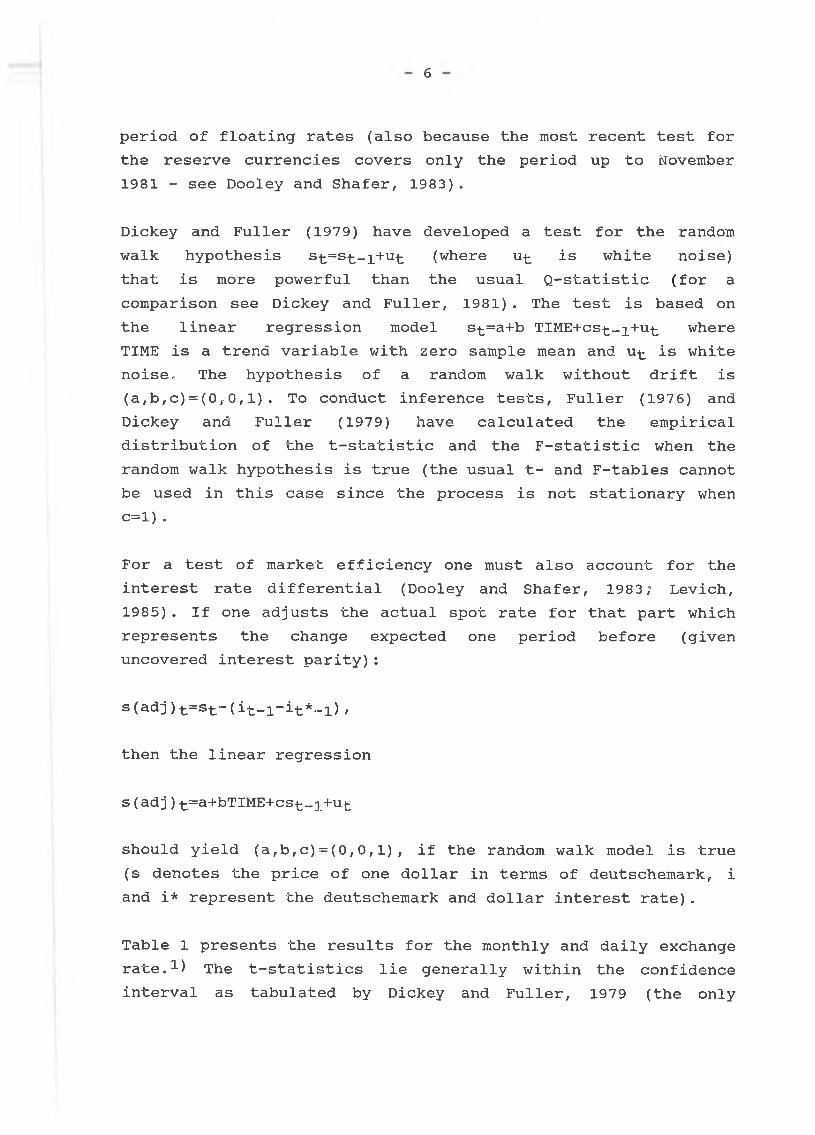
To conclude: The exchange rate does not follow a random walk (see also figure 1). There then exists some systematic pattern in exchange rate movements. This pattern, however, cannot be attributed to the equilibrium conditions of standard theory (purchasing power parity, uncovered interest parity). It is therefore still to be detected.
IV. Some Aspects of the “Gestalt" of Exchange RateFluctuations
Figure 1 shows the movements of the DM/$ spot rate(end-of-month) relative to purchasing power parity since 1970,Based on simple trend equations three periods can clearly be distinguished: the depreciation of the dollar during the 1970’s, its appreciation until February, 1985, and its steep fall since then. These simple trend equations "explain” between 80 % and 97 % of the exchange rate’s variance, where the R2-statistic increases from period to period (table 2). The figure further suggests, that "over-shooting" (in relation to PPP) is an essential element in the pattern of medium-term fluctuations and is by no means an exception to the rule. The strength of the dollar appreciation in the 1980’s together with the persistent violation of purchasing power parity and uncovered interest parity consequently provided the impetus for the bubble hypothesis (the even stronger fall of the dollar since 1985 seems to confirm this perception). However, the exchange race movements also possess significant and persistent
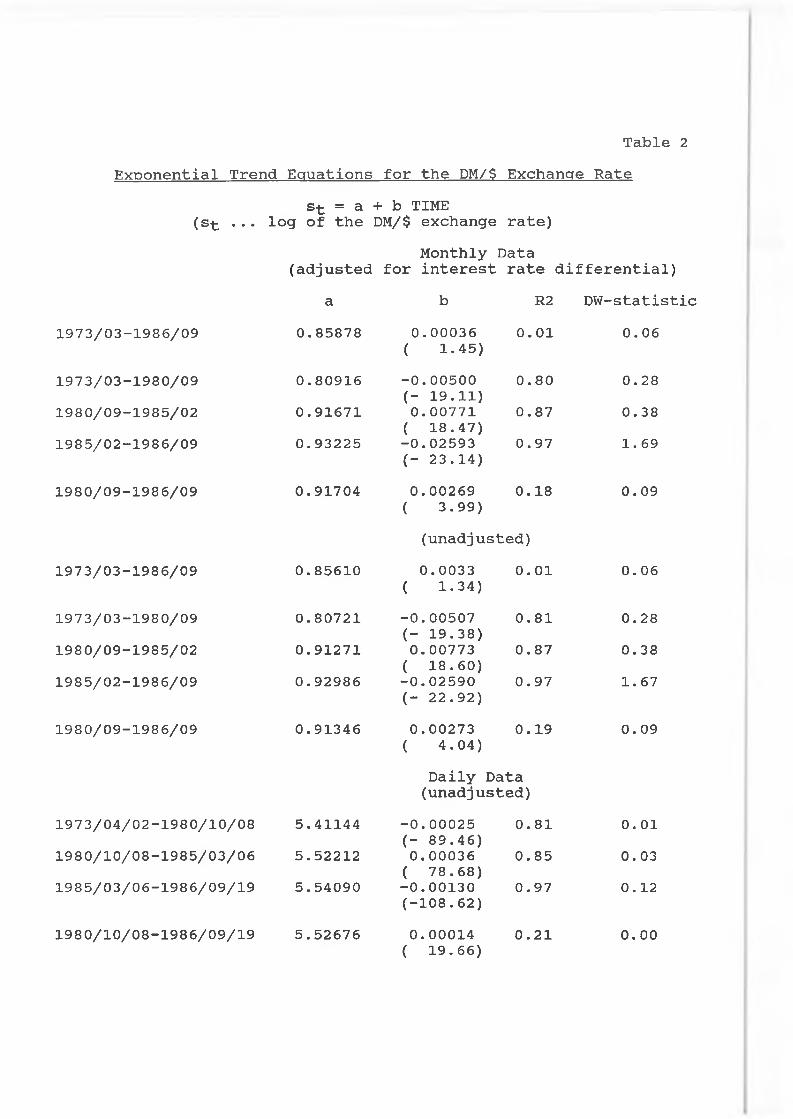
Table 2Exoonential Trend Equations for the DM/$ Exchange Rate
(stst = a
... log of the+ b TIMEDM/$ exchange rate)
(adjustedMonthly Data
for interest rate differential)a b R2 DW-statistic
1973/03-1986/09 0.85878 0.00036 0.01 0.06
1973/03-1980/09 0.80916( 1-45)-0.00500 0.80 0.28
1980/09-1985/02 0.91671(- 19.11) 0.00771 0.87 0.38
1985/02-1986/09 0.93225( 18.47)-0.02593 0.97 1.69
1980/09-1986/09 0.91704(- 23.14)0.00269 0.18 0.09( 3.99)(unadjusted)
1973/03-1986/09 0.85610 0.0033 ( 1-34)
0.01 0.06
1973/03-1980/09 0.80721 -0.00507 (- 19.38)
0.81 0.281980/09-1985/02 0.91271 0.00773
( 18.60)0.87 0.38
1985/02-1986/09 0.92986 -0.02590 (- 22.92)
0.97 1.67
1980/09-1986/09 0.91346 0.00273 0.19 0.09( 4.04)
Daily Data (unadjusted)
1973/04/02-1980/10/08 5.41144 -0.00025 (- 89.46)
0.81 0.011980/10/08-1985/03/06 5.52212 0.00036
( 78.68)0.85 0.03
1985/03/06-1986/09/19 5.54090 -0.00130(-108.62)
0.97 0.12
1980/10/08-1986/09/19 5.52676 0.00014 0.21 0.00( 19.66)
8
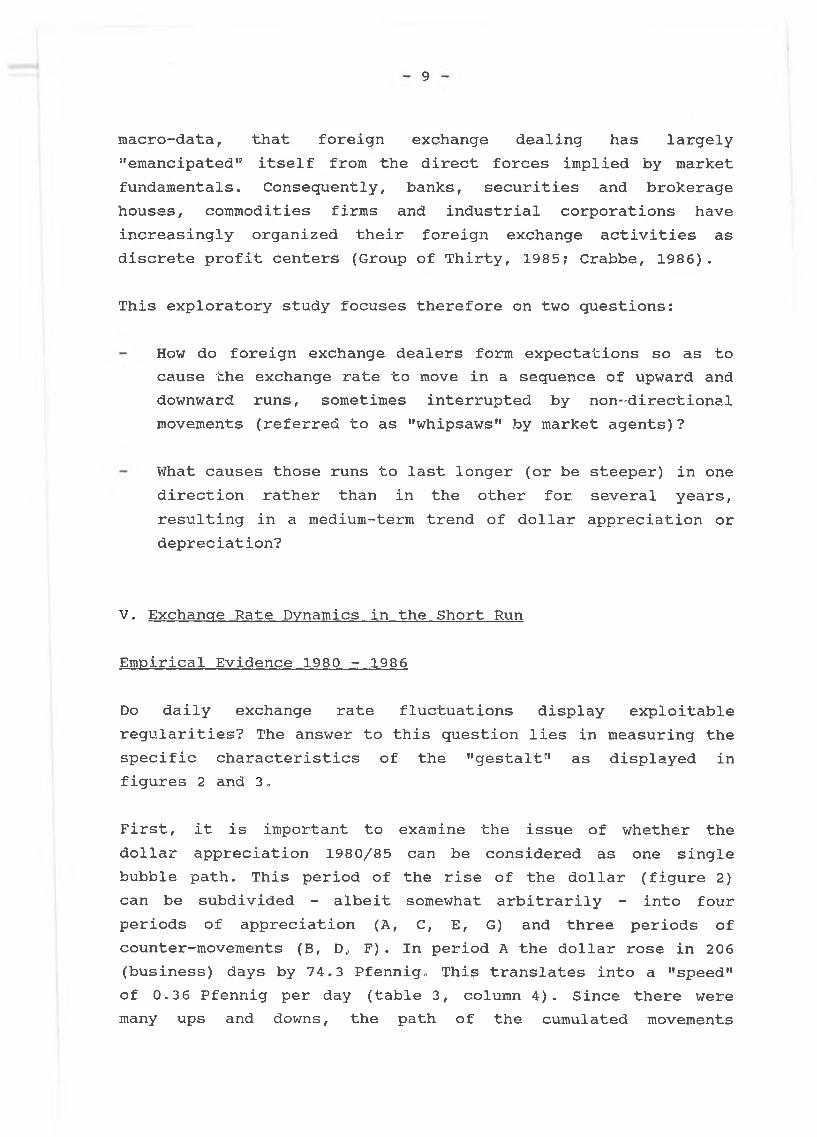
counter-movements during these trends. Their importance cannot be fully recognized using monthly data because the time horizon of foreign exchange dealers ranges from some minutes to a few days for most of their business (whereas the shortest time horizon used by the economist is usually one month)<> Figures 2 and 3 reveal that these counter-movements form as much a part of the overall "gestalt” of exchange rate dynamics as the basic trend. It can be further seen that most of the changes take place as runs, i,e., monotonic or "almost" monotonic movements which last for some days or even weeks (4 or 5 day moving averages are the most common technique used on the trading floors to smooth the exchange rate oscillations around these runs).
How can this "gestalt” of exchange rate dynamics be interpreted ("re-translated1') as the outcome of the economic behaviour of market participants? More specifically: which group of agents influences most directly the process of exchange rate determination? The answer is simple: the foreign exchange dealers. Economic theory, however, abstracts from this group of agents, mainly because they are assumed to be just an intermediary between the relevant demand and supply stemming from the international trade of goods and services on the one hand and of real and financial assets on the other. But is this abstraction appropriate? The total daily volume on the foreign exchange market is estimated to be 350 billion $ compared to a volume of world exports and imports of only 17 billion $.4) The importance of portfolio transactions can be estimated for the DM/$ market: its overall turnover can be put at 118 billion $ per day5) , the sum of exports and imports of long-term capital from/to Germany is estimated to be only 2 billion $ per day6). These relations are roughly consistent with bank surveys which show that customer business accounts for only 11.5 % (USA) or 9 % (UK) of total foreign exchange activities (Fed of New York, 1986; Bank of England, 1986). Even though customer business often induces a series of interbank transactions it is clear from both sources, the surveys and the
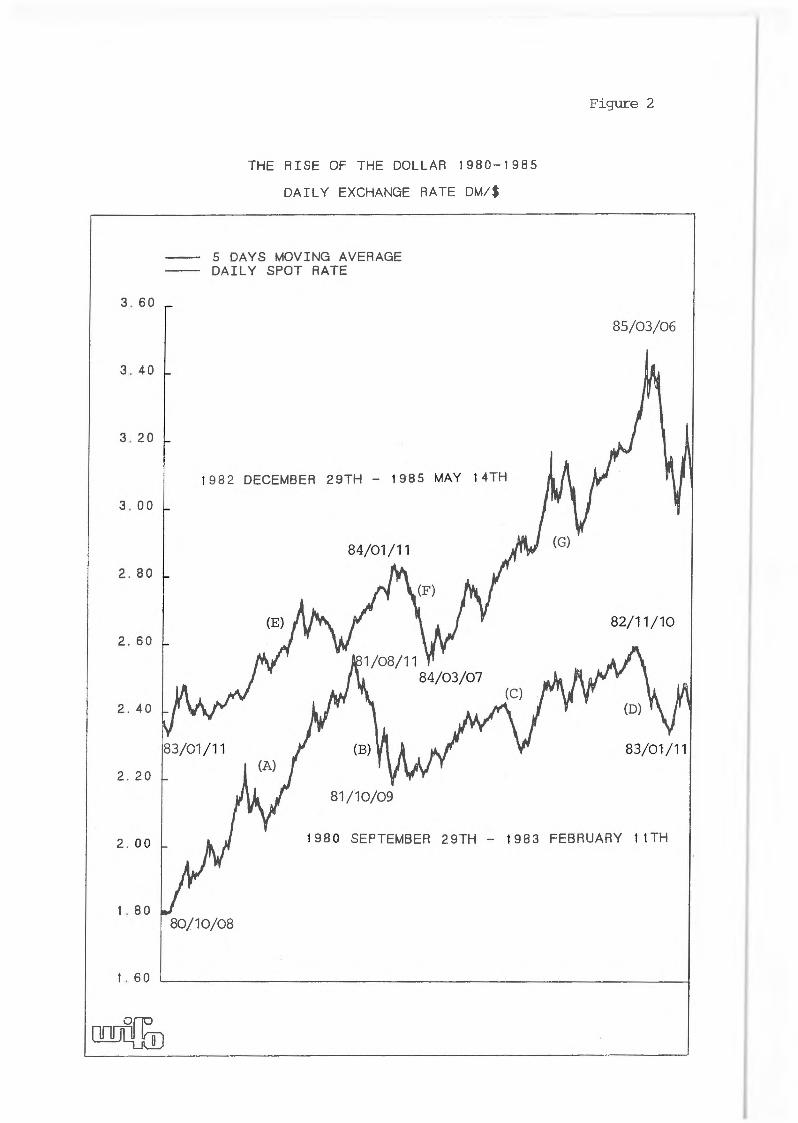
F ig u re 2
THE RISE OF THE DOLLAR 1980-1985
DAILY EXCHANGE RATE DM/$
9
macro-data, that foreign exchange dealing has largely "emancipated" itself from the direct forces implied by market fundamentals. Consequently, banks, securities and brokerage houses, commodities firms and industrial corporations have increasingly organized their foreign exchange activities as discrete profit centers (Group of Thirty, 1985; Crabbe, 1986).
This exploratory study focuses therefore on two questions:
How do foreign exchange dealers form expectations so as to cause the exchange rate to move in a sequence of upward and downward runs, sometimes interrupted by non-directional movements (referred to as "whipsaws" by market agents)?
What causes those runs to last longer (or be steeper) in one direction rather than in the other for several years, resulting in a medium-term trend of dollar appreciation or depreciation?
Vo Exchange Rate Dynamics in the Short Run
Empirical Evidence 1980 - 1986
Do daily exchange rate fluctuations display exploitable regularities? The answer to this question lies in measuring the specific characteristics of the "gestalt" as displayed in figures 2 and 3„
First, it is important to examine the issue of whether the dollar appreciation 1980/85 can be considered as one single bubble path. This period of the rise of the dollar (figure 2) can be subdivided - albeit somewhat arbitrarily - into four periods of appreciation (A, C, E, G) and three periods of counter-movements (B, D, F). In period A the dollar rose in 206 (business) days by 74.3 Pfennig. This translates into a "speed" of 0.36 Pfennig per day (table 3, column 4). Since there were many ups and downs, the path of the cumulated movements
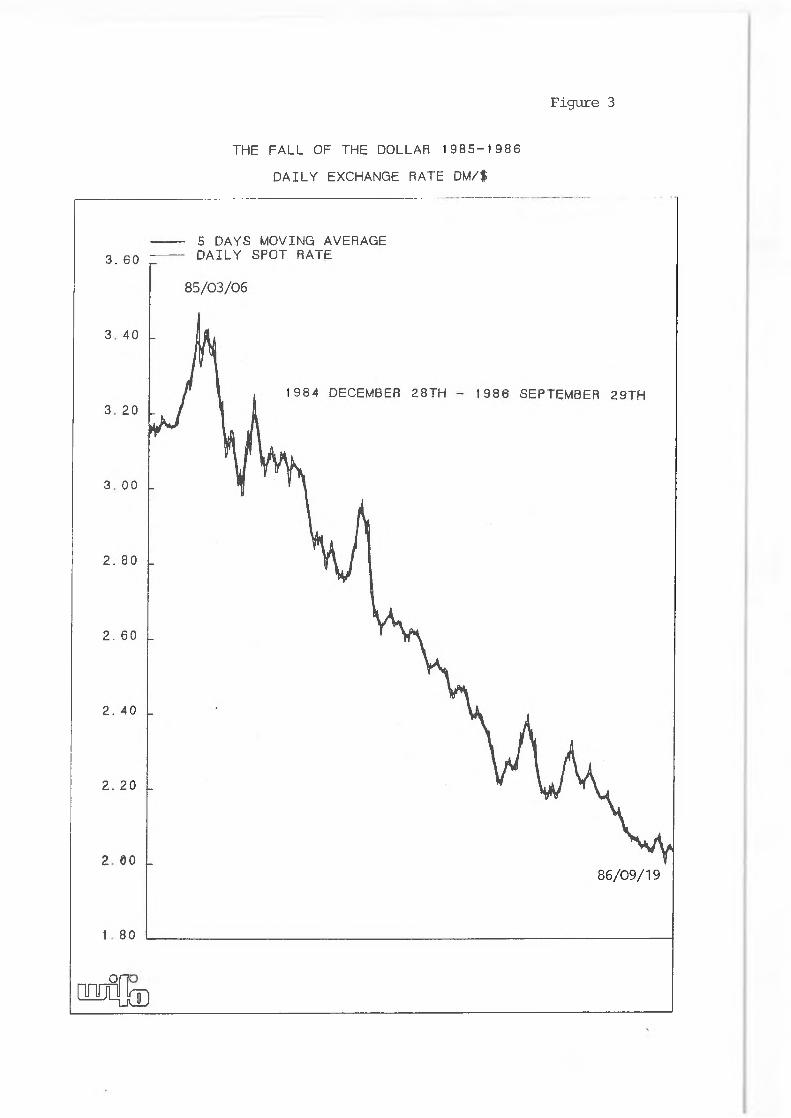
F ig u re 3
THE FALL OF THE DOLLAR 1985-1986
DAILY EXCHANGE RATE DM/$
86/09/19
m f i Q ®
10
(143»9 Pfennig, column 3) was almost twice as long as the change in level. The ratio of column 2 and column 3 provides a rough measure of the degree of monotonicity (column 6) . There are two extreme values. A value of one would indicate a pure monotonic path like a bubble. A value of zero would indicate the existence of "whipsaws’*, i.e., oscillations in price around a constant level. As can be seen the counter-movements (B, D, F) during the period of the dollar rise were much closer to a monotonic pattern than the appreciation movements (A, C, E, G), i.e., the ratio in column 6 is everywhere higher in absolute value for the depreciation runs than for the preceding appreciation runs» Column 4 shows that the counter-movements were also much steeper (see also figure 2). These observations cast doubt on the perception that the rise of the dollar followed one single bubble path between 1980 and 1985.7)
Since the bubble explanation in the strict sense is inappropriate it is necessary to examine the specific character of the stepwise process the dollar followed during the 1980/85 period. It is clear that an overall appreciation can be brought about in two different ways (or a combination of both) . In one case the appreciation runs are on average steeper than the depreciation runs, in the other case the appreciation runs last on average longer than the depreciation runs. Table 4 separates therefore the single appreciation runs from the single depreciation runs. (Note that the information contained in table 3 was generated by aggregating over all single runs irrespective of their direction.) It turns out that the overall dollar appreciation between 1980 and 1985 was mainly due to the difference in the length of appreciation and depreciation runs and not in their slope. The upward runs lasted on average 7.2 days while the downward runs lasted on average only for 4.6 days (see columns 2 and 5 for the period 1980 to 1985). At the same time the upward runs were only slightly steeper than the downward runs (columns 3 and 6). This pattern is by no means self-evident: Suppose, exchange rate volatility were caused by changes of the expected equilibrium level due to "Hews*1. This
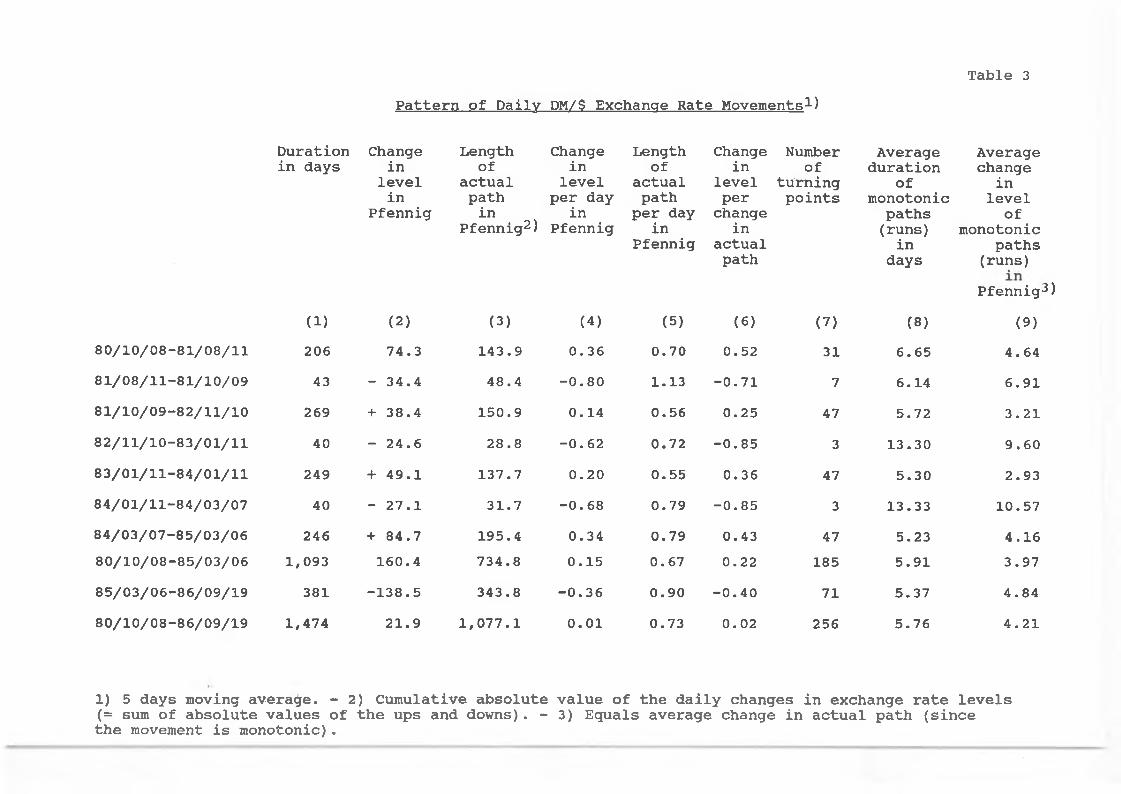
Table 3Pattern of Daily DM/$ Exchange Rate Movements1)
Duration Change Length Change Length Change Number Average Averagein days in of in of in of duration change
level actual level actual level turning of inin path per day path per points monotonic level
Pfennig in in per day change paths ofPfennig2) Pfennig in in (runs) monotonic
Pfennig actual in pathspath days (runs)
Pfennig- )(1) (2) (3) (4) (5) (6) (7) (8) (9)
80/10/08-81/08/11 206 74.3 143.9 0.36 0.70 0.52 31 6.65 4.6481/08/11-81/10/09 43 - 34.4 48.4 -0.80 1.13 -0.71 7 6.14 6.9181/10/09-82/11/10 269 + 38.4 150.9 0.14 0.56 0.25 47 5.72 3.2182/11/10-83/01/11 40 - 24.6 28.8 -0.62 0.72 -0.85 3 13.30 9.6083/01/11-84/01/11 249 + 49.1 137.7 0.20 0.55 0.36 47 5.30 2.9384/01/11-84/03/07 40 - 27.1 31.7 -0.68 0.79 -0.85 3 13.33 10.5784/03/07-85/03/06 246 + 84.7 195.4 0.34 0.79 0.43 47 5.23 4.1680/10/08-85/03/06 1,093 160.4 734.8 0.15 0.67 0.22 185 5.91 3.9785/03/06-86/09/19 381 -138.5 343.8 -0.36 0.90 -0.40 71 5.37 4.8480/10/08-86/09/19 1,474 21.9 1,077.1 0.01 0.73 0.02 256 5.76 4.21
1) 5 days moving average. - 2) Cumulative absolute value of the daily changes in exchange rate levels (= sum of absolute values of the ups and downs). - 3) Equals average change in actual path (since the movement is monotonic).
11
should induce an almost instantaneous price adjustment, given the worldwide communication network in this market. The analysis below shows that it is precisely due to the persistence of these runs which provides the basis for the systematic profitability of short-term currency speculation by means of technical analysis.
The different pattern of the ups and downs observed in the sub-periods also confirms the result that medium-term exchange rate movements are mainly caused by the difference in the length of the appreciation and depreciation runs and not in their slope. This is so because in the sub-periods A, C, E, G, that brought about the overall dollar appreciation, the slope of upward and downward runs differed relatively little (compared to the difference in the length of the runs) . Only during the counter-movements B, D, F did the slope of the downward runs significantly exceed that of the upward runs, thereby contributing to the short-term fall of the dollar. Interestingly, this pattern is inconsistent with the spirit of the Dornbusch overshooting model, at least for the period subsequent to 1981, since the movements away from long-term equilibrium were relatively more gradual than the correcting counter-movements ,
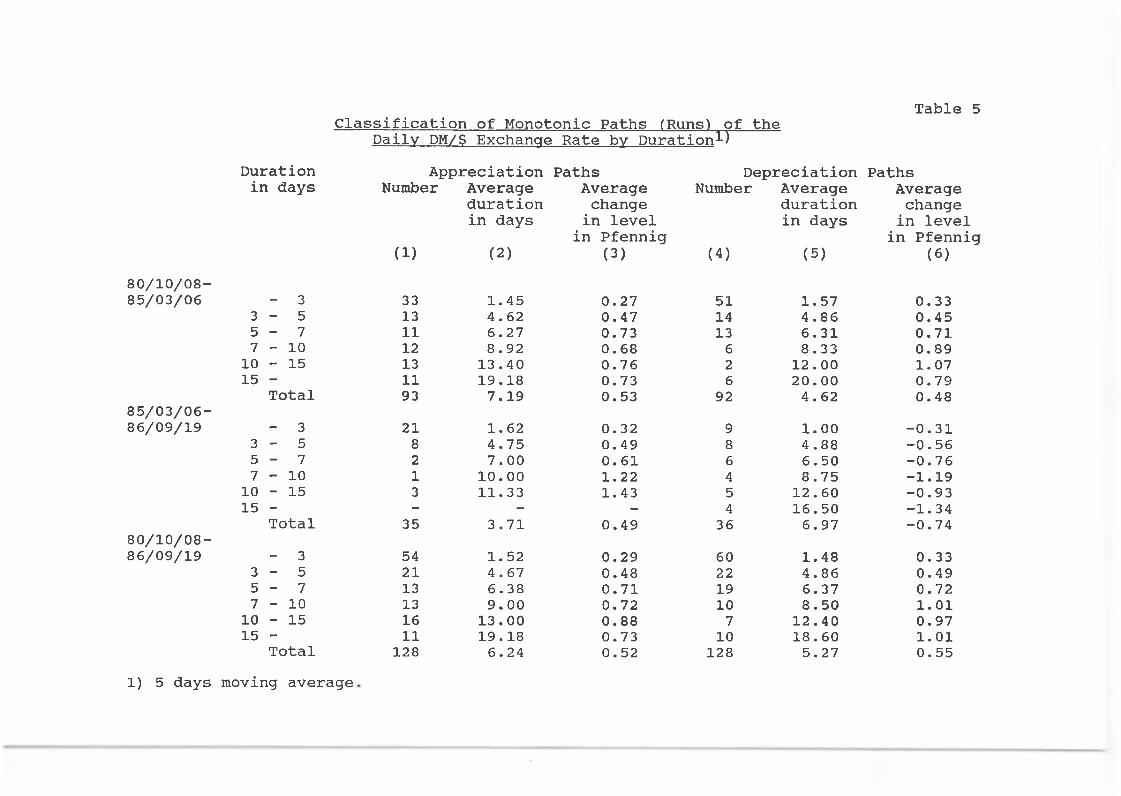
Since the persistence of exchange rate runs could account for their systematic exploitability we try to elaborate in a third step upon the distribution of the single appreciation and depreciation runs according to their length. Table 5 shows that almost half of the 256 (twice 128). runs which occurred over the entire period lasted only 3 days or less; at the same time their slope (change in level per day) was far below average. Thus, these short movements contributed very little to the process of appreciation and depreciation. If one sums the changes in level over all upward runs, one obtains a hypothetical appreciation of 415.3 Pfennig (128*6,24*0.52). It is interesting that the 54 shortest movements contributed only 23.8 Pfennig (5.7 %) to the overall appreciation, whereas the contribution of the 11 longest
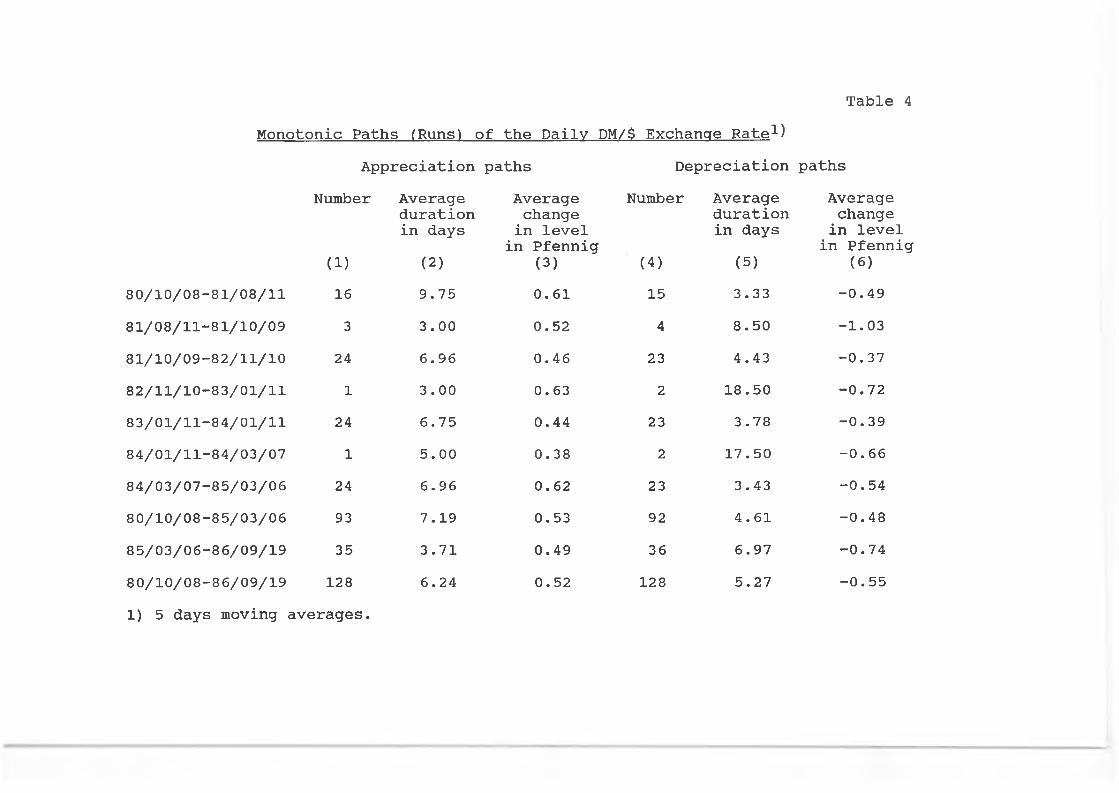
Table 4Monotonic Paths (Runs) of the Daily DM/$ Exchange Rate1)
Appreciation paths Depreciation pathsNumber Average Average
changein level
in Pfennig(3)
Number Average Averagechangein level in Pfennig
(6)(1)
duration in days
(2) (4)
duration in days
(5)80/10/08-81/08/11 16 9.75 0.61 15 3.33 -0.4981/08/11-81/10/09 3 3.00 0.52 4 8.50 -1.0381/10/09-82/11/10 24 6.96 0.46 23 4.43 -0.3782/11/10-83/01/11 1 3.00 0.63 2 18.50 -0.7283/01/11-84/01/11 24 6.75 0.44 23 3.78 -0.3984/01/11-84/03/07 1 5.00 0.38 2 17.50 —0.6684/03/07-85/03/06 24 6.96 0.62 23 3.43 -0.5480/10/08-85/03/06 93 7.19 0.53 92 4.61 -0.4885/03/06-86/09/19 35 3.71 0.49 36 6.97 -0.7480/10/08-86/09/19 128 6.24 0.52 128 5.27 -0.551) 5 days moving averages.
12
runs was much greater (154.0 Pfennig, 37.1 %) . The case is even more extreme for the downward runs. Here the 10 longest runs accounted for 50.6 % of the overall depreciation.
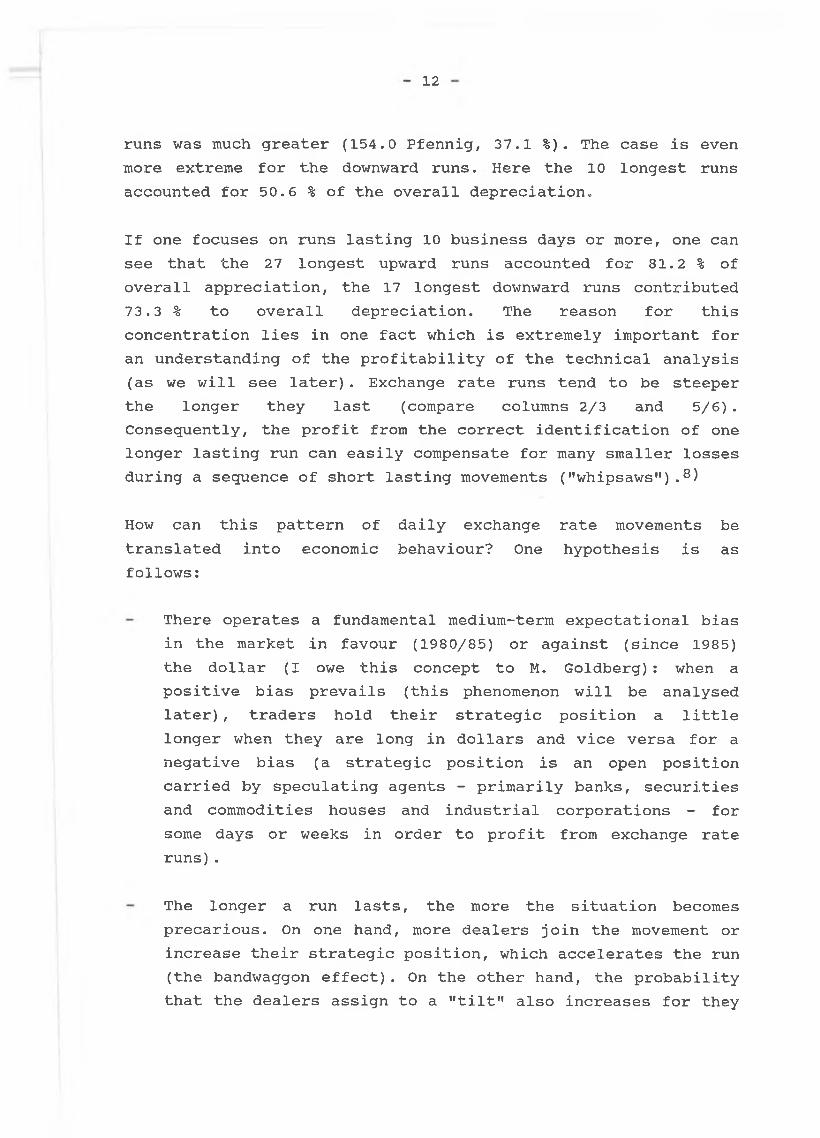
If one focuses on runs lasting 10 business days or more, one can see that the 27 longest upward runs accounted for 81.2 % of overall appreciation, the 17 longest downward runs contributed 73.3 % to overall depreciation. The reason for this concentration lies in one fact which is extremely important for an understanding of the profitability of the technical analysis (as we will see later) . Exchange rate runs tend to be steeper the longer they last (compare columns 2/3 and 5/6). Consequently, the profit from the correct identification of one longer lasting run can easily compensate for many smaller losses during a sequence of short lasting movements ("whipsaws"),8)
How can this pattern of daily exchange rate movements be translated into economic behaviour? One hypothesis is as follows:
There operates a fundamental medium-term expectational bias in the market in favour (1980/85) or against (since 1985) the dollar (I owe this concept to M. Goldberg) : when a positive bias prevails (this phenomenon will be analysed later), traders hold their strategic position a little longer when they are long in dollars and vice versa for a negative bias (a strategic position is an open position carried by speculating agents - primarily banks, securities and commodities houses and industrial corporations - for some days or weeks in order to profit from exchange rate runs).
The longer a run lasts, the more the situation becomes precarious. On one hand, more dealers join the movement or increase their strategic position, which accelerates the run (the bandwaggon effect). On the other hand, the probability that the dealers assign to a "tilt" also increases for they
Classification of Monotonic Paths (Runs) of theDaily DM/$ Exchange Rate by Duration1)
Table 5
Duration in days
Appreciation Paths Depreciation PathsNumber Average Average
changein level
in Pfennig(3)
Number Average Averagechangein level in Pfennig
(6)(1)
duration in days
(2) (4)
duration in days
(5)80/10/08—85/03/06 - 3 33 1.45 0.27 51 1.57 0.33
3 - 5 13 4.62 0.47 14 4.86 0.455 - 7 11 6.27 0.73 13 6.31 0.717 - 1 0 12 8.92 0.68 6 8.33 0.8910 - 15 13 13.40 0.76 2 12.00 1.0715 - 11 19.18 0.73 6 20.00 0.79
Total 93 7.19 0.53 92 4.62 0.4885/03/06-86/09/19 - 3 21 1.62 0.32 9 1.00 -0.31
3 - 5 8 4.75 0.49 8 4.88 -0.565 - 7 2 7.00 0.61 6 6.50 -0.767 - 1 0 1 10.00 1.22 4 8.75 -1.1910 - 15 3 11.33 1.43 5 12.60 -0.9315 - - - - 4 16.50 -1.34
Total 35 3.71 0.49 36 6.97 -0.7480/10/08-86/09/19 - 3 54 1.52 0.29 60 1.48 0.33
3 - 5 21 4.67 0.48 22 4.86 0.495 - 7 13 6.38 0.71 19 6.37 0.727 - 1 0 13 9.00 0.72 10 8.50 1.0110 - 15 16 13.00 0.88 7 12.40 0.9715 - 11 19.18 0.73 10 18.60 1.01
Total 128 6.24 0.52 128 5.27 0.551) 5 days moving average
13
know from experience that runs last for a maximum of 2 to 3 weeks and usually less (one never knows the breakpoint in advance) . At the same time the temptation to cash in the paper profits becomes progressively larger, particularly for those who had bet on the run in its early stage.9)
When the run finally bursts, a counter-movement is almost always triggered off (see figures 2 and 3) : the former positions are closed (cashed in) and new counter-positions are opened.
This interpretation of exchange rate runs is somewhat similar to the concept of bubbles in Blanchard and Watson (1982), particularly with respect to the assumption that the probability of a "bursting” increases the longer the bubble lasts. However, since the exchange rate is the relative price of two assets, any depreciation of the one implies an appreciation of the other. Conseguently, there is no possibility of a "crash". Such a "tilt" merely ushers in the beginning of a "counter-bubble" (appreciation run of the other currency).
To conclude: the evidence from daily exchange rate data suggests that it makes little sense to interpret the dollar appreciation 1980/85 as one single bubble. Rather, it seems reasonable to conceive the "gestalt" of exchange rate fluctuations as a sequence of short-term bubbles followed by counter-bubbles or "whipsaws".
Technical Analysis and Exchange Rate Instability
If the "gestalt" of the daily exchange rate fluctuations displays certain regularities then one would expect foreign exchange dealers to learn and exploit them systematically. This hypothesis is tested by calculating the profitability of currency speculation using technical analysis. The use of this method of speculation can be considered as one reuslt of the
14
agents' learning process.
The use of technical analysis has strongly increased in the foreign exchange markets. In a survey of the "Group of Thirty", 97 % of the bank respondents and 87 % of the securities houses expressed the opinion that the use of technical models has had an increasingly significant impact on the market. Particularly, the most important market participants, namely banks, securities houses and brokers are believed to have increased the use of these models (Group of Thirty, 1985).10)
Technical analysis tries to derive profitable buy and sell signals by isolating systematic components in the behaviour of price series (see Kaufman, 1978, for an excellent treatment; for a shorter survey see Shaw, 1975). The qualitative approaches rely on the interpretation of some (purportedly) typical configurations of the ups and downs of price movements (e.g., head and shoulders, top and bottom formations). They therefore contain an important subjective element. The quantitative approaches try to isolate runs from non-directional movements using statistical transformations. These techniques - moving average models and momentum models - produce clearly defined series of buy and sell signals and can therefore be accurately tested. The first type usually consists of a (unweighted) short-term moving average (over the preceding 3 to 8 days) and a long-term moving average (over the preceding 10 to 30 days). The trading rule is as follows:
Buy when the short-term (faster) moving average crosses the long-term (slower) moving average from below and sell when the converse occurs. Or equivalently:
Hold a long position when the difference between the short-term and the long-term moving average is positive, otherwise hold a short position.
Since this difference fluctuates around zero, it is often called
15
•’oscillator'3 (note that Kaufman, 1978, uses this term differently, namely, for a certain type of momentum model).
The second type of model works with the (absolute or relative) difference between the current price and that k days ago:
M(k) = PfPt-k
or
M(k) = PfPt-k Pt^k~
The trading rule is as follows:
Buy (go long) when the momentum (MjJ turns from negative into positive and sell (go short) in the opposite situation (therefore the absolute or relative momentum gives identical signals - figure 4 displays the relative form).
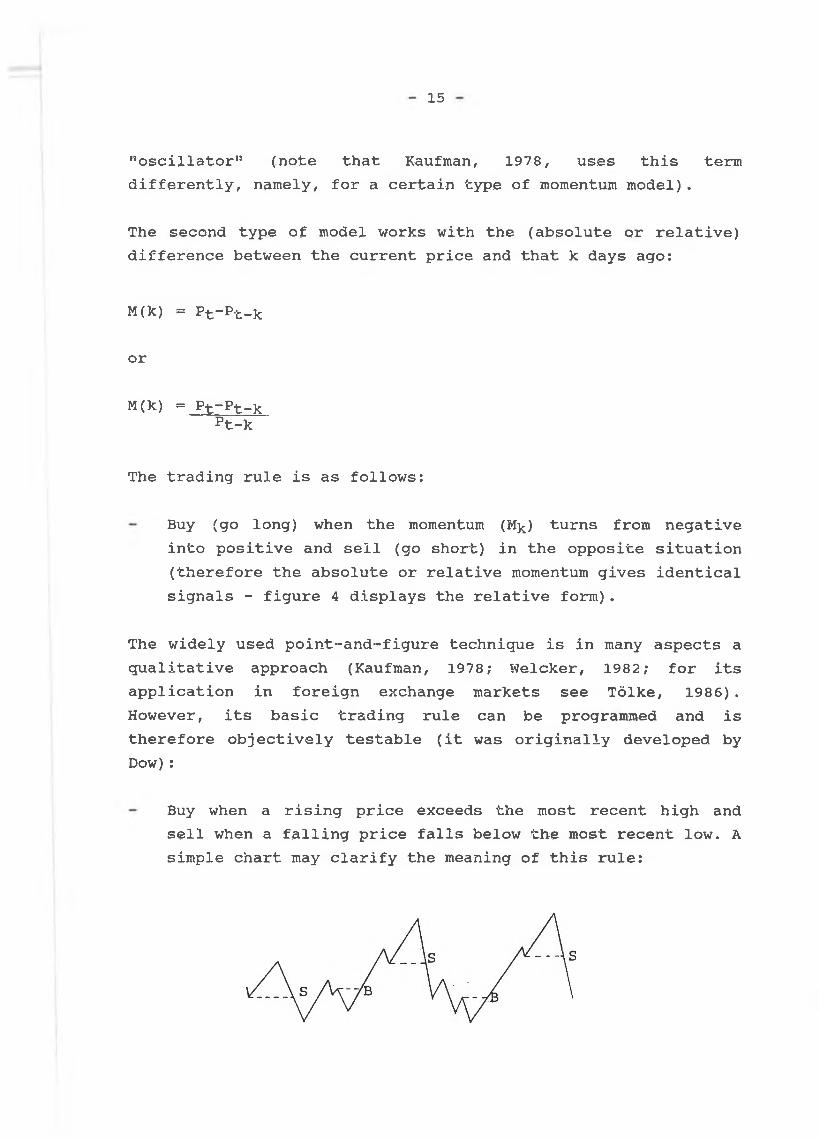
The widely used point-and-figure technique is in many aspects a qualitative approach (Kaufman, 1978; Weicker, 1982; for its application in foreign exchange markets see Tölke, 1986). However, its basic trading rule can be programmed and is therefore objectively testable (it was originally developed by Dow) :
Buy when a rising price exceeds the most recent high and sell when a falling price falls below the most recent low. A simple chart may clarify the meaning of this rule:
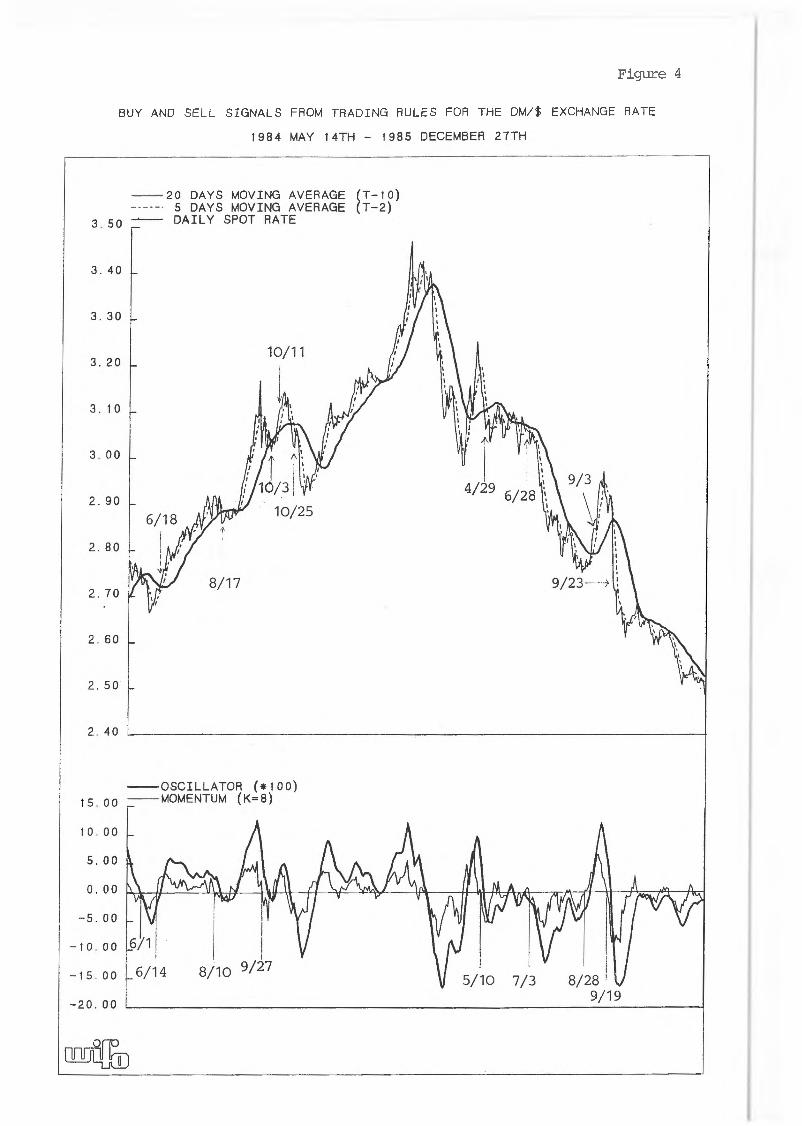
Figure 4
BUY AND SELL SIGNALS FROM TRADING RULES FOR THE DM/$ EXCHANGE RATE
16
The fourth trading system we want to test are the so-called filter rules:
Buy when the price exceeds the most recent low by X % and sell when it falls below the most recent high by Y %.
Filter rules are not considered a component of technical analysis in either theory or practice (Kaufman, 1978, does not even mention it) . Economists, however, have often used the filter rule to test for market efficiency (for the stock market: Alexander, 1964; for the commodities market: Stevenson and Bear, 1970; for the foreign exchange market: Poole, 1967; Dooley and Shafer, 1976, 1983; Logue and Sweeney, 1977; Cornell and Dietrich, 1978, and Sweeney, 1985)» In order to test the relevance of these market efficiency tests, the performance of filter rules is also analysed.
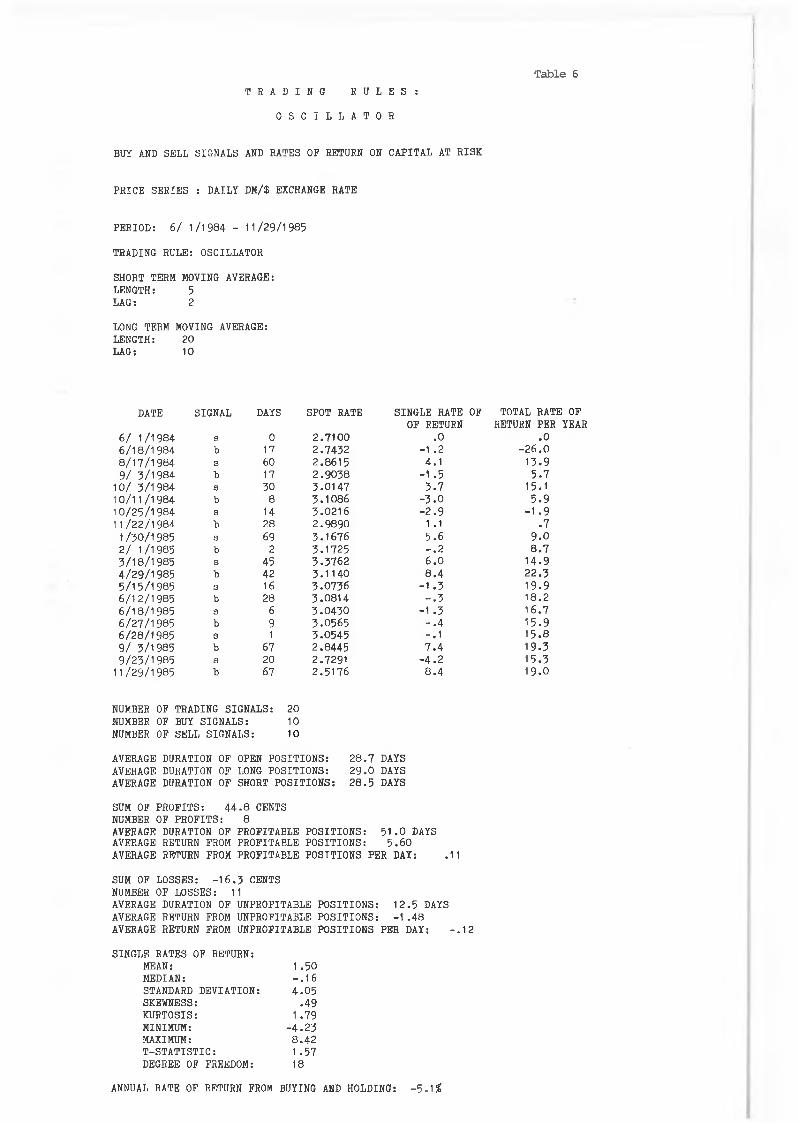
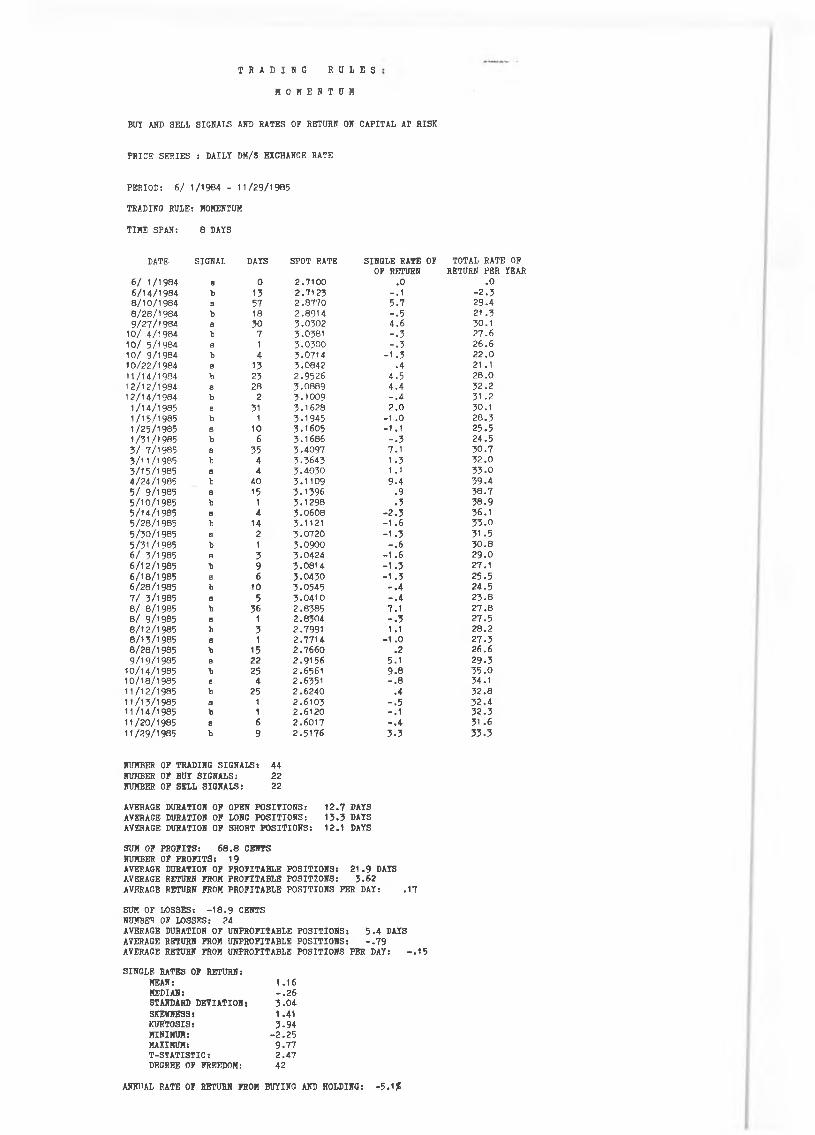
Figure 4 and tables 6 and 7 demonstrate how an oscillator model and a momentum model performed between June 1, 1984 and November 29, 1985 (18 months). On June 1, 1984 both models signalled a short position (both variables were negative) and hence 1 $ is sold for 2.7100 DM. On June 14 the momentum model gives a buy signal, thus the dollar is bought back for 2.7123 (with a minor loss)„ The oscillator reacts more slowly to the appreciation run which began already on June 4 and provides a signal to buy back the dollar on June 18 at 2.7432. This then rendered the first trade rather unprofitable. The second trade is highly profitable for both systems, though even more for the momentum model. On August 10, the dollar is sold at 2.8770 DM yielding a profit of 16.5 cents in 57 days (figure 4 demonstrates clearly how important it is to neglect minor fluctuations) . The oscillator identified the end of the run later than the momentum because of the length of the long-term moving average (this was chosen to facilitate the graphical presentation). Such a lagging-behind can cause heavy losses. On October 3, the oscillator gave a sell signal at the end of a depreciation run and on October 11 it
T a b l e 6
T R A D I N G R U L E S :
O S C I L L A T O R
BUY AND SELL SIGNALS AND RATES OF RETURN ON CAPITAL AT RISK
PRICE SER IES : DAILY DM/$ EXCHANGE RATE
PERIOD : 6 / 1 /1 9 8 4 - 1 1 /2 9 /1 9 8 5
TRADING RULE: OSCILLATOR
SHORT TERM MOVING AVERAGE: LENGTH: 5LAG: 2
LONG TERM MOVING AVERAGE: LENGTH: 20LAG: 10
DATE SIGNAL DAYS SPOT RATE SINGLE RATE OF OF RETURN
TOTAL RATE OF RETURN PER YEAR
6 / 1 /1 9 8 4 s 0 2 .7 1 0 0 .0 . 06 / 1 8 / 1 9 8 4 b 17 2 .7 4 5 2 -1 .2 - 2 6 . 08 / 1 7 / 1 9 8 4 s 60 2 .8 6 1 5 4 .1 1 3 .99 / 5 /1 9 8 4 b 17 2 .9 0 5 8 -1 .5 5 . 7
1 0 / 5 /1 9 8 4 3 50 5 .0 1 4 7 3 . 7 1 5 .11 0 /1 1 /1 9 8 4 b 8 5 .1 0 8 6 - 5 . 0 5 . 91 0 /2 5 /1 9 8 4 3 14 5 .0 2 1 6 - 2 . 9 - 1 . 911 / 2 2 / 1 9 8 4 b 28 2 .9 8 9 0 1 .1 .7
1 / 5 0 / 1 985 3 69 5 .1 6 7 6 5 .6 9 . 02 / 1 /1 9 8 5 b 2 5 .1 7 2 5 - . 2 8 . 75 / 1 8 / 1 9 8 5 3 45 5 .5 7 6 2 6 . 0 1 4 .94 / 2 9 / 1 9 8 5 b 42 5 .1 1 4 0 8 . 4 2 2 .35 / 1 5 / 1 985 3 16 5 .0 7 5 6 - 1 . 5 1 9 .96 /1 2 / 1 9 8 5 b 28 5 .0 8 1 4 - . 5 1 8 .26 / 1 8 / 1 9 8 5 3 6 5 - 0 4 5 0 -1 .3 1 6 .76 /2 7 / 1 9 8 5 b 9 5 .0 5 6 5 - . 4 1 5 .96 / 2 8 / 1 9 8 5 3 1 5 .0 5 4 5 - . 1 1 5 .89 / 5 /1 9 8 5 b 67 2 .8 4 4 5 7 . 4 1 9 .39 / 2 5 /1 9 8 5 3 20 2 .7 2 9 1 - 4 . 2 1 5 .3
1 1 /2 9 /1 9 8 5 b 67 2 .5 1 7 6 8 . 4 1 9 .0
NUMBER OF TRADING SIGNALS: 20NUMBER OF BUY SIGNALS: 10NUMBER OF SELL SIGNALS: 10
AVERAGE DURATION OF OPEN PO SITIO N S: 2 8 .7 DAYSAVERAGE DURATION OF LONG PO SITIO N S: 2 9 . 0 DAYSAVERAGE DURATION OF SHORT PO SITIO N S: 2 8 .5 DAYS
SUM OF PR O FITS: 4 4 . 8 CENTSNUMBER OF PR O FITS: 8AVERAGE DURATION OF PROFITABLE PO SITIO N S: 5 1 .0 DAYS AVERAGE RETURN FROM PROFITABLE PO SITIO N S: 5 .6 0AVERAGE RETURN FROM PROFITABLE POSITIONS PER DAY: .11
SUM OF LOSSES: - 1 6 . 5 CENTSNUMBER OF LOSSES: 11AVERAGE DURATION OF UNPROFITABLE PO SIT IO N S: 1 2 .5 DAYS AVERAGE RETURN FROM UNPROFITABLE PO SIT IO N S: - 1 . 4 8 AVERAGE RETURN FROM UNPROFITABLE POSITIONS PER DAY: - . 1 2
SINGLE RATES OF RETURN:MEAN: 1 .5 0MEDIAN: - . 1 6STANDARD DEVIATION: 4 .0 5SKEWNESS: .4 9KURTOSIS: 1 .7 9MINIMUM: - 4 . 2 3MAXIMUM: 8 .4 2T -S T A T IS T IC : 1 .5 7DEGREE OF FREEDOM: 18
ANNUAL RATE OF RETURN FROM BUYING AND HOLDING: - 5 - 1 2
17
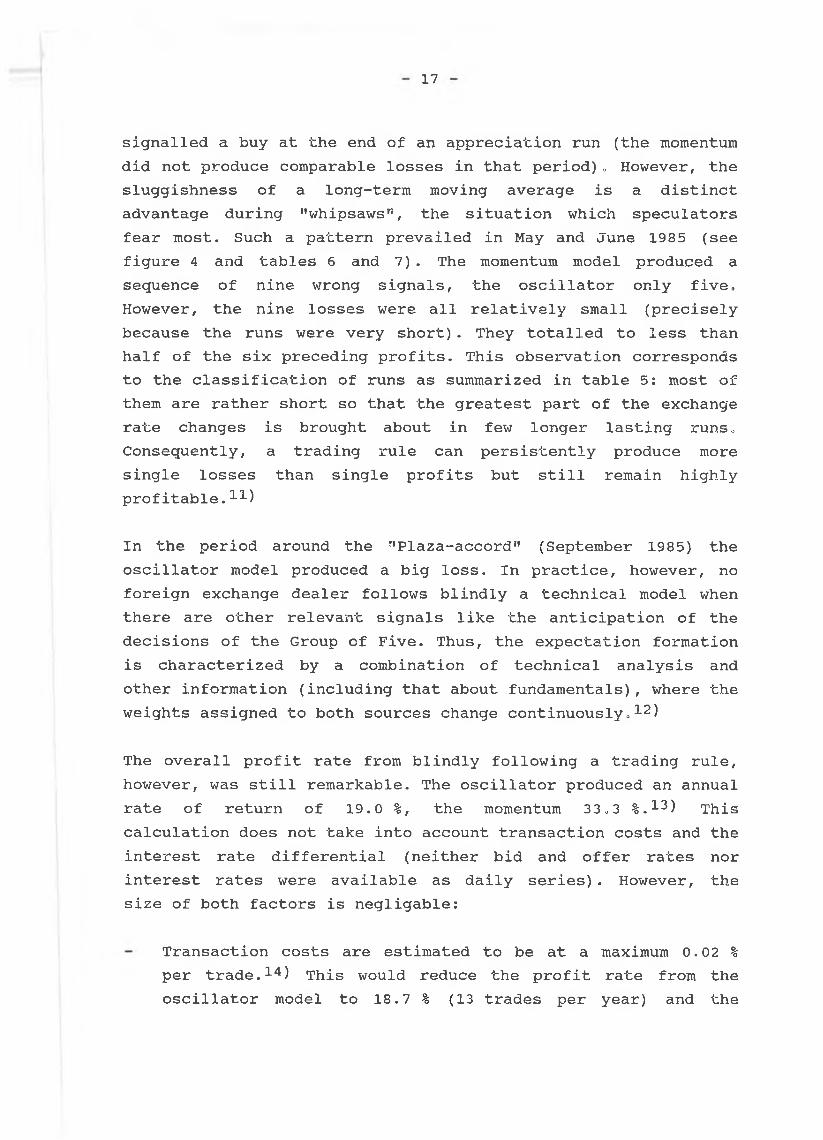
signalled a buy at the end of an appreciation run (the momentum did not produce comparable losses in that period). However, the sluggishness of a long-term moving average is a distinct advantage during ’’whipsaws”, the situation which speculators fear most. Such a pattern prevailed in May and June 1985 (see figure 4 and tables 6 and 7). The momentum model produced a sequence of nine wrong signals, the oscillator only five. However, the nine losses were all relatively small (precisely because the runs were very short) . They totalled to less than half of the six preceding profits. This observation corresponds to the classification of runs as summarized in table 5: most of them are rather short so that the greatest part of the exchange rate changes is brought about in few longer lasting runs. Consequently, a trading rule can persistently produce more single losses than single profits but still remain highly profitable.11)
In the period around the ’’Plaza-accord” (September 1985) the oscillator model produced a big loss. In practice, however, no foreign exchange dealer follows blindly a technical model when there are other relevant signals like the anticipation of the decisions of the Group of Five. Thus, the expectation formation is characterized by a combination of technical analysis and other information (including that about fundamentals), where the weights assigned to both sources change continuously.12)
The overall profit rate from blindly following a trading rule, however, was still remarkable. The oscillator produced an annual rate of return of 19.0 %, the momentum 33.3 %.13) This calculation does not take into account transaction costs and the interest rate differential (neither bid and offer rates nor interest rates were available as daily series). However, the size of both factors is negligable:
Transaction costs are estimated to be at a maximum 0.02 % per trade.14) This would reduce the profit rate from the oscillator model to 18.7 % (13 trades per year) and the
T R A D I N G R U L E S
M O M E N T U M
BUY AND SELL SIGNALS AND RATES OF RETURN ON CAPITAL AT RISK
PRICE SERIES : DAILY DM/$ EXCHANGE RATE
PERIOD: 6 / 1 /1 9 8 4 - 1 1 /2 9 /1 9 8 5
TRADING RULE: MOMENTUM
TIME SPAN: 8 DAYS
DATE SIGNAL DAYS SPOT RATE SINGLE RATE OF OF RETURN
TOTAL RATE OF RETURN PER YEAR
6 / 1 /1 9 8 4 a 0 2 .7 1 0 0 .0 .06 /1 4 / 1 9 8 4 b 13 2 .7 1 2 3 - . 1 - 2 . 38 /1 0 / 1 9 8 4 s 57 2 .8 7 7 0 5 .7 2 9 .48 / 2 8 / 1 9 8 4 b 18 2 .8 9 1 4 - . 5 21 .39 /2 7 / 1 9 8 4 s 3 0 3 .0 3 0 2 4 .6 3 0 .1
1 0 / 4 /1 9 8 4 b 7 3 .0 3 8 1 - . 3 2 7 .61 0 / 5 /1 9 8 4 8 1 3 .0 3 0 0 - . 3 2 6 .61 0 / 9 /1 9 8 4 b 4 3 .0 7 1 4 - 1 . 3 2 2 .01 0 /2 2 /1 9 8 4 a 13 3 .0 8 4 2 .4 21 .11 1 /1 4 /1 9 8 4 b 23 2 .9 5 2 6 4 .5 2 8 .01 2 /1 2 /1 9 8 4 s 2 8 3 .0 8 8 9 4 .4 3 2 .21 2 /1 4 /1 9 8 4 b 2 3 - 1 0 0 9 - . 4 31 .2
1 /1 4 /1 9 8 5 8 31 3 .1 6 2 8 2 .0 3 0 .11 /1 5 /1 9 8 5 b 1 3 - 1 9 4 5 -1 .0 2 8 .31 /2 5 /1 9 8 5 8 10 3 .1 6 0 5 - 1 .1 2 5 .51 /3 1 /1 9 8 5 b 6 3 .1 6 8 6 - . 3 2 4 .53 / 7 /1 9 8 5 a 35 3 .4 0 9 7 7 .1 3 0 .73 /1 1 / 1 985 b 4 3 .3 6 4 3 1 .3 3 2 .03 /1 5 / 1 9 8 5 a 4 3 .4 0 3 0 1 .1 3 3 .04 /2 4 /1 9 8 5 b 40 3 .1 1 0 9 9 .4 3 9 .45 / 9 /1 9 8 5 a 15 3 .1 3 9 6 .9 3 8 .75 /1 0 / 1 9 8 5 b 1 3 .1 2 9 8 .3 3 8 .95 /1 4 / 1 9 8 5 a 4 3 .0 6 0 8 - 2 . 3 3 6 .15 /2 8 / 1 9 8 5 b 14 3 .1 1 2 1 - 1 . 6 3 3 .05 /3 0 /1 9 8 5 a 2 3 .0 7 2 0 - 1 . 3 31 .55 /3 1 / 1 9 8 5 b 1 3 .0 9 0 0 - . 6 3 0 .86 / 3 /1 9 8 5 B 3 3 - 0 4 2 4 - 1 . 6 2 9 .06 /1 2 / 1 9 8 5 b 9 3 .0 8 1 4 -1 .3 2 7 .16 /1 8 / 1 9 8 5 8 6 3 .0 4 3 0 - 1 . 3 2 5 .56 /2 8 / 1 9 8 5 b 10 3 - 0 5 4 5 - . 4 2 4 .57 / 3 /1 9 8 5 a 5 3 .0 4 1 0 - . 4 2 3 .88 / 8 /1 9 8 5 b 36 2 .8 3 8 5 7 .1 2 7 .88 / 9 /1 9 8 5 8 1 2 .8 3 0 4 - . 3 2 7 .58 /1 2 / 1 9 8 5 b 3 2 .7 9 9 1 1 .1 2 8 .28 /1 3 / 1 9 8 5 a 1 2 .7 7 1 4 -1 .0 2 7 .38 /2 8 / 1 9 8 5 b 15 2 .7 6 6 0 .2 2 6 .69 /1 9 /1 9 8 5 a 22 2 .9 1 5 6 5 .1 2 9 .3
1 0 /1 4 /1 9 8 5 b 25 2 .6 5 6 1 9 .8 3 5 .01 0 /1 8 /1 9 8 5 a 4 2 .6 3 5 1 - . 8 3 4 .11 1 /1 2 /1 9 8 5 b 25 2 .6 2 4 0 .4 3 2 .81 1 /1 3 /1 9 8 5 s 1 2 .6 1 0 3 - . 5 3 2 .41 1 /1 4 /1 9 8 5 b 1 2 .6 1 2 0 - .1 3 2 .31 1 /2 0 /1 9 8 5 s 6 2 .6 0 1 7 - . 4 31 .61 1 /2 9 /1 9 8 5 b 9 2 .5 1 7 6 3 .3 3 3 .3
NUMBER OF TRADING SIGNALS: 44NUHBER OF BUY SIGNALS: 2 2NUMBER OF SELL SIGNALS: 22
AVERAGE DURATION OF OPEN POSITIONS: 1 2 .7 DAYS AVERAGE DURATION OF LONG POSITIONS: 1 5 .3 DAYSAVERAGE DURATION OF SHORT POSITIONS: 1 2 .1 DAYS
SUM OF PROFITS: 6 8 .8 CENTSNUMBER OF PROFITS: 19AVERAGE DURATION OF PROFITABLE POSITIONS: 21 . 9 DAYS AVERAGE RETURN FROM PROFITABLE POSITIONS: 3 .6 2 AVERAGE RETURN FROM PROFITABLE POSITIONS PER DAY: .1 7
SUM OF LOSSES: - 1 8 . 9 CENTSNUMBER OF LOSSES: 2 4AVERAGE DURATION OF UNPROFITABLE POSITIONS: 5 . 4 DAYSAVERAGE RETURN FROM UNPROFITABLE POSITIONS: - . 7 9 AVERAGE RETURN FROM UNPROFITABLE POSITIONS PER DAY: - . 1 5
SINGLE RATES OF RETURN:MEAN: 1 .1 6MEDIAN: - . 2 6STANDARD DEVIATION: 3 - 0 4SKEWNESS: 1 .4 1KUR'TOSIS: 3 - 9 4MINIMUM: - 2 . 2 5MAXIMUM: 9 .7 7T-STATISTIC: 2 .4 7DEGREE OF FREEDOM s 42
ANNUAL RATE OF RETURN FROM BUYING AND HOLDING: -5 .1%
18
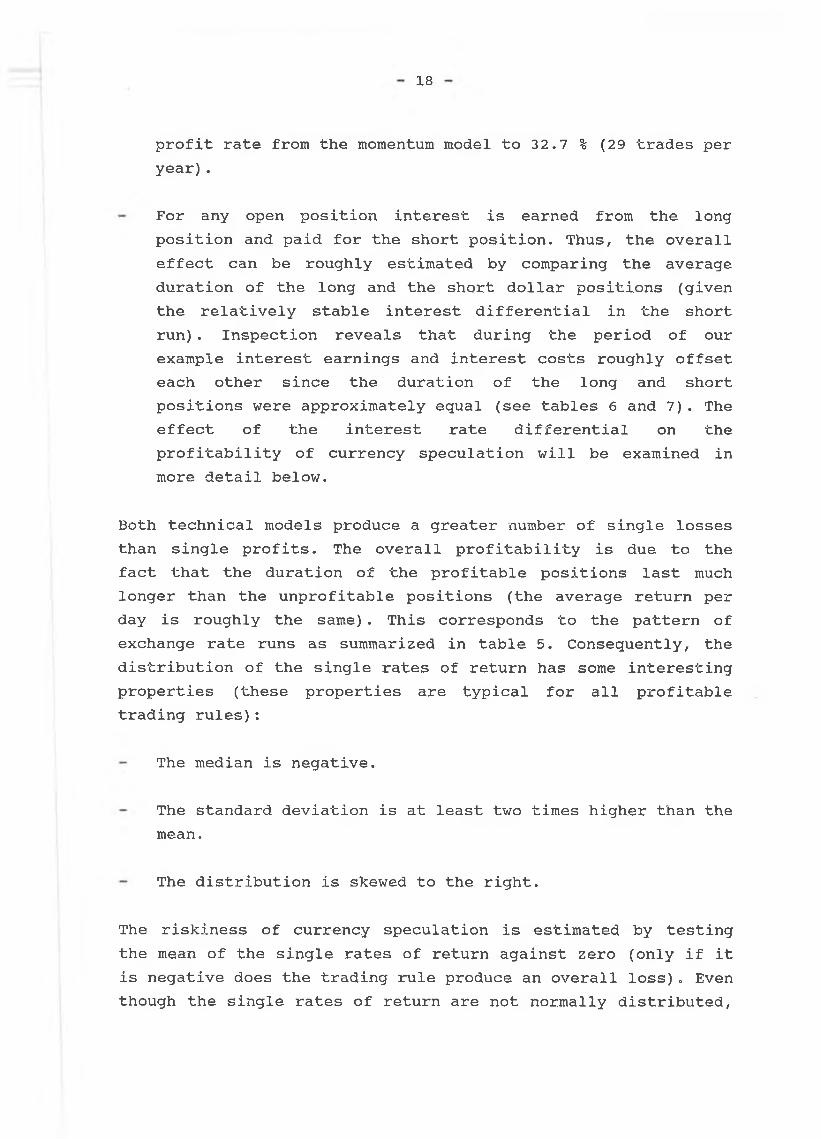
profit rate from the momentum model to 32.7 % (29 trades per year).
For any open position interest is earned from the long position and paid for the short position. Thus, the overall effect can be roughly estimated by comparing the average duration of the long and the short dollar positions (given the relatively stable interest differential in the short run). Inspection reveals that during the period of our example interest earnings and interest costs roughly offset each other since the duration of the long and short positions were approximately equal (see tables 6 and 7). The effect of the interest rate differential on the profitability of currency speculation will be examined in more detail below.
Both technical models produce a greater number of single losses than single profits. The overall profitability is due to the fact that the duration of the profitable positions last much longer than the unprofitable positions (the average return per day is roughly the same) . This corresponds to the pattern of exchange rate runs as summarized in table 5. Consequently, the distribution of the single rates of return has some interesting properties (these properties are typical for all profitable trading rules):
The median is negative.
The standard deviation is at least two times higher than the mean.
The distribution is skewed to the right.
The riskiness of currency speculation is estimated by testing the mean of the single rates of return against zero (only if it is negative does the trading rule produce an overall loss). Even though the single rates of return are not normally distributed,
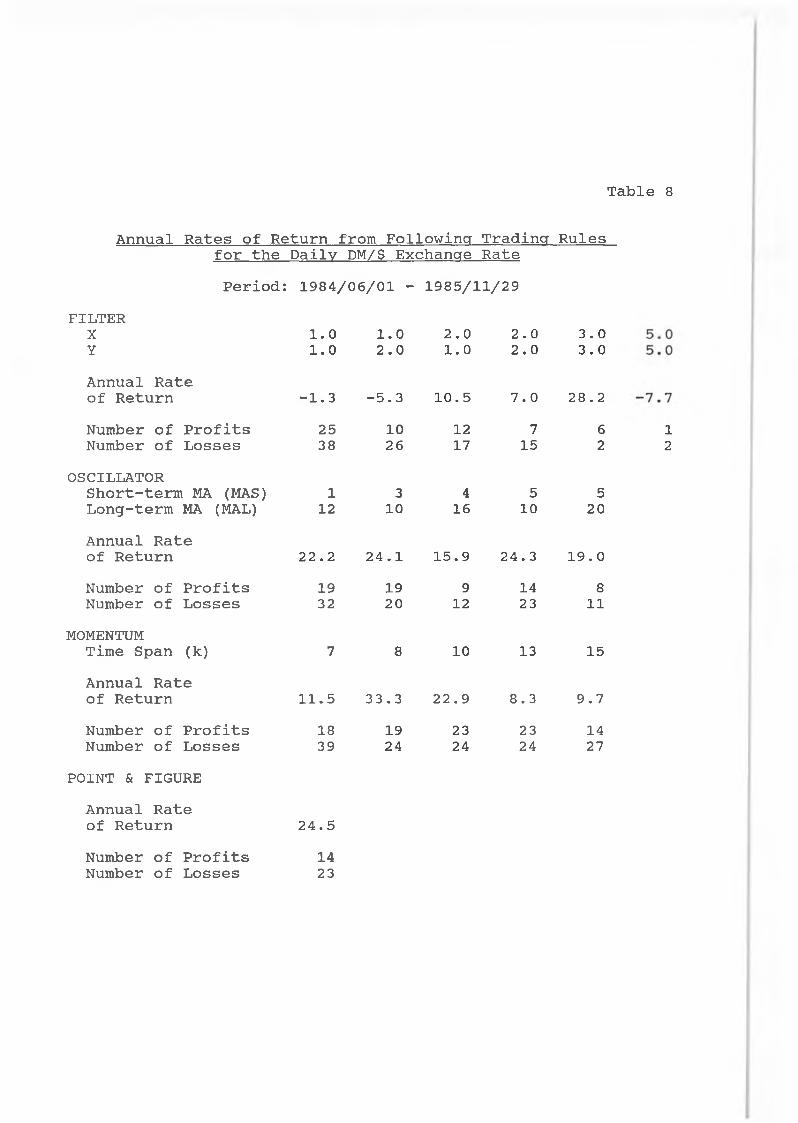
Table 8
Annual Rates of Return from Following Trading Rulesfor the Daily DM/$ Exchange RatePeriod: 1984/06/01 - 1985/11/29
FILTERX 1.0 1.0 2.0 2.0 3.0Y 1.0 2.0 1.0 2.0 3.0Annual Rate of Return -1.3 -5.3 10.5 7.0 28.2Number of Profits 25 10 12 7 6Number of Losses 38 26 17 15 2
OSCILLATORShort-term MA (MAS) 1 3 4 5 5Long-term MA (MAL) 12 10 16 10 20Annual Rate of Return 22.2 24.1 15.9 24.3 19.0Number of Profits 19 19 9 14 8Number of Losses 32 20 12 23 11
MOMENTUMTime Span (k) 7 8 10 13 15Annual Rate of Return 11.5 33.3 22.9 8.3 9.7Number of Profits 18 19 23 23 14Number of Losses 39 24 24 24 27
H CM
POINT & FIGUREAnnual Rateof Return 24.5Number of Profits 14Number of Losses 23
19
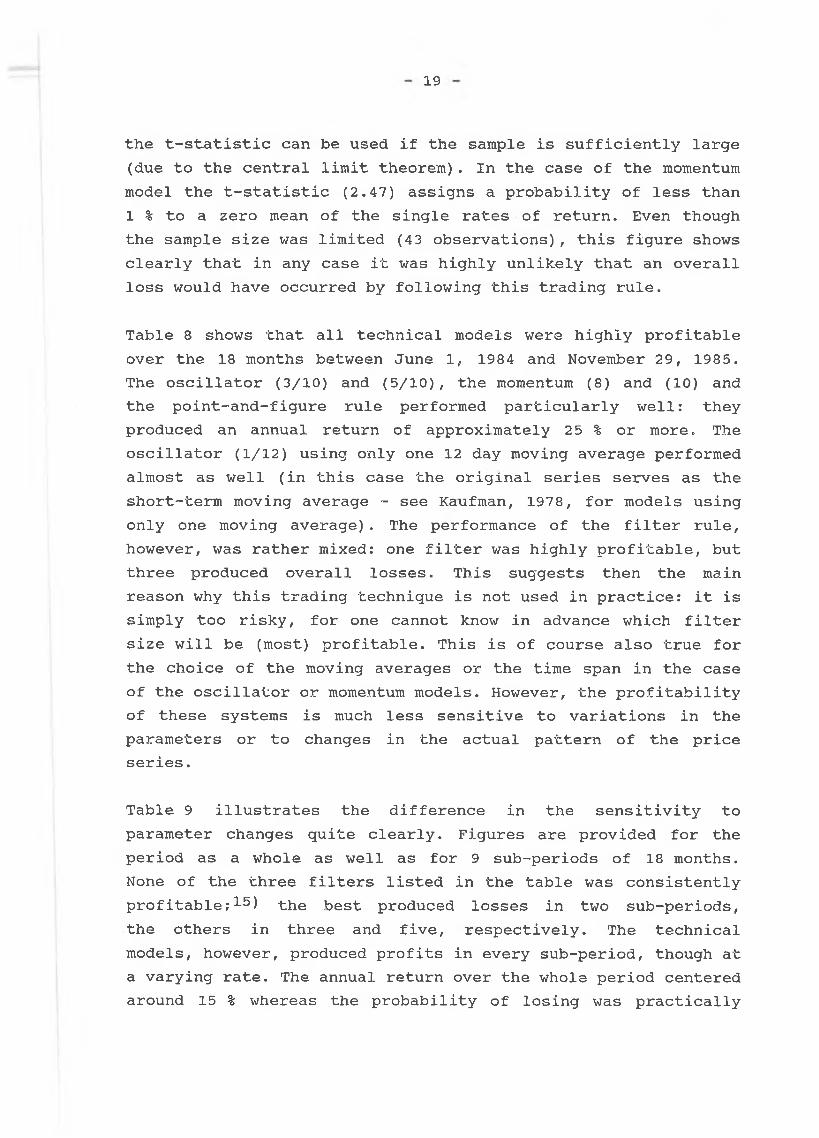
the t-statistic can be used if the sample is sufficiently large (due to the central limit theorem). In the case of the momentum model the t-statistic (2.47) assigns a probability of less than 1 % to a zero mean of the single rates of return. Even though the sample size was limited (43 observations), this figure shows clearly that in any case it was highly unlikely that an overall loss would have occurred by following this trading rule.
Table 8 shows that all technical models were highly profitable over the 18 months between June 1, 1984 and November 29, 1985. The oscillator (3/10) and (5/10), the momentum (8) and (10) and the point-and-figure rule performed particularly well: they produced an annual return of approximately 25 % or more. The oscillator (1/12) using only one 12 day moving average performed almost as well (in this case the original series serves as the short-term moving average - see Kaufman, 1978, for models using only one moving average) . The performance of the filter rule, however, was rather mixed: one filter was highly profitable, but three produced overall losses. This suggests then the main reason why this trading technique is not used in practice: it is simply too risky, for one cannot know in advance which filter size will be (most) profitable. This is of course also true for the choice of the moving averages or the time span in the case of the oscillator or momentum models. However, the profitability of these systems is much less sensitive to variations in the parameters or to changes in the actual pattern of the price series.
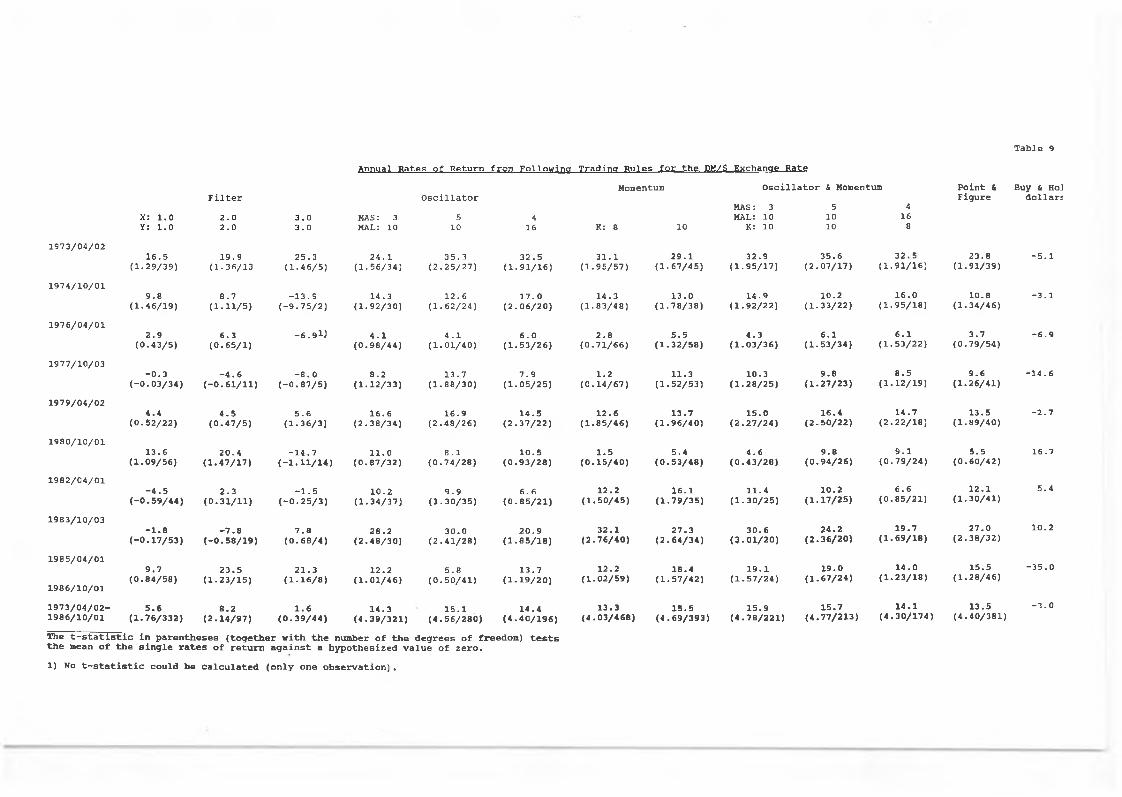
Table 9 illustrates the difference in the sensitivity to parameter changes quite clearly. Figures are provided for the period as a whole as well as for 9 sub-periods of 18 months. None of the three filters listed in the table was consistently profitable;15) the best produced losses in two sub-periods, the others in three and five, respectively. The technical models, however, produced profits in every sub-period, though at a varying rate. The annual return over the whole period centered around 15 % whereas the probability of losing was practically
T a b le 9
A n n u a l R a t e s o f R e t u r n fr o m F o l l o w i n g T r a d in g R u l e s f o r t h e DM /$ E x c h a n g e R a t e
Momentum O s c i l l a t o r & Momentum P o in t &
X : 1 .0Y : 1 .0
F i l t e r
2 .02 .0
3 .03 .0
O s c i l l a t o r
K: 8 10
MAS: 3MAL: 10
K : 10
51010
416
8
F ig u r e
MAS: 3MAL: 10
510
416
1973/04/021 6 .5
(1 .2 9 /3 9 )1 9 .9
(1 .3 6 /1 32 5 .3
(1 .4 6 / 5 )2 4 .1
(1 .5 6 /3 4 )3 5 .3
(2 .2 5 / 2 7 )3 2 .5
(1 .9 1 / 1 6 )3 1 .1
(1 .9 5 / 5 7 )2 9 .1
(1 .6 7 / 4 5 )3 2 .9
(1 .9 5 / 1 7 )3 5 .6
(2 .0 7 /1 7 )3 2 .5
(1 .9 1 / 1 6 )2 3 .8
(1.91/39)
1974/10/019 .8
(1 .4 6 /1 9 )8 .7
(1 .1 1 / 5 )- 1 3 .9
( -9 .7 5 / 2 )1 4 .3
(1 .9 2 /3 0 )1 2 .6
(1 .6 2 /2 4 )1 7 .0
(2 .0 6 / 2 0 )1 4 .3
(1 .8 3 /4 8 )1 3 .0
(1 .7 8 / 3 8 )1 4 .9
(1 .9 2 / 2 2 )10.2
(1 .3 3 /2 2 )1 6 .0
(1 .9 5 / 1 8 )1 0 .8
(1.34/46)
1976/04/012 .9
(0 .4 3 / 5 )6 .3
(0 .6 5 / 1 )- 6 . 9 l ) 4 .1
(0 .9 8 / 4 4 )4 .1
(1 .0 1 / 4 0 )6 .0
(1 .5 3 / 2 6 )2 .8
(0 .7 1 / 6 6 )5 .5
(1 .3 2 / 5 8 )4 .3
(1 .0 3 / 3 6 )6 .1
(1 .5 3 /3 4 )6 .1
(1 .5 3 / 2 2 )3 .7
(0 .7 9 /5 4 )
1977/10/03- 0 .3
(-0 .0 3 / 3 4 )- 4 .6
(-0 .6 1 / 1 1 )- 8 .0
( -0 .8 7 / 5 )8 .2
(1 .1 2 / 3 3 )1 3 .7
(1 .8 8 / 3 0 )7 .9
(1 .0 5 / 2 5 )1 .2
(0 .1 4 / 6 7 )1 1 .3
(1 .5 2 / 5 3 )1 0 .3
(1 .2 8 / 2 5 )9 .8
(1 .2 7 /2 3 )8 .5
(1 .1 2 / 1 9 )9 .6
(1.26/41)
1979/04/024 .4
(0 .5 2 /2 2 )4 .5
(0 .4 7 / 5 )5 .6
(1 -3 6 /3 )1 6 .6
(2 .3 8 /3 4 )1 6 .9
(2 .4 8 / 2 6 )1 4 .5
(2 .3 7 / 2 2 )1 2 .6
(1 .8 5 / 4 6 )1 3 .7
(1 .9 6 / 4 0 )1 5 .0
(2 .2 7 / 2 4 )1 6 .4
(2 .5 0 /2 2 )1 4 .7
(2 .2 2 /1 8 )1 3 .5
(1.89/40)
1980/10/011 3 .6
(1 .0 9 /5 6 )2 0 .4
(1 .4 7 / 1 7 )- 1 4 .7
(-1 .1 1 / 1 4 )1 1 .0
(0 .8 7 / 3 2 )8 .1
(0 .7 4 / 2 8 )1 0 .5
(0 .9 3 / 2 8 )1 .5
(0 .1 5 / 4 0 )5 .4
(0 .5 3 / 4 8 )4 .6
(0 .4 3 / 2 8 )9 .8
(0 .9 4 /2 6 )9 .1
(0 .7 9 / 2 4 )5 .5
(0 .6 0 /4 2 )
1982/04/01- 4 .5
(-0 .5 9 / 4 4 )2 .3
(0 .3 1 / 1 1 )- 1 .5
( -0 .2 5 / 3 )1 0 .2
(1 .3 4 / 3 7 )9 .9
(1 .3 0 /3 5 )6 .6
(0 .8 5 / 2 1 )1 2 .2
(1 .5 0 / 4 5 )1 6 .1
(1 .7 9 / 3 5 )1 1 .4
(1 .3 0 / 2 5 )1 0 .2
(1 .1 7 /2 5 )6 .6
(0 .8 5 / 2 1 )1 2 .1
(1 .3 0 /4 1 )
1983/10/03- 1 .8
(-0 .1 7 / 5 3 )- 7 .8
(-0 .5 8 / 1 9 )7 . 8
(0 .6 8 / 4 )2 8 .2
(2 .4 8 /3 0 )3 0 .0
(2 .4 1 /2 8 )2 0 .9
(1 .8 5 / 1 8 )3 2 .1
(2 .7 6 /4 0 )2 7 .3
(2 .6 4 / 3 4 )3 0 .6
(3 .0 1 / 2 0 )2 4 .2
(2 .3 6 /2 0 )1 9 .7
(1 .6 9 / 1 8 )2 7 .0
(2 .3 8 /3 2 )
1985/04/01
1986/10/01
9 .7(0 .8 4 / 5 8 )
2 3 .5(1 .2 3 / 1 5 )
2 1 .3(1 .1 6 / 8 )
1 2 .2(1 .0 1 / 4 6 )
5 .8(0 .5 0 / 4 1 )
1 3 .7(1 .1 9 / 2 0 )
1 2 .2(1 .0 2 /5 9 )
1 8 .4(1 .5 7 / 4 2 )
1 9 .1(1 .5 7 / 2 4 )
1 9 .0(1 .6 7 /2 4 )
1 4 .0(1 .2 3 / 1 8 )
1 5 .5(1 .2 8 /4 6 )
1 973/04/02-1986/10/01
5 .6(1 .7 6 /3 3 2 )
8 .2(2 .1 4 / 9 7 )
1 .6(0 .3 9 / 4 4 )
1 4 .3(4 .3 9 /3 2 1 )
1 5 .1(4 .5 6 / 2 8 0 )
1 4 .4(4 .4 0 / 1 9 6 )
1 3 .3(4 .0 3 /4 6 8 )
1 5 .5(4 .6 9 /3 9 3 )
1 5 .9(4 .7 8 / 2 2 1 )
1 5 .7(4 .7 7 /2 1 3 )
1 4 .1(4 .3 0 / 1 7 4 )
1 3 .5(4 .40/381)
Buy & Ho] d o lla r s
- 5 .1
- 3 .1
- 6 .9
- 1 4 .6
- 2 .7
1 6 .7
5 .4
1 0 .2
- 3 5 .0
- 3 .0
The t - s t a t i s t i c i n p a r e n th e s e s ( t o g e t h e r w it h t h e number o f t h e d e g r e e s o f freedom ) t e s t s t h e mean o f th e s i n g l e r a t e s o f r e t u r n a g a i n s t a h y p o t h e s iz e d v a lu e o f z e r o .
1) No t - s t a t i s t i c c o u ld be c a l c u l a t e d ( o n ly one o b s e r v a t io n ) •
20
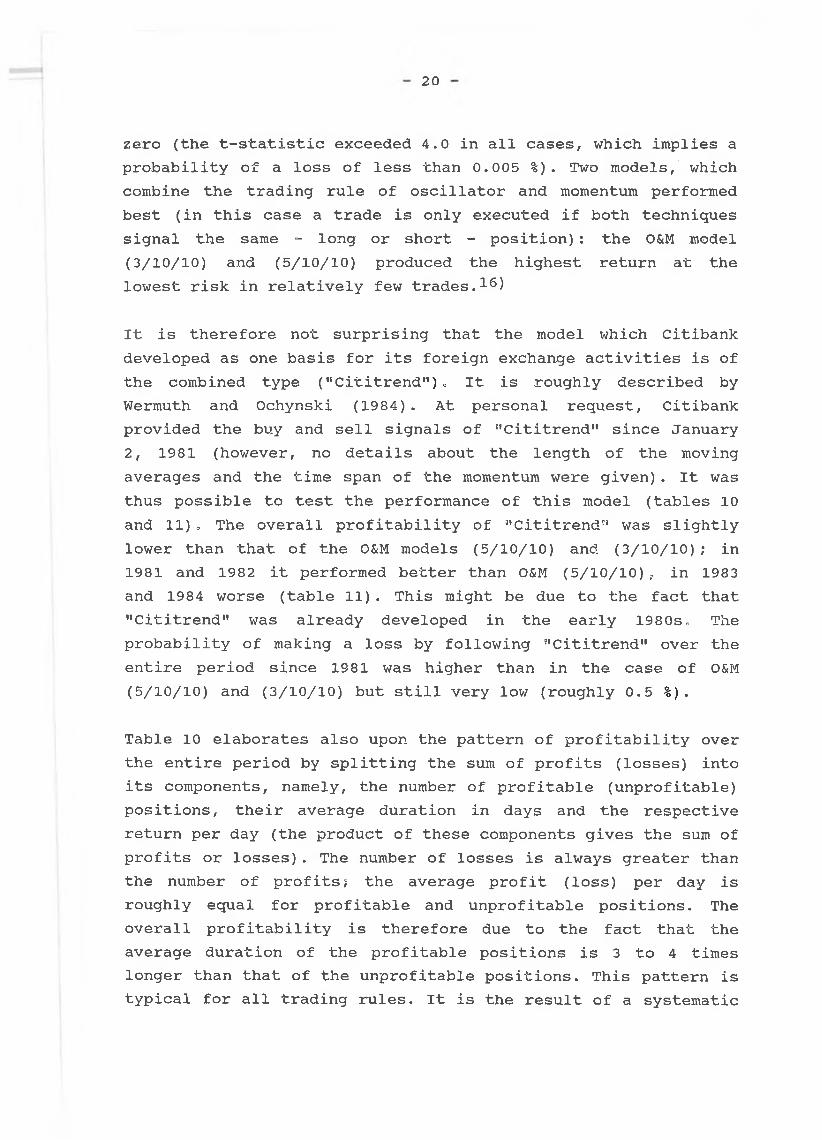
zero (the t-statistic exceeded 4.0 in all cases, which implies a probability of a loss of less than 0.005 %) . Two models, which combine the trading rule of oscillator and momentum performed best (in this case a trade is only executed if both techniques signal the same - long or short - position) : the O&M model (3/10/10) and (5/10/10) produced the highest return at the lowest risk in relatively few trades.16)
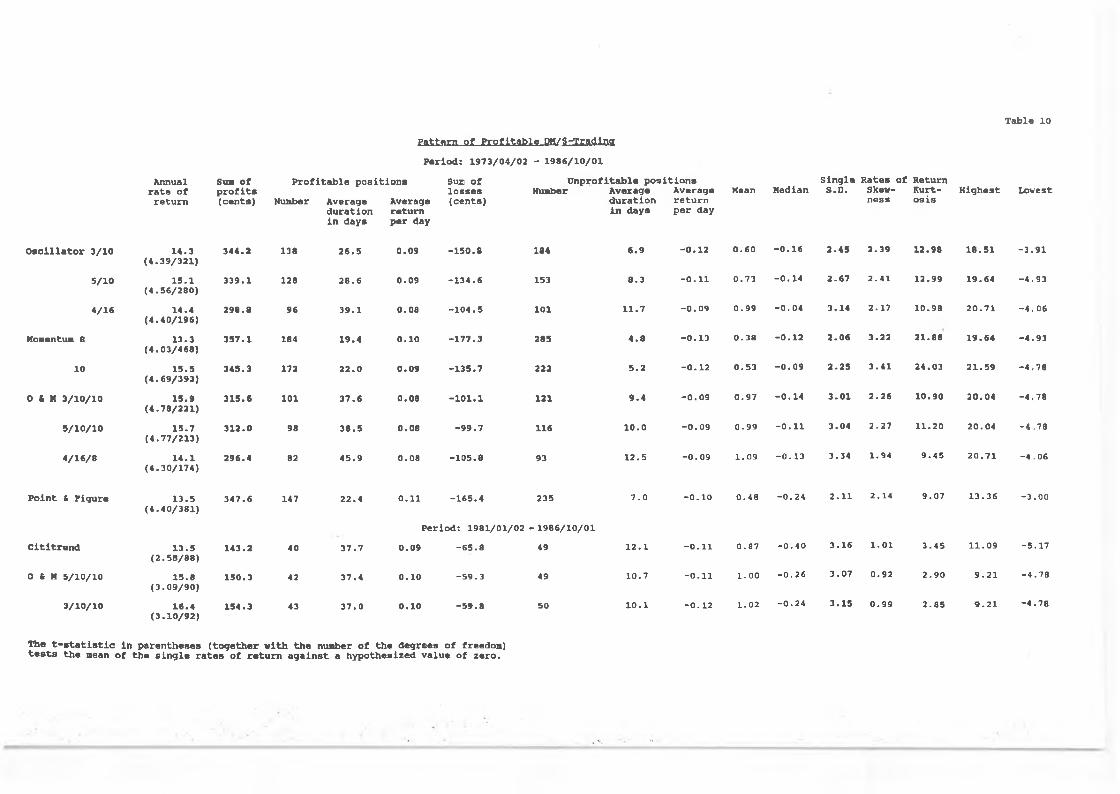
It is therefore not surprising that the model which Citibank developed as one basis for its foreign exchange activities is of the combined type ("Cititrend")„ It is roughly described by Wermuth and Ochynski (1984). At personal request, Citibank provided the buy and sell signals of "Cititrend" since January 2, 1981 (however, no details about the length of the moving averages and the time span of the momentum were given) . It was thus possible to test the performance of this model (tables 10 and 11) . The overall profitability of "Cititrend" was slightly lower than that of the O&M models (5/10/10) and (3/10/10) ; in 1981 and 1982 it performed better than O&M (5/10/10) , in 1983 and 1984 worse (table 11) . This might be due to the fact that "Cititrend" was already developed in the early 1980s. The probability of making a loss by following "Cititrend" over the entire period since 1981 was higher than in the case of O&M (5/10/10) and (3/10/10) but still very low (roughly 0.5 %).
Table 10 elaborates also upon the pattern of profitability over the entire period by splitting the sum of profits (losses) into its components, namely, the number of profitable (unprofitable) positions, their average duration in days and the respective return per day (the product of these components gives the sum of profits or losses). The number of losses is always greater than the number of profits; the average profit (loss) per day is roughly equal for profitable and unprofitable positions. The overall profitability is therefore due to the fact that the average duration of the profitable positions is 3 to 4 times longer than that of the unprofitable positions. This pattern is typical for all trading rules. It is the result of a systematic
P a tte r n o f P r o f i t a b l e D M /S-T radlna
T ab la 10
P e r io d : 1 9 7 3 /0 4 /0 2 - 1 9 8 6 /1 0 /0 1
Annual r a t e o f
r e tu r n
Sum o fp r o f i t s( c e n ts )
P r o f i t a b le p o s i t i o n s Sue o f l o s s e s ( c e n t s ,
U n p r o f it a b le p o s i t i o n sMean M edian
S in g le R a te s o f R eturnL ow estHumber A verage
d u r a tio n i n d a y s
A verage r e tu r n p e r day
S .D . Skewn e s s
K u rt-o s i s
H ig h e s tNunber A verage
d u r a tio n in d a y s
A verage r e tu r n p e r day
O s c i l l a t o r 3 /1 0 1 4 .3( 4 .3 9 /3 2 1 )
3 4 4 .2 138 2 6 .5 0 .0 9 - 1 5 0 .8 184 6 .9 - 0 .1 2 0 .6 0 - 0 .1 6 2 .4 5 2 .3 9 1 2 .9 8 1 8 .5 1 - 3 .9 1
5 /1 0 1 5 .1( 4 .5 6 /2 8 0 ,
3 3 9 .1 128 2 8 .6 0 .0 9 - 1 3 4 .6 153 8 .3 - 0 .1 1 0 .7 3 - 0 .1 4 2 .6 7 2 .4 1 1 2 .9 9 1 9 .6 4 -4 .9 3
4 /1 6 1 4 .4( 4 .4 0 /1 9 6 )
2 9 8 .8 96 3 9 .1 0 .0 8 - 1 0 4 .5 101 1 1 .7 - 0 .0 9 0 .9 9 - 0 .0 4 3 .1 4 2 .1 7 1 0 .9 8 2 0 .7 1 - 4 .0 6
Momentum 8 1 3 .3( 4 .0 3 /4 6 8 )
3 5 7 .1 184 1 9 .4 0 .1 0 - 1 7 7 .3 285 4 .8 - 0 .1 3 0 .3 8 - 0 .1 2 2 .0 6 3 .2 2 2 1 .8 8 1 9 .6 4 - 4 .9 3
10 1 5 .5( 4 .6 9 /3 9 3 ,
3 4 5 .3 172 2 2 .0 0 .0 9 - 1 3 5 .7 222 5 .2 - 0 .1 2 0 .5 3 - 0 .0 9 2 .2 5 3 .4 1 2 4 .0 3 2 1 .5 9 - 4 .7 8
O I X 3 /1 0 /1 0 1 5 .9( 4 .7 8 /2 2 1 ,
3 1 5 .6 101 3 7 .6 0 .0 8 - 1 0 1 .1 121 9 .4 - 0 .0 9 0 .9 7 - 0 .1 4 3 .0 1 2 .2 6 1 0 .9 0 2 0 .0 4 -4 .7 8
5 /1 0 /1 0 1 5 .7( 4 .7 7 /2 1 3 )
3 1 2 .0 98 3 8 .5 0 .0 8 - 9 9 .7 116 1 0 .0 - 0 .0 9 0 .9 9 - 0 .1 1 3 .0 4 2 .2 7 1 1 .2 0 2 0 .0 4 -4 ,.78
4 /1 6 /8 1 4 .1( 4 .3 0 /1 7 4 )
2 9 6 .4 82 4 5 .9 0 .0 8 - 1 0 5 .8 93 1 2 .5 - 0 .0 9 1 .0 9 - 0 .1 3 3 .3 4 1 .9 4 9 .4 5 2 0 .7 1 - 4 .0 6
P o in t t F ig u r e 1 3 .5( 4 .4 0 /3 8 1 )
3 4 7 .6 147 2 2 .4 0 .1 1 - 1 6 5 .4 235 7 .0 - 0 .1 0 0 .4 8 - 0 .2 4 2 .1 1 2 .1 4 9 .0 7 1 3 .3 6 -3 .0 0
P e r io d : 1 9 8 1 /0 1 /0 2 - 1 9 8 6 /1 0 /0 1
C it i t r e n d 1 3 .5( 2 .5 8 /8 8 )
1 4 3 .2 40 3 7 .7 0 .0 9 - 6 5 .8 49 1 2 .1 - 0 .1 1 0 .8 7 - 0 .4 0 3 .1 6 1 .0 1 3 .4 5 1 1 .0 9 -5 .1 7
0 t M 5 /1 0 /1 0 1 5 .8( 3 .0 9 /9 0 ,
1 5 0 .3 42 3 7 .4 0 .1 0 - 5 9 .3 49 1 0 .7 - 0 .1 1 1 .0 0 - 0 .2 6 3 .0 7 0 .9 2 2 .9 0 9 .2 1 - 4 .7 8
3 /1 0 /1 0 1 6 .4( 3 .1 0 /9 2 )
1 5 4 .3 43 3 7 .0 0 .1 0 - 5 9 .8 50 1 0 .1 - 0 .1 2 1 .0 2 - 0 .2 4 3 .1 5 0 .9 9 2 .8 5 9 .2 1 - 4 .7 8
The t - s t a t i s t i c in p a r e n th e s e s ( to g e t h e r w ith th e number o f th e d e g r e e s o f freed o n )t e s t s th e mean o f th e s i n g l e r a t e s o f r e tu r n a g a in s t a h y p o th e s iz e d v a lu e o f z e r o .
21
exploitation of the pattern of runs already discussed (tables 3, 4 and 5) . At the same time the use of technical models feeds back upon exchange rate dynamics, thereby strengthening the pattern of runs. The distribution of the single rates of return (ri) reflects these regularities (table 10 and figure 5). The median is negative and smaller than the mean, the distribution is consequently skewed to the right, the coefficient of kurtosis is greater than that of a normal distribution (3.0).17)
Table 11 estimates the effect of the differential between dollar and deutschemark interest rates on the profitability of currency speculation (the technical model O&M (5/10/10) is taken as an example)„ On the assumption that this differential is stable over each single year, the net interest effect can be calculated from the overall duration of the long and short dollar positions.18) In the years of a depreciating dollar the net interest effect was negative since the duration of the long positions was shorter than the duration of the short positions (the dollar interest was above the deutschemark interest in all years besides 1973)„ The opposite was true in the years 1980 to 1984 (and also 1975) when the interest rate effect increased the profitability of currency speculation. This is also true of the profitability of "Cititrend'’ as can be seen from the average duration of long and short dollar positions.
The total interest effect in the case of the technical model O&M(5/10/10) over all 13.5 years was practically nil (exactly: 0.06 % per year).
Expectation Formation and Determination of Exchange Rates in theShort Run
"It is not uncommon for professional market participants to have two opinions at the same time regarding the trend of a specific currency in the exchange market. One opinion may relate to the long-term trend , which is based on the fundamental forces „..
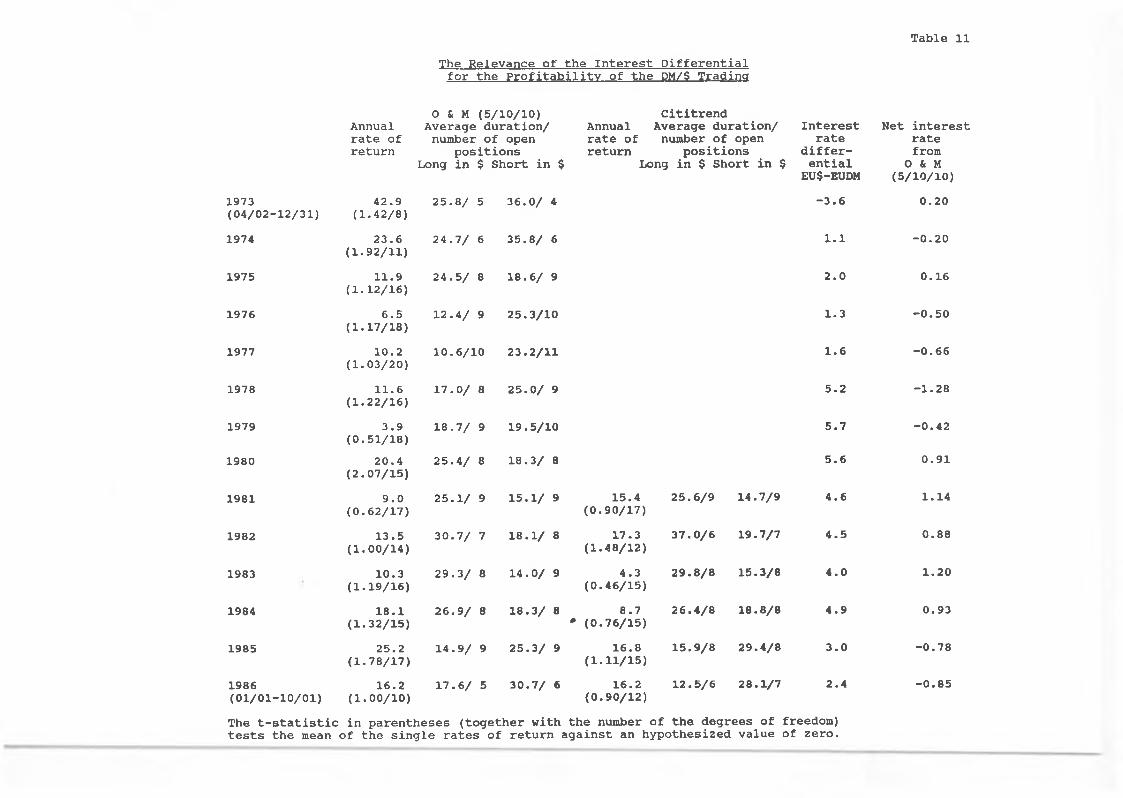
Table 11The Relevance of the Interest Differentialfor the Profitability of the DM/$ Trading
0 & M (5/10/10) CititrendAnnual rate of return
Average duration/ number of open
positionsLong in $ Short in $
Annual rate of return
lx
Average duration/ number of open
positions□ng in $ Short in $
Interestrate
differential
EU$-EUDM
Net interest rate from
0 Sc M (5/10/10)
1973(04/02-12/31)
42.9(1.42/8)
25.8/ 5 36.0/ 4 -3.6 0.20
1974 23.6(1.92/11)
24.7/ 6 35.8/ 6 1.1 -0.20
1975 11.9(1.12/16)
24.5/ 8 18.6/ 9 2.0 0.16
1976 6.5(1.17/18)
12.4/ 9 25.3/10 1.3 -0.50
1977 10.2(1.03/20)
10.6/10 23.2/11 1.6 -0.66
1978 11.6(1.22/16)
17.0/ 8 25.0/ 9 5.2 -1.28
1979 3.9(0.51/18)
18.7/ 9 19.5/10 5.7 -0.42
1980 20.4(2.07/15)
25.4/ 8 18.3/ 8 5.6 0.91
1981 9.0(0.62/17)
25.1/ 9 15.1/ 9 15.4(0.90/17)
25.6/9 14.7/9 4.6 1.14
1982 13.5(1.00/14)
30.7/ 7 18.1/ 8 17.3(1.48/12)
37.0/6 19.7/7 4.5 0.88
1983 10.3(1.19/16)
29.3/ 8 14.0/ 9 4.3(0.46/15)
29.8/8 15.3/8 4.0 1.20
1984 18.1(1.32/15)
26.9/ 8 18.3/ 8 8 • 7• (0.76/15)
26.4/8 18.8/8 4.9 0.93
1985 25.2(1.78/17)
14.9/ 9 25.3/ 9 16.8(1-11/15)
15.9/8 29.4/8 3.0 -0.78
1986(01/01-10/01)
16.2(1.00/10)
17.6/ 5 30.7/ 6 16.2(0.90/12)
12.5/6 28.1/7 2.4 -0.85
The t-statistic in parentheses (together with the number of the degrees of freedom)tests the mean of the single rates of return against an hypothesized value of zero.
22
The other opinion may be concerned with the very short-term trend of a currency, which i s based on the technical and psychological conditions of the market” (Riehl and Rodriguez, 1977, p,134). Both types of expectations are formed in a qualitative manner, i.e., they concern only the direction of the short and the long-term trend without specifying how long it will last and which exchange rate level will be reached by its end.19) This kind of expectation is sufficient to make profits consistently. It is at the same time highly efficient given the specific uncertainty (in the sense of Knight and Keynes) in the foreign exchange market. Technical analysis fits this type of qualitative expectations formation particularly well. However, this type of expectations formation does not have to be based on technical analysis in order to be profitable. European banks, for example, also profit consistently from foreign exchange trading (and particularly from holding strategic positions as I was told in interviews) , yet they subscribe much less to technical analysis than market participants in the US. European dealers try to separate runs from "whipsaws” mainly by observing "the psychological conditions of the market" using primarily the network of personal contacts with other dealers. Both approaches, the observation of "market psychology" and the technical analysis try to solve the same problem, namely, how to form expectations about the other agents’ expectations, since the market price represents the aggregate outcome of the individual expectations.20)
The medium-term (long-term) expectations influence the behaviour of foreign exchange dealers insofar as they impact on the length of time a strategic position is held, i.e,, open positions that are congruent with the prevailing bias are held longer than positions that are incongruent. (In accordance with the usual terminology in economics the notion "medium-term" is used for that time horizon which participants in the foreign exchange market call "long-term" since the latter covers a maximum of a few years.) In this way a basic expectational bias in favour or against a currency brings about an overall appreciation or
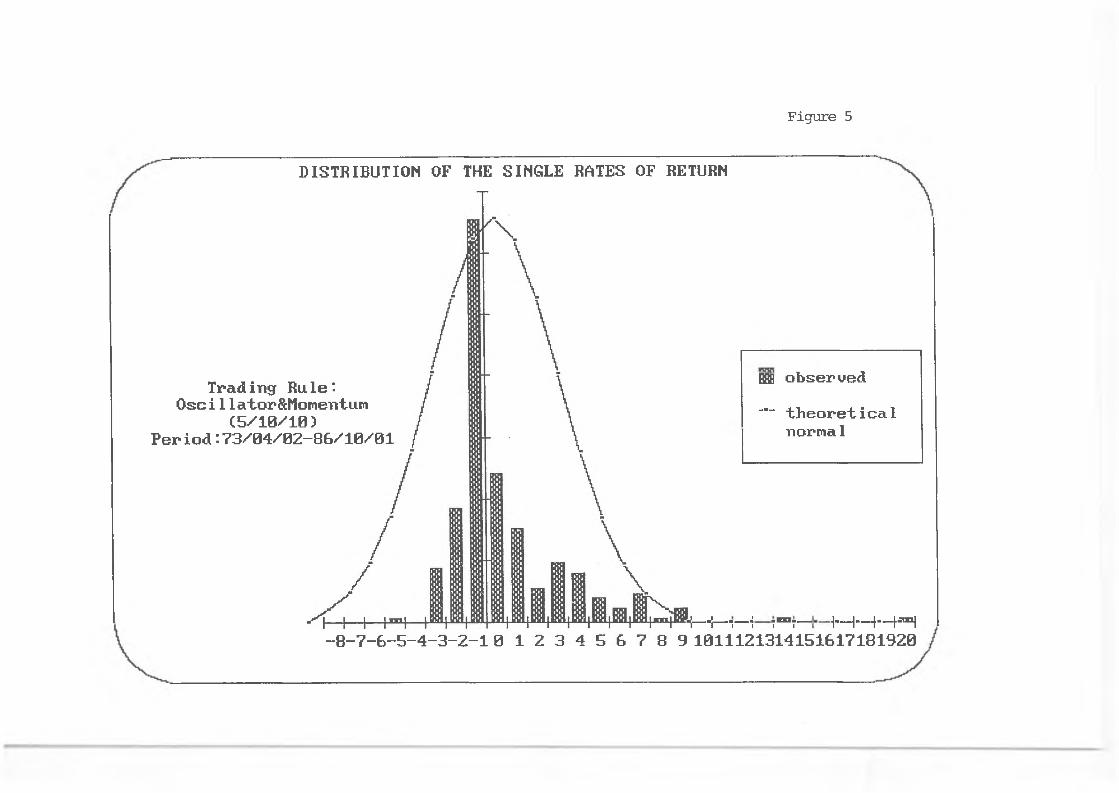
Figure 5
DISTRIBUTION OF THE SINGLE RATES OF RETURN
-8-7-6-5-4-3-2-10
Trading Rule'- Osc i1lator&Momentum
(5/10/10)Period:73/04/02-86/10/01
Bflfl observed— theoretical
normal
-h— !— ■i t“ ?— 1— 1--+--P1 8 9 1011121314151617181920
23
depreciation trend which can last for several years.
The process of exchange rate determination in the short run can be conceived as follows. A few days after a turning point has occurred the most sensitive technical models (those operating with a short moving average or a short time span for the momentum) signal a run. This leads the most risk-prone players (those who prefer these models) to take an open position. If the price movement is also backed by "news" or by a change in the market's "mood", then the run gains momentum. This increased momentum causes the "slower" technical models to produce a trading signal that feeds back on the momentum of the run. The longer the run lasts, the more intense the "stress" of the market becomes (to use a term coined by Kindleberger, 1978). Since no technical model can signal the end of a run, market participants become more susceptible to external "news" concerning economic or political events that could be interpreted by other market participants as a signal for a "tilt" of the run. Once the "stress" is sufficiently intense, virtually any "news" can trigger off the "bursting" of the short-term bubble. Such a "tilt" often ushers in the beginning of a next bubble.21)
This pattern of speculative behaviour also explains the statistical phenomenon of non-periodic cycles in daily exchange rates. Booth, Kaen and Koveos (1982) showed that this persistent dependency (as it is termed in statistics) is a typical property of exchange rate dynamics (they used the so-called R/S analysis). The phenomenon of non-periodic price cycles was also detected for the stock market (Greene and Fielitz, 1977). Kaen and Rosenman (1986) interpreted this phenomenon within the theory of predictable behaviour as proposed by Heiner (1983). Their interpretation accords well with many of the characteristics of expectations formation and price determination in the foreign exchange market. However, the conclusion that their analysis can explain the phenomenon of non-periodic price cycles without implying the existence of a
24
’’money machine" does not seem to grasp the actual reason for this phenomenon.
To summarize: there operates a specific interaction in the foreign exchange market between expectations formation and profit-maximizing behaviour of the agents on one hand and the pattern of price fluctuations on the other. For every single agent the sequence of exchange rate runs and "whipsaws" is perceived as given and consequently exploitable, particularly by means of technical analysis. At the same time, however, this systematic speculation feeds back upon the pattern of exchange rate movements, thereby strengthening its specific shape. It is therefore not surprising that 85 % of banks and securities houses in the survey of the Group of Thirty responded that exchange rate volatility had a positive impact on their firms’ profitability (Group of Thirty, 1985, p.19).22)
The Winners and the Losers in the Currency Game
The actual income of banks from foreign exchange trading as reported in their income statement is in line with the systematic profitability of technical trading rules. In 1985, 12 US banks earned a foreign exchange trading income of 1,165.4 million $, almost five times as much as in 1977 (247.5 million $).23) The four most profitable banks were Citibank (358.0 million $) , Chase Manhattan Bank (173.4 million $), Morgan Guaranty Trust (172.6 million $), and the Bank of America (150.0 million $) . Most interesting is the fact that the foreign exchange business was profitable for every single bank in every single year. These figures cover the banks' income from all types of foreign exchange activities; profits from speculation-oriented business cannot be separated from arbitrage-oriented activities or customer business. However, there can be no doubt that short-term currency speculation has contributed considerably to the overall profitability of foreign exchange trading. This is clear from the growing importance of
25
technical analysis as reported by banks and securities houses(Group of Thirty, 1985, p.15) as well as from the increasing number and profitability of those firms which produce and sell technical models for foreign exchange trading (for a description of these services see "Euromoney", August 1986, p.198-201).2^)
Buying and selling currencies per se is of course a zero-sum game (if the revaluation of stocks is ignored) . Now, if banks, but probably also securities houses, commodities firms, and multinational industrial corporations, consistently win in this game, who then is the loser? Or more concretely: which group of agents sell dollars to foreign exchange traders when the dollar appreciates in the following days or weeks (and vice versa)? The answer is simple: all those market participants who buy or sell foreign exchange for other reasons than short-term profit maximization from foreign exchange dealing itself (including intervening central banks), particularly all those traders of goods and services who perceive and use foreign exchange for international payment rather than as a financial asset. The decisions of exporters or importers to buy or sell a currency are determined by the wish to carry out an import business or to convert export earnings into the domestic currency of the producer (the ultimate reason being the interest of the producer to obtain liguidity in that currency in which he has to pay the costs of production). A German exporter, e.g., who happens to receive a dollar payment on June 18, 1984 (figure 4) will change it into deutschemark without realizing that an appreciation run of the dollar was on its way (the same would be true for a tourist from the US who happens to travel in Germany at that time). Whereas the actors of the "real world" see foreign exchange as a flow which has to be converted into the domestic currency of the producer for reasons of liquidity, the actors of the "financial world" see foreign exchange as an asset which has to be held for reasons of speculation. In other words, the exchange rate represents a flow price and an asset (stock) price at the same time, whereby the traders of goods and services perceive mainly the flow aspect and the traders of financial
26
assets perceive mainly the asset (stock) aspect.25)
On a more insidious note, exporters and importers, in order to carry out the payments in international trade, must participate in a casino. However, most commercial agents (including those of services like tourists) are not aware of this type of financial intermediation and do not know the specific rules of the game. Ironically, exporters (importers) perceive only the service aspect of the banks* activities which certainly facilitate the international trade of goods and services. The banks themselves may not be completely aware of this relationship since customer business and foreign exchange trading are usually carried out in two different divisions. The same might be true for multinational industrial corporations with professional foreign exchange departments. Certainly they realize the profitability of currency speculation but it is less certain whether they realize that their activities in the asset market often impedes their activities in the goods market. For example, if the currency speculation of a corporation like Renault had contributed to the dollar depreciation since 1985 (this is highly probable since this French car maker is heavily engaged in foreign exchange trading), then these activities would have restricted the export and consequently the production of their cars. Of course the contribution of any single bank or industrial corporation to exchange rate instability is miniscule. However, this is not true for the aggregate of all professional players. The effect of currency speculation on the overall profitability from activites in both markets, the goods market as well as the asset market, is difficult to estimate, for the interaction of both types of activities certainly does not represent a zero-sum game, neither for a single industrial corporation nor for the world economy as a whole.
The persistent redistribution of income from activities in the goods market to activities in the asset market through currency speculation has not received much attention for several reasons. First, the overall amount of the redistributed income is very
27
small relative to the volume of international trade of goods and services. Second, the number of participants in the international goods market is much greater than the number of foreign exchange dealers. Third, the volume per transaction is much smaller in the goods market than in the asset market. Fourth, most end-users (traders of goods and services, portfolio investors) transact on only one side of the market, either buying or selling, so that any loss remains only an opportunity loss rather than a realized cash loss. Fifth, most participants in the goods market (particularly smaller firms and tourists) do not watch exchange rate changes every day and are therefore not aware of their respective opportunity losses or profits. Hence, a large profit for an individual speculator like a bank -contributing in some cases to more than 30 % of its overall income - consists of many miniscule losses distributed more or less randomly over the many transactions associated with the international trade of goods and services. The direct effect of short-term currency speculation on international trade through income redistribution is almost negligible. Much more important, however, are the indirect effects through the destabilization of exchange rates, particularly with respect to the dollar as the world currency.
The distributional effect of currency speculation represents another reason why the dollar appreciation in the 1980's lasted so long. During that period, the goods market provided the asset market with additional net dollar positions through the increasing US current account deficit. Consequently, the burden of adjustment to the expectational bias in favour of the dollar did not fall exclusively upon the exchange rate. The contrary has been true since spring 1985; the expectational bias has since then been operating against the dollar (i.e, in favour of the Yen and the deutschemark) , but the US current account deficit has persisted as have the respective surpluses of Japan and Germany. Thus, the price effect of the currency preference of speculators was no longer dampened but sharpened by the asset supply conditions. Consequently, the fall of the dollar was much
28
steeper than had been its preceding rise.
VI. Exchange Rate Dynamics in the Medium Run
Foreign exchange dealers operate on the basis of a medium-term expectational bias in favour or against a currency. If a current run is in line with the prevailing bias they hold a strategic position some days longer than otherwise. This behaviour brings about a medium-term appreciation or depreciation in a stepwise process. The factors that determine the existence of such a medium-term bias as well as the turnabouts are discussed below.
Medium-term exchange rate expectations are based much more on "market fundamentals" than are the short-term expectations (see also the description of Riehl and Rodriguez quoted above). However, the medium-term development of the dollar progressively contradicted the traditional theoretical equilibrium conditions of the goods market and the asset market (purchasing power parity and uncovered interest parity)„ If one assumes rational expectations, then the market participants must have used the information about developments in the goods market and in the asset market in a way different from that hypothesized by standard theory. In order to detect the systematic components of the actual process of exchange rate expectations formation in the medium run , the "gestalt" of the interaction of the goods market and the asset market was explored as a first step (figures 1 and 6).26)
Empirical Evidence 1973 - 1986
The strong depreciation of the dollar had come to an end in 1979 when it lay, by 28.7 %, below the purchasing power parity level. Partly as a consequence of the undervaluation of the dollar the US current account became active in 1980 (for the first time in four years). At the same time, the German current account
29
deteriorated unlike at anytime in post-war history, due to the combined effects of a strongly overvalued deutschemark as well as the second oil price shock. Thus, the goods market led one to expect an appreciation of the dollar against the deutschemark. But this expectation was held in balance by the asset markets, through a continuous increase of the real interest rate differential.27) In January 1979, the real interest rate in Germany was only by 0.9 % higher than in the US. This differential rose to 4.9 % in September 1979 and reached a post-war maximum of 10.8 % in May 1980 (this process was strengthened by the turbulent fluctuations of the nominal dollar interest rate in the first months after the change of US monetary policy in October 1979). Thus the "real" forces of the goods market and the "financial" forces of the asset market were working in opposite directions and helped ,to maintain such a "precarious equilibrium".
However, when the new monetary policy of the US finally became effective, the US real interest rate increased abruptly relative to the German rate, by 8.6 % within 6 months (May 1980 to November 1980). Instead of the asset markets holding the expectation from the goods market in check it now served to reinforce this already strong motivation. Thus an expectational bias in favour of the dollar was established. Consequently, foreign exchange dealers held open deutschemark positions longer than open dollar positions and portfolio investors shifted capital out of the deutschemark into the dollar. This induced a continuous self-sustaining appreciation of the dollar in a stepwise process. Both variables which form exchange rate expectations, the "real" forces of the goods market and the "financial" forces of the asset market, were now working in perfect unison. (The result of polls indicating that Ronald Reagan would be elected president of the US might then have served as a start signal for the dollar appreciation process which actually took off in October 1980.)
Once such capital and exchange rate movements come to start,

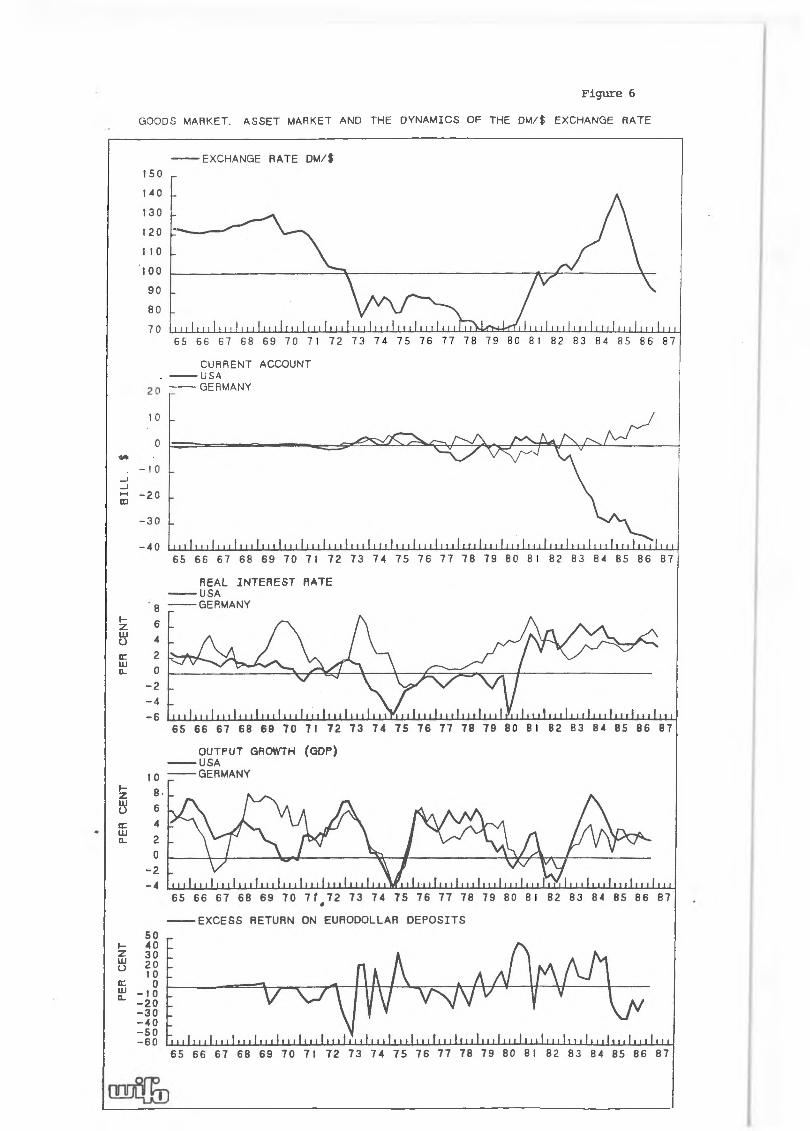
Figure 6GOODS MARKET. ASSET MARKET AND THE DYNAMICS OF THE D M /| EXCHANGE RATE
CURRENT ACCOUNT. -------- USA, -------- GERMANY
PER
CEN
T PE
R
CEN
T PE
R C
ENT
BIL
L.
REAL INTEREST RATE
OUTPUT GROWTH (GDP)
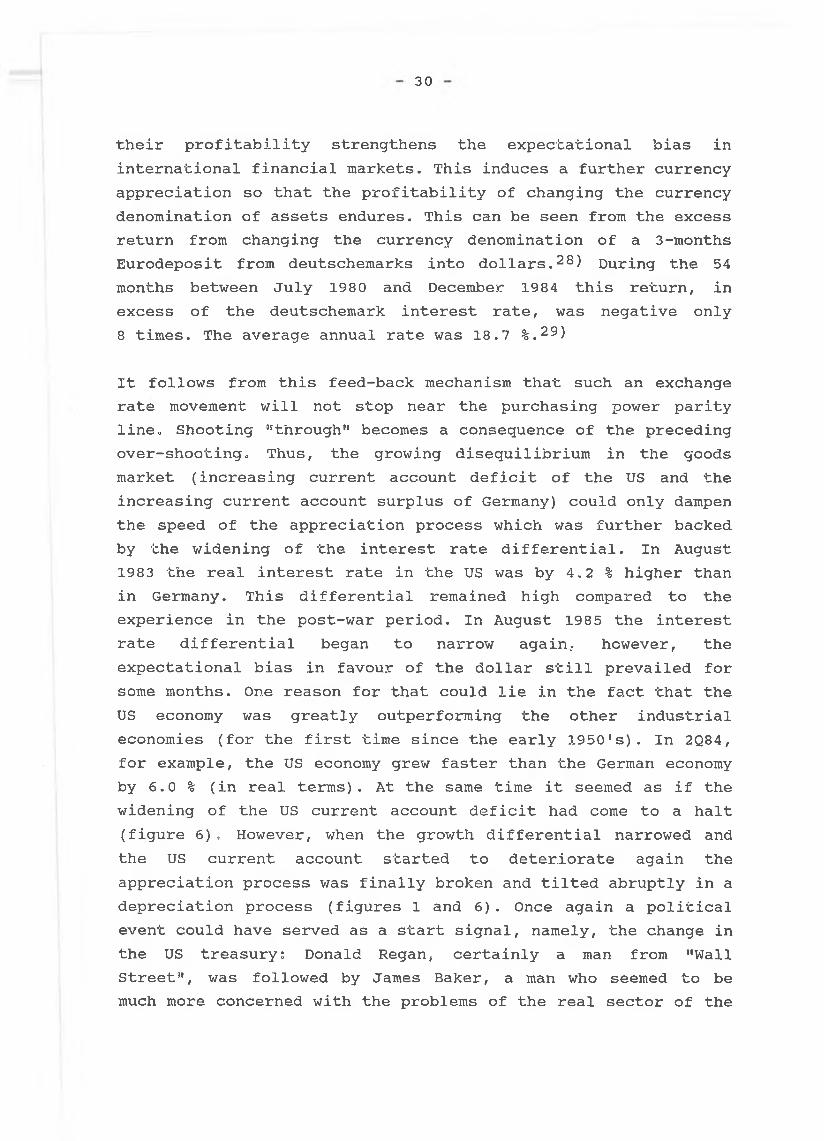
30
their profitability strengthens the expectational bias in international financial markets. This induces a further currency appreciation so that the profitability of changing the currency denomination of assets endures. This can be seen from the excess return from changing the currency denomination of a 3-months Eurodeposit from deutschemarks into dollars.28) During the 54 months between July 1980 and December 1984 this return, in excess of the deutschemark interest rate, was negative only 8 times. The average annual rate was 18.7 %.29)
It follows from this feed-back mechanism that such an exchange rate movement will not stop near the purchasing power parity line«, Shooting ’’through" becomes a consequence of the preceding over-shooting. Thus, the growing disequilibrium in the goods market (increasing current account deficit of the US and the increasing current account surplus of Germany) could only dampen the speed of the appreciation process which was further backed by the widening of the interest rate differential. In August 1983 the real interest rate in the US was by 4.2 % higher than in Germany. This differential remained high compared to the experience in the post-war period. In August 1985 the interest rate differential began to narrow again, however, the expectational bias in favour of the dollar still prevailed for some months. One reason for that could lie in the fact that the US economy was greatly outperforming the other industrial economies (for the first time since the early 1950's). In 2Q84, for example, the US economy grew faster than the German economy by 6.0 % (in real terms). At the same time it seemed as if the widening of the US current account deficit had come to a halt (figure 6). However, when the growth differential narrowed and the US current account started to deteriorate again the appreciation process was finally broken and tilted abruptly in a depreciation process (figures 1 and 6) . Once again a political event could have served as a start signal, namely, the change in the US treasury: Donald Regan, certainly a man from "Wall Street3', was followed by James Baker, a man who seemed to be much more concerned with the problems of the real sector of the
31
US economy.
Since February 1985, the developments in the goods market (persistent current account deficit of the US and persistent current account surplus of Germany) and the developments in the asset market (since January 1986 the real interest rate in Germany has again been higher than in the US) have established an unambiguous expectational bias against the dollar.
This disequilibrium approach can also explain the bubble-like dollar depreciation in the early 1970's which led to the definite break-down of the Bretton Woods system in March 1973 (figures 1 and 6) . By mid 1972 the dollar was still slightly overvalued and the US current account was in a deficit. At the same time the expectation of a further dollar depreciation was held in check by the forces of the financial markets. The real interest rate in the US was by 2.2 % higher than in Germany (August 1972). German authorities, however, in order to reduce domestic inflation instituted a tight monetary policy and caused a sharp increase in the German interest rate. By December 1972 the real rate was already 0.6 % higher than that in the US and by June 1973 the differential reached 4.7 %. Thus an unambiguous expectational bias against the dollar and in favour of the deutschemark was established. This induced large capital movements and led to a strong deutschemark appreciation and high extra profits. Between November 1972 and June 1973 the changing of the currency denomination of a 3-month Eurodeposit yielded an average return of 49.0 %.
Between mid 1973 and mid 1976 a "precarious equilibrium" prevailed (figures 1 and 6). The US current account improved so that the goods market led one to expect a recovery of the dollar. This force, however, was balanced by the asset markets since the real interest rate in the US remained below the German rate by more than 5 %. In the first half of 1975 the "real" and "financial" forces changed their role in this "precarious equilibrium". The current account of the US deteriorated
32
continuously (in spite of an undervaluation of the dollar relative to PPP) while at the same time the US real interest rate increased strongly relative to the rate in Germany. However, when the US interest rate began to fall again relative to the German rate in June 1976, a change in the currency preference of asset holders was triggered off. The bubble-like dollar depreciation lasted for more than two years (figure 6). Changing the currency denomination of a 3-month Eurodeposit yielded an excess rate of return of 11.3 % per year between June 1976 and September 1978.
To summarize: exchange rate dynamics in the medium run can be viewed as a sequence of bubble-like movements, based on an upward or downward expectational bias and non-directional movements based on an ambiguity in the formation of expectations (i.e., conflicting signals emanating from the goods and asset markets and thus the prevailing of a "precarious equilibrium"). This sequence is driven by the interaction of disequilibria in the goods market and in the asset market, Thus, the exchange rate fluctuates around the purchasing power parity as its "center of gravity" without any tendency towards a stable equilibrium.
The Interaction of the Goods Market and the Asset Market
The preceding exercise in "stylizing" the facts of medium-term exchange rate movements contained a certain element of ad hoc reasoning. This seems to be a necessary shortcoming of an exploratory (inductive) approach that tries to keep in touch with the observable processes in reality while at the same time progressing towards the recognition of more general relationships (see also Harris, 1985, as an excellent example for the usefulness of such an approach) . Such an exploratory approach seems to be justified by the current crisis of standard exchange rate theory. The analysis below should be taken as just the second step in a process from the concrete to the general.
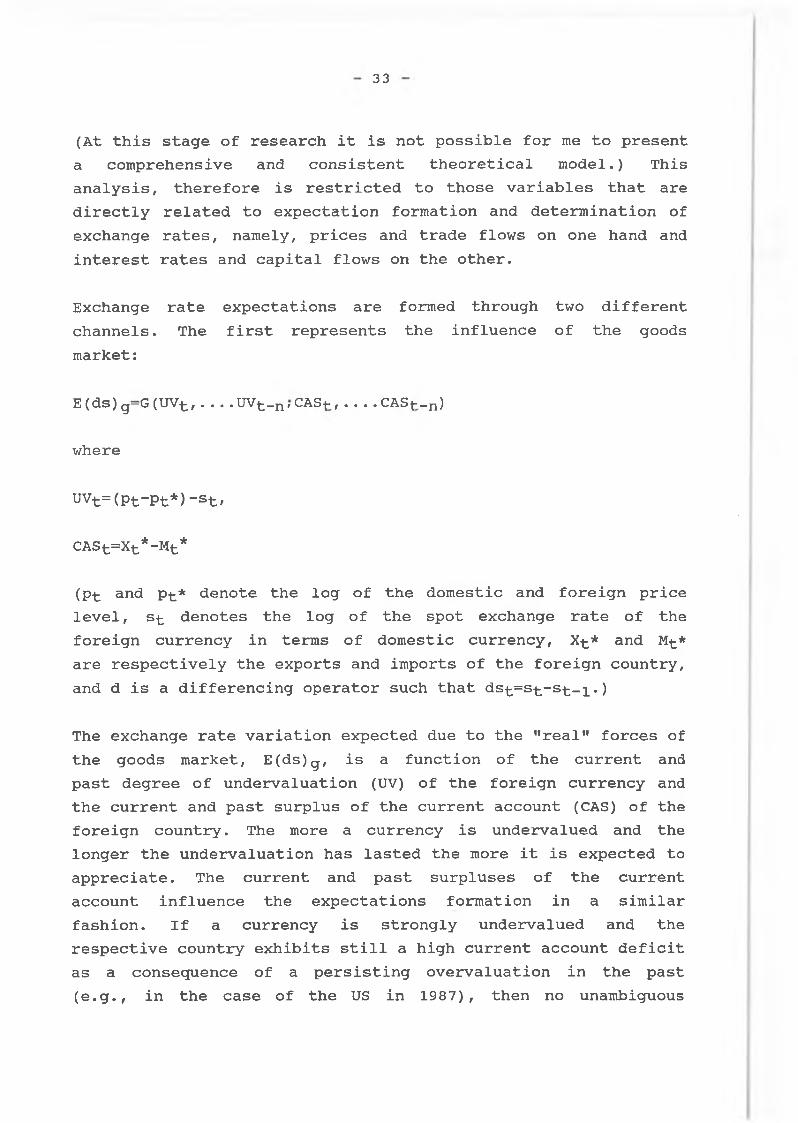
33
(At this stage of research it is not possible for me to present a comprehensive and consistent theoretical model.) This analysis, therefore is restricted to those variables that are directly related to expectation formation and determination of exchange rates, namely, prices and trade flows on one hand and interest rates and capital flows on the other.
Exchange rate expectations are formed through two different channels. The first represents the influence of the goods market:
E (ds) g—G (UV^, • • . • UV-£_n f CAS-(-, . • • • CAS-j--n)
where
UVt=(Pt-Pt*)“st,
CASt=Xt*-Mt*
(p-t and pt* denote the log of the domestic and foreign price level, s-t denotes the log of the spot exchange rate of the foreign currency in terms of domestic currency, X-t* and M-t* are respectively the exports and imports of the foreign country, and d is a differencing operator such that dst=st-st-i.)
The exchange rate variation expected due to the ’’real" forces of the goods market, E(ds)g, is a function of the current and past degree of undervaluation (UV) of the foreign currency and the current and past surplus of the current account (CAS) of the foreign country. The more a currency is undervalued and the longer the undervaluation has lasted the more it is expected to appreciate. The current and past surpluses of the current account influence the expectations formation in a similar fashion. If a currency is strongly undervalued and the respective country exhibits still a high current account deficit as a consequence of a persisting overvaluation in the past (e.g., in the case of the US in 1987), then no unambiguous
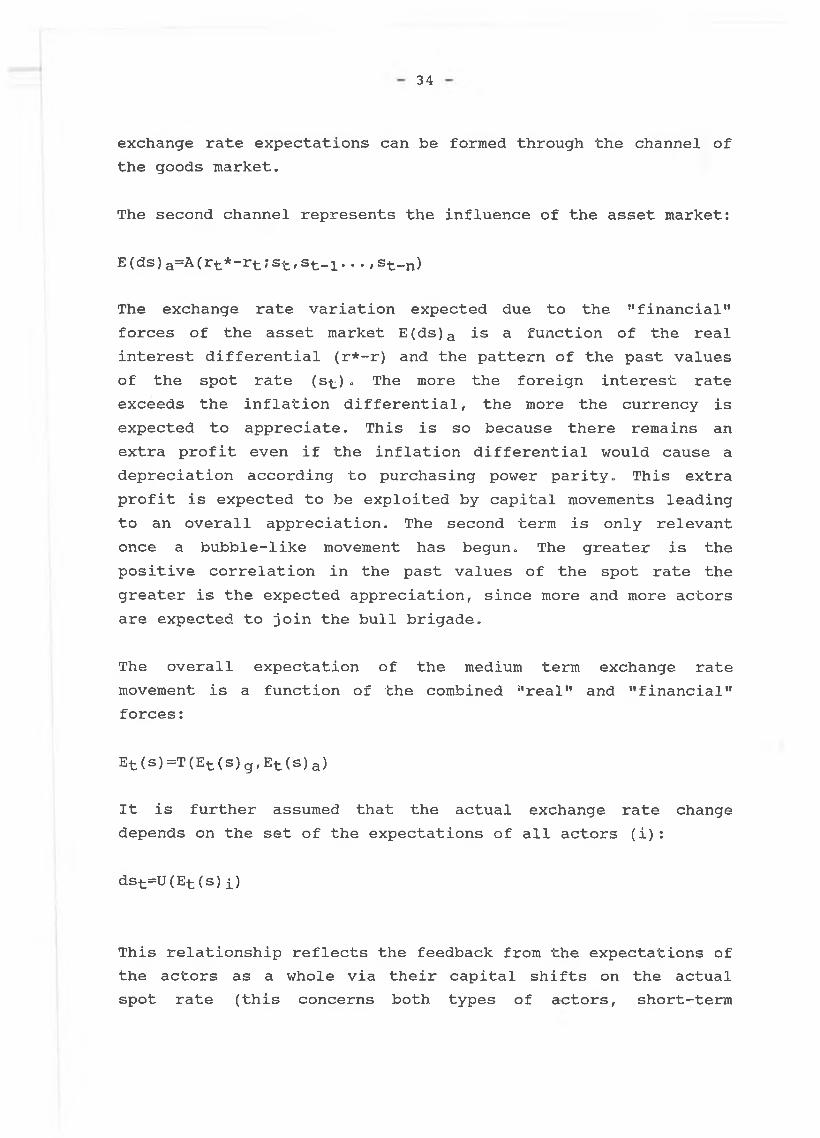
34
exchange rate expectations can be formed through the channel of the goods market.
The second channel represents the influence of the asset market:
E(ds)a=A(rt*-rt;st,st_1...,st„n)
The exchange rate variation expected due to the ’'financial" forces of the asset market E(ds)a is a function of the real interest differential (r*-r) and the pattern of the past values of the spot rate (s ) - The more the foreign interest rate exceeds the inflation differential, the more the currency is expected to appreciate. This is so because there remains an extra profit even if the inflation differential would cause a depreciation according to purchasing power parity» This extra profit is expected to be exploited by capital movements leading to an overall appreciation. The second term is only relevant once a bubble-like movement has begun. The greater is the positive correlation in the past values of the spot rate the greater is the expected appreciation, since more and more actors are expected to join the bull brigade.
The overall expectation of the medium term exchange rate movement is a function of the combined "real" and "financial" forces:
Et (s) =IE (®t (s)g,Et(s)a)
It is further assumed that the actual exchange rate change depends on the set of the expectations of all actors (i):
dst=U(Et (s)i)
This relationship reflects the feedback from the expectations of the actors as a whole via their capital shifts on the actual spot rate (this concerns both types of actors, short-term
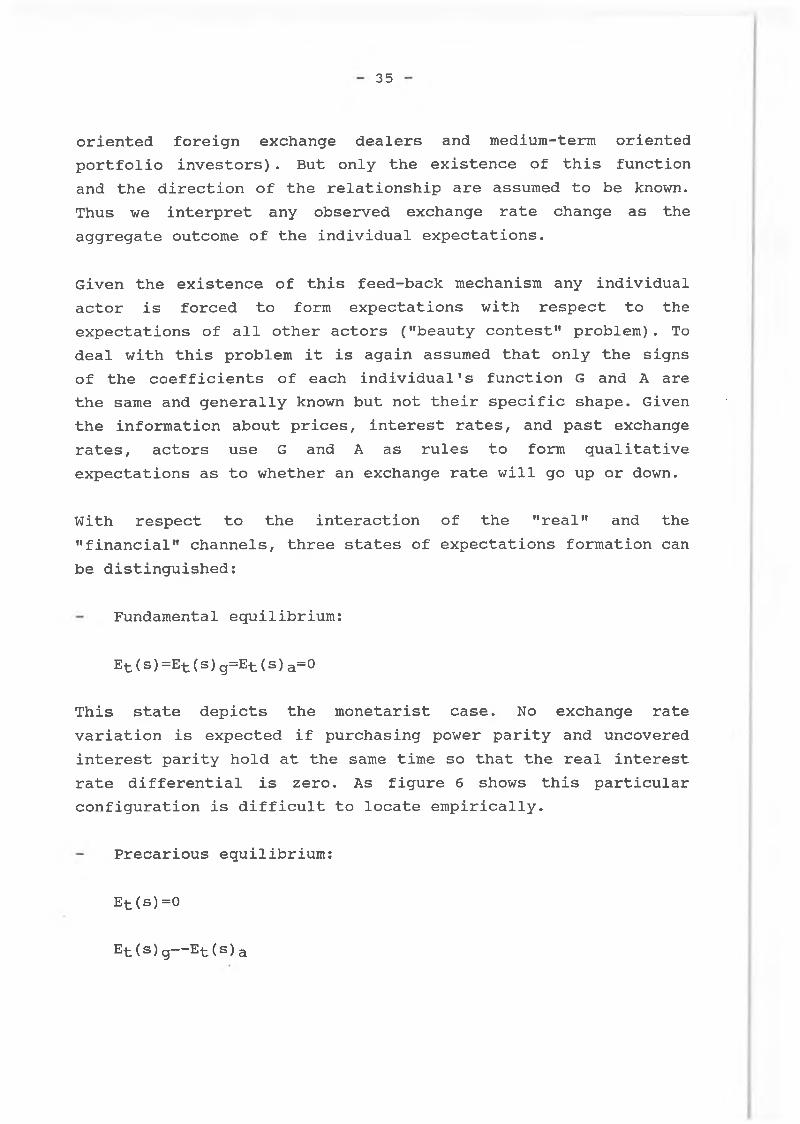
35
oriented foreign exchange dealers and medium-term oriented portfolio investors). But only the existence of this function and the direction of the relationship are assumed to be known. Thus we interpret any observed exchange rate change as the aggregate outcome of the individual expectations.
Given the existence of this feed-back mechanism any individual actor is forced to form expectations with respect to the expectations of all other actors ("beauty contest" problem). To deal with this problem it is again assumed that only the signs of the coefficients of each individual's function G and A are the same and generally known but not their specific shape. Given the information about prices, interest rates, and past exchange rates, actors use G and A as rules to form qualitative expectations as to whether an exchange rate will go up or down.
With respect to the interaction of the "real" and the "financial" channels, three states of expectations formation can be distinguished:
Fundamental equilibrium:
Et(s)=Et(s)g=Et(s)a=0
This state depicts the monetarist case. No exchange rate variation is expected if purchasing power parity and uncovered interest parity hold at the same time so that the real interest rate differential is zero. As figure 6 shows this particular configuration is difficult to locate empirically.
Precarious equilibrium:
Et (s)=O
Et (s) g— Et (s) a
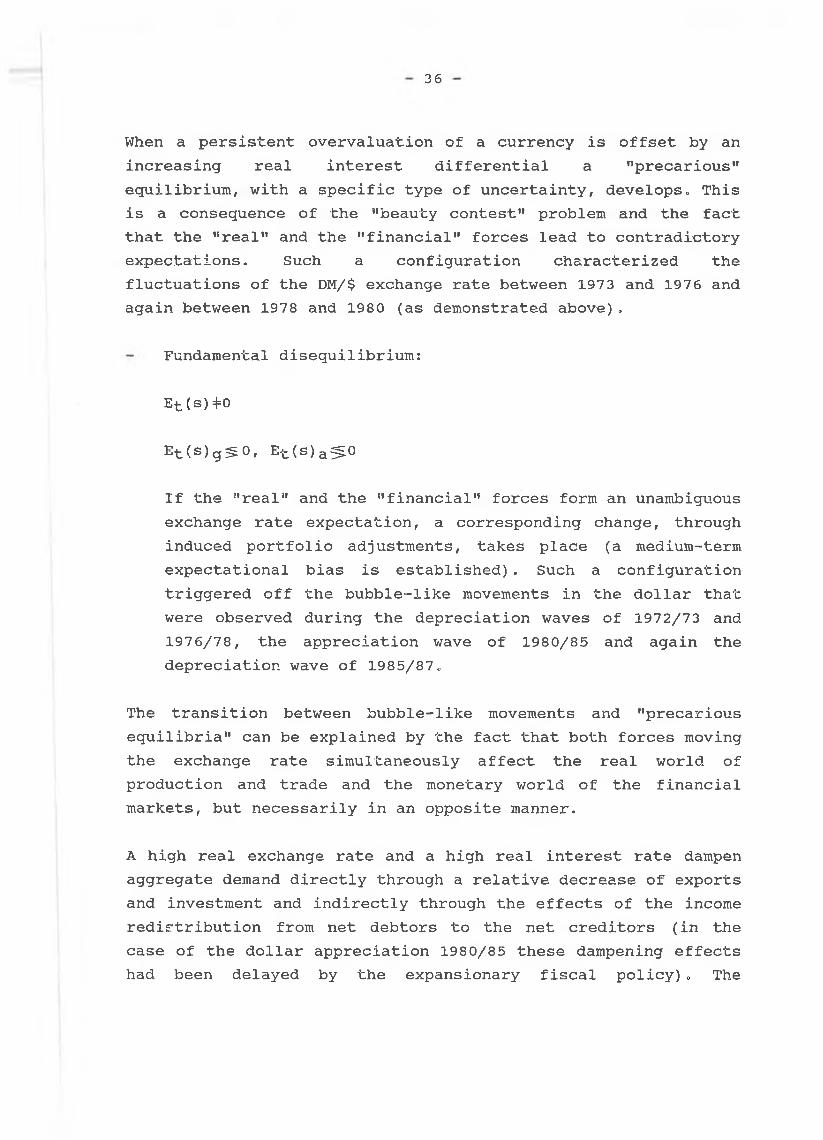
36
When a persistent overvaluation of a currency is offset by an increasing real interest differential a "precarious" equilibrium, with a specific type of uncertainty, develops« This is a consequence of the "beauty contest" problem and the fact that the "real" and the "financial" forces lead to contradictory expectations. Such a configuration characterized the fluctuations of the DM/$ exchange rate between 1973 and 1976 and again between 1978 and 1980 (as demonstrated above).
Fundamental disequilibrium:
Et (s)+0
Et(s)g3^0, E^(s)a^ 0
If the "real" and the "financial" forces form an unambiguous exchange rate expectation, a corresponding change, through induced portfolio adjustments, takes place (a medium-term expectational bias is established). Such a configuration triggered off the bubble-like movements in the dollar that were observed during the depreciation waves of 1972/73 and 1976/78, the appreciation wave of 1980/85 and again the depreciation wave of 1985/87«
The transition between bubble-like movements and "precarious equilibria" can be explained by the fact that both forces moving the exchange rate simultaneously affect the real world of production and trade and the monetary world of the financial markets, but necessarily in an opposite manner.
A high real exchange rate and a high real interest rate dampen aggregate demand directly through a relative decrease of exports and investment and indirectly through the effects of the income redistribution from net debtors to the net creditors (in the case of the dollar appreciation 1980/85 these dampening effects had been delayed by the expansionary fiscal policy) «, The
37
decrease in both demand and output together with the specific effect of an overvalued currency on import prices reduces inflation significantly. This dis-inflationary effect renders the policy of a strong appreciation through a tight money popular, particularly if this strategy is combined with an expansionary fiscal policy which delays the depressing income effects (Dornbusch, 1987).
The longer an overvaluation lasts, the stronger become the disequilibria in the international goods and asset markets. The decline in the price competitiveness leads to a widening of the current account deficit whose financing requires relatively high real interest rates in order to attract foreign capital. Due to the increasing external indebtedness and the corresponding future debt service payments, a return of the exchange rate to the purchasing power parity is not sufficient to ensure a balanced current account in the medium run. In other words: any persistent overvaluation sets the stage for a subsequent period of undervaluation (Dornbusch, 1987).
International competitiveness is also affected by the changes in the industrial structure which take place in a period of sustained overvaluation (Biasco, 1987; Dornbusch, 1987, discuss this matter in more detail). This downward pressure on both the exchange rate and the interest rate is strengthened by the developments within the domestic economy like the growth of unemployment, particularly in the export industries. Consequently, also economic policy calls for lower interest rates and exchange rates (Biasco, 1987, stresses the endogenous character of changes in the exchange rate and interest rate policy; Dornbusch, 1987, discusses this aspect within the context of the political business cycle). To conclude: any sustained appreciation process necessarily comes to an end through the unbalancing effects on the international goods and asset markets and the depressing effects on the domestic economy.
38
This sequence of overappreciation and overdepreciation reflects one fundamental perception: the exchange rate is both an asset price as well as a flow price. Its property as an asset price makes the bubble-like overshooting process possible and its property as a flow price causes the bubble-like overshooting process to break. In other words, any persistent exchange rate deviation from purchasing power parity generates the conditions of a counter-deviation. The wide fluctuations of exchange rates around the purchasing power parity as their "center of gravity" (see figure 1) are explained by the interaction of changing disequilibria in the goods market and in the asset market.30)
Comparison of the Exchange Rate Dynamics in the Short Runand in the Medium Run
The exchange rate fluctuations in the short run as well as in the medium run are characterized by a sequence of trends and non-directional movements (in one case they last some days or weeks, in the other case some years). This pattern is related to two kinds of speculative behaviour, similar in essence but different in their time horizon. Both foreign exchange dealers as well as those portfolio investors who explicitly conceive exchange rate changes as a (conditional) source of speculative profits or losses31) try to separate trends from non- directional movements ("whipsaws" in the short run, "precarious equilibria" in the medium run).32)
Both types of speculators form only qualitative (i.e., directional) expectations; foreign exchange dealers base their short-term expectations mainly on the "technical and psychological conditions" of the foreign exchange market itself, medium-term portfolio investors on the "fundamental forces" of the goods market and the asset market. Whereas the expectations about short-term exchange rate runs do not influence considerably upon the decisions of portfolio managers, the medium-term expectational bias does influence upon the decisions
39
of the foreign exchange dealers. If a current run is in line with the expectational bias then the foreign exchange dealers hold an open position a little longer than in the opposite case. This behaviour brings about the medium-term exchange rate trend in a stepwise process.33)
VII. The Theoretical Foundations of Exchange Rate Instability
Rational Expectations Formation and Rational Theory Formation
If one assumes that agents can learn the "true process" governing economic dynamics and that they form their expectations accordingly, then any systematic pattern of economic variables must be the outcome of what agents believe to be the "relevant economic model". This model, however, need not be identical or even similar to that which economists believe the agents (should) believe. In other words, a distinction must be made between the two assumptions of the rational expectations hypothesis, namely, the learning process and the content of what is learned, i.e., the "relevant model". Since the ultimate criterion for the "relevance" of a model is its actual application (this follows from the rationality assumption) any rational theory formation trying to formulate the "relevant economic model" has to reconsider the existing theories radically - in the literal sense of the word - once they are persistently and systematically contradicted by the empirical evidence. In other words, rational expectations hypothesis would dictate in this case that these existing theories be partially or wholly disregarded. This, however, is usually avoided in order to preserve the old, painfully developed imagination of reality ("Weltanschauung" or "paradigm" in the sense of Kuhn, 1962) and particularly its logical consistency. The theoretical construct of uncovered interest parity provides a case in point. Tests have overwhelmingly rejected the empirical validity of this assumption at least since the late 1970's. However, the
- 40
prevailing exchange rate models have not been re-constructed nor have new models been con-structed. The reason for this "stickiness” might be that uncovered interest parity is a keystone in all prevailing exchange rate models, which imbeds this assumption into the framework of general equilibrium economics. Equilibrium economics, in turn, was reestablished in a long lasting and exhausting process after the '’disturbance" of Keynesian economics that culminated in the "new classical macroeconomics" (a perfect example of what Fleck, 1979, calls "the tenacity of systems of opinion and the harmony of illusions" in the process of scientific development). Thus the relationship between interest rates and exchange rates was not radically reconsidered but rather just adapted to immediate empirical inconsistencies (i.e., by the role of the "news" and/or the risk premium). Such "adaptive theory formation" is typical for the state of crisis in the development of any science laying the grounds for a scientific revolution (see Kuhn, 1962, ch. 7).34) In the case of economics, Johnson (1971, p.3) has precisely described such a situation: "The most helpful circumstances for a rapid propagation of a new and revolutionary theory is the existence of an established orthodoxy which is clearly inconsistent with the most salient facts of reality, and yet is sufficiently confident of its intellectual power to attempt to explain those facts, and in its efforts to do so exposes its incompetence in a ludicrous fashion." (There is a double irony in this quotation, first, because it is taken from H. G. Johnson's "The Keynesian Revolution and the Monetarist Counterrevolution" and second, because J. Frenkel, 1976, refers to it in his "A Monetary Approach to the Exchange Rate: Doctrinal Aspects and Empirical Evidence").
A good example of the importance of distinguishing between the process of forming rational expectations and the "relevant model" is the use of technical analysis. Exchange rate expectations based on technical models are rational insofar as they represent the result of learning the "true model" (the
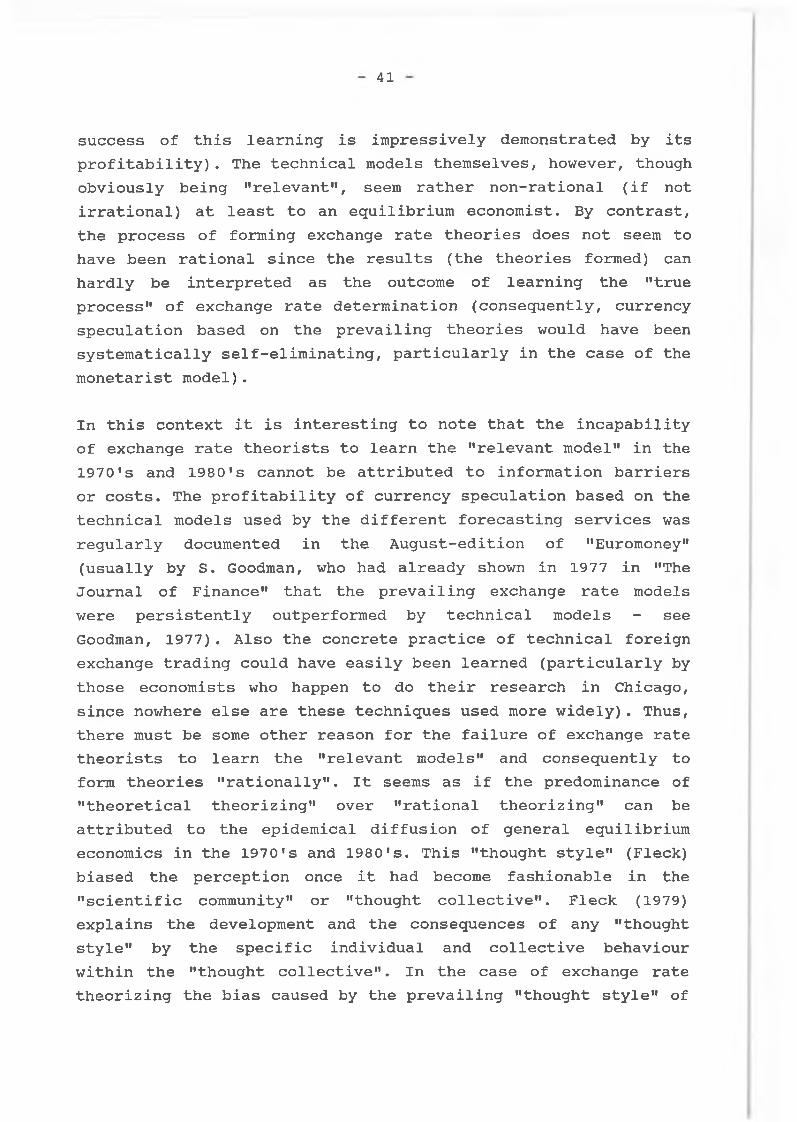
41
success of this learning is impressively demonstrated by its profitability). The technical models themselves, however, though obviously being "relevant", seem rather non-rational (if not irrational) at least to an equilibrium economist. By contrast, the process of forming exchange rate theories does not seem to have been rational since the results (the theories formed) can hardly be interpreted as the outcome of learning the "true process" of exchange rate determination (consequently, currency speculation based on the prevailing theories would have been systematically self-eliminating, particularly in the case of the monetarist model).
In this context it is interesting to note that the incapability of exchange rate theorists to learn the "relevant model" in the 1970’s and 1980’s cannot be attributed to information barriers or costs. The profitability of currency speculation based on the technical models used by the different forecasting services was regularly documented in the August-edition of "Euromoney" (usually by S. Goodman, who had already shown in 1977 in "The Journal of Finance" that the prevailing exchange rate models were persistently outperformed by technical models - see Goodman, 1977). Also the concrete practice of technical foreign exchange trading could have easily been learned (particularly by those economists who happen to do their research in Chicago, since nowhere else are these techniques used more widely). Thus, there must be some other reason for the failure of exchange rate theorists to learn the "relevant models" and consequently to form theories "rationally". It seems as if the predominance of "theoretical theorizing" over "rational theorizing" can be attributed to the epidemical diffusion of general equilibrium economics in the 1970's and 1980's. This "thought style" (Fleck) biased the perception once it had become fashionable in the "scientific community" or "thought collective". Fleck (1979) explains the development and the consequences of any "thought style" by the specific individual and collective behaviour within the "thought collective". In the case of exchange rate theorizing the bias caused by the prevailing "thought style" of
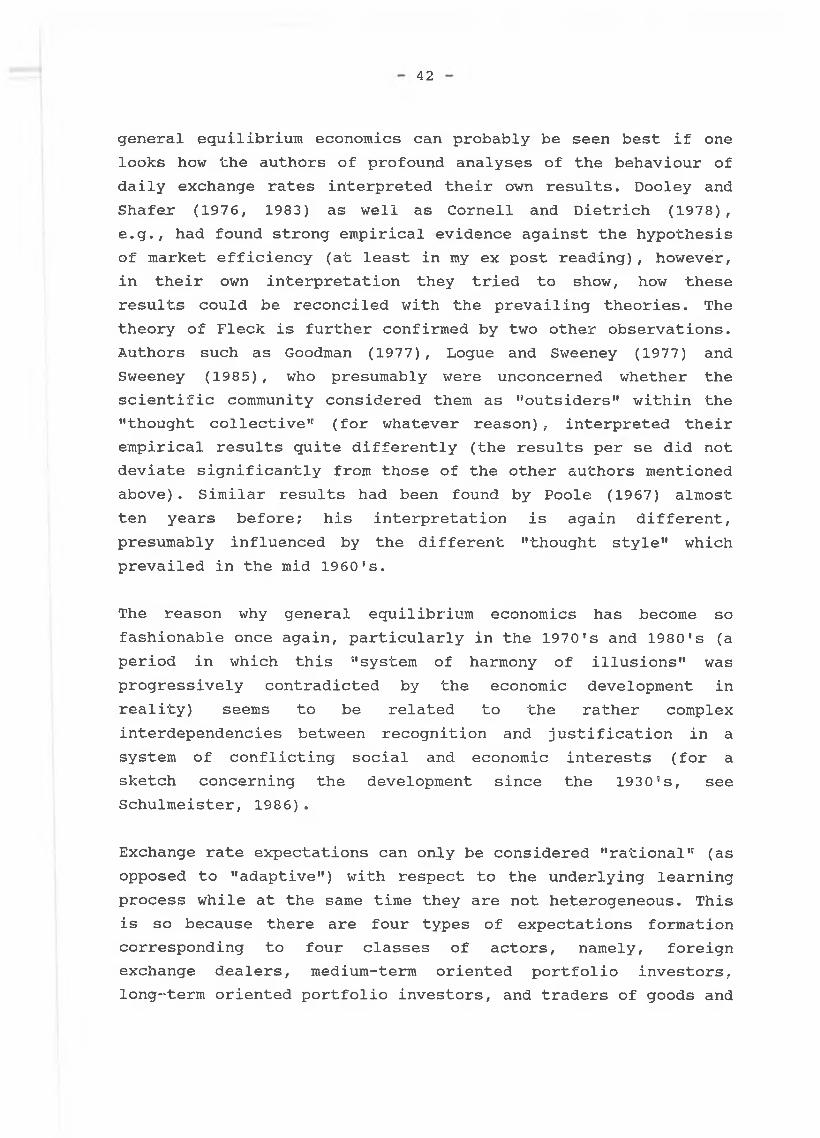
42
general equilibrium economics can probably be seen best if one looks how the authors of profound analyses of the behaviour of daily exchange rates interpreted their own results. Dooley and Shafer (1976, 1983) as well as Cornell and Dietrich (1978), e.g., had found strong empirical evidence against the hypothesis of market efficiency (at least in my ex post reading), however, in their own interpretation they tried to show, how these results could be reconciled with the prevailing theories. The theory of Fleck is further confirmed by two other observations. Authors such as Goodman (1977) , Logue and Sweeney (1977) and Sweeney (1985), who presumably were unconcerned whether the scientific community considered them as "outsiders" within the "thought collective" (for whatever reason), interpreted their empirical results quite differently (the results per se did not deviate significantly from those of the other authors mentioned above). Similar results had been found by Poole (1967) almost ten years before; his interpretation is again different, presumably influenced by the different "thought style" which prevailed in the mid 1960's.
The reason why general equilibrium economics has become so fashionable once again, particularly in the 1970's and 1980's (a period in which this "system of harmony of illusions" was progressively contradicted by the economic development in reality) seems to be related to the rather complex interdependencies between recognition and justification in a system of conflicting social and economic interests (for a sketch concerning the development since the 1930's, see Schulmeister, 1986).
Exchange rate expectations can only be considered "rational" (as opposed to "adaptive") with respect to the underlying learning process while at the same time they are not heterogeneous. This is so because there are four types of expectations formation corresponding to four classes of actors, namely, foreign exchange dealers, medium-term oriented portfolio investors, long-term oriented portfolio investors, and traders of goods and
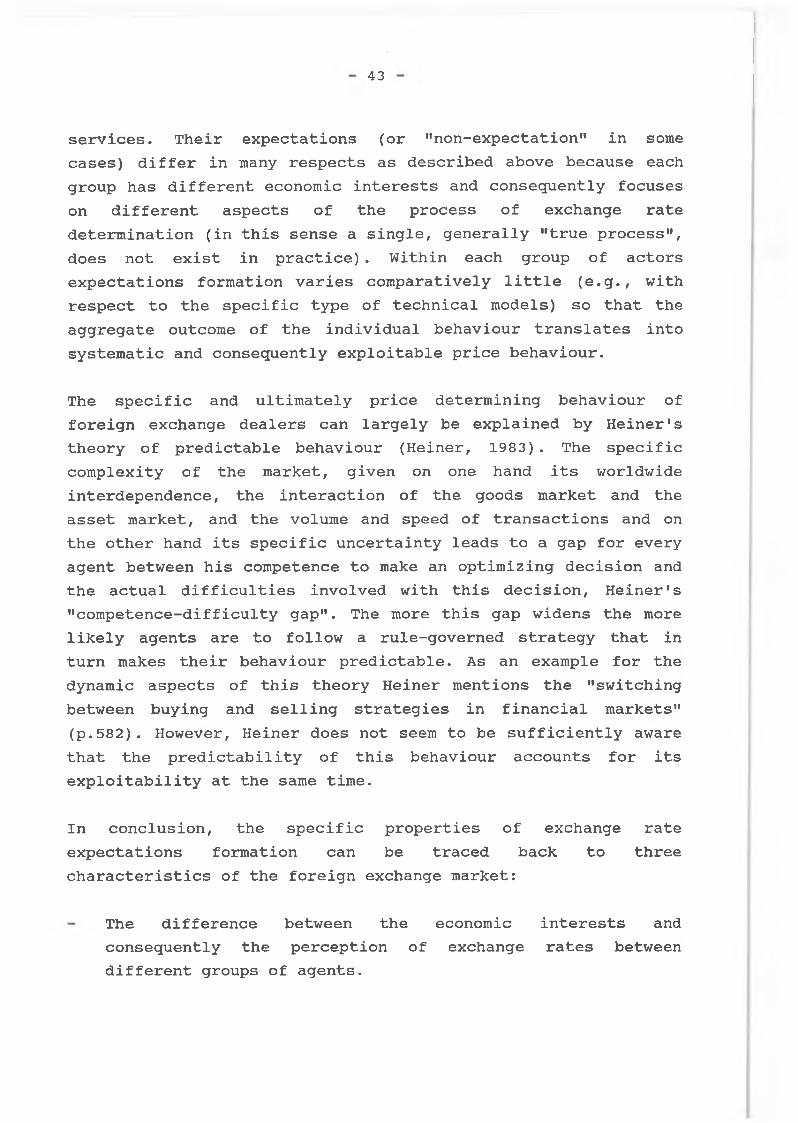
43
services. Their expectations (or "non-expectation" in some cases) differ in many respects as described above because each group has different economic interests and consequently focuses on different aspects of the process of exchange rate determination (in this sense a single, generally "true process", does not exist in practice). Within each group of actors expectations formation varies comparatively little (e.g., with respect to the specific type of technical models) so that the aggregate outcome of the individual behaviour translates into systematic and consequently exploitable price behaviour.
The specific and ultimately price determining behaviour of foreign exchange dealers can largely be explained by Heiner*s theory of predictable behaviour (Heiner, 1983) . The specific complexity of the market, given on one hand its worldwide interdependence, the interaction of the goods market and the asset market, and the volume and speed of transactions and on the other hand its specific uncertainty leads to a gap for every agent between his competence to make an optimizing decision and the actual difficulties involved with this decision, Heiner*s "competence-difficulty gap". The more this gap widens the more likely agents are to follow a rule-governed strategy that in turn makes their behaviour predictable. As an example for the dynamic aspects of this theory Heiner mentions the "switching between buying and selling strategies in financial markets" (p.582). However, Heiner does not seem to be sufficiently aware that the predictability of this behaviour accounts for its exploitability at the same time.
In conclusion, the specific properties of exchange rate expectations formation can be traced back to three characteristics of the foreign exchange market:
The difference between the economic interests and consequently the perception of exchange rates between different groups of agents.
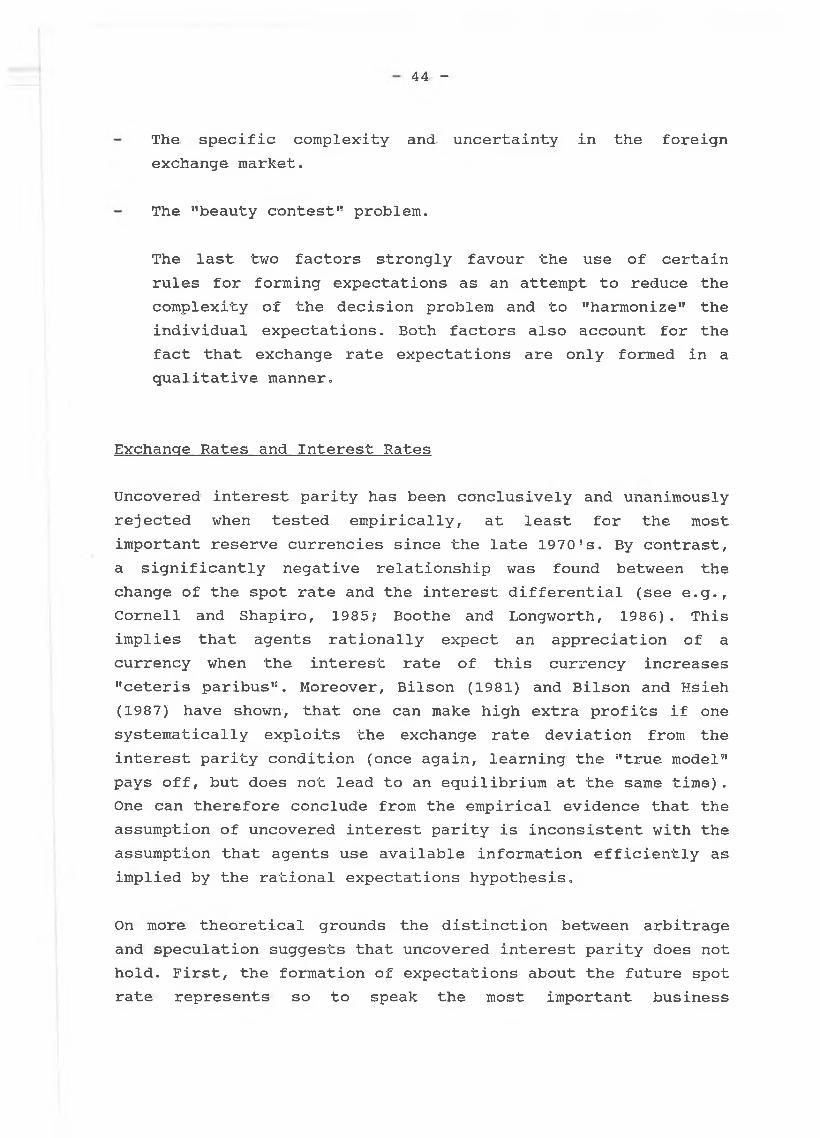
44 -
The specific complexity and uncertainty in the foreign exchange market.
The "beauty contest" problem.
The last two factors strongly favour the use of certain rules for forming expectations as an attempt to reduce the complexity of the decision problem and to "harmonize" the individual expectations. Both factors also account for the fact that exchange rate expectations are only formed in a qualitative manner.
Exchange Rates and Interest Rates
Uncovered interest parity has been conclusively and unanimously rejected when tested empirically, at least for the most important reserve currencies since the late 1970's. By contrast, a significantly negative relationship was found between the change of the spot rate and the interest differential (see e.g., Cornell and Shapiro, 1985; Boothe and Longworth, 1986). This implies that agents rationally expect an appreciation of a currency when the interest rate of this currency increases "ceteris paribus". Moreover, Bilson (1981) and Bilson and Hsieh (1987) have shown, that one can make high extra profits if one systematically exploits the exchange rate deviation from the interest parity condition (once again, learning the "true model" pays off, but does not lead to an equilibrium at the same time). One can therefore conclude from the empirical evidence that the assumption of uncovered interest parity is inconsistent with the assumption that agents use available information efficiently as implied by the rational expectations hypothesis.
On more theoretical grounds the distinction between arbitrage and speculation suggests that uncovered interest parity does not hold. First, the formation of expectations about the future spot rate represents so to speak the most important business
45
speculators engage in whereas arbitragers are completely unconcerned with this problem. Second, speculators can expect profits only if they predict a future spot rate which is different from the forward rate (determined by the interest differential). Third, most currency substitutions are carried out by speculators who expect some profit. One can therefore conclude that as long as capital movements exist all expected exchange rate changes necessarily differ from the forward rate.
This implies that the individual actors do not assume that yields will be equalized across currencies. Instead they will try to take profits from the expected differences. But this could still lead to an equilibrium outcome through the market process (the "invisible hand"). However, there is no channel through which an international equalization of yields can be brought about in real time. Suppose actors form their exchange rate expectations at first according to a random walk model and that the foreign interest rate rises relative to the domestic rate. Profit maximizing behaviour will consequently increase the demand for foreign assets relative to domestic ones. Since the supply of assets is fixed in the short run (there is no net flow of capital) the entire burden of adjustment has to fall upon the price, so that the foreign currency appreciates. Since actors have learned this relationship they will cease to form their expectations according to a random walk model in the case of a time-varying interest differential but will expect an appreciation of that currency which offers an increased interest rate. (At the same time the shift in the currency preference of asset holders does not imply necessarily that the foreign interest rate will decrease relative to the domestic for there is no change in the relative quantities of the asset supplied.) The only possibility to exclude this sequence from happening in a theoretical model is to assume that the change in the exchange rate, necessary to ensure uncovered interest parity, is brought about "at time zero" merely through the common knowledge of the unique theoretical stock equilibrium value and thus without any transactions. This assumption is typical for the overshooting models.
46
The disequilibrium approach differs from the traditional concepts in three respects. First, the exchange rate movement due to a change in the interest rate differential is brought about in real time and has therefore to be considered a process rather than an instantaneous "jump". Second, this (overshooting) process is (rationally) expected once a change in the interest rate differential takes place. Thus uncovered interest rate parity does not hold at any point in - real. - time. Third, this (overshooting) process does not necessarily come to a halt at a level sufficient to ensure an appreciation (depreciation) of the exchange rate towards its long run equilibrium value at a rate just sufficient to offset the interest rate differential. There are two reasons for this third proposition. First, given that uncovered interest rate parity does not hold at any point in time, how can agents know when this stock equilibrium condition will hold and when it will not hold (this difficulty is avoided through the concept of "time zero" in traditional theorizing). Second, empirical research has overwhelmingly rejected the validity of uncovered interest parity.
In conclusion, if the interest rate of one currency increases relative to another then the former appreciates "ceteris paribus’8. This appreciation will be brought about by the capital flows induced by the expectation of differencies in the yields of assets denominated in different currencies. Exchange rate dynamics due to the "financial" forces is therefore determined by the exchange rate effects of capital flows and not by an asset market equilibrium condition. This restoration of the Keynesian perception seems to be consistent with both the empirical evidence as well as its theoretical generalization.
The Issue of Destabilizing Currency Speculation and of MarketEfficiency
Over the entire post-war period of floating exchange rates currency speculation has proven to be significantly,
47
persisently, and systematically profitable at least for the most traded currencies.35) At the same time this currency speculation has to be considered destabilizing since the sequence of price runs caused great and persistent deviations of the exchange rates from their equilibrium values according to the goods market (purchasing power parity).
This result supports the essential meaning of rational expectations formation, namely, that agents use available information most efficiently by learning the "true model”. However, this "true model" is not of the general equilibrium type.
Since the ultimate criterion for the "relevance" of a model is its actual usefulness in reality, "rational theory formation" has to incorporate the specific pattern of currency speculation in a more general framework. The disequilibrium approach as sketched in this essay can be considered as a first step in this direction, insofar as the short-term behaviour is related to the medium-term dynamics which in turn is explained by the interaction of changing disequilibria in the goods market and in the asset market.
Market efficiency in its weak form implies that past prices do not contain any information which can be profitably exploited (Fama, 1970) . Since the profitability of currency speculation based on technical analysis stems exclusively from the exploitation of past exchange rate values, one has to conclude that foreign exchange markets are definitely not efficient, at least for the most traded currencies.
Goods Market, Asset Market, and the Fundamental Indeterminacy ofExchange Rates36)
The fundamental reason for the widening disequilibria in both the goods and asset markets during the current system of
48
floating exchange rates stems from the fact that one price cannot clear two markets (in this context it suffices to define disequilibrium in the goods market as deviation of the exchange rate from purchasing power parity and the corresponding current account imbalances and disequilibrium in the asset market as differences in the expected and realized yields of international assets and the related capital account imbalances). There remains one degree of freedom in the system since only the overall market for foreign exchange is actually cleared by the observed exchange rate at any point in time.37) The validity of this proposition depends on two assumptions: first, the expectations formation and consequently the economic behaviour differ between traders of goods and services on one hand and traders of financial assets on the other; second, the interest rate differential influences exchange rate expectations in the direction opposite to that implied by the uncovered interest parity condition (the actual relevance of either assumption has already been demonstrated). Under these assumptions the fundamental equilibrium where the overall market as well as both "sub-markets'' are cleared by the exchange rate is purely accidental. This situation can therefore hardly be found empirically. For the same reason the precarious equilibrium represents the typical configuration in the international goods markets and asset markets. In this case only the overall market clears so that any disequilibrium in the goods market is offset by a corresponding disequilibrium in the asset market.38) The sequence of instantaneous equilibrium values in the overall market for foreign exchange is then operated by the interaction of the disequilibrium in the goods market and in the asset market in time, i.e., the specific way in which both disequilibria affect the medium-term expectational bias of market participants.
How do the prevailing theories deal with this problem? The monetarist model assumes the problem away by holding that both
49
uncovered interest parity as well as purchasing power parity hold at any point in time (the relevant exchange rate adjustments after a shock take place at "time zero"). The overshooting model also assumes that the goods market and the asset market are cleared by the exchange rate in the long run. In the short run only the asset market is cleared whereas the goods market is not since the exchange rate overshoots the purchasing power parity level. However, it is not explicitly shown how this short run disequilibrium in the goods market affects upon the current account, the net foreign asset position, future interest payments and consequently that exchange rate which balances the current account in the medium or long run. The third type of exchange rate theory, the portfolio balance models assume that current account imbalances are self-eliminating because any surplus saving) raises wealth which in turn increases demand and thus reduces saving.
In the theoretical discussions of the 1950's and 1960's the notion that the exchange rate clears only the overall market was taken as fact. The debate more accurately centered on the problem of how the disequilibria in the goods market and in the asset market might bring about internal and external balance in the face of different economic conditions and/or political preferences (for a survey see Kenen, 1985; Krueger, 1969). This particular form of the debate was adhered to by both, Keynesians as well as monetarists. The main controversy only focused on the question whether the counter-balancing disequilibria should be attained through a completely autonomous economic poliy under flexible exchange rates (this was the position held by such economists as M. Friedman, H.G. Johnson, and E. Sohmen) or by a combination of fiscal and monetary policies that simultaneously ensure a fixed exchange rate (this was the position of R.A. Mundell and J.M. Fleming). This form of analysis was recently re-introduced into the economic debate since it seemed to be more appropriate for an understanding of the dollar development in the 1980's than the prevailing models (Sachs, 1985).
50
In hindsight,, it does not seem accidental that those Keynesians, such as P.Einzig, who also had a profound knowledge of the concrete functioning of the foreign exchange market, had correctly forecasted that instability would strongly increase under a system of floating rates precisely because of the fundamental indeterminacy of exchange rates. In his polemic "A Case Against Floating Exchange Rates” (1970B) he argued: "There can be only two conceivable situations in which a freely floating exchange rate gravitates without hindrance towards its trade equilibrium level and tends to remain around that level: (1) If the equilibrium levels for capital movements, speculation and arbitrage happen to be identical with the equilibrium level for trade. (2) If tendencies making for the deviation of the exchange rate from its trade equilibrium level . . . cancel each other out ..." (Einzig, 1970B, p.55). He argued further that: "Speculative influences, by causing exchanges to deviate considerably from their trade equilibrium level, would play a much more disturbing role . . . Under floating rates, . „ „ even influences and events of relatively small importance, which under fixed parities would not give rise to expectations of changes in parities, would be sufficient to trigger off strong speculative trends in exchange rates in anticipation of their unrestrained effect on the floating exchange rate." (Einzig, 1970B, p.82f).
Since Einzig was not taken seriously any more at that time by the "scientific community" (due in part to his polemic style) I would like to quote a passage from the last page of his "History of Foreign Exchange5' (1970A) : "I am firmly convinced that, should Bretton Woods stability be abandoned or greatly relaxed, the resulting developments would only constitute a temporary phase in the history of Foreign Exchange. It would not take very long for most Governments to realise the grave disadvantages of the currency chaos resulting from their ill-advised decisions to de-stabilize their exchanges. Sooner or later they would gladly return to the system of stability, as their forerunners did each
51
time they were forced to abandon it in the past." (Einzig, 1970A, p.348). Kindleberger (1969B) argued along similar lines, though less polemically.
VIII. Conclusions
The main findings of this essay can be summarized as follows:
The exchange rate movements between the most traded currencies, the US dollar and the deutschemark, are characterized by a sequence of upward and downward trends, interrupted by non-directional movements. This pattern is typical for the exchange rate dynamics in the short run as well as in the medium run.
This pattern can be and actually has been persistently and systematically exploited through currency speculation, particularly with the use of "technical analysis".
This currency speculation has in turn reinforced the specific pattern of exchange rate dynamics.
The winners in the short run currency game are the professional traders of financial assets whereas the losers are mainly the traders of goods and services. The persistence of this game is based on the fact that the exchange rate is both an asset price as well as a flow price, whereby the traders of financial assets perceive mainly the asset (stock) aspect and the traders of goods and services perceive mainly the flow aspect.
The most detrimental effect of currency speculation is not the redistribution of income from the "real" sector to the "financial" sector but rather the destabilization of exchange rates and consequently of international economic relations.
52
Foreign exchange markets are not weakly efficient since the profitability of currency speculation based on technical analysis stems exclusively from the exploitation of past exchange rate values.
The exchange rate dynamics in the medium run can be explained by the interaction of changing disequilibria in the goods market and in the asset market, whereby these disequilibria are in part caused by the preceding deviations of the exchange rates from their fundamental equilibrium values due to the goods market, i.e., purchasing power parity.
This dynamic of exchange rates driven by changing disequilibria also explains why prevailing models performed poorly when tested empirically. The finding of Somanath (1986) that the econometric results could be improved significantly when the lagged exchange rate was incorporated is explained by the predominance of bubble-like movements.
The assumption of uncovered interest parity represents the fundamental error in the exchange rate theories of the 1970’s and 1980’s since there is no channel through which this equilibrium condition could be brought about in real time. Given this impossibility, it is not surprising that uncovered interest parity has been persistently rejected when tested empirically.
The process of forming exchange rate expectations based on technical models is rational insofar as these expectations represent the result of learning the ’’true model'8, which, however, is not of the general equilibrium type. In contrast, the process of exchange rate theory formation cannot be considered rational since the results (the theories themselves) can hardly be interpreted as the outcome of learning the "true model" of exchange rate
53
determination (the process of exchange rate theory formation in the 1970’s and 1980's has rather been an adaptive one).
The ultimate reason for exchange rate instability stems from the fundamental problem of indeterminacy. One price cannot clear two markets. Only the overall market for foreign exchange is cleared by the exchange rate at any point in time. The one degree of freedom in the system allows room for the persistence of two interacting disequilibria in the "sub-markets", namely, the goods market and the asset market.
As a "by-product" this essay provides a concrete economic explanation for two statistical phenomena:
- The leptokurtotic distribution of the daily changes of speculative prices such as exchange rates.
- The existence of non-periodic cycles in the sequence of daily speculative prices (their so-called persistent dependency).
54
Statistical Appendix
The daily DM/$ exchange rate used was the cross rate at the Viennese foreign exchange (mid rate).
The data for the purchasing power parity calculation were taken from the Statistisches Bundesamt Wiesbaden (Central Statistical Office of the FRG), Fachserie 17, Verbrauchergeldparität. The level of purchasing power parity was calculated as the mean between the purchasing power parity according to the German and the US basket of consumer goods and services.
All other data were taken from two tapes:
International Financial Statistics (IMF)Main Economic Indicators (OECD)
55
Footnotes
1) The monthly data use the exchange rate on the last business day of each month since averaging can cause a positive serial correlation even if the daily data follow a random walk (Working, 1960).
2) These findings also cast doubt on the random walk hypothesis for the real exchange rate which could not be rejected for the period up to May, 1981 (Adler and Lehmann, 1983) . Since then purchasing power parity has changed little so that nominal changes in exchange rates are also approximately real changes (see figure 1) . Hence, if the random walk hypothesis had to be conclusively rejected for the nominal exchange rate, then it must also be rejected for the real rate as well.
3) The daily exchange rate series was not adjusted for the interest rate differential due to a lack of data. However, given that markeet efficiency was strongly rejected using both adjusted and unadjusted monthly data as well as the even stronger rejection of the efficiency hypothesis using unadjusted daily data it can be inferred that adjusted daily data would provide a similar result. Note also that the adjustment for interest rates does not substantially alter the test statistics in the case of monthly data.
In addition the regression using daily data over the whole period could not be calculated for lack of computer capacity (more than 3,000 observations).
4) Giddy (1979) estimated the daily worldwide volume of foreign exchange trading to 133.1 billion $ for 1979 (this was 20 % below the estimation of the Fed New York and therefore rather conservative). From three surveys that the Fed New York conducted in March 1980, April 1983, and March 1986 (Andrews,
56
1984; Fed New York, 1986) one can calculate a yearly growth of the US market of 17.3 % between 1980 and 1986. If one assumes a slightly slower growth for the world market (15 %) , one gets a total volume of 354 billion $ per day in 1986. The volume of world trade was calculated by applying the most recent growth estimates for 1985 (+ 0.8 %) and 1986 (+ 9.8 %) to the 1984 figure (1,906.6 billion $), taken from GATT (International Trade 1986/87, 1986); 250 business days were assumed.
5) Fischer-Erlach (1987) estimates the volume of DM/$ trading in Frankfurt, New york, London, and Tokyo to 71 billion $. The market share of these places can be roughly put at 60 %: the survey of the Group of Thirty (1985) estimates this volume at 70 %. Accounting for the places not included in this survey one obtains an approximation of 60 %. This implies a share for DM/$ trading (118 billion $) in the world total (354 billion $) of 33 %. This is consistent with the estimates of bank surveys for New York, 33.4 % (Fed New York, 1986), and London, 28 % (Bank of England, 1986).
6) The sum of all single positions of exports and imports of long-term capital amounts to 1,095.9 billion DM or 504.7 billion $ in 1986 (Deutsche Bundesbank, 1987, tables 5c, 5d, and 5e). This includes all other currencies/countries which might roughly compensate for the neglection of Euro-DM transactions.
7) The same pattern of steeper and more monotonic counter-movements also prevailed during the period of the fall of the dollar (figure 3). This period was not sub-divided since the counter-movements lasted much shorter.
8) Some readers might remain sceptical about the calculations in table 3, 4, and 5, because they are based on 5 day moving averages instead of the original data. However, this transformation filters out only minor fluctuations as figures 2 and 3 show. Moreover, if one does not use moving averages trends
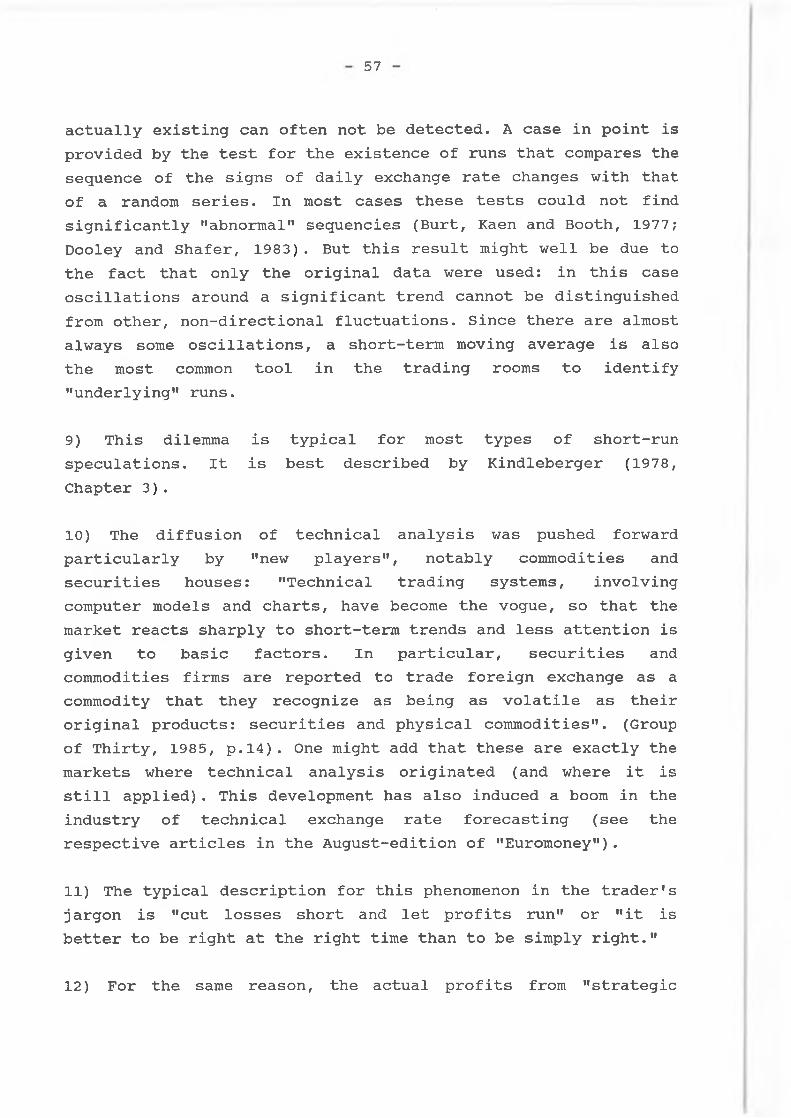
57
actually existing can often not be detected. A case in point is provided by the test for the existence of runs that compares the sequence of the signs of daily exchange rate changes with that of a random series. In most cases these tests could not find significantly "abnormal" sequencies (Burt, Kaen and Booth, 1977; Dooley and Shafer, 1983) . But this result might well be due to the fact that only the original data were used: in this case oscillations around a significant trend cannot be distinguished from other, non-directional fluctuations. Since there are almost always some oscillations, a short-term moving average is also the most common tool in the trading rooms to identify "underlying" runs.
9) This dilemma is typical for most types of short-run speculations. It is best described by Kindleberger (1978, Chapter 3).
10) The diffusion of technical analysis was pushed forward particularly by "new players", notably commodities and securities houses: "Technical trading systems, involving computer models and charts, have become the vogue, so that the market reacts sharply to short-term trends and less attention is given to basic factors. In particular, securities and commodities firms are reported to trade foreign exchange as a commodity that they recognize as being as volatile as their original products: securities and physical commodities". (Group of Thirty, 1985, p.14). One might add that these are exactly the markets where technical analysis originated (and where it is still applied). This development has also induced a boom in the industry of technical exchange rate forecasting (see the respective articles in the August-edition of "Euromoney").
11) The typical description for this phenomenon in the trader's jargon is "cut losses short and let profits run" or "it is better to be right at the right time than to be simply right."
12) For the same reason, the actual profits from "strategic
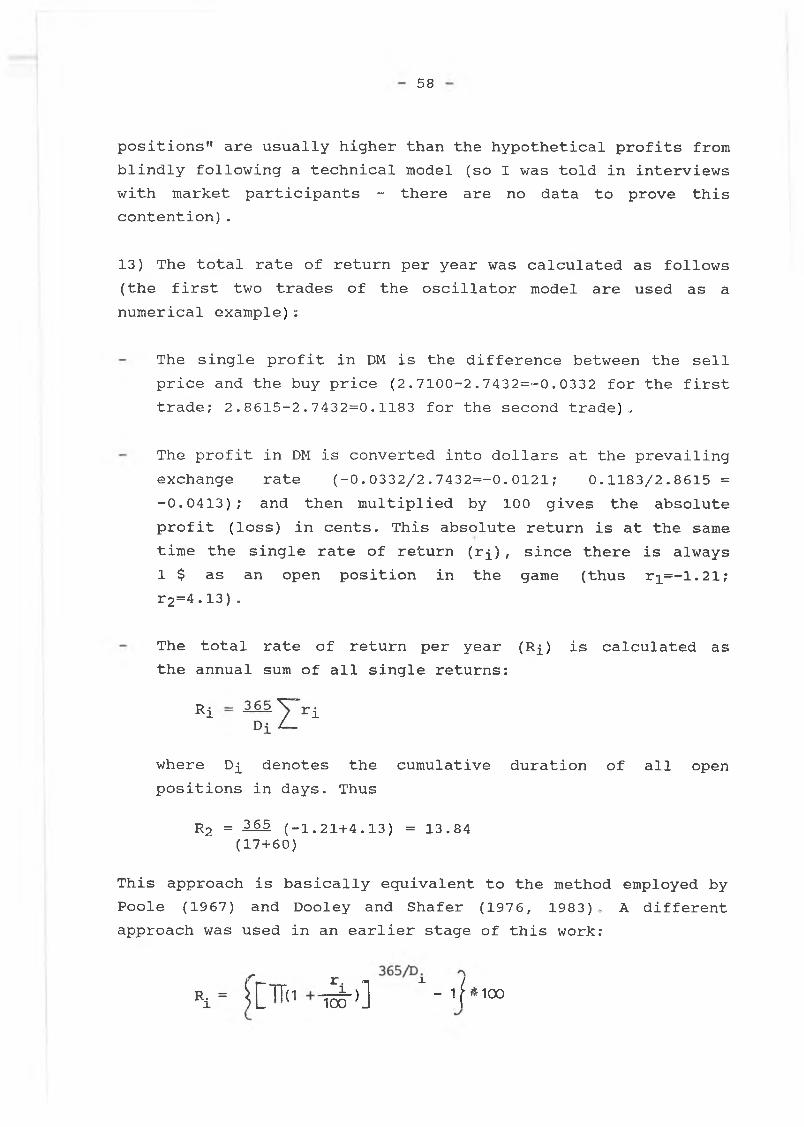
58
positions" are usually higher than the hypothetical profits from blindly following a technical model (so I was told in interviews with market participants - there are no data to prove this contention).
13) The total rate of return per year was calculated as follows (the first two trades of the oscillator model are used as a numerical example):
The single profit in DM is the difference between the sell price and the buy price (2.7100-2.7432=-0.0332 for the first trade; 2.8615-2.7432=0.1183 for the second trade)a
The profit in DM is converted into dollars at the prevailing exchange rate (-0.0332/2.7432=-0.0121; 0.1183/2.8615 = -0.0413); and then multiplied by 100 gives the absolute profit (loss) in cents. This absolute return is at the same time the single rate of return (r£), since there is always 1 $ as an open position in the game (thus ri=-1.21; r2=4.13).
The total rate of return per year (Rj_) is calculated as the annual sum of all single returns:
Ri i
where Dj denotes the cumulative duration of all open positions in days. Thus
R2 = 365. (-1.21+4.13) = 13.84 (17+60)
This approach is basically equivalent to the method employed by Poole (1967) and Dooley and Shafer (1976, 1983) . A different approach was used in an earlier stage of this work:
^ > 3 M &100
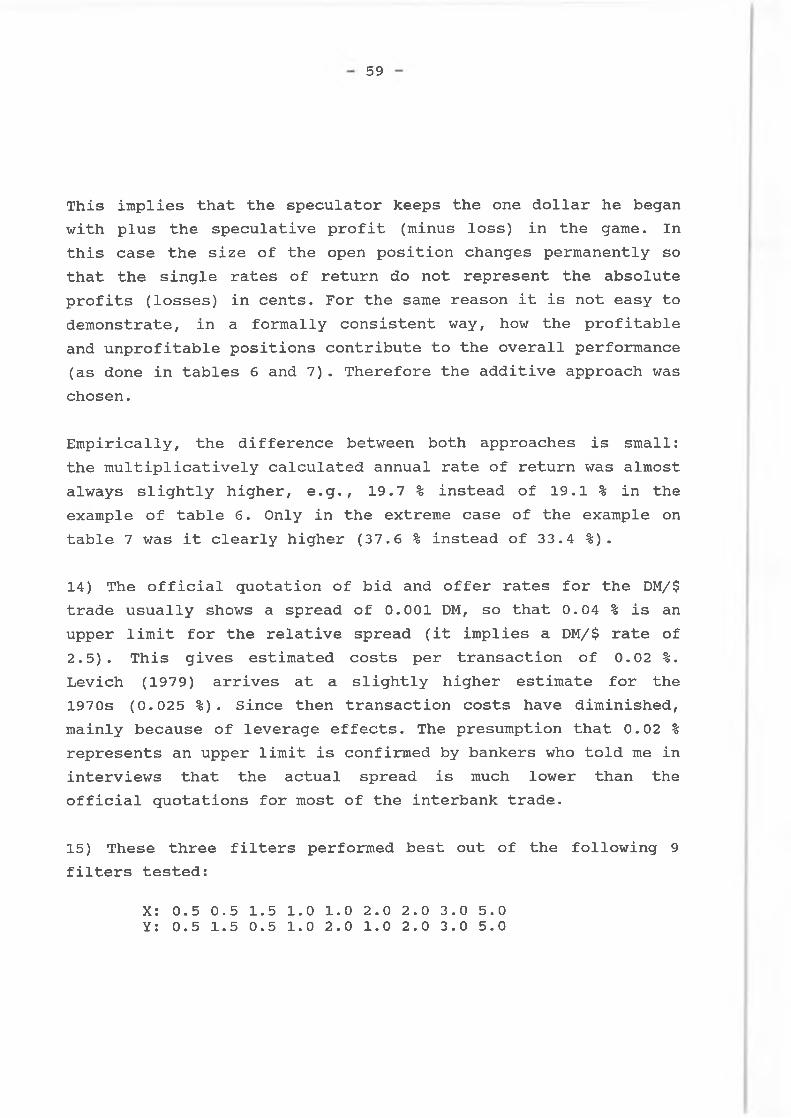
59
This implies that the speculator keeps the one dollar he began with plus the speculative profit (minus loss) in the game. In this case the size of the open position changes permanently so that the single rates of return do not represent the absolute profits (losses) in cents. For the same reason it is not easy to demonstrate, in a formally consistent way, how the profitable and unprofitable positions contribute to the overall performance (as done in tables 6 and 7). Therefore the additive approach was chosen.
Empirically, the difference between both approaches is small: the multiplicatively calculated annual rate of return was almost always slightly higher, e.g. , 19.7 % instead of 19.1 % in the example of table 6. Only in the extreme case of the example on table 7 was it clearly higher (37.6 % instead of 33.4 %).
14) The official quotation of bid and offer rates for the DM/$ trade usually shows a spread of 0.001 DM, so that 0.04 % is an upper limit for the relative spread (it implies a DM/$ rate of 2.5). This gives estimated costs per transaction of 0.02 %. Levich (1979) arrives at a slightly higher estimate for the 1970s (0.025 %). Since then transaction costs have diminished, mainly because of leverage effects. The presumption that 0.02 % represents an upper limit is confirmed by bankers who told me in interviews that the actual spread is much lower than the official quotations for most of the interbank trade.
15) These three filters performed best out of the following 9 filters tested:
X: 0.5 0.5 1.5 1.0 1.0 2.0 2.0 3.0 5.0 Y: 0.5 1.5 0.5 1.0 2.0 1.0 2.0 3.0 5.0
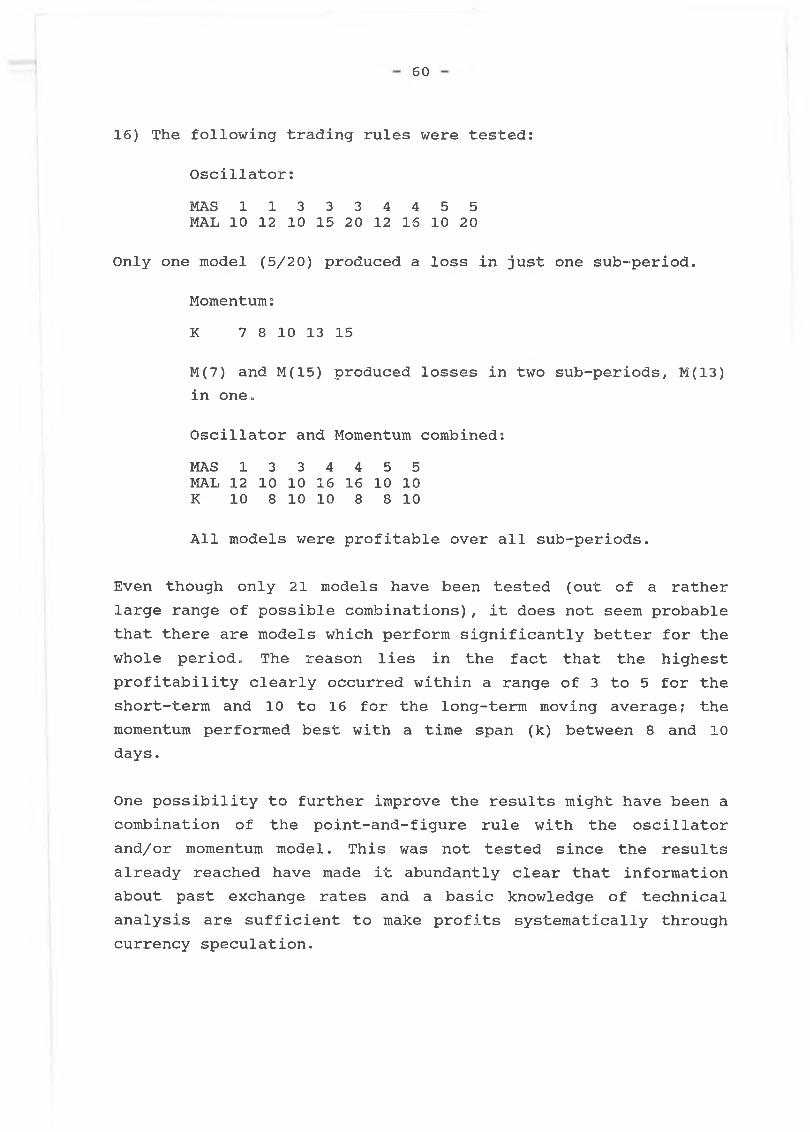
60
16) The following trading rules were tested:
Oscillator:MAS 1 1 3 3 3 4 4 5 5 MAL 10 12 10 15 20 12 16 10 20
Only one model (5/20) produced a loss in just one sub-period.
Momentum:K 7 8 10 13 15
M(7) and M(15) produced losses in two sub-periods, M(13) in one.
Oscillator and Momentum combined:MAS 1 3 3 4 4 5 5MAL 12 10 10 16 16 10 10K 10 8 10 10 8 8 10
All models were profitable over all sub-periods.
Even though only 21 models have been tested (out of a rather large range of possible combinations), it does not seem probable that there are models which perform significantly better for the whole period. The reason lies in the fact that the highest profitability clearly occurred within a range of 3 to 5 for the short-term and 10 to 16 for the long-term moving average? the momentum performed best with a time span (k) between 8 and 10 days.
One possibility to further improve the results might have been a combination of the point-and-figure rule with the oscillator and/or momentum model. This was not tested since the results already reached have made it abundantly clear that information about past exchange rates and a basic knowledge of technical analysis are sufficient to make profits systematically through currency speculation.
61
17) However, the distribution of the single rates of return is less leptokurtotic than the distribution of daily exchange rate changes which can be interpreted as single rates of return for the case of one trade every day (see the respective calculations in Westerfield, 1977; Friedman and Vandersteel, 1982; McFarland, Pettit and Sung, 1982) . This difference might be due to the elimination of most of the minor fluctuations by the trading techniques. The leptokurtosis of the single rates of return of technical models is then mainly caused by the greater than normal frequency of high positive changes, i.e., profits.
This comparison points to a possible explanation of leptokurtosis in the distribution of certain speculative prices like stock prices, commodities prices, and exchange rates (for a survey of empirical studies in this field see McFarland, Pettit and Sung, 1982). This phenomenon of a greater than normal frequency of very small and very large price changes corresponds to the "gestalt" of exchange rate movements as a sequence of runs (which are steeper the longer they last) and "whipsaws", the first consisting of relatively large price changes and the second consisting of relatively small price changes. The leptokurtotic price behaviour can therefore be interpreted as the result of short-term speculation based on and strengthened by technical analysis.
In a strict methodological sense t-statistics cannot be used if a sample distribution is significantly leptokurtotic. In econometric practice, however, this restriction is seldom taken into account (e.g., almost all econometric studies on exchange rates use t-statistics). In this study t-statistics are used to test the mean of the single rates of return against zero. This seems less problematic for two reasons. First, the single rates of return are less leptokurtotically distributed than the daily exchange rate changes. Second, the distribution of single rates of return is skewed to the right which means that the number of relatively large losses is actually smaller than in the case of
62
a normal distribution (see figure 5). Therefore, the actual probability of an overall loss should be less than the probability that is calculated on the basis of the symmetric t-distribution.
18) During a long dollar position one earns dollar interest ($IR) and pays DM interest (DMIR), the net effect consists of the interest differential ($IR-DMIR). During a short dollar position the net interest consist of -($IR-DMIR). Thus the overall effect can be calculated as ($IR-DMIR)(DL-DS)/DT where DL, DS, and DT denote the duration of long, short and total open positions in days. To take the year 1978 as an example: the overall duration of long dollar positions (DL) was 17*8=136 days, DS was 25*9=225 days and DT consequently 361 days (there were 4 non-transaction days at the beginning and the end of the year). The interest differential averaged -5.2 %. The net interest rate effect was therefore 5.2 (136-225)/361=-l.28. Thus accounting for the interest differential reduces the rate of return from following the technical model O&M (5/10/10) from11.8 % to 10.5 %.
19) This qualitative expectation formation is typical for technical trading: ’’Commodity trading is a form of price forecasting that deals with the simple concept: where are prices going? ... Most of the work that follows reduces the problem of direction to the simplest form, that of ’where are prices going today with respect to previous days?' The only answers that are expected will be u p , d o w n , or u n d e t e r m i n e d . This may seem to be an oversimplification of the basic concept, but it solves the problem." (Kaufman, 1978, in the introduction to his book, p.l).
If the market participants are asked for precise quantitative forecasts, their answers have to be taken as guesses like everybody else’s opinion. Those answers do not specifically impact upon the actual price movements since the market participants do not base their decisions on these quantitative
63
forecasts (this would simply be too risky). This fact explains the following puzzle. Exchange rate forecasts conducted through surveys among market participants performed extremely poorly (see Dominguez, 1986; Frankel and Froot, 1986A), yet these market participants not only did not go bankrupt, but earned profits consistently in the foreign exchange market.
20) This dilemma was first described by Keynes in his famous "beauty contest example" (Keynes, 1964, p.156). It seems to be particularly important in the case of exchange rate determination since the specific characteristics of this market generate extreme feed-back forces. For the same reason, technical analysis has become increasingly influential. One banker has remarked (with respect to charts): "Even if you don’t subscribe to their use, you can’t ignore them. Too many traders are using them today."
The general implications of this "beauty contest" problem in a decentralized market economy are analysed by Frydman (1982). He shows that even within the framework of rational expectations models of the market process will not converge to a general equilibrium solution "due to the fact that individual agents cannot ascertain the average of forecasts . . . formed by other agents" (p.654). Further discussions of the "beauty contest" problem can be found in Frydman and Phelps (1983).
21) The importance of runs for exchange rate dynamics and their character as a process of self-fulfilling expectations (speculations) was already described by Wicksell in 1919; "However, as the general public has no other means of gauging these prospects than the mere fact that the exchange rate is rising or falling, any alteration in the rate of exchange easily intends to intensify itself for a time ..." (Wicksell, 1958), p.236). I found this quotation in a monograph by Flassbeck (1985).
The same phenomenon was described by Nurkse (1944, p.118) for
64
the interwar period: "... anticipations are apt to bring about their own realization. Anticipatory purchases of foreign exchange tend to produce or at any rate to hasten the anticipated fall in the exchange value of the national currency, and the actual fall may set up or strengthen expectations of a further fall „ .. "
The phenomenon of exchange rate runs was also observed for the regime of floating rates since 1973«. As early as 1974 a prominent banker-economist (Geoffrey Bell) described it as follows: "Once a currency begins to fall, then the other banks join in the selling pressure, pushing the currency down further. The momentum can gather ground very quickly as the market trend becomes self-fulfilling assuming that no institutions are willing to take the opposite view. And many banks have concluded (quite correctly in the short term) that by following the pack it is easy to pick up profits; or, if they do not respond to the market movement they are exposed to the danger of serious currency losses." (Dooley and Shafer, 1983, p.47).
Since technical models have by now become widely used in the foreign exchange market it seems to be an interesting hypothesis for further research to conceive the specific shape of exchange rate runs as the result of the interaction of different types of technical models used by different players.
22) Many respondents explained this relationship by the fact that higher volatility provides more jobbing and arbitrage opportunities to market makers. However, this is only one part of the story (banks are usually not very explicit about their speculative activities). One must keep in mind that in practice there is no firm line between arbitrage on one hand and speculation on the other. If a trader has bought dollars he will hold them a little bit longer than in the case of "pure" arbitrage if there are "news" favourable to the dollar or if technical models signal a dollar appreciation which might last for some minutes, hours, or days. For this reason, firms that
65
have specialized in selling technical exchange rate models offer models which produce trading signals every five or fifteen minutes (e.g., Waldner and Co., one of the most successful firms in this field; see "Euromoney", August 1985, p.101).
23) These data were taken from the annual reports of the following banks: Bank of America, Bankers Trust, Chase Manhattan, Chemical Bank, Citibank, Continental Illinois, First Chicago, Irving Trust, Manufactures Hanover, Marine Midland, Morgan Guaranty Trust, Republic New York Corporation.
24) In interviews, German bankers reported considerable and generally growing profits from foreign exchange trading over the entire period since 1973. However, these data are not published. They are not even reported to the Bundesbank.
25) This phenomenon of two classes of agents who have different economic interests and consequently base their decisions on two different information sets is similar to some characteristics in the stock exchange as seen by Bagehot (1971). Bagehot distinguishes between two classes of market participants, those who trade stocks in order to make profits from their professional knowledge of market trends ("information-motivated transactors") and those who trade only occasionally as amateurs ("liquidity-motivated transactors"). Market makers usually incur losses when trading with "information-motivated transactors" and compensate for these losses by trading with "liquidity-motivated transactors". In the foreign exchange market the difference between the two groups of agents is much more distinct. One group bases its decision on developments in the goods market and the other group bases its decision on developments in the asset market. Furthermore, in the foreign exchange market the group of "information-motivated transactors" is to a large extent identical with the group of market makers.
Kindleberger described the different roles the two groups of actors play in the process of destabilizing currency speculation
66
as follows: "... as in the stock market, there are two bodies of speculators, the inside professionals and the outside amateurs. The insiders sell a weak currency and buy a strong one, driving the rate further in the direction it is moving and destabilizing. At the top they sell out a strong currency, and the outsiders buy it. At the bottom, the insiders buy a weak currency, and the outsiders sell it. The insiders are destabilizing in the range of movement, and stabilize at the limits. The outsiders - the sheep who get shorn in the stock market as well - destabilize and as a body lose." (Kindleberger, 1973, p.410f).
Figlewski (1978) developed a theoretical model of a speculative market in which the redistribution of wealth among traders with different information can be studied. It is shown that such a market is not likely to be efficient since the market weights traders’ information not by its quality but by "dollar votes". In the case of the foreign exchange market this relationship seems even more relevant since the agents with better (inside) information have at the same time many more "dollar votes".
26) This section draws heavily from a working paper which I wrote in 1983 (Schulmeister, 1983). Upon completion of the essay in hand, I came across a recent article by Biasco (1987) which is very similar in spirit. Both studies explain the medium-term exchange rate dynamics as result of the interaction of disequilibria in the goods market ("real" forces) and in the asset market ("monetary" or "financial" forces). This disequilibrium approach is fundamentally different from any traditional model of exchange rate determination. One can therefore take the fact that two economists have developed similar ideas independently from each other as some evidence that this qualitative model may have some explanatory power in spite of its "peculiarity".
27) The real interest rates were calculated as the difference between the nominal rate (3-months treasury bills) and the CPI-change against the previous year.
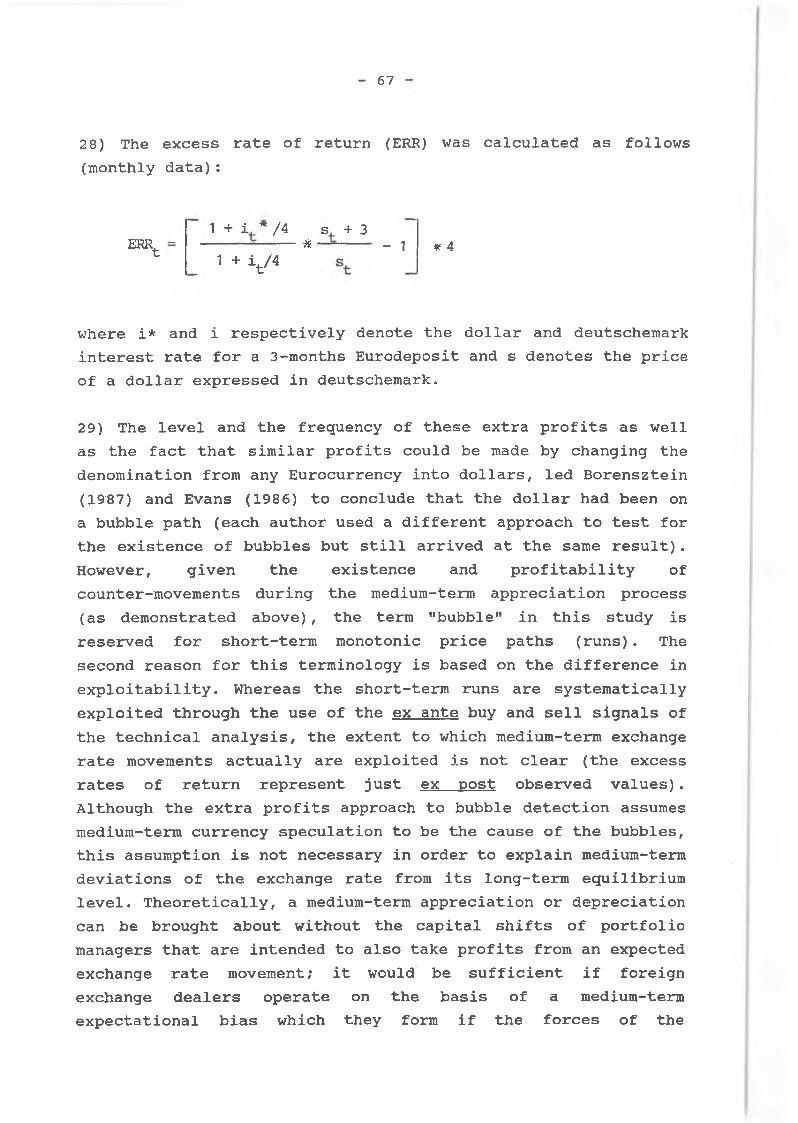
67
28) The excess rate of return (ERR) was calculated as follows (monthly data):
ERRt1 + i ~ /4 s + 3 ---- --- * ——--- - i * 41 + it/4
where i* and i respectively denote the dollar and deutschemark interest rate for a 3-months Eurodeposit and s denotes the price of a dollar expressed in deutschemark.
29) The level and the frequency of these extra profits as well as the fact that similar profits could be made by changing the denomination from any Eurocurrency into dollars, led Borensztein (19B7) and Evans (1986) to conclude that the dollar had been on a bubble path (each author used a different approach to test for the existence of bubbles but still arrived at the same result). However, given the existence and profitability of counter-movements during the medium-term appreciation process (as demonstrated above) , the term "bubble" in this study is reserved for short-term monotonic price paths (runs). The second reason for this terminology is based on the difference in exploitability. Whereas the short-term runs are systematically exploited through the use of the ex ante buy and sell signals of the technical analysis, the extent to which medium-term exchange rate movements actually are exploited is not clear (the excess rates of return represent just ex post observed values). Although the extra profits approach to bubble detection assumes medium-term currency speculation to be the cause of the bubbles, this assumption is not necessary in order to explain medium-term deviations of the exchange rate from its long-term equilibrium level. Theoretically, a medium-term appreciation or depreciation can be brought about without the capital shifts of portfolio managers that are intended to also take profits from an expected exchange rate movement; it would be sufficient if foreign exchange dealers operate on the basis of a medium-term expectational bias which they form if the forces of the
68
disequilibria in the goods market and in the asset market work in the same direction. In practice, however, such speculative portfolio investments actually take place.
30) The overall force determining the exchange rate at any point in time can be conceived as the sum vector in a parallelogram of forces where one vector represents the disequilibrium in the goods market and the other vector the disequilibrium in the asset market. The change in the direction and in the length of either vector in time then determines the overall dynamics of exchange rate fluctuations.
Biasco (1987) uses a different picture, namely a circle around the origin in a two-dimensional plane where the x-axis represents the ’’real'5 forces and the y-axis the "monetary” forces. These two types of presentation indicate one difference. Biasco perceives the medium-term exchange rate fluctuations as cycles, whereas I perceive them as a sequence of bubble-like movements which change their direction abruptly (if not interrupted by a "whipsaw"-like "precarious equilibrium").
31) There are also those portfolio investors whose time horizon is so long that they do not care about the medium-term exchange rate trend. Investors who bought long-term US bonds between mid 1985 and mid 1986 were probably aware that the dollar would depreciate rather than appreciate over the following months. However, this did not affect their decisions significantly for one cannot conclude from a medium-term trend what the dollar exchange rate will be in ten years or more.
32) The perception that the same pattern (of trends and "whipsaws" can be found in the short-term, the medium-term, and even the long-term development represents an integral element of a seemingly esoteric method of the technical analysis, the so-called Elliot wave principle (see Kaufman, p„194ff, for an introduction)c This "philosophy", which is based on a series of numbers rediscovered by a medieval monk and mathematician named
69
Fibonacci Pisano, seems rather bizarre to an educated economist.(The Fibonacci series is characterized by the fact that any number in the series is the sum of the two preceding numbers: (1,1)2,3,5,8, 13,21,34,55,89 . ..; Kaufman reports severalregularities in nature as well as in society which are related to this sequence, e.g., the relative dimensions of the Great Pyramid of Gizeh). However, increasingly more agents include the Elliott wave principle in their decision process (e.g., a corporation like Merrill Lynch). It should thus be taken seriously, at least for the reason of the "beauty contest" problem.
33) The transactions of portfolio investors do not influence significantly the determination of exchange rates because the volume of these transactions is rather small compared to the overall size of the foreign exchange market (less than 2 % as shown above).
34) Personally, I would rather recommend the lucid essay by Ludwik Fleck (1979), originally published in 1935. For a long time it was almost completely neglected, but is still path-breaking, since Kuhn (1962) based many of his ideas on Fleck's monograph as Kuhn himself states in the introduction to his book. He did not, however, give any reference to Fleck in the main text.
Fleck shows that the creation of a "scientific fact" (i.e., a new explanation) is always brought about through the cognition of a new "gestalt" in the well-known empirical "facts", different from the prevailing "gestalt", established within the "thought collective" (any seeing is always a "Gestaltsehen" or "Sinnsehen" ("ideovision"), an "objective scientific fact" is consequently an illusion, though a comfortable one for ambitious scientists). It is for this reason that I used the term "gestalt" in this essay.
35) It should be clear from the above analysis that the
70
profitability of exchange rate speculation will be less pronounced the less a currency is traded (due to the self- fulfilling property of currency speculation). In other words, in order to reduce the complexity of the game, only a few number of chips are actually used in the currency casino with one serving as ''numeraire". The asset market approach excluding extra profits from changing the currency portfolio will,only be valid in the case of very high inflation differentials between currencies. In such a case, both the exchange rate and the interest rate are dominated by the inflationary dynamics and thus, purchasing power parity and interest parity hold at the same time. This was the case during the German hyperinflation, which served as the empirical reference point of the monetarist asset market model (see Frenkel, 1976). It seems paradoxical that the asset market models work best when currencies have lost the most intrinsic characteristic of an asset, namely, its property as a store of wealth.
36) This section also draws from Schulmeister (1983).
37) Dornbusch used the following statement as a point of departure for a study on "special exchange rates": "The exchange rates consistent with high employment and a balanced current account are rarely the same as the rates consistent with asset market equilibrium at interest rates policy makers wish to prevail." (Dornbusch, 1985, p.l).
38) These relations must not be mistaken for balance of payment identities since they reflect the intended transactions of private actors induced by the relative prices (goods market) and interest rate differentials (asset market). This important distinction between ex ante and ex post balances was usually made in the 1950's and 1960's (see for example Kindleberger, 1969A)e Since then, however, it has been somewhat neglected.
71
References
Adler, M. , Lehmann, B. , Deviations from Purchasing Power Parity- in the Long Run, The Journal of Finance, 38(5), 1983, pp.1471-1487.
Alexander, D. , Thomas, L.R., "Monetary/Asset Models of Exchange Rate Determination. How Well Have They Performed in the 1980's?" International Journal of Forecasting, 1987, 3, pp.53-64.
Alexander, S.S., "Price Movements in Speculative Markets: Trends or Random Walks, No.2", in Cootner, P.H. (ed.), The Random Character of Stock Market Prices, MIT Press, Cambridge, Mass., 1964.
Andrews, M.D., "Recent Trends in the U.S. Foreign Exchange Market", Federal Reserve Bank of New York Quarterly Review, Summer 1984, pp.39-47.
Arndt, S.W., Sweeney, R.J., Willett, T.D., Exchange Rates, Trade and the U.S. Economy, Ballinger, Cambridge, Mass., 1985.
Backus, D., "Empirical Models of the Exchange Rate: Separating the Wheat from the Chaff", Canadian Journal of Economics, 1984, 17(4), pp.824-840.
Bagehot, W., "The Only Game in Town", Financial Analysts' Journal, 1971, 27(2), pp.12-22.
Bank of England, "The Market in Foreign Exchange in London", Bank of England Quarterly Bulletin, September 1986, pp.379-382.
Biasco, S., "Currency Cycles and the International Economy",Banca Nazionale del Lavoro, Quarterly Review, March 1987, No. 160, pp.31-60.
- 72 -
Bilson, J.F.O, "The 'Speculative Efficiency' Hypothesis", Journal of Business, 1981, vol. 54(3), pp.435-451.
Bilson, J.F.O., Hsieh, D.A. , "The Profitability of Currency Speculation", International Journal of Forecasting, 1987, 3(1), pp.115-130.
Blanchard, O.J., Watson, M.W. , "Bubbles, Rational Expectations and Financial Markets", in Wachtel, P. (ed.), Crises in the Economic and Financial Structure, Lexington Books, Lexington, 1982, pp.295-316,
Booth, G.G., Kaen, F.R., Koveos, P.F., "R/S Analysis of Foreign Exchange Rates Under Two International Monetary Regimes", Journal of Monetary Economics, 1982, 10(3), pp.407-415.
Boothe, P. , "Speculative Profit Opportunities in the Canadian Foreign Exchange Market, 1974 - 1978", Canadian Journal of Economics, 1983, 16(4), pp.603-611.
Boothe, P. , Longworth, D. , "Foreign Exchange Market Efficiency Tests: Implications of Recent Empirical Findings", Journal of International Money and Finance, 1986, 5(1), pp.135-152.
Borensztein, E.R., "Alternative Hypotheses on the Excess Return on Dollar Assets", IMF Staff Papers, 1987, 34(1), pp.29-59.
Burt, J., Kaen, R., Booth, G., "Foreign Exchange Market Efficiency Under Flexible Exchange Rates", Journal of Finance, 1977, 32, pp.1325-1330.
Cornell, B. , Dietrich, J.K., "The Efficiency of the Market for Foreign Exchange Under Floating Exchange Rates", Review of Economics and Statistics, 1978, 60(1), pp.111-120.
- 73 -
Cornell, B., Shapiro, A.C., "Interest Rates and Exchange Rates: Some New Empirical Results", Journal of International Money and Finance, 1985, 4(4), pp.431-442.
Crabbe, M., "Inside the New In-House Banks", Euromoney, February 1986, pp.24-39.
Cumby, R.E., Obstfeld, M. , "International Interest Rate and Price Level Linkages under Flexible Exchange Rates: A Review of Recent Experience", in Bilson, J.F.O., Marston, R.C. (eds.), Exchange Rate Theory and Practice, University of Chicago Press, Chicago, 1984.
Deutsche Bundesbank, Statistische Beihefte zu den Monatsberichten, Reihe 3, Zahlungsbilanzstatistik, März 1987 (Heft 3).
Dickey, D.A., Fuller, W.A., "Likelihood Ratio Statistics for Autoregressive Time Series With a Unit Root", Econometrica, 1979, 49(4), pp.1057-1072.
Dickey, D.A., Fuller, W.A., "Distribution of the Estimators for Autoregressive Time Series With a Unit Root", Journal of the American Statistical Association, 1979, 74, pp.427-431.
Domar, R.O., "The 'Burden of the Debt' and the National Income", American Economic Review, 1944, 34(4), pp.798-827.
Dominguez, K.M., Are Foreign Exchange Forecasts Rational? New Evidence from Survey Data, International Finance Discussion Paper No.281, Board of Governors of the Federal Reserve System, May 1986.
Dooley, M. , Shafer, J., Analysis of Short-Run Exchange Rate Behavior March 1973 to September 1975, International Finance Discussion Papers No.76, Federal Reserve System, Washington,1976.
74
Dooley, M., Shafer, J., "Analysis of Short-Run Exchange Rate Behaviour: March 1973 to November 1981", in Bigman, D., Taya, T. (eds.), Exchange Rate and Trade Instability, Ballinger, Cambridge, Mass., 1983.
Dornbusch, R., "Expectations and Exchange Rate Dynamics", Journal of Political Economy, 1976, 84(6), pp.1161-1176.
Dornbusch, R., "Special Exchange Rates for Capital Account Transactions", NBER Working Paper No. 1659, July 1985.
Dornbusch, R., ä'Exchange Rate Economics: 1986", The Economic Journal, 1987, 97(1), pp.1-18.
Einzig, P. (1970A), The History of Foreign Exchange, Macmillan, London, 1970 (2nd ed.).
Einzig, P. (1970B),The Case Against Floating Exchange Rates, Macmillan, London, 1970.
Evans, G.W., "A Test for Speculative Bubbles in the Sterling - Dollar Exchange Rate: 1981-84", The American Economic Review, 1986, 76(4), pp.621-636.
Fama, E.F., "Efficient Capital Markets: A Review of Theory and Empirical Work", The Journal of Finance, 1970, 25(2),pp.383-417.
Federal Reserve Bank of New York, Summary of Results of U.S. Foreign Exchange Market Turnover Survey Conducted in March 1986, Mimeo, New York, 1986.
Figlewski, S., "Market 'Efficiency1 in a Market with Heterogeneous Information", Journal of Political Economy, 1978, 86(4), pp.581-597.
Fischer-Erlach, P., Handel und Kursbildung am Devisenmarkt, 3. Aufl., Kohlhammer, Stuttgart, 1987.
75
Flassbeck, H., Freihandel, GATT und das internationale Währungssystem, Walter Eucken Institut, Verträge und Aufsätze 105, Mohr, Tübingen, 1985.
Fleck, L., "Genesis and Development of a Scientific Fact", The University of Chicago Press, 1979. (Originally published as "Entstehung und Entwicklung einer wissenschaftlichen Tatsache", Basel, 1935.)
Frankel, J., The Dazzling Dollar, Brookings Papers on Economic Activity, 1/1985.
Frankel, J.A., The Implications of Mean-Variance Optimization for Four Questions in International Macroeconomics, Journal of International Money and Finance, 1986, 5(1), pp.53-75.
Frankel, J.A., Froot, K.A. (1986A), Interpreting Tests of Forward Discount Bias Using Survey Data on Exchange Rate Expectations, NBER/Working Paper No.1963, June 1986.
Frankel, J.A., Froot, K.A. (1986B), The Dollar as a Speculative Bubble: A Tale of Fundamentalists and Chartists, NBER Working Paper No.1854, March 1986.
Frenkel, J., "A Monetary Approach to the Exchange Rate: Doctrinal Aspects and Empirical Evidence", Scandinavian Journal of Economics, 1976, 78(2), pp.200-224.
Friedman, D., Vandersteel, S., "Short-Run Flucutations in Foreign Exchange Rates: Evidence from the Data, 1973-79", Journal of International Economics, 13, August 1982, pp.171-186.
Friedman, M., "The Case for Flexible Exchange Rates", in Friedman, M., Essays in Positive Economics, University of Chicago Press, Chicago, 1953.
76
Frydman, R. , "Towards an Understanding of Market Processes: Individual Expectations, Learning, and Convergence to Rational Expectations Equilibrium", American Economic Review, 1982, 70(4), ppo652-668.
Frydman, R. , Phelps, E.S. (eds.), Individual Forecasting and Aggregate Outcome, Cambridge University Press, Cambridge, 1983.
Fuller, W.Ao, Introduction to Statistical Time Series, John Wiley and Sons, New York, 1976.
Giddy, I.H., "Measuring the World Foreign Exchange Market", Columbia Journal of World Business, 1979, 14(4), pp.36-48.
General Agreement on Tariffs and Trade (GATT), International Trade 1986/87, Geneva, 1986.
Goodman, S., Foreign Exchange Rate Forecasting Techniques: Implications for Business and Policy, The Journal of Finance, 1977, 34(2), pp.415-427.
Greene, M.T., Fielitz, B., "Long-Term Dependence in Common Stock Returns", Journal of Financial Economics, 1977, 66, pp,246-253.
Group of Thirty, The Foreign Exchange Market in the 1980's, New York, 1985.
Hamilton, J.D., Whiteman, Ch.H., "The Observable Implications of Self-fulfilling Expectations", Journal of MonetaryEconomics,1985, 16(3), pp.353-373.
Heiner, R.,A., "The Origin of Predictable Behavior", American Economic Review, 1983, 73(4), pp.560-595.
Hoffman, D.L., Schlagenhauf, D.E., "The Impact of News and Alternative Theories of Exchange Rate Determination", Journal of Money, Credit and Banking, 1985, 17(3), pp.328-346.
77
Isard, P. , ’’Lessons from Empirical Models of Exchange Rates”, IMF Staff Papers, 1987, 34(1), pp.1-28.
Johnson, H.G., "The Keynesian Revolution and the Monetarist Counter-Revolution", American Economic Review, 1971(2), pp.1-14.
Kaen, F.R., Rosenman, R.E., "Predictable Behavior in Financial Markets: Some Evidence in Support of Heiner’s Hypothesis",American Economic Reviews, 1986, 76(1).
Kaufman, P.J., Commodity Trading Systems and Methods, John Wiley and Sons, New York, 1978.
Kenen, P.B., "Macroeconomic Theory and Policy: How the Closed Economy was Opened", in Jones, R.W., Kenen, P.B. (eds.), Handbook of International Economics, North Holland Amsterdam - New York - Oxford, 1985, pp.626-677.
Keynes, J.M., The General Theory of Employment, Interest and Money, Harvest Books, New York, 1964.
Kindleberger, Ch.P. (1969A), "Measuring Equilibrium in the Balance of Payments", Journal of Political Economy, 1969, 77(6), pp.873-891.
Kindleberger, Ch.P. (1969B) , "The Case for Fixed Exchange Rates, 1969", in The International Adjustment Mechanism, Federal Reserve Bank of Boston, Conference Series, No. 2, pp.93-108.
Kindleberger, Ch.P., International Economics, 5th edition, Richard D. Irwin, Homewood, 111., 1973.
Kindleberger, Ch.P., Manias, Panics and Crashes, Basic Books, New York, 1978.
78
Krueger, A.O., "Balance-of-Payments Theory”, Journal of Economic Literature, 1969, 7(1), pp.1-26.
Kuhn, T.S., The Structure of Scientific Revolutions, University of Chicago Press, Chicago, 1962.
Levich, R.M., The International Money Market: An Assessment of Forecasting Techniques and Market Efficiency, JAI Press, Greenwich, Conn., 1979.
Levich, R.M., "Empirical Studies of Exchange Rates: Price Behavior, Rate Determination and Market Efficiency", in Jones, R.W. , Kenen, P.B«, (eds.), Handbook of International Economics, North-Holland, Amsterdam - New York - Oxford, 1985, pp.979-1040.
Logue, D.E., Sweeney, R.J., "’White-Noise* in Imperfect Markets: The Case of the Franc/Dollar Exchange Rate", The Journal of Finance, 1977, 32(3), pp.761-768.
Marris, St., Deficits and the Dollar: The World Economy at Risk, Policy Analyses in International Economics, 14, Institute for International Economics, Washington D.C., December 1985.
McFarland, J.W. , Pettit, R=R., Sung, S.K., "The Distribution of Foreign Exchange Price Changes; Trading Day Effects and Risk Measurement", The Journal of Finance, 1982, 37(3), 693-715.
Meese, R.A. , ’’Testing for Bubbles in Exchange Markets; A Case of Sparkling Rates?’’, Journal of Political Economy, 1986, 94 (2), pp.345-373.
Meese, R.A., Rogoff, K., "Empirical Exchange Rate Models of the Seventies: Do They Fit Out of Sample?’’, Journal of International Economics, 1983(1), pp.3-24.
Meese, R.A., Rogoff, K., Was It Real? The Exchange Rate-Interest Differential Relation, 1973 - 1984, NBER Working Paper No.1732, October 1985.
79
Mussa, M. "Empirical Regularities in the Behavior of Exchange Rates and Theories of the Foreign Exchange Market", Carnegie-Rochester Conference Series on Public Policy, 1979, 11, pp.9-57.
Nurkse, R. , International Currency Experience, League of Nations, 1944.
Obstfeld, M. , Rogoff, K. , "Ruling Out Divergent Speculative Bubbles", Journal of Monetary Economics, 1986, 17(3),pp.349-362.
Poole, W. , "Speculative Prices as Random Walks: An Analysis of Ten Time Series of Flexible Exchange Rates", Southern Economic Journal, 1967, 33(April), pp.468-478.
Riehl, H. , Rodriguez, R.M., Foreign Exchange and Money Markets, McGraw Hill, New York, 1977.
Sachs, J.D., "The Dollar and the Policy Mix: 1985", Brooking Papers on Economic Activity, 1985(1), pp.117-197.
Schulmeister, St., Exchange Rates, Prices and Interest Rates, Economic Research Reports, New York University, July 1983.
Schulmeister, St., Zur Krise der Weltwirtschaft in den siebziger und achtziger Jahren - ein Rekonstruktionsversuch, Mimeo, Vienna, 1986, forthcoming in Burger, R. , Matzner, E., Pelinka,A. , Steinert, H. (eds.), ...., Österreichischer Bundesverlag,Wien, 1987.
Shaw, A.R., "Technical Analysis", in Levine, S.N. (ed.), Financial Analysts' Handbook I, Dow Jones - Irwin, Homewood,111., 1975, pp.944-988.
80
Sohmen, E. , Flexible Exchange Rates: Theory and Controversy, University of Chicago Press, Chicago, 1961.
Somanath, V.S., "Efficient Exchange Rate Forecasts: Lagged Models Better than the Random Walk", Journal of International Money and Finance, 1986, 5(1), pp.195-220.
Sweeney, R.J., "Stabilizing or Destabilizing Speculation? Evidence from the Foreign Exchange Market", in Arndt, S., Sweeney, R.J., Willett, T.D. (eds.), Exchange Rates, Trade and the U.S. Economy, Ballinger, Cambridge, Mass., 1985.
Stevenson, R. A. , Bear, R.M., Commodity Futures: Trends as Random Walks, The Journal of Finance, 1970, 25(1), pp.65-81.
Tölke, F.W., Währungsanalyse mit Point and Figure Charts, Europäische Hochschulschriften, P.Lang, Frankfurt/Main, 1986.
Tse, Y.K., "The Spot and Forward Exchange Rates: Some Empirical Evidence from Singapore", Applied Economics, 1986, 18(3), pp.319-331.
Van der Kraats, R„H., Booth, L.D., "Empirical Tests of Monetary Approach to Exchange Rate Determination", Journal of International Money and Finance, 1986, (2), pp.255-278.
Weicker, J., Technische Aktienanalyse, Verlag Moderne Industrie, Zürich, 1982.
Wermuth, D. , Ochynski, W. , Strategien an den Devisenmärkten, Gabler, Wiesbaden, 1984.
Westerfield, J.M., "An Examination of Foreign Exchange Risk Under Fixed and Floating Rate Regimes", Journal of International Economics, 1977, 7(2), ppo181-200.
81
Wickseil, K. , "The Riddle of Foreign Exchanges (1919)", in Wickseil, K. , Selected Papers on Economic Theory, Cambridge, Mass., 1958.
Woo, W.T., "Speculative Bubbles in Foreign Exchange Markets", Brookings Discussion Papers in International Economics No.13, March 1984.
Working, H., "Note on the Correlation of First Differences in a Random Chain", Econometrica, 1960, 28(October), pp.916-918.