Embed Size (px)
Citation preview

10-202
2010
Are Fruit and Vegetable Stamp Policies Cost-Effective?
JEAN DALLONGEVILLE, LUC DAUCHET, OLIVIER DE MOUZON, VINCENT RÉQUILLART
AND LOUIS-GEORGES SOLER
Research Group: Food, Farms, and Firms

ABSTRACT
In many countries, consumption of fruits and vegetables (F&V) is below recommended levels. We quantify the economic and health effects of a F&V stamp policy designed for low-income consumers. The analysis combined two models: an economic model which predicts how F&V consumption is affected by a change in policy and a health model which evaluates the impact of a change in F&V consumption in terms of death avoided (DA) and life-years saved (LYS). We computed the costs per DA and LYS as the ratios between the taxpayer cost of the policy and the numbers of DA and LYS. The main findings are: at the aggregate level, a F&V stamp policy has a modest impact on consumption and as a result on health gains; however, when well designed, the F&V stamp policy may increase the F&V consumption of low-income households; to maximize the cost-effectiveness of the F&V stamp policy, the targeted population must be rather small; the F&V stamp policy may be more cost-effective than a non-targeted policy based on a VAT decrease; a stamp policy may generate a small increase in the price of F&V thus reducing the consumption and the health benefits within the non targeted population.
KEY WORDS: Cost-Effectiveness Analysis, Fruits and Vegetables, Health Impact Assessment, Health Policy
JEL CODES: D61, I18, Q18.
ARE FRUIT AND VEGETABLE STAMP POLICIES COST-EFFECTIVE?
O. de Mouzon1, V. Réquillart1, L.G. Soler2, J. Dallongeville3 et L. Dauchet3
(1)Toulouse School of Economics (INRA, GREMAQ), F
(2) INRA-ALISS, Ivry-Seine, F
(3) Institut Pasteur de Lille, INSERM 744, F

2
Are Fruit and Vegetable Stamp Policies Cost-Effective?
Introduction
Poor nutritional outcomes in disfavoured and low-income households are crucial issues for
health policy makers in many industrialized countries (Lock et al., 2005). Population groups
with high poverty rates and low education levels are indeed often reported to face higher
obesity and overweight prevalence, associated with lower-quality diets, higher intakes of
energy-dense foods and smaller consumption of fruits and vegetables (F&V) (Blisard et al.,
2004; Disball et al., 2007; Fox and Cole, 2004; Frazao, 2007; Wilde at al., 1999). Even if
other factors seem to play important roles (French et al., 2001; Cassady et al. 2007), economic
factors are frequently considered as major determinants of food behaviours, low incomes
binding the food diet choices and limiting the ability to have adequate food intakes according
to dietary guidelines (Bihan et al., 2010; Drewnowski at al., 2004; Drewnowski and Specter,
2004; Drewnowski and Darmon, 2005; Lin and Guthrie, 2007; Olson, 1999; Shenkin and
Jacobson, 2010)).
In the United States, food assistance programs have been implemented for a long time to help
disfavoured populations from an economic point of view (Landers, 2007). Beside education
programs, Food Stamp Program (FSP) aims to increase food expenditures by delivering to the
households monthly stamps only useable to buy foods. In present days, 25 millions of people
are involved in this program and receive an average amount of 200 dollars per household per
year. FSP is generally considered to be successful in the sense that it provided food assistance
to many low-income people, leading to a decrease in child poverty and food insecurity (Le
Blanc et al., 2007; Pan and Jensen, 2008; Wilde and Nord, 2005). However the impacts on
diet quality and nutrient needs are more controversial and the goals related to the reduction of
obesity and overweight prevalence are not always met (Chen et al., 2005; Jones and Frongillo,

3
2006; Gibson, 2003 and 2006; Meyerhoefer and Pylypchuk, 2008; Ver Ploeg et al., 2007:
Wilde et al., 2000; Webb et al., 2008). It is worthwhile to note that the FSP allows
participants to buy any foods they want and thus to consume the same diet as previously, even
if it is dominated by energy-dense foods and beverages (Fox et al., 2004; Fox and Cole, 2004;
Frongillo, 2003). For this reason, some authors proposed to re-design the FSP to allow only
the purchase of healthy foods, especially F&V (Guthrie et al., 2007). Such a measure has been
experimented within the Special Supplemental Nutrition Program for Women, Infants, and
Children and the Food Stamp (WIC), in which pregnant women in low-income households
get a $10 voucher per week to purchase only fresh F&V. This experiment confirmed that
providing F&V vouchers would increase purchase and consumption of a wide variety of
nutrient dense fresh F&V among low income women and their families (Herman et al., 2008).
In Europe, food stamp programs have not been implemented yet, as food assistance programs
rely mainly on charity associations which distribute food surpluses. However the increase in
health inequalities and in obesity prevalence among low income populations led some policy
makers to propose to implement F&V stamp programs1. Some local experiments have been
made in France to assess the impacts of €10 monthly vouchers per person. First results seem
to attest some positive effects on F&V consumption (Bihan, 2008).
However, redesigning the FSP in the US by limiting their use to F&V purchases, or
generalizing the first European experiments to every low income households raises the
question of the cost-effectiveness of this policy. Cost-effectiveness of F&V stamp policy
depends on several factors. Firstly, it depends on the amount of money each participant gets to
1 See for instance, the project discussed in the French Parliament in June 2010 (http://www.assemblee-nationale.fr/13/pdf/propositions/pion2671.pdf).

4
buy F&V. This amount depends on the total budget allocated to the policy and on the size of
the targeted population. Secondly, it depends on the initial consumption patterns of each
participant. It is well-known that the behaviour of the household will depend on the value of
the stamp compared to the initial expenditure (Alston et al. 2009). If the stamp is smaller than
the budget initially devoted to F&V purchases, it acts as an increase in income and has the
same effect on consumption as a cash transfer. If the stamp is greater, the value above the
current F&V expenditure is fully devoted to F&V purchases. In the first case the impact is
likely to be small while in the second it might be significant. Thirdly, the cost-effectiveness of
the policy will depend on its aggregated effects on the participants and the non participants as
well (Alston et al., 2009; Dallongeville et al., 2010). Indeed, if the program is successful it
leads to an increase in the F&V demand. Then, it is likely that all the households will face
higher prices which can limit the consumption increase among the participants to the program
and favour a consumption decrease among the non participants. Finally, the cost-effectiveness
of such a policy will depend on the health benefits linked to an increase of F&V consumption.
Following Cash et al. (2005) and Dallongeville et al. (2010), the goal of the paper is to assess
the effects of the various dimensions mentioned above (budget allocated to the F&V program,
size of the targeted population, initial consumption and expenditures of the targeted
population) on the economic and health impacts of a F&V stamp policy. An economic model
of the F&V market is used to provide the impacts of the food stamp policy on F&V
consumption. Then a health model is used to assess the impact of the changes in F&V
consumption levels on the number of deaths avoided (DA) and life-years saved (LYS) from
non communicable diseases. This economic/health model is used to simulate a F&V stamp
policy and determine the modifications of F&V consumption among participants and non
participants to the F&V stamp program, depending on the budget allocated and the size of the

5
targeted population. According to the health consequences assessed by simulation, we then
compute the costs per DA and LYS induced by this policy. The simulations are made using
French data.
Our results contribute to a larger debate in public health dealing with the compared benefits of
targeted versus population-based prevention strategies. Introduced by Rose (1992), an
argument in favour of non targeted strategies is that more disease can be often prevented by
reducing a risk factor by a small amount in the total population than by selectively reducing it
by a large amount in high-risks individuals. Considering risk factors such as cholesterol, Rose
(2001) showed that a strategy that reduced the population average of cholesterol would lower
the prevalence of clinical heart disease more than a strategy focused on people with the
highest cholesterol values. This result has been discussed by several authors in relation to
medical issues like risk prediction methods (Zulman et al., 2008) or to the costs of the
interventions (Ahern et al., 2008). In this paper we continue this discussion by considering the
potential effects of markets mechanisms on the trade-off between targeted / non targeted
strategies. More precisely, we compare the targeted F&V stamp policy to the impacts induced
by a non targeted policy based on reduction of F&V price thanks to a VAT decrease. Previous
works showed that F&V stamp policy seemed to be able to reduce health inequalities but its
cost-effectiveness appeared to be smaller than non-targeted policies relying on F&V price
reduction or generic information campaigns (Dallongeville et al., 2010). We argue here that
targeting the F&V stamp policy is an important issue which can significantly affect its cost-
effectiveness. The health/economic model is used to determine to what extent, depending on
the size of the targeted population, such a targeted F&V stamp prevention strategy is better
than a population-based strategy through a general F&V price decrease.

6
We present the general economic model in section 1, and the health model in section 2. In
section 3 we explain how these models are applied to simulate F&V stamp policies and assess
their cost-effectiveness. The main results are presented in section 4. The limits of our results
and their policy implications are discussed in section 5.
1. The economic model
Equilibrium Displacement Models have been developed to analyze market impacts of various
policies such as country of origin labeling (Lusk and Anderson, 2004), R&D expenses
(Wolghenant, 1993), or price floor mechanisms (Bouamra-Mechemache and Réquillart,
2000). In this paper we propose such a model in order to determine to what extent the current
consumption of F&V as the result of the market equilibrium between the F&V supply and
demand functions, could be modified by any change in policy variables, such as consumers’
income or VAT rate.
In the following, we distinguish two segments in the population: the targeted population
which benefits from the food-stamp policy and the non-targeted one. Within each population,
we define Nj (with j=1 for the targeted population and j=2 for the non-targeted population)
groups of consumers according to their consumption of F&V. Without loss of generality, in
population 1, groups are ordered according to an increasing level of consumption. Formally,
the market equilibrium is defined by the following equations:
∑ ∑ , (1)
∑ ∑ , (2)
(3)

7
(4)
(5)
1 (6)
with the total quantity demanded, and the quantities demanded by group j of
consumers in populations 1 and 2 respectively, and the number of groups of consumers
in populations 1 and 2, and the quantities demanded by populations 1 and 2, the
consumer price, and the income of populations 1 and 2, the quantity supplied, the
producer price, and the tax coefficient. In this setting, prices and quantities are the
endogenous variables while the other ones (income, tax coefficient) are exogenous.
Equations (1) and (2) define the demand function for the two populations. It is the sum of
demand functions from each group of consumers. These demands depend on consumer price
and income. Obviously demand depends on other elements (such as information for example)
which are integrated here in the g function which is a characteristic of the group. We assume
that the good consumed is homogenous; then both populations are facing the same consumer
price. Moreover, we consider that the income is population specific but not group specific.
Equation (3) states that the total quantity demanded is the sum of the demand from
populations 1 and 2. Equation (4) states that the supply depends on producer price.2 Equation
(5) states that at equilibrium the quantity demanded is equal to the quantity supplied. Finally
equation (6) defines the relation between the consumer price and the producer price.
2 Obviously supply depends on other elements but they will play no role here as they are considered to be exogenous and not affected by the policy variables. We can thus neglect them.

8
Totally differentiating the set of equations (1) to (6) leads to the following system which
relates the relative change of endogenous variables to the relative change of exogenous
variables:
1 0 0 0 0 ε0 1 0 0 0 εα α 1 1 0 0 0
0 0 0 1 η 00 0 1 1 0 00 0 0 0 1 1
EQEQEQEQEPEP
εYEY εYEY
000
τE 1 τ τ⁄
(7)
denoting EX the ratio dX/X with X representing any variable; and with the own-
price elasticity of supply, ∑ ∑ , the own-price elasticity of
demand of population i ( and , are the share of consumption and the own-price elasticity
of demand of group j in population i, respectively), ∑ ∑ , the
income elasticity of demand of population i ( , is the income elasticity of demand of group j
in population i), and α QQ Q
the share of demand from population 1. The own-price and
income elasticities of demand of population i are a weighted average of the respective
elasticities over the groups in population i. In the standard case, we have
η 0; ε 0; ε 0; εY 0; εY 0.
To analyze the impact of a change in exogenous variables on endogenous variables, the
system of equations (7) is solved given the value of the change in exogenous variables. For
example, a relative increase in income by leads to an exogenous shift of demand (in %)
from population 1 by . Then this exogenous shift in demand generates a change in
consumption taking into account price adjustments that are evaluated by solving the model.

9
1.1 Impact of a change in the tax rate
By decreasing the tax rate the public authority favors F&V consumption. To infer the impact
of this policy, we solved the system (7) with 0, while the other exogenous variables are
kept constant ( 0). We get:
; (8)
(9)
(10)
(11)
with 1 > 0 in the standard case. Then, a decrease in the rate of
taxation ( 0) leads to a higher consumption, to a lower consumer price and to a higher
producer price. It is easy to show that for a given decrease in the rate of taxation, the increase
in consumption is higher when the demand is more elastic or the supply is more elastic.
1.2 Impact of a F&V stamp policy
F&V stamp policy must be analyzed by considering that F&V stamps act through two
channels. Assume first that the value of the F&V stamp (denoted S) given to a consumer j is
lower than her current expenditure in F&V (denoted ). In this case, the F&V stamp is
equivalent to a change in income: this is the first channel. To get the intuition, assume that
and that the consumer does not change her habits. This consumer uses the F&V
stamp to purchase part of her consumption of F&V. By doing so, the consumer saves money
which can be used for any other use. Then, the F&V stamp is equivalent to a change in
income (see Alston et al. (2009) for a discussion). However, if the value of the F&V stamp is
larger to the current expenditure, there is a second channel. The consumer is somewhat forced
to buy a larger quantity of F&V. The corresponding relative increase in consumption is equal

10
to . Thus when the value of the F&V is larger than current expenditure, the
impact comes from the two channels: the ‘income’ channel for a value equal to the current
expenditure and the second one for the remaining part. In term of modeling, first row of (7)
only takes into account the first channel, implicitly assuming ‘small’ value F&V stamps. To
generalize to any value of F&V stamp, we need to take into account the second channel.
To formalize this, let first define such that:
1, … , and 1, … , .3
Depending on the group, the F&V stamp acts through both channels or through only the
income channel. The exogenous change of demand (in %) due to the F&V stamp policy is
given by:
, 1, … ,
, ⁄ 1, … , ,
with representing the (exogenous) percentage variation of demand from consumer j.
Then, summing for all groups of consumers, the first row of (7) is now written as:
EQ ε EPN
ε EPN
,N
N
, S⁄
EQ ε EP ∑N , Min , ∑N Max 0, (12)
3 If , then and if , then 1.

11
The right hand side of (12) is the sum of two terms. The first one corresponds to the
exogenous change in demand due to the income effect (channel 1) and the second one to the
exogenous change in demand due to the ‘forced’ increase in consumption. Both terms are a
weighted sum of the impact on each group. These two terms thus represents the exogenous
change in demand due to the F&V stamps given to population 1. We denote ED1 the sum of
these two terms, writing (12) as EQ ε EP ED which is the new form of the first row
in (7) with ED ∑N , Min , ∑N 0, .
The system (7) is now solved with 0, 0 and 0, we get:
1 13
14
(15)
(16)
Note that (13) to (16) are an approximation of the real effect as by writing (13) to (16) we
neglect the changes of the consumer price in the value of ED1.4 Equation (13) provides the
relative change of consumption in population 1. It is the sum of the relative increase in
consumption at constant price ( ) and the relative decrease in consumption ( due
to the price increase (Equation (16)). The final relative increase of consumption by population
1 is positive as the indirect and negative price effect is lower than the direct and positive
4 The computed price effect is small (lower than 1% in any case) thus justifying this approximation and the way we deal with.

12
effect of F&V stamps. The quantity consumed by population 2 always decreases ( 0)
as population 2 only faces the price increase.
2. The health model
Owing to the well-documented association between F&V consumption and cancer or
cardiovascular diseases, we focused the analysis only on these major causes of death. Table 1
gives the relative risks (RRs) of specific causes of death associated with an increase by one
serving of F&V, i.e. the decrease in the probability of each disease induced by an additional
consumption of 80g/day. These data were taken from recently published meta-analyses for
cancer deaths and for cardiovascular deaths (coronary and stroke) (Dauchet et al., 2005;
Dauchet et al., 2006). To assess the number of deaths by cancer and cardiovascular disease
avoided by changes in F&V intake, we hypothesized a log linear dose effect relationship
using the following formula: (1-RRΔF&V) * number of deaths, where RR is the relative risk for
an additional serving per day and ΔF&V is the change in F&V intake (in servings of 80g per
day). The number of LYS was estimated by multiplying the number of DA by the mean
expected number of years of life lost for each disease. To evaluate the latter, we used recent
mortality and cause specific mortality data for France in 2006 (additional details in
Dallongeville et al., 2010). We estimated the life expectancy at each age using French
mortality data on total deaths. Then an expected number of years of life lost for each cause of
death was calculated according to distributions of causes of death by age (Murray, 1994).
To account for the effect of social disparities on disease rates we used the relative inequality
index (RII) associated with occupational status in France (Saurel-Cubizolles et al., 2009), thus
estimating cancer and cardiovascular death rates in the lowest deciles of income distribution
of the French population. Owing to the lack of specific RII values for each cancer type and for

13
stroke or coronary heart diseases, we used the following values: 4.53 [3.94-5.21] and 2.09
[1.71-2.56] for cancers and 4.50 [3.65-5.54] and 5.84 [3.94-8.65] for cardiovascular diseases,
in men and women respectively. Numbers in brackets represent 95% confidence intervals.
Table 1. Estimated relative risks (RR) of death for one additional portion of F&V, number of deaths and expected number of years of life lost per each cause of death.
Table 1 clearly shows that, in proportion of the population, the number of deaths related to
cancer and cardiovascular diseases among poor people (here the first decile of income) are
much higher than in the population considered as a whole.
3. Empirical simulations
Wholepopulation
First decileof income Men Women
Cancer
Mouth, pharynx and larynx 0.92 [0.81 - 1.06] 5,536 1,013 18.5 20.4
Esophagus 0.92 [0.85 - 1.00] 3,837 696 16.1 15.8
Stomach 0.97 [0.93 - 1.01] 4,763 820 13.7 13.7
Pancreas 0.97 [0.90 - 1.04] 8,263 1,369 14.5 13.9
Lung 0.94 [0.92 - 0.97] 28,347 5,088 16.0 20.0
Colon and rectum 0.99 [0.94 - 1.04] 16,426 2,733 12.4 12.6
Ovary 0.84 [0.62 - 1.13] 3,342 463 17.1
Cardiovascular disease
Coronary heart disease 0.97 [0.94 - 0.99] 38,806 7,497 11.6 8.4
Stroke 0.96 [0.94 - 0.98] 32,652 6,335 10.2 8.8
Disease
RR for one aditional serving of fruits and
vegetables:Mean [CI 95%]
Number of deaths Expected number ofyears of life lost per death

14
Using data from the INCA 2 survey (http://www.afssa.fr/index.htm) which provides (among
others) the F&V consumption as well as income, we distinguished low income consumers
(LIC) who belong to the first decile of income from standard income consumers (SIC). The
first decile of income is approximately composed of people who live under the poverty
threshold. Those two segments of consumers differ by the distribution of F&V consumption
with LIC consuming less than SIC (see Table 2).
Daily Consumption Proportion of consumers (%)
Low Income Consumers (LIC)
Standard Income Consumers (SIC)
< 100 g/day 18 8
< 200 g/day 38 24
< 300 g/day 55 41
< 400 g/day 68 57
< 500 g/day 82 72
< 600 g/day 90 83
Consumption (g/day)
Mean 315 390
Median 262 355
Table 2: Distribution of F&L consumption in the two sub-populations
We evaluate the F&V stamp policy for different rates of targeting, the targeted population
(that is population 1 in the theoretical model) being a part of LIC if the rate of targeting is
lower than 10%, or all the LIC if the rate of targeting is 10%. This means that in the empirical
model, population 2 is the combination of non-targeted LIC (if any) and SIC (who are always
non-targeted). Then, targeted consumers are characterized by the distribution of consumption

15
of LIC while non targeted consumers have a distribution of consumption which is the
aggregation of distribution of consumption from non targeted LIC and from SIC.
We use average value of income for each population. That is LIC has an average income of
7472 €/year (INSEE 20065) and SIC 21885 €/year. When targeting only a part of LIC, we also
use the average income of the targeted population according to INSEE data.
The extent of the consumers’ or producers’ responses to any policy depends on the value of
the economic parameters of the model especially the price, income and supply elasticities.
Price and income elasticities of demand were mainly defined on the basis of the French
studies mentioned in Table 3. It appears that the price elasticity of demand of the whole
population for different categories of F&V ranges between -0.24 and -1.15. Price elasticity of
demand from low income population ranges between a low price elasticity of -0.06 to a high
elasticity of -1.27. These results do not provide strong evidence of a significant difference of
behavior between LIC and SIC. Then we calculated the average and standard deviation from
these studies (-0.85 and 0.3 respectively) and used these values to characterized the price
elasticity of demand of both populations.
With respect to supply elasticity, we did not find any study referring specifically to France.
However, contrary to the F&V demand which is likely to be country-specific, the producers’
flexibility of supply is more similar from one country to another. For this reason, we
considered that it was admissible to use values obtained in non French studies. For instance,
Alston et al. (2009) in a study on food stamps in the US, use a supply elasticity of 1.0 arguing
that it reflects medium run response. Jetter et al. (2004) analyze the impact of ‘5 a day’
campaign and consider the following values for the supply price elasticity of vegetables, fruits
5 http://www.insee.fr/fr/themes/tableau.asp?reg_id=0&ref_id=NATnon04249.

16
and perennial crops: 0.5, 1.0 and 0.75 (respectively) for low values and 1.0, 1.5 and 1.25
(respectively) for high values. In this study, we thus chose a value of 1 for the price elasticity
of supply with a standard deviation of 0.25.
(* elasticities for non poor people rather than for the whole population)
Table 3: Price and income elasticities in France
The parameters of the model (3 economic and 13 health parameters) were supposed to follow
independent lognormal distributions. Monte-Carlo simulations were performed by drawing 10
million times a 16-uplet of parameters. For each uplet, we computed the changes induced by
each policy scenario for the following variables: F&V consumption for each category of
Price elasticity Price elasticity Income Elasticity
Whole
population Poor
households Poor
Households
Nichelei (2003)
Fruits -0,7
Vegetables -0,92
Andrieu andii Caillavet (2006)
Fruits 0,89
Vegetables 0,3
Andrieu et al.iii (2006)
Fresh Fruits -1,06 -0,89 0,22
Fresh Vegetables
-1,06 -0,82 0,22
Processed Fruits
-0,79 -1,15 0,37
Processed Vegetables
-1,02 -1,03 0,27
Allais et al.iv (2008)
Fresh Fruits -0,24* -0,06
Fresh Vegetables
-0,34* -0,2
Processed Fruits
-0,58* -0,61

17
consumers, number of statistical DA, number of statistical LYS, cost per statistical DA, cost
per statistical LYS. We then calculate the median and the 2.5 and 97.5 centiles for each
variable. Finally we determine whether the policies reduce or not the health disparities within
the population computing an odds-ratio defined as:
% LIC / % LIC % SIC / % SIC
To facilitate the comparison between price policy and F&V stamp policy, we ran simulations
for a given ex ante budget allocated to the policy. We choose 300 M€. Targeting 5% of the
population with this budget allows for a monthly €10 stamp. This amount is the same than the
stamp amount given to poor individuals in the experiment implemented in France (Bihan,
2008). The VAT reduction allowed with such a budget is 3.06%, which is close to the
maximum potential reduction of VAT (current VAT is 5.5% and the lowest rate is 2.1%, that
is 3.4% reduction).
4. Results
Impact of the price policy
The decrease in VAT generates a decrease in consumer price by 1.2% which in turn leads to
an average increase in consumption of 3.7 g/day. The increase in consumption by SIC
consumers is slightly larger than the one of LIC consumers as they have a higher initial
consumption. The median number of DA and LYS for the whole population is 279 and 3851
respectively. The mean cost per LYS is 78 k€ [45 – 146]. 6
6 2.5 and 97.5 centiles are given in brackets.

18
Impact of the F&V stamp policy
For a given amount of financing, the impact of F&V stamp policy decreases with the rate of
targeting.7 Thus, for a 300 M€ budget, the median increase in consumption for the whole
population is 0.4 g/day when targeting is 10%, 0.8 g/day when it is 5%, 1.9 g/day when it is
2% (Table 4). Targeted population increases significantly her consumption while non-targeted
population (whatever they are LIC or SIC) decreases her consumption due to the price effect.
For example, when targeting 2% of the population the median increase in consumption for
targeted consumers is 168.6 g/day while the median consumption for non-targeted LIC and
SIC consumers decreases by 1.3 and 1.6 g/day, respectively. In this example, the increase in
demand from targeted consumers generates a slight increase in the consumer price (0.5%)
leading to a decrease in the consumption of non-targeted consumers. The change in
consumption of targeted consumers crucially depends on the rate of targeting. For example, it
is 6.2g/day when targeting 10% of the population, 27.0 g/day when targeting 5% and
168.6g/day when targeting 2% of the population respectively.
7 Note that a higher rate of targeting means that the targeted population is larger.

19
Table 4. Policy comparison: simulation Results (Total budget=300 M€) for LIC and SIC (Low and Standard Income Consumers)
Median 2.5%ile 97.5%ile Median 2.5%ile 97.5%ile Median 2.5%ile 97.5%ile Median 2.5%ile 97.5%ile
Value of the F&V stamp (€/year for each targeted person) 63 126 314
Consumer price variation (%) ‐ 1.23 ‐ 1.65 ‐ 0.78 0.09 0.06 0.15 0.20 0.13 0.31 0.49 0.33 0.74
Individual consumption variation (g/day)
Targeted LIC 3.1 2.0 4.7 6.2 5.6 8.4 27.0 25.6 32.4 168.6 164.8 182.8 Non‐targted LIC 3.1 2.0 4.7 ‐ 0.5 ‐ 0.8 ‐ 0.3 ‐ 1.3 ‐ 1.9 ‐ 0.8 Non‐targeted SIC 3.8 2.4 5.7 ‐ 0.3 ‐ 0.5 ‐ 0.2 ‐ 0.6 ‐ 1.0 ‐ 0.4 ‐ 1.6 ‐ 2.3 ‐ 0.9 Whole population 3.7 2.4 5.6 0.4 0.2 0.5 0.8 0.5 1.1 1.9 1.2 2.5
Number of death avoided (DA)
Targeted LIC 9 5 16 89 57 133 202 133 281 486 321 650 Non‐targted LIC 34 19 57 ‐ 3 ‐ 6 ‐ 2 ‐ 14 ‐ 23 ‐ 7 Non‐targeted SIC 235 128 401 ‐ 19 ‐ 33 ‐ 9 ‐ 40 ‐ 68 ‐ 20 ‐ 98 ‐ 164 ‐ 50 Whole population 279 152 474 70 44 106 157 101 225 370 240 512
Cancer 165 75 301 38 19 62 84 44 130 190 97 285 Cardio‐Vascular 112 52 204 32 16 53 73 37 116 180 93 276
Number of of life‐years saved (LYS)
Targeted LIC 126 69 214 1198 759 1796 2718 1752 3794 6470 4216 8636 Non‐targted LIC 456 249 777 ‐ 47 ‐ 80 ‐ 24 ‐ 190 ‐ 317 ‐ 98 Non‐targeted SIC 3268 1741 5619 ‐ 260 ‐ 463 ‐ 129 ‐ 555 ‐ 952 ‐ 278 ‐ 1359 ‐ 2296 ‐ 685 Whole population 3851 2062 6607 930 581 1426 2093 1332 3003 4855 3115 6708
Cancer 2738 1269 4968 620 326 1011 1381 736 2127 3109 1639 4610 Cardio‐Vascular 1099 501 2006 310 154 515 711 356 1124 1748 888 2677
Mean cost per DA (M€) 1.08 0.63 1.97 4.31 2.82 6.81 1.91 1.33 2.96 0.81 0.59 1.25
Mean cost per LYS (k€) 78 45 146 323 210 517 143 100 225 62 45 96
0.001 0.000 0.002 ‐ 0.007 ‐ 0.011 ‐ 0.005 ‐ 0.016 ‐ 0.023 ‐ 0.011 ‐ 0.039 ‐ 0.052 ‐ 0.026 Health disparity index:
odds‐ratio (LIC vs. SIC) variation
Targeted LIC = 2%Policy comparison
VAT reduction by 3.06 points Targeted LIC = 10% Targeted LIC = 5%

20
Figure 1 provides the initial and final distribution of F&V consumption of LIC distinguishing
between targeted consumers and non targeted consumers.8 Among the targeted population, the
increase in consumption mainly concerns those who have a ‘small’ initial level of
consumption, that is consumers for which the value of the food stamp was higher than their
initial consumption of F&V. All those consumers, when implementing the policy, consume
(almost) the same quantity which is the value of the stamp divided by the price of F&V.9
Figure 1. Initial and Final F&V consumption of LIC (Low Income Consumers) when F&V stamps are provided to 2% of the population (Total budget=300 M€)
8 Results for non-targeted SIC are similar to the one presented for non-targeted LIC. That is basically a slight decrease in consumption.
9 It is slightly increasing with the initial consumption, as a part of the F&V stamp equal to the initial expenditure of each consumer acts as an increase in income which is partly used for purchasing F&V. As initial expenditure depends on consumer, we get a slightly increasing curve.
0 5 10 15 20 25 30 35 40 45 50 55 60 65 70 75 80 85 90 951000
50100150200250300350400450500550600650700750800850900950
1000
LIC population classes according to their initial F&V consumption (%)
F&V
con
sum
ptio
n le
vel (
g/da
y/pe
rson
)
LIC's initial consumptionTargeted LIC's new consumptionNon-targeted LIC's new consumption

21
Consumers with an initial level of expenditure larger than the value of the F&V stamp slightly
increase their consumption. Non targeted consumers decrease only slightly their consumption
as they face a price increase. The larger the initial consumption is, the larger the magnitude of
this effect.
In line with the change in consumption, the numbers of DA and LYS increase when the rate
of targeting decreases (Table 4). When targeting 10% of the population, the median numbers
of DA and LYS are respectively 70 [44-106] and 930 [581-1426], while targeting 2% of the
population leads to median numbers of DA and LYS which are respectively 370 [240-512]
and 4855 [3115-6708]. As a consequence the health disparities between SIC and LIC
populations decrease when the size of the targeted population decreases: the health benefits
obtained by the targeted LIC population are greater than the price related deleterious health
effects on the non targeted LIC and SIC population (see the odds-ratio variation in Table 4).
Similarly, the cost per statistical LYS decreases when the rate of targeting decreases. It is
323k€ [210 - 517] when targeting 10% of the population, 143 k€ [100 - 225] when targeting
5%, and 62 k€ [45 - 96] when targeting 2%.
Thus, targeting a lower fringe of the population decreases the cost per LYS (or DA) of the
policy. However, there is a limit. When targeting on fewer people (lower than 1% of the
population in our example), the cost per LYS strongly increases (Figure 2a). This is because
the number of LYS in the targeted population is now small due to the size of the population.
The negative impact in the non targeted population might be larger than the positive impact in
the targeted population. With a 300 M€ budget devoted to the policy, the optimal targeting is
about 1% of the population that is roughly 500 000 adults in France.

22
Figure 2a. Cost by LYS according to the size of targeted population (Total budget=300 M€)
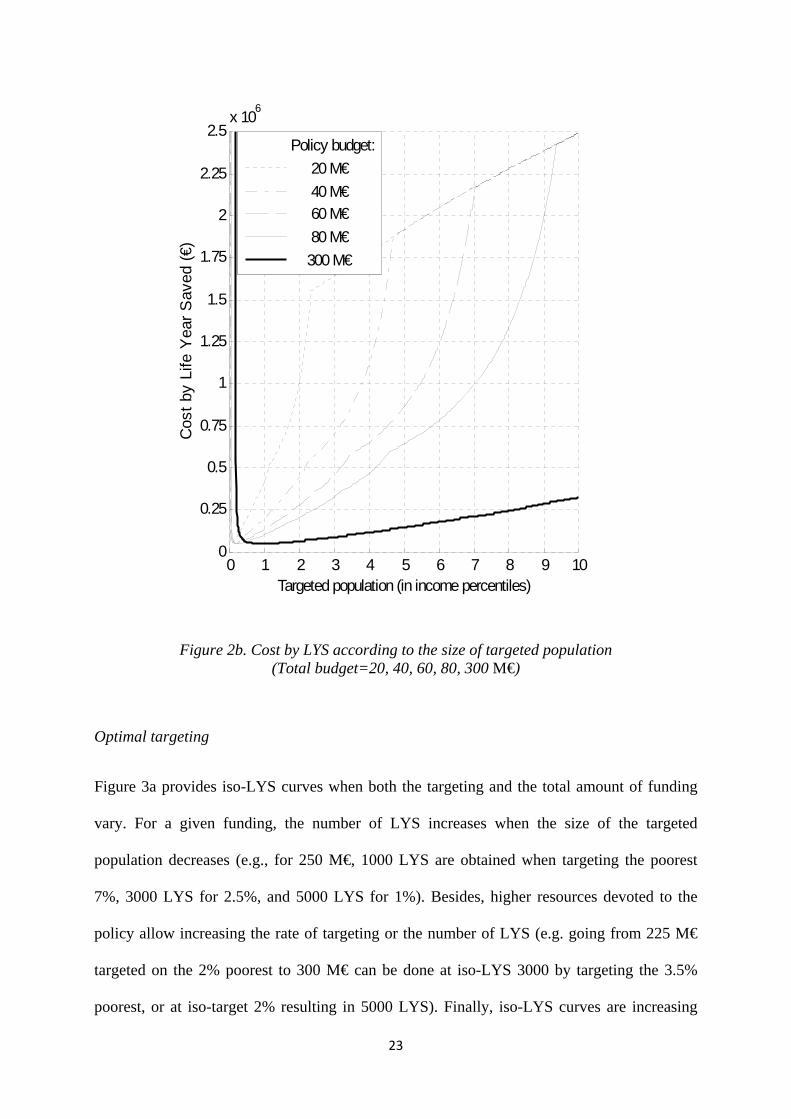
When targeting is large (Figure 2b), the cost per LYS is high but varies at a lower rate with
targeting. In this zone, the value of the F&V stamp is lower than the lowest value (among
consumers) of the initial F&V expenditure. In other words, the F&V stamp acts only through
a change in income (the second channel identified in the model section) and not through a
direct increase in consumption (the first channel identified in the model section).
0 1 2 3 4 5 6 7 8 9 100
0.5
1
1.5
2
2.5
3
3.5
4
4.5
5
5.5x 10⁵
Targeted population (in income percentiles)
Cos
t by
Life
Yea
r Sav
ed (€
)
Line width meaning:median2.5 & 97.5 percentiles
23
Figure 2b. Cost by LYS according to the size of targeted population (Total budget=20, 40, 60, 80, 300 M€)
Optimal targeting
Figure 3a provides iso-LYS curves when both the targeting and the total amount of funding
vary. For a given funding, the number of LYS increases when the size of the targeted
population decreases (e.g., for 250 M€, 1000 LYS are obtained when targeting the poorest
7%, 3000 LYS for 2.5%, and 5000 LYS for 1%). Besides, higher resources devoted to the
policy allow increasing the rate of targeting or the number of LYS (e.g. going from 225 M€
targeted on the 2% poorest to 300 M€ can be done at iso-LYS 3000 by targeting the 3.5%
poorest, or at iso-target 2% resulting in 5000 LYS). Finally, iso-LYS curves are increasing
0 1 2 3 4 5 6 7 8 9 100
0.25
0.5
0.75
1
1.25
1.5
1.75
2
2.25
2.5x 10⁶
Targeted population (in income percentiles)
Cos
t by
Life
Yea
r Sav
ed (€
)
Policy budget: 20 M€ 40 M€ 60 M€ 80 M€ 300 M€

24
with the size of the targeted population. This means that the most cost effective policy for a
given number of LYS is reached at the left end of each curve (e.g. around 240M€ for the 0.8%
poorest to obtain 5000 LYS). The most cost-effective budget-target policies are also
represented on Figure 3a (see dotted lines).
Figure 3a. Iso-LYS (Life Years Saved) curves and lowest costs by LYS curves, according to the size of the targeted population and the total budget allocated to the F&V stamps
Similarly, Figure 3b presents iso-cost by LYS curves. It shows that, for instance, the cost-
effectiveness level of 80 k€/LYS can be reached by targeting 1% of the population with
0 1 2 3 4 5 6 7 8 9 100
50
100
150
200
250
300
350
400
450
500
550
600
Targeted population (in income percentiles)
Allo
cate
d bu
dget
for t
he P
olic
y (M
€)
1000 LYS at median1000 LYS at 2.5 or 97.5 centiles3000 LYS at median3000 LYS at 2.5 or 97.5 centiles5000 LYS at median5000 LYS at 2.5 or 97.5 centilesLowest costs/LYS at medianLowest costs/LYS at 2.5 or 97.5 centiles

25
100 M€ and 4% of the population with 450 M€. Contrarily to Figure 3a, in Figure 3b, all left
ends are at (0,0): nobody targeted (and thus no budget allocated). Hence, all costs by LYS are
possible either for a given target or for a given budget, as long as they are chosen above a
minimum threshold (around 50 k€ for the median, 40 k€ for the 2.5 centile and 75 k€ for the
97.5 centile, as shown on Figure 2a).
Figure 3b. Iso-cost by LYS (Life Year Saved) curves according to the size of the targeted population and the total budget allocated to the F&V stamps
0 1 2 3 4 5 6 7 8 9 100
50
100
150
200
250
300
350
400
450
500
550
600
Targeted population (in income percentiles)
Allo
cate
d bu
dget
for t
he P
olic
y (M
€)
80 k€ by LYS at median 80 k€ by LYS at 2.5 or 97.5 centiles200 k€ by LYS at median200 k€ by LYS at 2.5 or 97.5 centiles320 k€ by LYS at median320 k€ by LYS at 2.5 or 97.5 centiles

26
5. Discussion
The analysis presented in this paper, based on collaboration between economists and
epidemiologists combined two models: an economic model which predicts how F&V
consumption is affected by a change in policy and a health model which evaluates the impact
of a change in F&V consumption in terms of DA and LYS. Finally we computed the costs per
DA and LYS as the ratios between the taxpayer cost of the policy and the numbers of DA and
LYS.
The interest of this approach is to propose ex ante analysis of the cost-effectiveness of policies
whereas the large majority of works analyzing cost-effectiveness of health policies are based
on ex post evaluation of policies or on ex post evaluation of experiments. Such an approach
has been used previously for analyzing the possible effects of consumption subsidies for
healthier foods (Cash et al., 2005) and for assessing the impacts of alcohol pricing policies
and modelling the effect of consumption changes on mortality and disease prevalence
(Purshouse et al., 2010).
The main findings of the present study are: (1) at the aggregate level, a F&V stamp policy has
a modest impact on consumption and as a result on health gains; (2) when well designed, the
F&V stamp policy may significantly increase the F&V consumption of low-income
households; (3) for a given budget allocated to the policy, the benefit of the policy increases
and the cost per DA or LYS decreases when the number of beneficiaries decreases; (4) to
maximize the cost-effectiveness of the F&V stamp policy, the targeted population must be
rather small; (5) when well designed, the F&V stamp policy (targeted policy) is more cost-

27
effective than a VAT decrease10 (non targeted policy); (6) a stamp policy might generate an
increase in the price of F&V thus reducing the consumption and the health benefits within the
non targeted population.
Despite the large shifts in F&V intake in the targeted population, the total life gains appear to
be quite modest. Indeed the expected benefits of F&V consumption, estimated from most
recent meta-analyses, are moderate compared to earlier estimations based on case-control
studies. Moreover although the burden of cancer and cardiovascular diseases represents more
than 2/3 of total deaths in France, the favorable association with F&V consumption is
documented for only about half of their etiologies (1/3 of total deaths). This means that the
overall impact of increasing F&V intake on total mortality is calculated on this third of total
deaths.
As mentioned in the paper, the F&V stamp acts through two channels. The most effective
channel requires providing to the targeted consumers a stamp whose value is larger than their
initial F&V expenditure. For a given total amount allocated to the F&V stamp program, this
happens only when a ‘small’ number of consumers are selected. The other channel is less
effective as the F&V stamp is equivalent to an increase in income and can therefore be used
for any purpose. Thus the cost effectiveness of the policy increases when targeting a smaller
share of the LIC population.
In a recent paper Alston et al. (2008) put forward the fact that the induced changes in prices
related to food stamps limited to healthy food consumption could result in decreases in
consumption of healthy foods by non-targeted households. In our analysis, we identify such a
non intentional effect: the policy increases the consumption of a small share of the population
10 For a 300 M€ budget, the F&V stamp policy is more cost-effective than the VAT reduction policy if the targeted population is smaller than around 3% of the population (and the individual value of the stamp greater than 230 €/person/year).

28
while it slightly decreases the consumption of F&V of a large share of the population.
According to our simulations, this non intentional effect reduces by 20 to 25% (depending on
the targeting rate) the number of DA induced by the policy. It is important to understand that
this non intentional effect is due to the increase in the price of F&V. This increase in price
depends on the additional demand generated by the policy but also on the supply response. In
the short term, elasticities of supply are rather small, thus amplifying this issue. In the long
run, elasticities of supply tend to be high thus limiting the price increase. For instance,
simulations made with supply elasticity equal to 3, show that the deleterious impact of the
policy on non targeted population is smaller: in this case, when targeting 2% of the
population, the non intentional effect only reduces by around 10% the number of DA induced
by the policy.
Clearly, our results must be considered in relation with some limitations that open up the
scope for further research. On the health model side, we limited our analysis to the assessment
of DA and LYS. It is likely that considering only these criteria led us to underestimate the
health benefits related to F&V consumption. It would be useful to widen the analysis by
taking into account the possible effects of the policies on the health care costs and the
morbidity levels. By doing so, it would possible to evaluate the variations of Quality Adjusted
of Life Year Saved (QALYS) induced by the studied policies.
On the economic model side, we focused on a product category rather than considering a
system of demand for food. Thus we ignored the substitutions that might occur with other
foods which might have health impacts. On the other way, considering the F&V sector as a
single product category prevented us from taking into account the heterogeneity of price
sensitivity according to the type of products within this sector. Elsewhere we considered that

29
whatever their income consumers buy the same good at the same mean price and we ignored
the possibility of quality differences. It is not necessarily the case and it is likely that the mean
price of purchased F&V depends on the consumers’ category. Moreover we assumed that an
income increase led to an increase in the quantity of F&V bought by the households rather
than to an increase in their quality (possibly with no increase in the quantity). Technically it is
possible to deal with these issues. However, it would be necessary to get more information
about the heterogeneity of price sensitivity of consumers according to the type of products
within the F&V category and the quality choice by consumers when their incomes change.
Another limit is related to the modeling of stamps. We have assumed that consumers do not
resell the stamps and do ‘eat’ the additional quantities of F&V they buy, that they consider
stamps as an increase in income (as long as the value of the stamp is not too high) and that the
stamps do not convey any information. These are three strong assumptions.
Indeed, due to the first assumption, we over-estimate the impact of stamps. Thus reselling
stamps (or selling the products one buys with the stamps) is equivalent to an increase of the
size of the targeted population. We have seen that a larger targeting leads to a lower cost-
effectiveness. The reasons for which consumers might want to sell the stamps or the products
are numerous. Among others, it is well known that modifying his/her diet is difficult and that
it is not only budget constraints that fully explains a low consumption in F&V. Contrary to
the second assumption, it is possible that some consumers consider that they have to buy
some F&V with the stamps in addition to what they already buy. Social norms for instance
could explain such practices and lead to larger effects than those assessed in our analysis.
Finally, the third assumption led us to under-estimate the impact of food stamps by ignoring
the fact that the stamp can convey some information and contribute to nutritional education
that might change the consumers’ demand.

30
Despite these limitations, the approach proposed in this paper contributes to open an
interesting field of research and gives some results that are important to consider before
implementing a public health policy related to food consumption. Indeed, we show that, in
this case, the trade-off between targeted versus population-based policies is influenced by
factors which determine the market equilibriums (price, income and supply, size of the
targeted population…). Contrary to previous research in public health, we show that
population-based strategies are not necessarily more cost-effective than targeted strategies
when the impacts of the policies depend on such economic variables.

31
References
Ahern J., Jones M. R., Bakshis E, Galea S., 2008. Revisiting Rose: Comparing the Benefits and Costs of
Population-Wide and Targeted Interventions, The Milbank Quarterly, 86(4): 581–600.
Allais O., Bertail P., Nichèle V. 2010 . The Effects of a Fat Tax on French Households‘ Purchases, American
Journal of Agricultural Economics, 92(1) : 228-245.
Alston J.A., Conner C., Mullally a, Sumner D., Likely effects on obesity from proposed changes to the
US food stamp program, Food Policy 34 (2009) 176–184.
Andrieu, E., and Caillavet, F. (2006). Inégalités nutritionnelles au sein des ménages : la pauvreté joue-
t-elle un rôle ? Cahiers de Nutrition et de Diététique 41(2), 75-85.
Andrieu, E., Caillavet, F., Lhuissier, A., Momic, M., and Regnier-Chauvel, F. (2006). L'alimentation
comme dimension spécifique de la pauvreté. Approches croisées de la consommation alimentaire des
populations défavorisées. In "Les travaux de l'Observatoire national de la pauvreté et de l'exclusion
sociale 2005-2006" (s. Observatoire national de la pauvreté et de l'exclusion, Ed.), pp. 247-278.
Bihan H., 2008. Providing an economic supplement for fresh F&V purchase, Fruit and Vegetable
Summit Proceedings, EGEA – IFAVA / WHO, Paris.
Bihan H., Casteltbon K., Mejean C., Peneau S., Pelabon S., Jellouli F., Le Clesiau H., S. Hercberg,
2010. Sociodemographic Factors and Attitudes toward Food Affordability and Health Are Associated
with Fruit and Vegetable Consumption in a Low-Income French Population, Journal of Nutrition,
140(4): 823-830.
Blisard, N., Stewart, H., Jolliffe, D., 2004. Low-income households’ expenditures on fruits and
vegetables. Agricultural Economic Report No. 833, US Department of Agriculture, Economic
Research Service.
Bouamra-Mechemache Z. and V. Réquillart. 2000. Analysis of EU Dairy Policy Reform. European
Review of Agricultural Economics 27(4): 409-430
Cassady D, Jetter KM, Culp J, 2007. Is Price a Barrier to Eating More Fruits andVegetables for Low-
Income Families? Journal of the American Dietetic Association, November 2007, 1909-1915.

32
Cash SB, Sunding DL, Zilberman D. Fat Taxes and Thin Subsidies: Prices, diet, and health outcomes.
Food Economics. 2005; 2(3-4); 167-174.
Chen, Z., Yen, S., Eastwood, D., 2005. Effects of food stamp participation on body weight and
obesity. American Journal of Agricultural Economics 87 (5), 1167– 1173.
Dallongeville J., L. Dauchet, O. de Mouzon, V. Réquillart and L.G. Soler. Increasing fruit and
Vegetable Consumption : A cost-Benefit Analysis of Public Policies. European Journal of Public
Health, (2010), doi:10.1093/eurpub/ckq013
Dauchet L, Amouyel P, Dallongeville J. Fruit and vegetable consumption and risk of stroke: a meta-
analysis of cohort studies. Neurology. 2005 ; 65(8):1193-1197.
Dauchet L, Amouyel P, Hercberg S, Dallongeville J. Fruit and Vegetable Consumption and Risk of
Coronary Heart Desease: A Meta-Analysis of Cohort Studies. Journal of Nutrition. 2006; 136; 2588-
2593.
Dibsdall A., Lambert N., Bobbin R.F., Frewer L.J., 2007. Low-income consumers’ attitudes and
behaviour towards access, availability and motivation to eat fruit and vegetables, Public Health
Nutrition: 6(2), 159–168
Drewnowski A, Darmon N, Briend A. Replacing fats and sweets with vegetables and fruits—A
question of cost. American Journal of Public Health. 2004;94:1555-1559.
Drewnowski A, Specter SE, 2004. Poverty and obesity: the role of energy density and energy costs.
American Journal of Clinical Nutrition, 79, 6–16.
Drewnowski A, Darmon N, 2005. Food choices and diet costs: an economic analysis. Journal of
Nutrition 135, 900–904.
French SA, Story M, Jeffery RW. Environmental influences on eating and physical activity. Annual
Review of Public Health. 2001;22:309-335.
Fox, M.K., Cole, N., 2004. Nutrition and health characteristics of low-income populations. Food
Stamp Program Participants and Non-Participants, vol. I. US Department of Agriculture, Economic
Research Service, December 2004.

33
Fox, M.K., Hamilton, W., Lin, B., 2004. Effects of food assistance and nutrition programs on nutrition
and health. Executive summary of the literature review, vol. 4. Food Assistance and Nutrition
Research Report No. 19-4, US Department of Agriculture.
Frazao, E., Andrews, M., Smallwood, D., Prell, M., 2007. Food spending patterns of low-income
households: will increasing purchasing power result in healthier food choices? Economic Information
Bulletin, Number 29-4, September 2007.
Frongillo EA, 2003. Understanding obesity and program participation in the context of poverty and
food insecurity. Journal of Nutrition 133, 2117–2118.
Gibson, D., 2003. Food stamp program participation is positively related to obesity in low income
women. Journal of Nutrition 133 (7), 2225–2231.
Gibson, D., 2006. Long-term food stamp program participation is positively related to simultaneous
overweight in young daughters and obesity in mothers. Journal of Nutrition 136 (4), 1081–1085.
Guthrie, J.F., Lin, B.H., Ver Ploeg, M., Frazao, E., 2007. Can food stamps do more to improve food
choices? Economic Information Bulletin Number 29-1, US Department of Agriculture, Economic
Research Service, September 2007.
Herman D.R., Harrison G., Afifi A., Jenks E., 2008. Effect of a Targeted Subsidy on Intake of Fruits
and Vegetables Among Low-Income Women in the Special Supplemental Nutrition Program for
Women, Infants, and Children, American Journal of Public Health. 2008;98:98–105.
Jetter K.M., Chalfant J.A., Sumner D.A., 2004. An Analysis of the Costs and Benefits to Consumers
and Growers from the Consumption of Recommended Amounts and Types of Fruits and Vegetables for
Cancer Prevention, Final report prepared for the California Department of Health Services Cancer
Prevention and Nutrition Section, University of California, Agricultural Issues Center, April 2004.
Jones S.J., Frongillo E.A., 2006. The Modifying Effects of Food Stamp Program Participation on the
Relation between Food Insecurity and Weight Change in Women, J. Nutr. 136:1091–1094.
Landers P.S., 2007. The Food Stamp Program: History, Nutrition Education, and Impact, J Am Diet
Assoc., 107:1945-1951.
Le Blanc, M., Lin, B.H., Smallwood, D., 2007. Food assistance. How strong is the safety net? Amber
Waves 5, 40–45 (special feature).

34
Lin, B., Guthrie, J., 2007. How do low-income households respond to food prices? Economic
Information Bulletin 29-5, September 2007.
Lock K, Pomerlau J, Causer L, Altmann DR, McKee M. The global burden of disease attributable to
low consumption of fruit and vegetables: implications for the global strategy on diet. Bull World
Health Organ. 2005;83:100–108.
Lusk J. and J.D. Anderson, 2004. Effects of country-of-origin labeling on meat producers and
consumers. Journal of Agriculture and Resource Economics, 29(2): 185-205.
Meyerhoefer, Chad D., Pylypchuk, Y., 2008. Does participation in the food stamp program increase
the prevalence of obesity and health care spending? American Journal of Agricultural Economics 90
(2), 287-305.
Murray CJ. Quantifying the burden of disease: the technical basis for disability-adjusted life years.
Bull World Health Organ. 1994;72(3):429-45.
Nichèle V., 2003. Health Information and Food demand in France, in Health, Nutrition and Food demand, Ed.
W.S Chen and Rickertsen, CABI Publishing, pp 131-151.
Olson C.M., 1999. Nutrition and Health Outcomes Associated with Food Insecurity and Hunger, J.
Nutr. 129: 521S–524S.
Pan, S., Jensen, H., 2008. Does the food stamp program affect food security status and the
composition of food expenditures? Journal of Agricultural and Resource Economics, 40 (1), 21–35.
Purshouse R.C., Meier P.S., Brennan A., Taylor K.B., Rafi R., 2010. Estimated effect of alcohol
pricing policies on health and health economic outcomes in England: an epidemiological model,
Lancet, 375: 1355–64.
Rose G., 1992. The Strategy of Preventive Medicine. Oxford: Oxford University Press.
Rose, G., 2001. Sick Individuals and Sick Populations. International Journal of Epidemiology,
30:427–32.
Saurel-Cubizolles MJ, Chastang JF, Menvielle G, Leclerc A, Luce D. 2009. Social inequalities in
mortality by cause among men and women in France. Journal of Epidemiology and Community
Health, 63: 197-202.
35
Shenkin JD, Jacobson MF., 2010. Using the Food Stamp Program and Other Methods to Promote
Healthy Diets for Low-Income Consumers. American Journal of Public Health, 100(9), 1562-1564.
Ver Ploeg, M., Mancino, L., Lin, B., 2007. Food and nutrition assistance programs and obesity: 1976–
2002. Economic Research Report No. 48, US Department of Agriculture, Economic Research Service,
September 2007.
Webb A.L., Schiff A., Currivan D, Villamor E, 2008. Food Stamp Program participation but not food
insecurity is associated with higher adult BMI in Massachusetts residents living in low-income
neighborhoods, Public Health Nutrition: 11(12), 1248–1255
Wilde P, McNamara P, Ranney C. 1999. The effect of income and food programs on dietary quality:
A seemingly unrelated regression analysis with error components. American Journal of Agricultural
Economics, 81:959-971.
Wilde PE, McNamara PE & Ranney CK, 2000. The Effect on Dietary Quality of Participation in the
Food Stamp and WIC Programs. http://www.ers.usda.gov/publications/fanrr9.pdf/ (accessed July
2010).
Wilde, P., Nord, M., 2005. The effect of food stamps on food security: a panel data approach. Review
of Agricultural Economics 27 (3), 425–432
Wohlgenant M.K., 1993. Distribution of gains from research and promotion in multi-stage production
systems: the case of the US beef and Pork industries. American Journal of Agricultural Economics,
75(3): 642-651.
Zulman D.M., Sandeep V., Omenn G.S., Hayward R.A., 2008. The Relative Merits of Population-
Based and Targeted Prevention Strategies, Milbank Quarterly, 86(4): 557–580.