Embed Size (px)
Citation preview
Journal of Financial Economics 72 (2004) 425–456
Are dividends disappearing? Dividendconcentration and the consolidation of earnings$
Harry DeAngeloa,*, Linda DeAngeloa, Douglas J. Skinnerb
a Marshall School of Business, University of Southern California, Los Angeles, CA 90089, USAb University of Michigan Business School, Ann Arbor, MI 48109, USA
Received 4 September 2002; accepted 12 March 2003
Abstract
Aggregate real dividends paid by industrial firms increased over the past two decades even
though, as Fama and French (J. Financial Econ. 60, 3) (2001a) document, the number of
dividend payers decreased by over 50%. The reason is that (i) the reduction in payers occurs
almost entirely among firms that paid very small dividends, and (ii) increased real dividends
from the top payers swamp the modest dividend reduction from the loss of many small payers.
These trends reflect high and increasing concentration in the supply of dividends which, in
turn, reflects high and increasing earnings concentration. For example, the 25 firms that paid
the largest dividends in 2000 account for a majority of the aggregate dividends and earnings of
industrial firms. Industrial firms exhibit a two-tier structure in which a small number of firms
with very high earnings collectively generates the majority of earnings and dominates the
dividend supply, while the vast majority of firms has at best a modest collective impact on
aggregate earnings and dividends.
r 2003 Elsevier B.V. All rights reserved.
JEL Classification: G35; G32; M41
Keywords: Dividends; Payout policy; Earnings concentration; Losses
ARTICLE IN PRESS
$We would like to acknowledge the helpful comments of Jim Brickley, Ken French, Tom Gilligan, John
Matsusaka, Dave Mayers, Kevin J. Murphy, Micah Officer, Oguz Ozbas, Ed Rice, Jay Ritter, Ren!e Stulz,
Randy Westerfield, Fred Weston, and especially the referee, Eugene Fama. We are grateful for the
research assistance of Darcy Baker, Ido Dotan, Atul Gupta, Terry Lichvar, April Xu, and especially Mei
Feng and Aaron Lerner, and for the research support of the University of Southern California (Charles E.
Cook/Community Bank and Kenneth King Stonier Chairs) and the University of Michigan Business
School (KPMG Professorship).
*Corresponding author. Tel.: +1-213-740-6541; fax: +1-213-740-6650.
E-mail address: [email protected] (H. DeAngelo).
0304-405X/$ - see front matter r 2003 Elsevier B.V. All rights reserved.
doi:10.1016/S0304-405X(03)00186-7
1. Introduction
In their intriguing study, ‘‘Disappearing Dividends: Changing Firm Characteristicsor Lower Propensity to Pay?,’’ Fama and French (2001a) document a large declineover 1978–1998 in the number and percent of nonfinancial and nonutility firms(hereafter, industrials) that pay dividends. Their analysis indicates that this dramaticchange in dividend practices is due both to changes in the population of firms thatare now publicly held (with many more public firms now exhibiting thecharacteristics of firms that historically have not paid dividends), and to a reducedpropensity to pay dividends by firms whose characteristics historically would haveled them to distribute cash to stockholders. Although Fama and French carefullystate that their findings show a reduction in the number and percent of dividend-paying firms, their evidence is commonly interpreted as indicating that dividends
themselves are disappearing.1 The latter view seems more than plausible, given thestriking fact that the number of dividend-paying industrials has declined by morethan 1,000 firms (over 50%) over the last 20–25 years.
Although our evidence confirms a radical transformation in corporate dividendpractices over the last two decades, it does not indicate that dividends aredisappearing. Rather, dividends paid by industrial firms actually increased over1978–2000, both in nominal and in real terms (by 224.6% and 22.7% respectively forour sample). Why did aggregate real dividends increase despite a 50%-plus decline inthe number of payers? The answer is twofold: (i) the large reduction in payersoccurred almost entirely among firms that paid very small dividends, with the loss ofthese firms’ dividends having at best a minor impact on the aggregate supply, and (ii)dividends simultaneously increased substantially among the largest payers, reflectinga marked increase in their real earnings. In short, the increase in real dividends paidby firms at the top of the dividend distribution swamps the dividend reductionassociated with the loss of many small payers at the bottom.
These secular changes reflect high and increasing dividend concentration. Forexample, the 25 largest dividend payers, all of which are ‘‘old line’’ established firms,collectively supplied over half (54.9%) of aggregate industrial dividends in 2000.Moreover, the earnings that underlie these high dividend payments are themselveshighly concentrated. The total earnings of the 25 top dividend payers constitute51.4% of aggregate industrial earnings in 2000 and, in real terms, are more thandouble their 1978 level. The dividends paid by these 25 firms in 2000 exceed their1978 level by $9.2 billion in real terms ($24.3 billion in year 2000 dollars), an increase
ARTICLE IN PRESS
1For example, The New York Times and The Economist report that dividends have become less
relevant and perhaps irrelevant, citing the findings of Fama and French (2001a) as well as low dividend
yields and the popularity of stock repurchases (‘‘Dividends Are Fading as Market Signals, Too,’’ The New
York Times, November 7, 1999, ‘‘Shares Without the Other Bit: In Corporate America, Paying Dividends
Has Gone Out of Fashion,’’ The Economist, November 20, 1999, and ‘‘Economics Focus: Dividends
End,’’ The Economist, January 20, 2002). Time cites low dividend yields and an increased incidence of
dividend omissions by healthy electric utility firms as evidence that ‘‘dividends have become only slightly
more relevant than the gushing palaver in an annual report’’ (‘‘Disappearing Dividends? Ending Payouts
May Be a Good Thing for Investors,’’ Time, February 2, 1998).
H. DeAngelo et al. / Journal of Financial Economics 72 (2004) 425–456426
that is greater than the $7.1 billion aggregate real increase for all industrial firms.(Here and throughout the paper, we compare dividends and earnings for 1978 and2000 by converting 2000 dollars into 1978 dollars using the consumer price index.)This evidence shows that a relative handful of firms now both dominates the supplyof dividends and generates the preponderance of earnings, and that both dividendand earnings concentration have increased substantially from the (already high) levelof two decades ago.
Changes in the cross-sectional distribution of earnings—especially among firms atthe top end of the distribution—are the fundamental reason why real dollardividends paid by industrial firms have increased even though, as Fama and French(2001a) conclude, industrial firms now exhibit a reduced propensity to pay dividends(i.e., they are now more likely to pay zero dividends, controlling for earnings andgrowth opportunities). We find that 100% of the firms with at least $1 billion in realearnings paid dividends in 1978, whereas 85.7% paid dividends in 2000, consistentwith Fama and French’s reduced propensity to pay. However, although a smallerproportion of firms with high real earnings now pays dividends, top earners continueto exhibit a very strong tendency to do so. And since top-end firms now produce somuch more in real earnings, on net this group shows a large increase in real dividendseven though a few very large earners, primarily technology firms, have been slow toinitiate dividends. The end result is that aggregate dividends paid by industrial firmsincreased over 1978–2000 despite the reduced propensity to pay dividends.
Overall, the supply of dividends by industrial firms exhibits a two-tier structure inwhich a small number of firms with very high earnings collectively generates themajority of earnings and dominates the dividend supply, while the vast majority offirms has at best a modest collective impact on aggregate earnings and dividends. Wediscuss the implications of the two-tier structure for the dividend clientele andsignaling hypotheses and for the evolution of corporate payout practices in Section7. Section 2 begins the paper by describing our sampling procedure, and it alsodetails the aggregate dividend increase from 1978 to 2000 for industrial firms. Section3 documents the concentration of dividends and the consolidation therein that hasoccurred over the last two decades, while Section 4 does the same for earnings.Section 5 identifies the top payers, the top nonpayers, and the firms with the highestearnings in 2000. Section 6 documents how many of the 1978 dividend payerscontinued to pay dividends in 2000, the strong influence of these continuing payerson the 2000 dividend supply, and what happened to the remaining firms (primarily,they were acquired).
2. Sampling procedure and aggregate dividends, 1978–2000
Shoven (1986, Table 2) reports that US government data show a near doubling ofnominal dividends for the corporate sector as a whole over 1978–1985. And thistrend continues, with aggregate nominal dividends increasing 647.2% over 1978–2000, nearly twice the contemporaneous 330.0% increase in GDP, and withaggregate real dividends increasing 182.9% (all data from Economic Report of the
ARTICLE IN PRESSH. DeAngelo et al. / Journal of Financial Economics 72 (2004) 425–456 427
President, 2001). These data paint a very different picture from the impression oneforms from Fama and French’s (2001a) finding that the number of dividend payershas fallen by more than 50% since 1978 (see footnote 1 above). Of course, thegovernment population is not confined to publicly traded industrials, the sample thatFama and French study, since it also includes private firms and publicly heldfinancials and utilities. However, as we show below, aggregate dividends alsoincreased for publicly traded industrials, thereby posing the conundrum that westudy in this paper: why have aggregate dividends increased in the face of a radicaldecline in the number of payers?
Following Fama and French (2001a), we sample CRSP industrial firms with SICcodes outside the ranges 4900–4949 and 6000–6999 (financials and utilities). We callnonfinancial and nonutility firms ‘‘industrials,’’ while recognizing that this groupalso includes service firms, conglomerates, and perhaps other companies notconventionally labeled industrials. Like Fama and French (2001a), we restrictattention to NYSE, AMEX, and NASDAQ firms with CRSP share codes 10 or 11for at least one month of each year in question, and with nonmissing December shareprice and quantity data. We consider only CRSP firms with dividends and earningson Compustat (the CRSP/Compustat sample). Our sample sizes differ slightly fromthose of Fama and French because we place different requirements on theavailability of specific data items, and probably also because of differences in howwe implement sampling criteria regarding the monthly observation of CRSP shareand/or SIC codes. Fama and French examine trends over 1978–1998, while weemploy data that became available after publication of their study and thereforeexamine trends over 1978–2000.
Table 1 shows that the large decline in the number of dividend payers from 1978 to2000 is confined to industrial firms. While the number of dividend-paying industrialsfell 58.8%, from 2,250 in 1978 to 926 in 2000, the number of payers among financial/utility firms increased by 9.5%, from 852 to 933. Although not shown in the table,the proportion of dividend-paying financials/utilities on CRSP fell from 79.9% to71.6% over 1978–2000, a decline that occurred because the increase in listed firmsproportionately exceeds the increase in these payers. Because the precipitous declinein the number of dividend-paying industrials is not matched by a similar decline forfinancials/utilities, it cannot simply reflect a general increase in managers’ reluctanceto pay dividends, but must instead relate to some underlying fundamental change(s)largely confined to industrial firms. For example, income tax law changes that hadsimilar effects on nonindustrial and industrial firms’ incentives to pay dividendscannot explain the secular trends in Table 1.
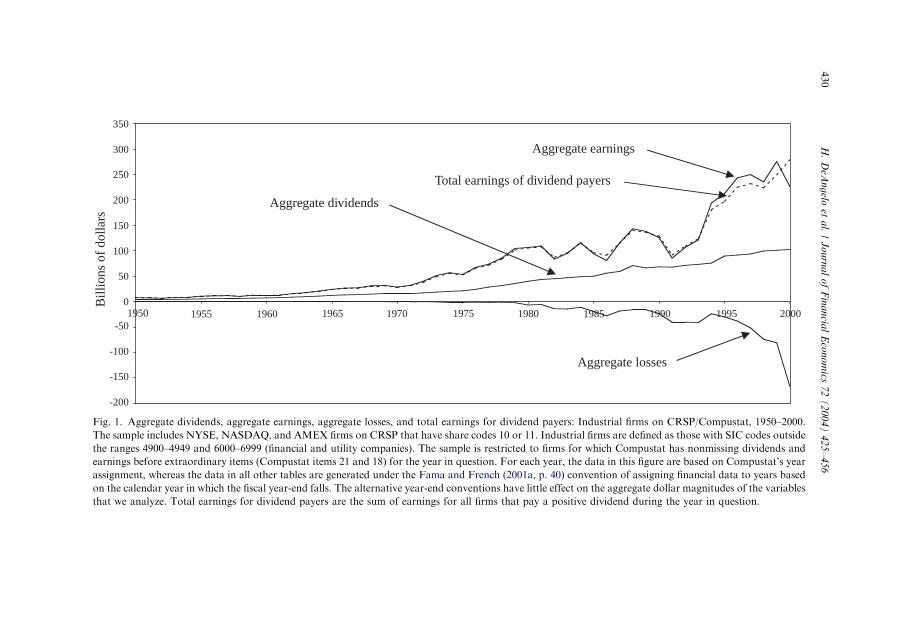
Fig. 1 tracks aggregate dividends, earnings, and losses for industrial firms onCRSP/Compustat over 1950–2000, as well as total earnings for the subset ofdividend-paying industrial firms. The CRSP/Compustat population expands in 1962(when CRSP added AMEX firms to its coverage of NYSE firms) and again in 1972(when NASDAQ firms were added), but remains unchanged post-1978, when thenumber of payers fell by more than 50%. The figure shows that (i) aggregatedividends increased steadily over the full period 1950–2000, including the 1978–2000subperiod, (ii) the long-term growth in aggregate dividends reflects the underlying
ARTICLE IN PRESSH. DeAngelo et al. / Journal of Financial Economics 72 (2004) 425–456428
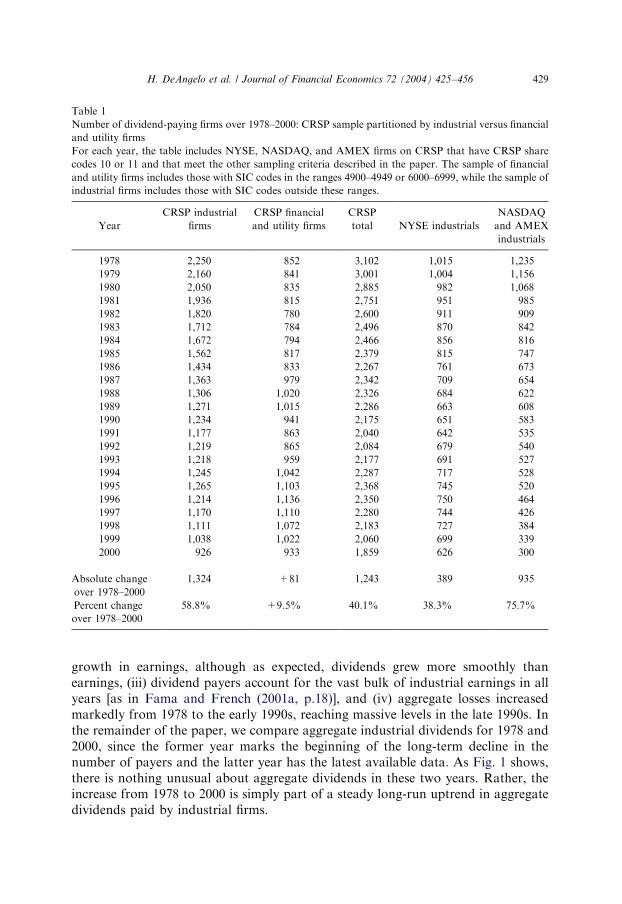
growth in earnings, although as expected, dividends grew more smoothly thanearnings, (iii) dividend payers account for the vast bulk of industrial earnings in allyears [as in Fama and French (2001a, p.18)], and (iv) aggregate losses increasedmarkedly from 1978 to the early 1990s, reaching massive levels in the late 1990s. Inthe remainder of the paper, we compare aggregate industrial dividends for 1978 and2000, since the former year marks the beginning of the long-term decline in thenumber of payers and the latter year has the latest available data. As Fig. 1 shows,there is nothing unusual about aggregate dividends in these two years. Rather, theincrease from 1978 to 2000 is simply part of a steady long-run uptrend in aggregatedividends paid by industrial firms.
ARTICLE IN PRESS
Table 1
Number of dividend-paying firms over 1978–2000: CRSP sample partitioned by industrial versus financial
and utility firms
For each year, the table includes NYSE, NASDAQ, and AMEX firms on CRSP that have CRSP share
codes 10 or 11 and that meet the other sampling criteria described in the paper. The sample of financial
and utility firms includes those with SIC codes in the ranges 4900–4949 or 6000–6999, while the sample of
industrial firms includes those with SIC codes outside these ranges.
CRSP industrial CRSP financial CRSP NASDAQ
Year firms and utility firms total NYSE industrials and AMEX
industrials
1978 2,250 852 3,102 1,015 1,235
1979 2,160 841 3,001 1,004 1,156
1980 2,050 835 2,885 982 1,068
1981 1,936 815 2,751 951 985
1982 1,820 780 2,600 911 909
1983 1,712 784 2,496 870 842
1984 1,672 794 2,466 856 816
1985 1,562 817 2,379 815 747
1986 1,434 833 2,267 761 673
1987 1,363 979 2,342 709 654
1988 1,306 1,020 2,326 684 622
1989 1,271 1,015 2,286 663 608
1990 1,234 941 2,175 651 583
1991 1,177 863 2,040 642 535
1992 1,219 865 2,084 679 540
1993 1,218 959 2,177 691 527
1994 1,245 1,042 2,287 717 528
1995 1,265 1,103 2,368 745 520
1996 1,214 1,136 2,350 750 464
1997 1,170 1,110 2,280 744 426
1998 1,111 1,072 2,183 727 384
1999 1,038 1,022 2,060 699 339
2000 926 933 1,859 626 300
Absolute change �1,324 +81 �1,243 �389 �935
over 1978–2000
Percent change �58.8% +9.5% �40.1% �38.3% �75.7%
over 1978–2000
H. DeAngelo et al. / Journal of Financial Economics 72 (2004) 425–456 429
ARTIC
LEIN
PRES
S
-200
-150
-100
-50
0
50
100
150
200
250
300
350
1950 1955 1960 1965 1970 1975 1980 1985 1990 1995 2000
Aggregate dividends
Bill
ions
of
dolla
rs
Aggregate earnings
Total earnings of dividend payers
Aggregate losses
Fig. 1. Aggregate dividends, aggregate earnings, aggregate losses, and total earnings for dividend payers: Industrial firms on CRSP/Compustat, 1950–2000.
The sample includes NYSE, NASDAQ, and AMEX firms on CRSP that have share codes 10 or 11. Industrial firms are defined as those with SIC codes outside
the ranges 4900–4949 and 6000–6999 (financial and utility companies). The sample is restricted to firms for which Compustat has nonmissing dividends and
earnings before extraordinary items (Compustat items 21 and 18) for the year in question. For each year, the data in this figure are based on Compustat’s year
assignment, whereas the data in all other tables are generated under the Fama and French (2001a, p. 40) convention of assigning financial data to years based
on the calendar year in which the fiscal year-end falls. The alternative year-end conventions have little effect on the aggregate dollar magnitudes of the variables
that we analyze. Total earnings for dividend payers are the sum of earnings for all firms that pay a positive dividend during the year in question.
H.
DeA
ng
eloet
al.
/J
ou
rna
lo
fF
ina
ncia
lE
con
om
ics7
2(
20
04
)4
25
–4
56
430
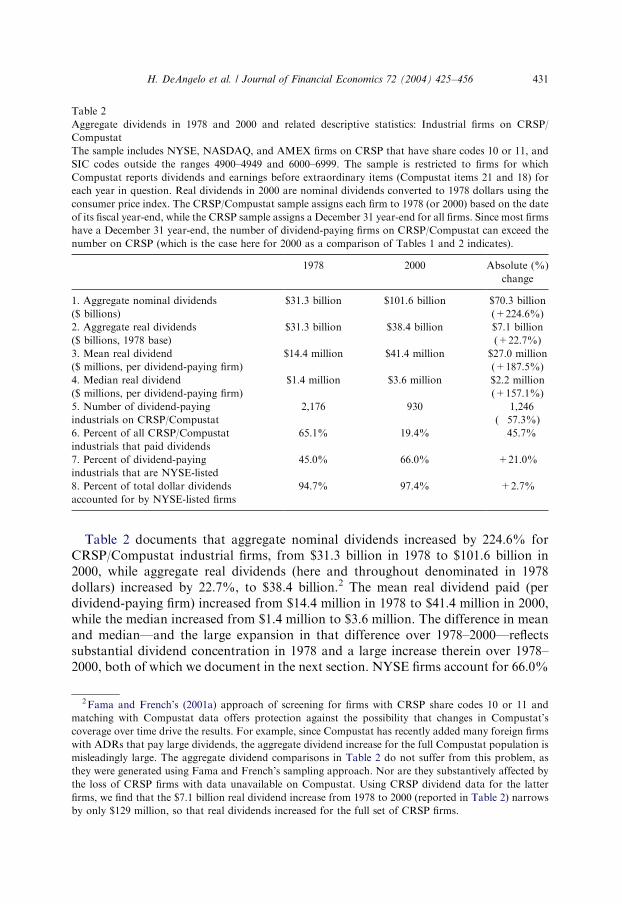
Table 2 documents that aggregate nominal dividends increased by 224.6% forCRSP/Compustat industrial firms, from $31.3 billion in 1978 to $101.6 billion in2000, while aggregate real dividends (here and throughout denominated in 1978dollars) increased by 22.7%, to $38.4 billion.2 The mean real dividend paid (perdividend-paying firm) increased from $14.4 million in 1978 to $41.4 million in 2000,while the median increased from $1.4 million to $3.6 million. The difference in meanand median—and the large expansion in that difference over 1978–2000—reflectssubstantial dividend concentration in 1978 and a large increase therein over 1978–2000, both of which we document in the next section. NYSE firms account for 66.0%
ARTICLE IN PRESS
Table 2
Aggregate dividends in 1978 and 2000 and related descriptive statistics: Industrial firms on CRSP/
Compustat
The sample includes NYSE, NASDAQ, and AMEX firms on CRSP that have share codes 10 or 11, and
SIC codes outside the ranges 4900–4949 and 6000–6999. The sample is restricted to firms for which
Compustat reports dividends and earnings before extraordinary items (Compustat items 21 and 18) for
each year in question. Real dividends in 2000 are nominal dividends converted to 1978 dollars using the
consumer price index. The CRSP/Compustat sample assigns each firm to 1978 (or 2000) based on the date
of its fiscal year-end, while the CRSP sample assigns a December 31 year-end for all firms. Since most firms
have a December 31 year-end, the number of dividend-paying firms on CRSP/Compustat can exceed the
number on CRSP (which is the case here for 2000 as a comparison of Tables 1 and 2 indicates).
1978 2000 Absolute (%)
change
1. Aggregate nominal dividends $31.3 billion $101.6 billion $70.3 billion
($ billions) (+224.6%)
2. Aggregate real dividends $31.3 billion $38.4 billion $7.1 billion
($ billions, 1978 base) (+22.7%)
3. Mean real dividend $14.4 million $41.4 million $27.0 million
($ millions, per dividend-paying firm) (+187.5%)
4. Median real dividend $1.4 million $3.6 million $2.2 million
($ millions, per dividend-paying firm) (+157.1%)
5. Number of dividend-paying 2,176 930 �1,246
industrials on CRSP/Compustat (�57.3%)
6. Percent of all CRSP/Compustat 65.1% 19.4% �45.7%
industrials that paid dividends
7. Percent of dividend-paying 45.0% 66.0% +21.0%
industrials that are NYSE-listed
8. Percent of total dollar dividends 94.7% 97.4% +2.7%
accounted for by NYSE-listed firms
2Fama and French’s (2001a) approach of screening for firms with CRSP share codes 10 or 11 and
matching with Compustat data offers protection against the possibility that changes in Compustat’s
coverage over time drive the results. For example, since Compustat has recently added many foreign firms
with ADRs that pay large dividends, the aggregate dividend increase for the full Compustat population is
misleadingly large. The aggregate dividend comparisons in Table 2 do not suffer from this problem, as
they were generated using Fama and French’s sampling approach. Nor are they substantively affected by
the loss of CRSP firms with data unavailable on Compustat. Using CRSP dividend data for the latter
firms, we find that the $7.1 billion real dividend increase from 1978 to 2000 (reported in Table 2) narrows
by only $129 million, so that real dividends increased for the full set of CRSP firms.
H. DeAngelo et al. / Journal of Financial Economics 72 (2004) 425–456 431
of payers and 97.4% of aggregate dividends in 2000, up respectively from 45.0% and94.7% in 1978. The fact that NYSE firms pay the overwhelming majority ofindustrial dividends likely reflects the tendencies for older and more stable (thustypically dividend-paying) firms to list their shares on the NYSE, and for young andgrowing (thus typically not dividend-paying) firms to trade on NASDAQ.
3. Dividend concentration and the increase therein over the last two decades
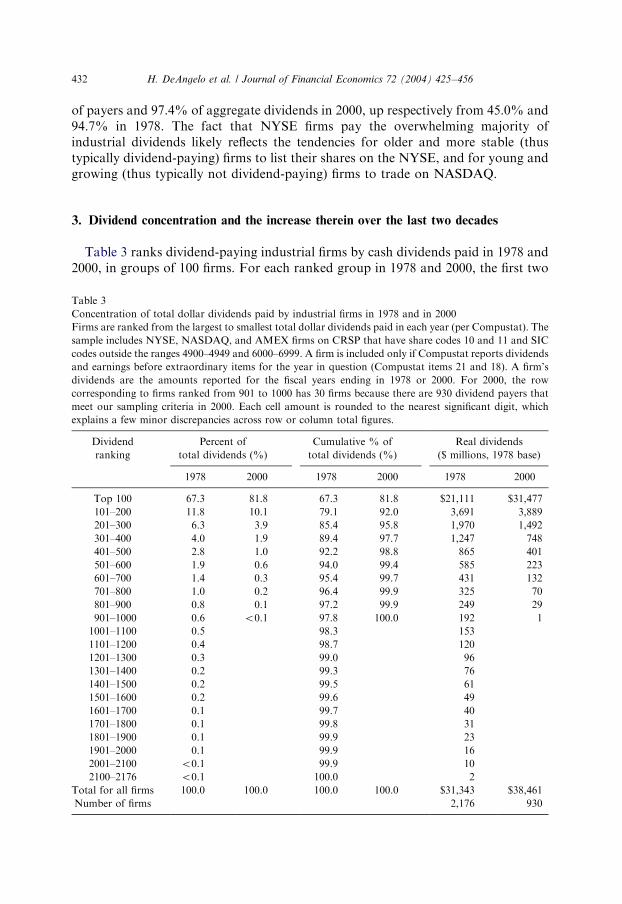
Table 3 ranks dividend-paying industrial firms by cash dividends paid in 1978 and2000, in groups of 100 firms. For each ranked group in 1978 and 2000, the first two
ARTICLE IN PRESS
Table 3
Concentration of total dollar dividends paid by industrial firms in 1978 and in 2000
Firms are ranked from the largest to smallest total dollar dividends paid in each year (per Compustat). The
sample includes NYSE, NASDAQ, and AMEX firms on CRSP that have share codes 10 and 11 and SIC
codes outside the ranges 4900–4949 and 6000–6999. A firm is included only if Compustat reports dividends
and earnings before extraordinary items for the year in question (Compustat items 21 and 18). A firm’s
dividends are the amounts reported for the fiscal years ending in 1978 or 2000. For 2000, the row
corresponding to firms ranked from 901 to 1000 has 30 firms because there are 930 dividend payers that
meet our sampling criteria in 2000. Each cell amount is rounded to the nearest significant digit, which
explains a few minor discrepancies across row or column total figures.
Dividend
ranking
Percent of
total dividends (%)
Cumulative % of
total dividends (%)
Real dividends
($ millions, 1978 base)
1978 2000 1978 2000 1978 2000
Top 100 67.3 81.8 67.3 81.8 $21,111 $31,477
101–200 11.8 10.1 79.1 92.0 3,691 3,889
201–300 6.3 3.9 85.4 95.8 1,970 1,492
301–400 4.0 1.9 89.4 97.7 1,247 748
401–500 2.8 1.0 92.2 98.8 865 401
501–600 1.9 0.6 94.0 99.4 585 223
601–700 1.4 0.3 95.4 99.7 431 132
701–800 1.0 0.2 96.4 99.9 325 70
801–900 0.8 0.1 97.2 99.9 249 29
901–1000 0.6 o0.1 97.8 100.0 192 1
1001–1100 0.5 98.3 153
1101–1200 0.4 98.7 120
1201–1300 0.3 99.0 96
1301–1400 0.2 99.3 76
1401–1500 0.2 99.5 61
1501–1600 0.2 99.6 49
1601–1700 0.1 99.7 40
1701–1800 0.1 99.8 31
1801–1900 0.1 99.9 23
1901–2000 0.1 99.9 16
2001–2100 o0.1 99.9 10
2100–2176 o0.1 100.0 2
Total for all firms 100.0 100.0 100.0 100.0 $31,343 $38,461
Number of firms 2,176 930
H. DeAngelo et al. / Journal of Financial Economics 72 (2004) 425–456432
columns report the percent of dividends paid, the middle two columns report thecumulative percent, and the last two columns report total real dividends. Overall, arelatively small number of firms pays the overwhelming majority of aggregateindustrial dividends, and this concentration has increased substantially over the lasttwo decades. For example, in 2000, the top 100 dividend payers distributed 81.8% ofdividends, up from 67.3% in 1978. The $31.5 billion in real dividends paid by the top100 dividend payers in 2000 ($83.2 billion in year 2000 dollars) exceeds the $31.3billion paid in 1978 by all 2,176 dividend payers. For the top 100, dividendsincreased by $10.4 billion (49.1%), or more than triple the $3.3 billion dividenddecline for all ranks below the top 100. Since virtually all of the increased dividendconcentration is driven by the top 100 or 200 payers, this concentration increase isobviously not an artifact of the reduction in the number of payers.
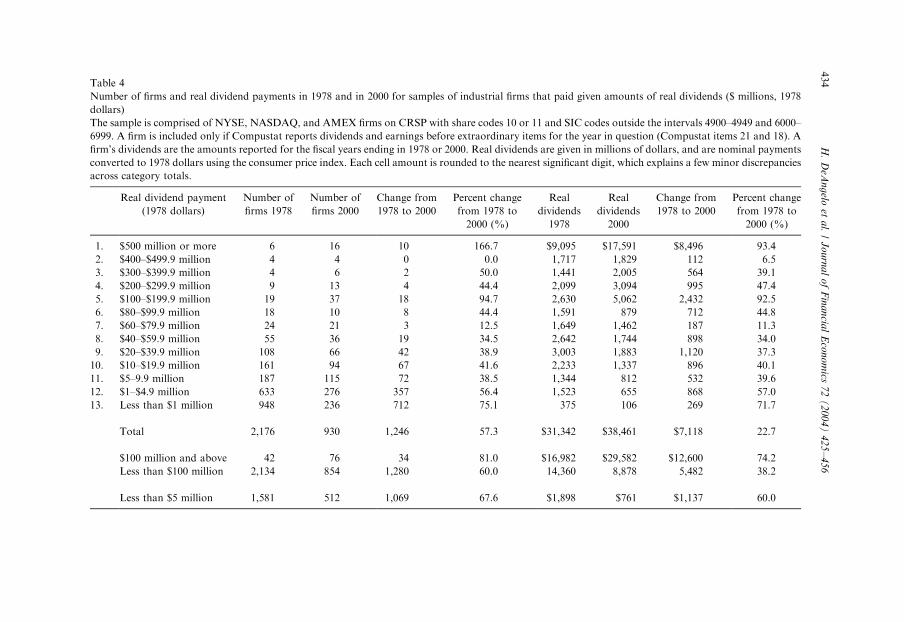
Table 4 summarizes the cross-sectional distributions of dividends in 1978 and in2000, with dividend-paying firms categorized by real dollar dividends paid, rangingfrom $500 million-plus per year to less than $1 million per year. The table documentsthat the number of firms paying dividends of $100 million-plus increased by 34 over1978–2000, for a dividend increase of $12.6 billion. Over the same period, the numberof firms paying less than $100 million decreased by 1,280 and this decline manifestsprimarily in the two smallest dividend classes, with the 1,069 net reduction in firmspaying less than $5 million per year accounting for 85.8% of the overall net decline of1,246 firms. And while the 1,069-firm reduction in small payers is large in number, thedollar magnitude of the $1.1 billion in dividends lost is dwarfed by the $12.6 billion individends gained from the 34-firm increase for the $100 million-plus category.
In sum, the top categories of dividend payers now contain more firms and thesefirms now pay substantially higher total dividends, while the bottom categories nowcontain many fewer firms and these firms now pay modestly lower total dividends.The net result is a large decrease in the number of payers accompanied by an increasein aggregate dividends, which reflects the fact that the top-end firms dominate, whilethe bottom-end firms have little impact on the aggregate dividend supply. Black andScholes (1974) and Miller (1977) argue that what matters to investors is theaggregate supply of securities with particular characteristics (e.g., dividends, taxableinterest returns, etc.), and not the number of firms delivering that supply or thequantity delivered by any one firm. In their view, the decline in the number of payersis of little consequence so long as sufficient dividends are supplied to meet thedemand for dollars delivered currently in that form. Since aggregate real dividendsincreased over 1978–2000, the decrease in the number of payers was not caused by areduction in aggregate demand, but instead must reflect changes in the factor(s) thatdetermine firms’ dividend supply decisions.
4. Dividend and earnings concentration and payout ratios
Lintner’s (1956) finding that firms’ dividend supply decisions primarily depend onearnings suggests that the high/increasing dividend concentration we observe may bethe result of high/increasing earnings concentration. The evidence reported in this
ARTICLE IN PRESSH. DeAngelo et al. / Journal of Financial Economics 72 (2004) 425–456 433
ARTIC
LEIN
PRES
S
Table 4
Number of firms and real dividend payments in 1978 and in 2000 for samples of industrial firms that paid given amounts of real dividends ($ millions, 1978
dollars)
The sample is comprised of NYSE, NASDAQ, and AMEX firms on CRSP with share codes 10 or 11 and SIC codes outside the intervals 4900–4949 and 6000–
6999. A firm is included only if Compustat reports dividends and earnings before extraordinary items for the year in question (Compustat items 21 and 18). A
firm’s dividends are the amounts reported for the fiscal years ending in 1978 or 2000. Real dividends are given in millions of dollars, and are nominal payments
converted to 1978 dollars using the consumer price index. Each cell amount is rounded to the nearest significant digit, which explains a few minor discrepancies
across category totals.
Real dividend payment Number of Number of Change from Percent change Real Real Change from Percent change
(1978 dollars) firms 1978 firms 2000 1978 to 2000 from 1978 to dividends dividends 1978 to 2000 from 1978 to
2000 (%) 1978 2000 2000 (%)
1. $500 million or more 6 16 10 166.7 $9,095 $17,591 $8,496 93.4
2. $400–$499.9 million 4 4 0 0.0 1,717 1,829 112 6.5
3. $300–$399.9 million 4 6 2 50.0 1,441 2,005 564 39.1
4. $200–$299.9 million 9 13 4 44.4 2,099 3,094 995 47.4
5. $100–$199.9 million 19 37 18 94.7 2,630 5,062 2,432 92.5
6. $80–$99.9 million 18 10 �8 �44.4 1,591 879 �712 �44.8
7. $60–$79.9 million 24 21 �3 �12.5 1,649 1,462 �187 �11.3
8. $40–$59.9 million 55 36 �19 �34.5 2,642 1,744 �898 �34.0
9. $20–$39.9 million 108 66 �42 �38.9 3,003 1,883 �1,120 �37.3
10. $10–$19.9 million 161 94 �67 �41.6 2,233 1,337 �896 �40.1
11. $5–9.9 million 187 115 �72 �38.5 1,344 812 �532 �39.6
12. $1–$4.9 million 633 276 �357 �56.4 1,523 655 �868 �57.0
13. Less than $1 million 948 236 �712 �75.1 375 106 �269 �71.7
Total 2,176 930 �1,246 �57.3 $31,342 $38,461 $7,118 22.7
$100 million and above 42 76 34 81.0 $16,982 $29,582 $12,600 74.2
Less than $100 million 2,134 854 �1,280 �60.0 14,360 8,878 �5,482 �38.2
Less than $5 million 1,581 512 �1,069 �67.6 $1,898 $761 �$1,137 �60.0
H.
DeA
ng
eloet
al.
/J
ou
rna
lo
fF
ina
ncia
lE
con
om
ics7
2(
20
04
)4
25
–4
56
434
and the next section strongly supports this hypothesis, indicating that (i) 1978earnings are highly concentrated and 2000 earnings are considerably more so, (ii) thecross-sectional distribution of 2000 earnings is dominated by firms at the extremes,(iii) 28 firms with $1 billion-plus in real earnings generated the majority of 2000aggregate earnings, (iv) these 28 top earners paid 50.1% of aggregate dividends in2000, although 14.3% are nonpayers (up from 0.0% nonpayers among the topearners in 1978), (v) 2000 aggregate earnings exceed those of 1978, with most of theincrease coming from firms at the top end of the earnings distribution, and (vi) fordividend-paying firms, the typical payout ratio is little changed over the past twodecades.
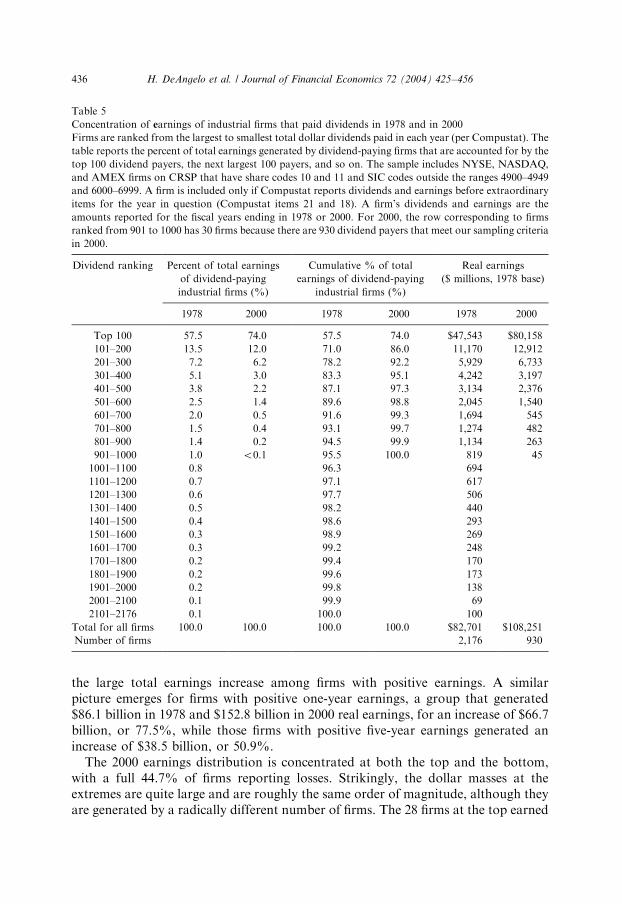
Table 5 ranks dividend-paying firms by their earnings in 1978 and 2000, in a formatsimilar to that of Table 3. Like dividends, earnings were highly concentrated in 1978,and substantial additional earnings concentration has occurred among dividendpayers over the last two decades. In 1978, the top 100 dividend payers generated57.5% of the earnings of all payers, while cumulatively the top 200 payers generated71.0%. The corresponding figures for 2000 are 74.0% and 86.0%. From 1978 to 2000,the total real earnings of the 100 largest payers increased markedly, from $47.5 billionto $80.2 billion. The next two groups also show real increases, albeit of considerablymore modest magnitudes, while all remaining groups show decreases. The net result isa 31.0% increase in the real earnings of dividend payers, from $82.7 billion in 1978 to$108.3 billion in 2000 (to $286.0 billion in year 2000 dollars).
4.1. The pooled earnings distribution of dividend payers and nonpayers
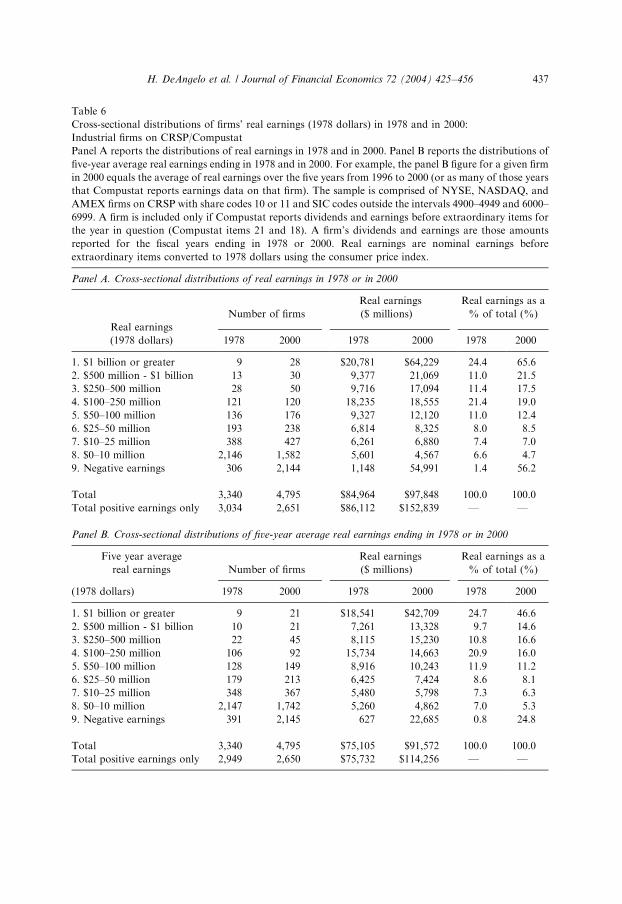
As background for our analysis of the earnings of dividend payers and nonpayers,Table 6 summarizes the cross-sectional earnings distribution of all firms (payers andnonpayers) combined. Panel A contains the pooled earnings distributions for 1978and 2000. Since Lintner’s (1956) analysis indicates that dividends tend to be set inresponse to long-run earnings rather than to a single (possibly aberrant) earningsrealization, panel B reports the pooled distribution of average five-year earningsending in 1978 and in 2000. The five-year averages are especially useful here becausein 2000 industrial firms reported remarkably large losses (see Fig. 1), which may be atransitory phenomenon. If so, five-year average earnings better measure firms’ long-run ability to pay dividends than do one-year earnings realizations.
Table 6 indicates that earnings in both 1978 and 2000 are concentrated among arelatively few firms at the top end of the distribution, and that such concentration isnotably greater in 2000 than it was in 1978. The aggregate real earnings of payersand nonpayers combined increased from $85.0 billion in 1978 to $97.8 billion in 2000($258.3 billion in year 2000 dollars), while aggregate five-year average real earningsincreased from $75.1 billion to $91.6 billion. These aggregate increases are driven byfirms at the top end of the earnings distribution, especially in the $500 million-plusearnings categories, which show a total increase over 1978–2000 of $55.1 billion(182.8%) in one-year earnings, and $30.2 billion (117.2%) in five-year averageearnings. These top-end increases far exceed the net aggregate increase in realearnings for all industrials as a group, and they comprise more than three-quarters of
ARTICLE IN PRESSH. DeAngelo et al. / Journal of Financial Economics 72 (2004) 425–456 435
the large total earnings increase among firms with positive earnings. A similarpicture emerges for firms with positive one-year earnings, a group that generated$86.1 billion in 1978 and $152.8 billion in 2000 real earnings, for an increase of $66.7billion, or 77.5%, while those firms with positive five-year earnings generated anincrease of $38.5 billion, or 50.9%.
The 2000 earnings distribution is concentrated at both the top and the bottom,with a full 44.7% of firms reporting losses. Strikingly, the dollar masses at theextremes are quite large and are roughly the same order of magnitude, although theyare generated by a radically different number of firms. The 28 firms at the top earned
ARTICLE IN PRESS
Table 5
Concentration of earnings of industrial firms that paid dividends in 1978 and in 2000
Firms are ranked from the largest to smallest total dollar dividends paid in each year (per Compustat). The
table reports the percent of total earnings generated by dividend-paying firms that are accounted for by the
top 100 dividend payers, the next largest 100 payers, and so on. The sample includes NYSE, NASDAQ,
and AMEX firms on CRSP that have share codes 10 and 11 and SIC codes outside the ranges 4900–4949
and 6000–6999. A firm is included only if Compustat reports dividends and earnings before extraordinary
items for the year in question (Compustat items 21 and 18). A firm’s dividends and earnings are the
amounts reported for the fiscal years ending in 1978 or 2000. For 2000, the row corresponding to firms
ranked from 901 to 1000 has 30 firms because there are 930 dividend payers that meet our sampling criteria
in 2000.
Dividend ranking Percent of total earnings
of dividend-paying
Cumulative % of total
earnings of dividend-paying
Real earnings
($ millions, 1978 base)
industrial firms (%) industrial firms (%)
1978 2000 1978 2000 1978 2000
Top 100 57.5 74.0 57.5 74.0 $47,543 $80,158
101–200 13.5 12.0 71.0 86.0 11,170 12,912
201–300 7.2 6.2 78.2 92.2 5,929 6,733
301–400 5.1 3.0 83.3 95.1 4,242 3,197
401–500 3.8 2.2 87.1 97.3 3,134 2,376
501–600 2.5 1.4 89.6 98.8 2,045 1,540
601–700 2.0 0.5 91.6 99.3 1,694 545
701–800 1.5 0.4 93.1 99.7 1,274 482
801–900 1.4 0.2 94.5 99.9 1,134 263
901–1000 1.0 o0.1 95.5 100.0 819 45
1001–1100 0.8 96.3 694
1101–1200 0.7 97.1 617
1201–1300 0.6 97.7 506
1301–1400 0.5 98.2 440
1401–1500 0.4 98.6 293
1501–1600 0.3 98.9 269
1601–1700 0.3 99.2 248
1701–1800 0.2 99.4 170
1801–1900 0.2 99.6 173
1901–2000 0.2 99.8 138
2001–2100 0.1 99.9 69
2101–2176 0.1 100.0 100
Total for all firms 100.0 100.0 100.0 100.0 $82,701 $108,251
Number of firms 2,176 930
H. DeAngelo et al. / Journal of Financial Economics 72 (2004) 425–456436
ARTICLE IN PRESS
Table 6
Cross-sectional distributions of firms’ real earnings (1978 dollars) in 1978 and in 2000:
Industrial firms on CRSP/Compustat
Panel A reports the distributions of real earnings in 1978 and in 2000. Panel B reports the distributions of
five-year average real earnings ending in 1978 and in 2000. For example, the panel B figure for a given firm
in 2000 equals the average of real earnings over the five years from 1996 to 2000 (or as many of those years
that Compustat reports earnings data on that firm). The sample is comprised of NYSE, NASDAQ, and
AMEX firms on CRSP with share codes 10 or 11 and SIC codes outside the intervals 4900–4949 and 6000–
6999. A firm is included only if Compustat reports dividends and earnings before extraordinary items for
the year in question (Compustat items 21 and 18). A firm’s dividends and earnings are those amounts
reported for the fiscal years ending in 1978 or 2000. Real earnings are nominal earnings before
extraordinary items converted to 1978 dollars using the consumer price index.
Panel A. Cross-sectional distributions of real earnings in 1978 or in 2000
Real earnings Real earnings as a
Real earnings
Number of firms ($ millions) % of total (%)
(1978 dollars) 1978 2000 1978 2000 1978 2000
1. $1 billion or greater 9 28 $20,781 $64,229 24.4 65.6
2. $500 million - $1 billion 13 30 9,377 21,069 11.0 21.5
3. $250–500 million 28 50 9,716 17,094 11.4 17.5
4. $100–250 million 121 120 18,235 18,555 21.4 19.0
5. $50–100 million 136 176 9,327 12,120 11.0 12.4
6. $25–50 million 193 238 6,814 8,325 8.0 8.5
7. $10–25 million 388 427 6,261 6,880 7.4 7.0
8. $0–10 million 2,146 1,582 5,601 4,567 6.6 4.7
9. Negative earnings 306 2,144 �1,148 �54,991 �1.4 �56.2
Total 3,340 4,795 $84,964 $97,848 100.0 100.0
Total positive earnings only 3,034 2,651 $86,112 $152,839 — —
Panel B. Cross-sectional distributions of five-year average real earnings ending in 1978 or in 2000
Five year average Real earnings Real earnings as a
real earnings Number of firms ($ millions) % of total (%)
(1978 dollars) 1978 2000 1978 2000 1978 2000
1. $1 billion or greater 9 21 $18,541 $42,709 24.7 46.6
2. $500 million - $1 billion 10 21 7,261 13,328 9.7 14.6
3. $250–500 million 22 45 8,115 15,230 10.8 16.6
4. $100–250 million 106 92 15,734 14,663 20.9 16.0
5. $50–100 million 128 149 8,916 10,243 11.9 11.2
6. $25–50 million 179 213 6,425 7,424 8.6 8.1
7. $10–25 million 348 367 5,480 5,798 7.3 6.3
8. $0–10 million 2,147 1,742 5,260 4,862 7.0 5.3
9. Negative earnings 391 2,145 �627 �22,685 �0.8 �24.8
Total 3,340 4,795 $75,105 $91,572 100.0 100.0
Total positive earnings only 2,949 2,650 $75,732 $114,256 — —
H. DeAngelo et al. / Journal of Financial Economics 72 (2004) 425–456 437
$64.2 billion (65.6% of aggregate earnings), while the 2,144 firms at the bottom lost$55.0 billion (�56.2%). This $55.0 billion in losses far exceeds the $1.1 billion totallost by 306 firms in 1978. This large upsurge in losses is consistent with the findingsof Hayn (1995), Burgstahler and Dichev (1997), Fama and French (2001a,b), andRitter and Welch (2002) who document a substantially increased loss incidence inrecent years. While in 2000 most firms (1,554, not reported in Table 6) lost less than$10 million, 94 firms lost at least $100 million. Technology firms are prominentamong the latter group, which includes Amazon, Web MD, Webvan, Priceline,Covad, Akamai, Ariba, JDS Uniphase, Earthlink, Broadcom, PSINet, MP3.Com,and CMGI. DeAngelo and DeAngelo (1990) and DeAngelo, DeAngelo, and Skinner(1992) document that losses play a key role in dividend cuts and omissions. Thesefindings, combined with recent years’ large increase in the incidence of losses, helpexplain why so many fewer industrial firms now pay dividends.
4.2. The separate earnings of dividend payers and nonpayers
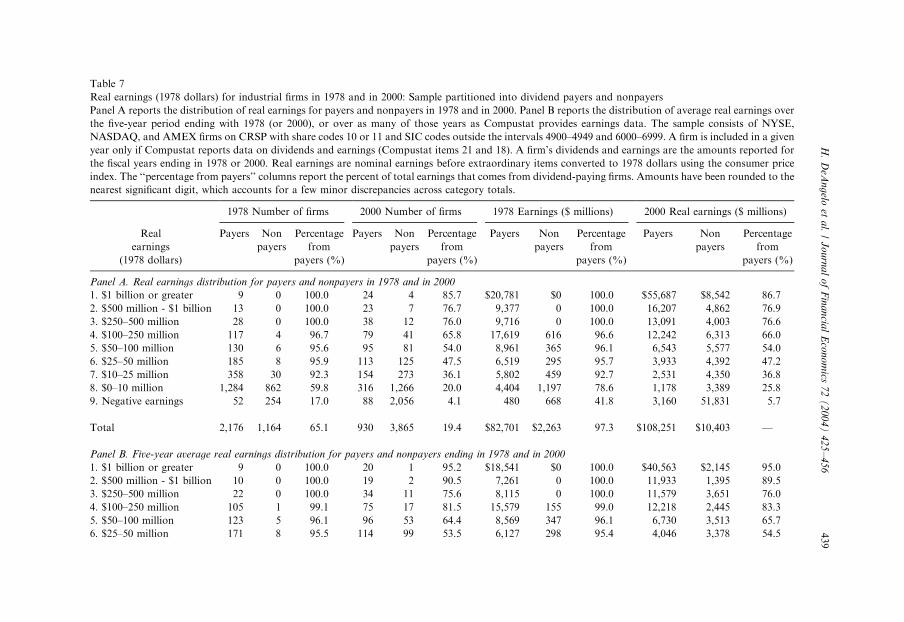
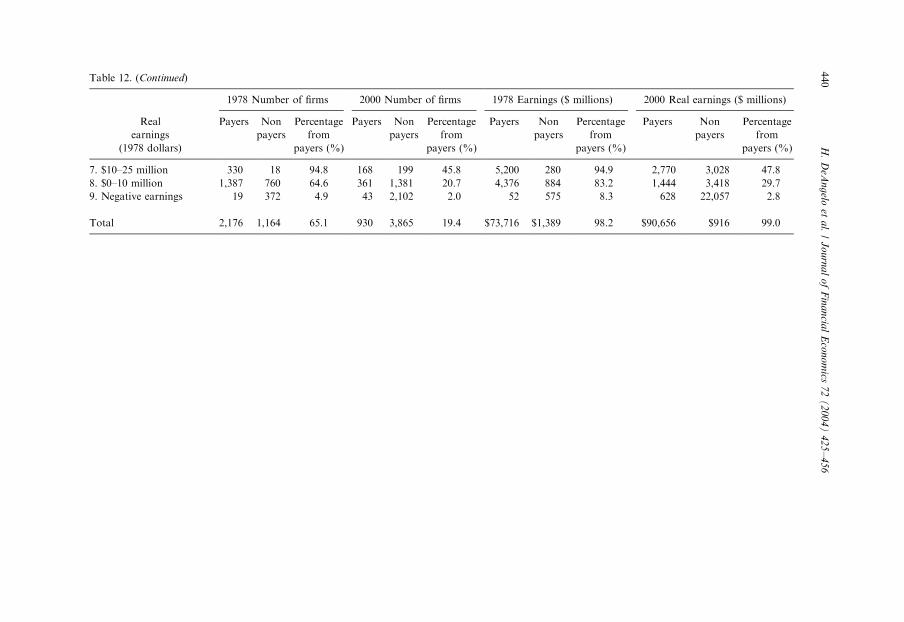
The strong link between losses and the failure to pay dividends is evident fromTable 7, which partitions the pooled distributions of real earnings from Table 6 intoseparate distributions for dividend payers and for nonpayers. Virtually all (2,056 of2,144, or 95.9%) firms that reported losses failed to pay a dividend in 2000 (row 9 ofpanel A). The view that losses have driven many more firms to forego dividends isfurther supported by the fact that in 2000 nonpayers as a group lost $10.4 billion,while dividend payers as a group earned $108.3 billion.
Both panels of Table 7 document a strong positive relation between the level ofearnings and the proportion of firms paying dividends, and they also show that therelation in 2000 is weaker than it was in 1978. For example, only 2.3% of the firmswith earnings of $100 million-plus failed to pay dividends in 1978, compared to28.1% in 2000. The fact that a smaller proportion of firms with a given level of realearnings paid dividends in 2000 than did so in 1978 is consistent with Fama andFrench’s (2001a) conclusion that industrial firms now exhibit a lower propensity topay dividends (although, unlike the estimates of Fama and French, our numbers donot control for growth opportunities). In 2000, a number of firms with large positiveearnings failed to pay dividends (see rows 1–3 in both panels of Table 7), whereas nofirms with comparably large earnings failed to do so in 1978.
Despite this reduced propensity to pay, aggregate real dividends increased by $7.1billion from 1978 to 2000 (per Table 2). Several factors are jointly responsible. Mostfundamentally, aggregate real earnings increased from 1978 to 2000 and, whileearnings are concentrated in 1978, they are more so in 2000. Second, although thepercentage of firms with earnings of $1 billion-plus that pays dividends has fallenfrom 100.0% in 1978 to 85.7% in 2000, the percentage remains high, and these firms’earnings have increased substantially, from $20.8 billion in 1978 to $55.7 billion in2000. Importantly, this group’s dividends increased by $8.9 billion (not reported inthe table), despite its reduced fraction of payers, and this amount exceeds the entire$7.1 billion increase in aggregate dividends from 1978 to 2000. In sum, thesubstantial increase in real earnings at the top end of the distribution, coupled with
ARTICLE IN PRESSH. DeAngelo et al. / Journal of Financial Economics 72 (2004) 425–456438
ARTIC
LEIN
PRES
S
Table 7
Real earnings (1978 dollars) for industrial firms in 1978 and in 2000: Sample partitioned into dividend payers and nonpayers
Panel A reports the distribution of real earnings for payers and nonpayers in 1978 and in 2000. Panel B reports the distribution of average real earnings over
the five-year period ending with 1978 (or 2000), or over as many of those years as Compustat provides earnings data. The sample consists of NYSE,
NASDAQ, and AMEX firms on CRSP with share codes 10 or 11 and SIC codes outside the intervals 4900–4949 and 6000–6999. A firm is included in a given
year only if Compustat reports data on dividends and earnings (Compustat items 21 and 18). A firm’s dividends and earnings are the amounts reported for
the fiscal years ending in 1978 or 2000. Real earnings are nominal earnings before extraordinary items converted to 1978 dollars using the consumer price
index. The ‘‘percentage from payers’’ columns report the percent of total earnings that comes from dividend-paying firms. Amounts have been rounded to the
nearest significant digit, which accounts for a few minor discrepancies across category totals.
1978 Number of firms 2000 Number of firms 1978 Earnings ($ millions) 2000 Real earnings ($ millions)
Real
earnings
Payers Non
payers
Percentage
from
Payers Non
payers
Percentage
from
Payers Non
payers
Percentage
from
Payers Non
payers
Percentage
from
(1978 dollars) payers (%) payers (%) payers (%) payers (%)
Panel A. Real earnings distribution for payers and nonpayers in 1978 and in 2000
1. $1 billion or greater 9 0 100.0 24 4 85.7 $20,781 $0 100.0 $55,687 $8,542 86.7
2. $500 million - $1 billion 13 0 100.0 23 7 76.7 9,377 0 100.0 16,207 4,862 76.9
3. $250–500 million 28 0 100.0 38 12 76.0 9,716 0 100.0 13,091 4,003 76.6
4. $100–250 million 117 4 96.7 79 41 65.8 17,619 616 96.6 12,242 6,313 66.0
5. $50–100 million 130 6 95.6 95 81 54.0 8,961 365 96.1 6,543 5,577 54.0
6. $25–50 million 185 8 95.9 113 125 47.5 6,519 295 95.7 3,933 4,392 47.2
7. $10–25 million 358 30 92.3 154 273 36.1 5,802 459 92.7 2,531 4,350 36.8
8. $0–10 million 1,284 862 59.8 316 1,266 20.0 4,404 1,197 78.6 1,178 3,389 25.8
9. Negative earnings 52 254 17.0 88 2,056 4.1 �480 �668 41.8 �3,160 �51,831 5.7
Total 2,176 1,164 65.1 930 3,865 19.4 $82,701 $2,263 97.3 $108,251 �$10,403 —
Panel B. Five-year average real earnings distribution for payers and nonpayers ending in 1978 and in 2000
1. $1 billion or greater 9 0 100.0 20 1 95.2 $18,541 $0 100.0 $40,563 $2,145 95.0
2. $500 million - $1 billion 10 0 100.0 19 2 90.5 7,261 0 100.0 11,933 1,395 89.5
3. $250–500 million 22 0 100.0 34 11 75.6 8,115 0 100.0 11,579 3,651 76.0
4. $100–250 million 105 1 99.1 75 17 81.5 15,579 155 99.0 12,218 2,445 83.3
5. $50–100 million 123 5 96.1 96 53 64.4 8,569 347 96.1 6,730 3,513 65.7
6. $25–50 million 171 8 95.5 114 99 53.5 6,127 298 95.4 4,046 3,378 54.5
H.
DeA
ng
eloet
al.
/J
ou
rna
lo
fF
ina
ncia
lE
con
om
ics7
2(
20
04
)4
25
–4
56
439
ARTIC
LEIN
PRES
STable 12. (Continued)
1978 Number of firms 2000 Number of firms 1978 Earnings ($ millions) 2000 Real earnings ($ millions)
Real
earnings
Payers Non
payers
Percentage
from
Payers Non
payers
Percentage
from
Payers Non
payers
Percentage
from
Payers Non
payers
Percentage
from
(1978 dollars) payers (%) payers (%) payers (%) payers (%)
7. $10–25 million 330 18 94.8 168 199 45.8 5,200 280 94.9 2,770 3,028 47.8
8. $0–10 million 1,387 760 64.6 361 1,381 20.7 4,376 884 83.2 1,444 3,418 29.7
9. Negative earnings 19 372 4.9 43 2,102 2.0 �52 �575 8.3 �628 �22,057 2.8
Total 2,176 1,164 65.1 930 3,865 19.4 $73,716 $1,389 98.2 $90,656 $916 99.0
H.
DeA
ng
eloet
al.
/J
ou
rna
lo
fF
ina
ncia
lE
con
om
ics7
2(
20
04
)4
25
–4
56
440
the continued strong tendency of top earners to pay dividends, is sufficient togenerate an aggregate dividend increase despite both the large reduction in thenumber of small dividend payers and the modest increase in the number of firms withvery large earnings that fail to pay dividends.
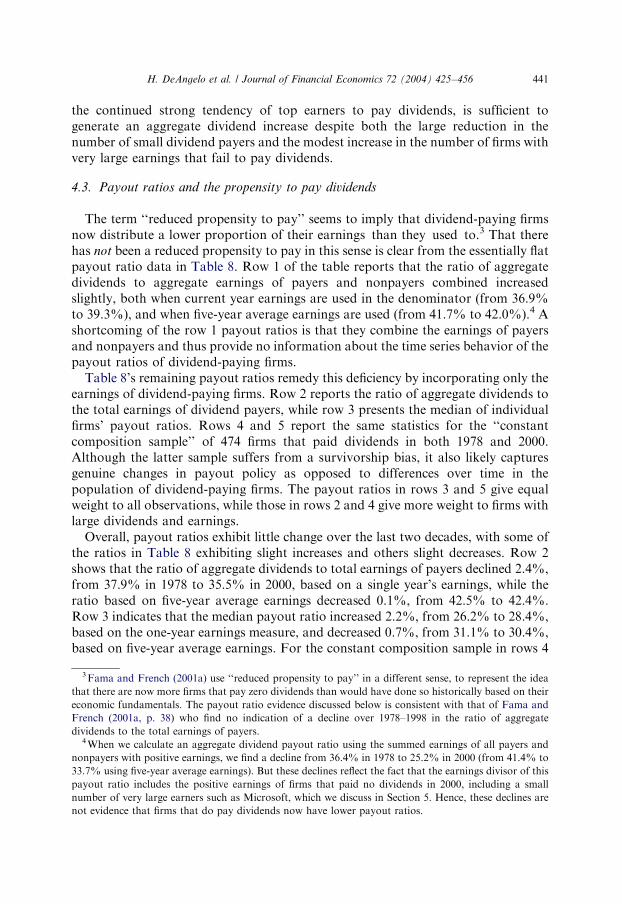
4.3. Payout ratios and the propensity to pay dividends
The term ‘‘reduced propensity to pay’’ seems to imply that dividend-paying firmsnow distribute a lower proportion of their earnings than they used to.3 That therehas not been a reduced propensity to pay in this sense is clear from the essentially flatpayout ratio data in Table 8. Row 1 of the table reports that the ratio of aggregatedividends to aggregate earnings of payers and nonpayers combined increasedslightly, both when current year earnings are used in the denominator (from 36.9%to 39.3%), and when five-year average earnings are used (from 41.7% to 42.0%).4 Ashortcoming of the row 1 payout ratios is that they combine the earnings of payersand nonpayers and thus provide no information about the time series behavior of thepayout ratios of dividend-paying firms.
Table 8’s remaining payout ratios remedy this deficiency by incorporating only theearnings of dividend-paying firms. Row 2 reports the ratio of aggregate dividends tothe total earnings of dividend payers, while row 3 presents the median of individualfirms’ payout ratios. Rows 4 and 5 report the same statistics for the ‘‘constantcomposition sample’’ of 474 firms that paid dividends in both 1978 and 2000.Although the latter sample suffers from a survivorship bias, it also likely capturesgenuine changes in payout policy as opposed to differences over time in thepopulation of dividend-paying firms. The payout ratios in rows 3 and 5 give equalweight to all observations, while those in rows 2 and 4 give more weight to firms withlarge dividends and earnings.
Overall, payout ratios exhibit little change over the last two decades, with some ofthe ratios in Table 8 exhibiting slight increases and others slight decreases. Row 2shows that the ratio of aggregate dividends to total earnings of payers declined 2.4%,from 37.9% in 1978 to 35.5% in 2000, based on a single year’s earnings, while theratio based on five-year average earnings decreased 0.1%, from 42.5% to 42.4%.Row 3 indicates that the median payout ratio increased 2.2%, from 26.2% to 28.4%,based on the one-year earnings measure, and decreased 0.7%, from 31.1% to 30.4%,based on five-year average earnings. For the constant composition sample in rows 4
ARTICLE IN PRESS
3Fama and French (2001a) use ‘‘reduced propensity to pay’’ in a different sense, to represent the idea
that there are now more firms that pay zero dividends than would have done so historically based on their
economic fundamentals. The payout ratio evidence discussed below is consistent with that of Fama and
French (2001a, p. 38) who find no indication of a decline over 1978–1998 in the ratio of aggregate
dividends to the total earnings of payers.4When we calculate an aggregate dividend payout ratio using the summed earnings of all payers and
nonpayers with positive earnings, we find a decline from 36.4% in 1978 to 25.2% in 2000 (from 41.4% to
33.7% using five-year average earnings). But these declines reflect the fact that the earnings divisor of this
payout ratio includes the positive earnings of firms that paid no dividends in 2000, including a small
number of very large earners such as Microsoft, which we discuss in Section 5. Hence, these declines are
not evidence that firms that do pay dividends now have lower payout ratios.
H. DeAngelo et al. / Journal of Financial Economics 72 (2004) 425–456 441
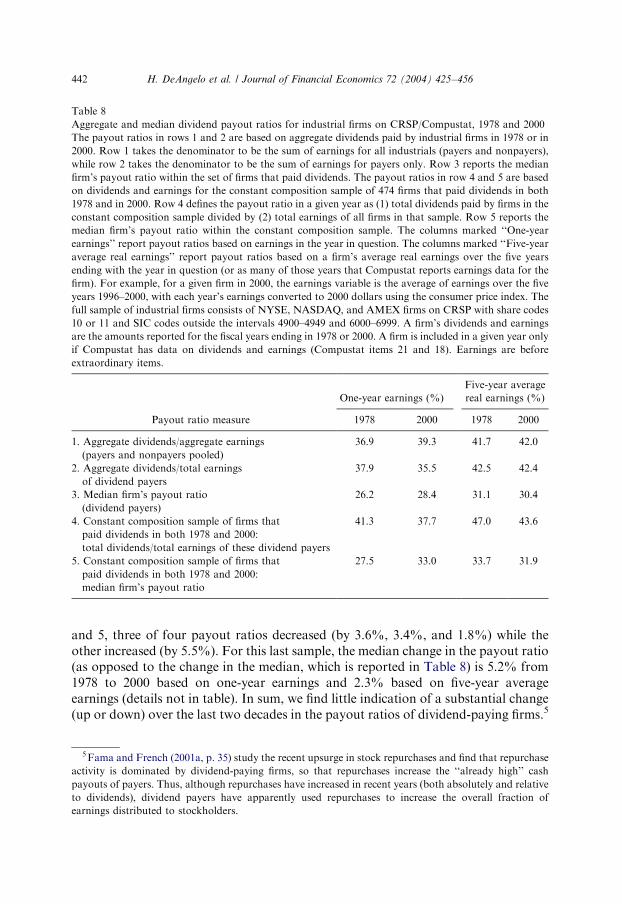
and 5, three of four payout ratios decreased (by 3.6%, 3.4%, and 1.8%) while theother increased (by 5.5%). For this last sample, the median change in the payout ratio(as opposed to the change in the median, which is reported in Table 8) is 5.2% from1978 to 2000 based on one-year earnings and 2.3% based on five-year averageearnings (details not in table). In sum, we find little indication of a substantial change(up or down) over the last two decades in the payout ratios of dividend-paying firms.5
ARTICLE IN PRESS
Table 8
Aggregate and median dividend payout ratios for industrial firms on CRSP/Compustat, 1978 and 2000
The payout ratios in rows 1 and 2 are based on aggregate dividends paid by industrial firms in 1978 or in
2000. Row 1 takes the denominator to be the sum of earnings for all industrials (payers and nonpayers),
while row 2 takes the denominator to be the sum of earnings for payers only. Row 3 reports the median
firm’s payout ratio within the set of firms that paid dividends. The payout ratios in row 4 and 5 are based
on dividends and earnings for the constant composition sample of 474 firms that paid dividends in both
1978 and in 2000. Row 4 defines the payout ratio in a given year as (1) total dividends paid by firms in the
constant composition sample divided by (2) total earnings of all firms in that sample. Row 5 reports the
median firm’s payout ratio within the constant composition sample. The columns marked ‘‘One-year
earnings’’ report payout ratios based on earnings in the year in question. The columns marked ‘‘Five-year
average real earnings’’ report payout ratios based on a firm’s average real earnings over the five years
ending with the year in question (or as many of those years that Compustat reports earnings data for the
firm). For example, for a given firm in 2000, the earnings variable is the average of earnings over the five
years 1996–2000, with each year’s earnings converted to 2000 dollars using the consumer price index. The
full sample of industrial firms consists of NYSE, NASDAQ, and AMEX firms on CRSP with share codes
10 or 11 and SIC codes outside the intervals 4900–4949 and 6000–6999. A firm’s dividends and earnings
are the amounts reported for the fiscal years ending in 1978 or 2000. A firm is included in a given year only
if Compustat has data on dividends and earnings (Compustat items 21 and 18). Earnings are before
extraordinary items.
Five-year average
One-year earnings (%) real earnings (%)
Payout ratio measure 1978 2000 1978 2000
1. Aggregate dividends/aggregate earnings
(payers and nonpayers pooled)
36.9 39.3 41.7 42.0
2. Aggregate dividends/total earnings
of dividend payers
37.9 35.5 42.5 42.4
3. Median firm’s payout ratio
(dividend payers)
26.2 28.4 31.1 30.4
4. Constant composition sample of firms that
paid dividends in both 1978 and 2000:
total dividends/total earnings of these dividend payers
41.3 37.7 47.0 43.6
5. Constant composition sample of firms that
paid dividends in both 1978 and 2000:
median firm’s payout ratio
27.5 33.0 33.7 31.9
5Fama and French (2001a, p. 35) study the recent upsurge in stock repurchases and find that repurchase
activity is dominated by dividend-paying firms, so that repurchases increase the ‘‘already high’’ cash
payouts of payers. Thus, although repurchases have increased in recent years (both absolutely and relative
to dividends), dividend payers have apparently used repurchases to increase the overall fraction of
earnings distributed to stockholders.
H. DeAngelo et al. / Journal of Financial Economics 72 (2004) 425–456442
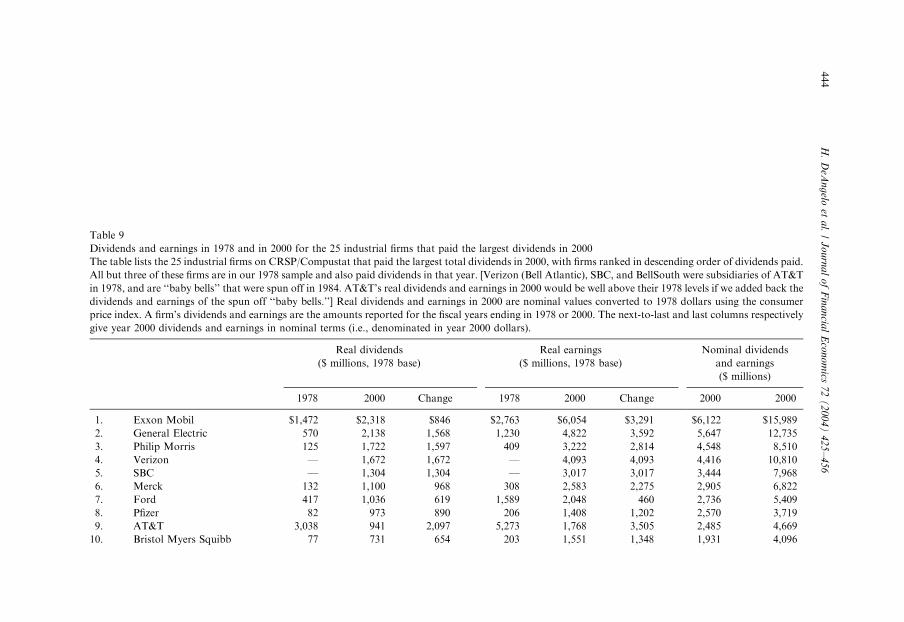
5. The identity of the top payers, nonpayers, and earners in 2000
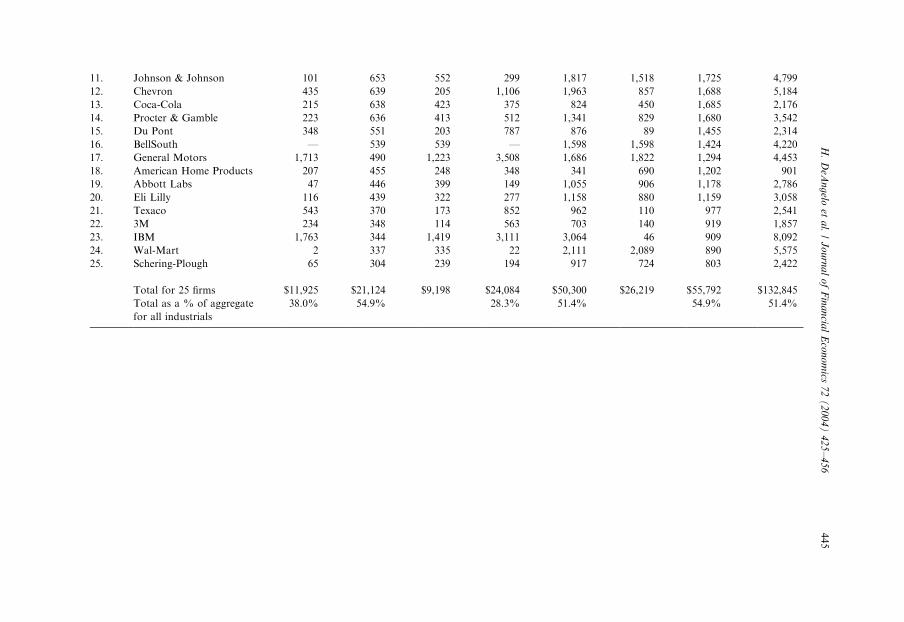
Table 9 identifies the 25 industrials that paid the largest dividends in 2000, rankedin descending order of dividends paid. These primary dividend suppliers are well-established firms such as Exxon Mobil and General Electric, with 14 of the 25included in the Dow Jones Industrial Average (DJIA). The top 25 payers distributed54.9% of aggregate industrial dividends in 2000, and their $9.2 billion real dividendincrease over 1978–2000 markedly exceeds the $7.1 billion aggregate increase forindustrials as a whole (per Table 2). Their dominance of the aggregate dividendsupply reflects these 25 firms’ $50.3 billion in real earnings ($132.8 billion in year2000 dollars), which is 51.4% of aggregate industrial earnings, and represents a $26.2billion real earnings increase from 1978 to 2000. Nineteen of the top 25 payers had $1billion-plus in real earnings for 2000, and the real earnings increases of the top threealone totaled $9.7 billion over 1978–2000. In short, a handful of ‘‘old line’’ firms nowboth generates over half of industrial earnings and dominates the associated supplyof dividends.
While earnings concentration is striking among dividend payers, it is also veryhigh among nonpayers. Table 10 ranks the 25 nonpayers with the highest 2000earnings, and reports their cumulative share of the earnings of all nonpayers withpositive income. Four nonpayers—Microsoft, the only nonpayer in the DJIA,Oracle, WorldCom, and Cisco—reported real earnings of more than $1 billion in2000, and these firms alone account for 20.6% of all positive earnings of nonpayers.The top 10 and top 25 nonpayers respectively generated 31.0% and 43.2% of suchearnings, and just 39 nonpayers accounted for a majority (50.1%, not reported inTable 10).6 That a handful of technology firms dominates the earnings of nonpayersis clear from scanning the identities of the 25 firms in Table 10, and any dampeningof the aggregate dividend supply in recent years is due in no small part to their failureto initiate dividends.
These firms’ decisions to forgo dividends more likely reflect their continued highgrowth prospects than a reduced propensity to pay dividends and, as their growthprospects decline, they will likely come under pressure to pay dividends. Microsoft,widely viewed as a bellwether technology company, has recently announced plans toinstitute a regular dividend, and Qualcomm and Fedex have also initiated dividends,so that three of the top 25 nonpayers in Table 10 would now be reclassified as payers.Additionally, the numerous corporate scandals uncovered in the last year or so mayprompt growth firms to initiate dividends at an earlier stage, in order to increaseinvestor confidence in their reported earnings. Moreover, President Bush’s January2003 proposal to eliminate the dividend tax penalty would, if enacted, surely putmore pressure on firms to pay dividends. All these recent developments suggest thata future reversal of the decline in the number of dividend-paying industrials is areasonable possibility.
ARTICLE IN PRESS
6The earnings of the top 25 nonpayers represent 11.7% of the earnings of all firms (payers and
nonpayers combined) with positive income, and 18.3% of aggregate industrial earnings.
H. DeAngelo et al. / Journal of Financial Economics 72 (2004) 425–456 443
ARTIC
LEIN
PRES
S
Table 9
Dividends and earnings in 1978 and in 2000 for the 25 industrial firms that paid the largest dividends in 2000
The table lists the 25 industrial firms on CRSP/Compustat that paid the largest total dividends in 2000, with firms ranked in descending order of dividends paid.
All but three of these firms are in our 1978 sample and also paid dividends in that year. [Verizon (Bell Atlantic), SBC, and BellSouth were subsidiaries of AT&T
in 1978, and are ‘‘baby bells’’ that were spun off in 1984. AT&T’s real dividends and earnings in 2000 would be well above their 1978 levels if we added back the
dividends and earnings of the spun off ‘‘baby bells.’’] Real dividends and earnings in 2000 are nominal values converted to 1978 dollars using the consumer
price index. A firm’s dividends and earnings are the amounts reported for the fiscal years ending in 1978 or 2000. The next-to-last and last columns respectively
give year 2000 dividends and earnings in nominal terms (i.e., denominated in year 2000 dollars).
Real dividends Real earnings Nominal dividends
($ millions, 1978 base) ($ millions, 1978 base) and earnings
($ millions)
1978 2000 Change 1978 2000 Change 2000 2000
1. Exxon Mobil $1,472 $2,318 $846 $2,763 $6,054 $3,291 $6,122 $15,989
2. General Electric 570 2,138 1,568 1,230 4,822 3,592 5,647 12,735
3. Philip Morris 125 1,722 1,597 409 3,222 2,814 4,548 8,510
4. Verizon — 1,672 1,672 — 4,093 4,093 4,416 10,810
5. SBC — 1,304 1,304 — 3,017 3,017 3,444 7,968
6. Merck 132 1,100 968 308 2,583 2,275 2,905 6,822
7. Ford 417 1,036 619 1,589 2,048 460 2,736 5,409
8. Pfizer 82 973 890 206 1,408 1,202 2,570 3,719
9. AT&T 3,038 941 �2,097 5,273 1,768 �3,505 2,485 4,669
10. Bristol Myers Squibb 77 731 654 203 1,551 1,348 1,931 4,096
H.
DeA
ng
eloet
al.
/J
ou
rna
lo
fF
ina
ncia
lE
con
om
ics7
2(
20
04
)4
25
–4
56
444
ARTIC
LEIN
PRES
S11. Johnson & Johnson 101 653 552 299 1,817 1,518 1,725 4,799
12. Chevron 435 639 205 1,106 1,963 857 1,688 5,184
13. Coca-Cola 215 638 423 375 824 450 1,685 2,176
14. Procter & Gamble 223 636 413 512 1,341 829 1,680 3,542
15. Du Pont 348 551 203 787 876 89 1,455 2,314
16. BellSouth — 539 539 — 1,598 1,598 1,424 4,220
17. General Motors 1,713 490 �1,223 3,508 1,686 �1,822 1,294 4,453
18. American Home Products 207 455 248 348 �341 �690 1,202 �901
19. Abbott Labs 47 446 399 149 1,055 906 1,178 2,786
20. Eli Lilly 116 439 322 277 1,158 880 1,159 3,058
21. Texaco 543 370 �173 852 962 110 977 2,541
22. 3M 234 348 114 563 703 140 919 1,857
23. IBM 1,763 344 �1,419 3,111 3,064 �46 909 8,092
24. Wal-Mart 2 337 335 22 2,111 2,089 890 5,575
25. Schering-Plough 65 304 239 194 917 724 803 2,422
Total for 25 firms $11,925 $21,124 $9,198 $24,084 $50,300 $26,219 $55,792 $132,845
Total as a % of aggregate 38.0% 54.9% 28.3% 51.4% 54.9% 51.4%
for all industrials
H.
DeA
ng
eloet
al.
/J
ou
rna
lo
fF
ina
ncia
lE
con
om
ics7
2(
20
04
)4
25
–4
56
445
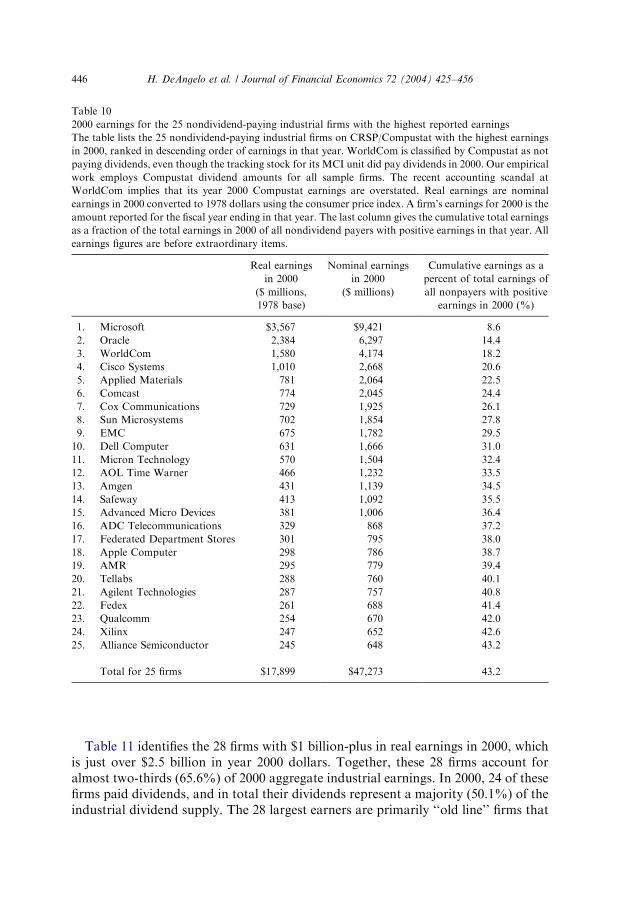
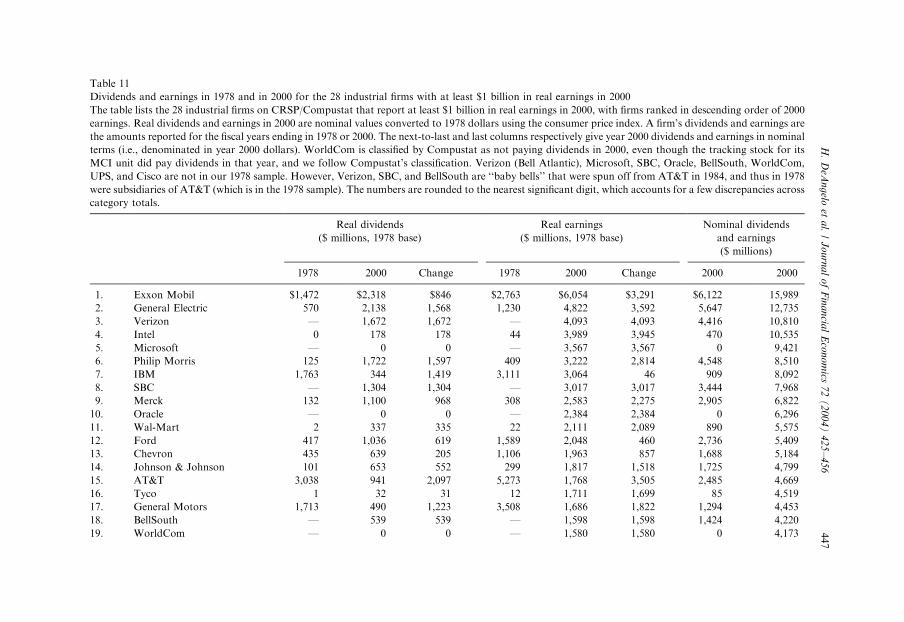
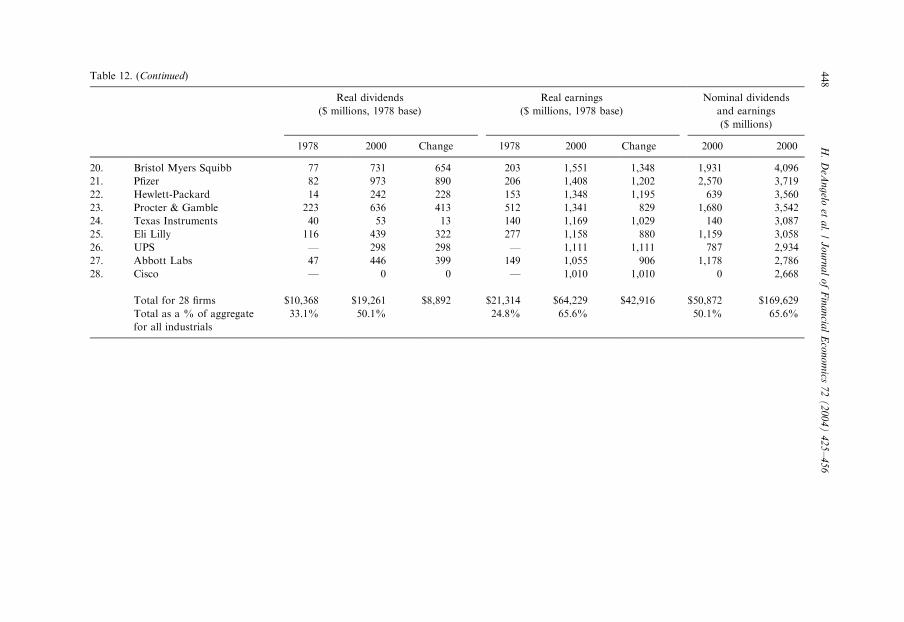
Table 11 identifies the 28 firms with $1 billion-plus in real earnings in 2000, whichis just over $2.5 billion in year 2000 dollars. Together, these 28 firms account foralmost two-thirds (65.6%) of 2000 aggregate industrial earnings. In 2000, 24 of thesefirms paid dividends, and in total their dividends represent a majority (50.1%) of theindustrial dividend supply. The 28 largest earners are primarily ‘‘old line’’ firms that
ARTICLE IN PRESS
Table 10
2000 earnings for the 25 nondividend-paying industrial firms with the highest reported earnings
The table lists the 25 nondividend-paying industrial firms on CRSP/Compustat with the highest earnings
in 2000, ranked in descending order of earnings in that year. WorldCom is classified by Compustat as not
paying dividends, even though the tracking stock for its MCI unit did pay dividends in 2000. Our empirical
work employs Compustat dividend amounts for all sample firms. The recent accounting scandal at
WorldCom implies that its year 2000 Compustat earnings are overstated. Real earnings are nominal
earnings in 2000 converted to 1978 dollars using the consumer price index. A firm’s earnings for 2000 is the
amount reported for the fiscal year ending in that year. The last column gives the cumulative total earnings
as a fraction of the total earnings in 2000 of all nondividend payers with positive earnings in that year. All
earnings figures are before extraordinary items.
Real earnings Nominal earnings Cumulative earnings as a
in 2000 in 2000 percent of total earnings of
($ millions, ($ millions) all nonpayers with positive
1978 base) earnings in 2000 (%)
1. Microsoft $3,567 $9,421 8.6
2. Oracle 2,384 6,297 14.4
3. WorldCom 1,580 4,174 18.2
4. Cisco Systems 1,010 2,668 20.6
5. Applied Materials 781 2,064 22.5
6. Comcast 774 2,045 24.4
7. Cox Communications 729 1,925 26.1
8. Sun Microsystems 702 1,854 27.8
9. EMC 675 1,782 29.5
10. Dell Computer 631 1,666 31.0
11. Micron Technology 570 1,504 32.4
12. AOL Time Warner 466 1,232 33.5
13. Amgen 431 1,139 34.5
14. Safeway 413 1,092 35.5
15. Advanced Micro Devices 381 1,006 36.4
16. ADC Telecommunications 329 868 37.2
17. Federated Department Stores 301 795 38.0
18. Apple Computer 298 786 38.7
19. AMR 295 779 39.4
20. Tellabs 288 760 40.1
21. Agilent Technologies 287 757 40.8
22. Fedex 261 688 41.4
23. Qualcomm 254 670 42.0
24. Xilinx 247 652 42.6
25. Alliance Semiconductor 245 648 43.2
Total for 25 firms $17,899 $47,273 43.2
H. DeAngelo et al. / Journal of Financial Economics 72 (2004) 425–456446
ARTIC
LEIN
PRES
S
Table 11
Dividends and earnings in 1978 and in 2000 for the 28 industrial firms with at least $1 billion in real earnings in 2000
The table lists the 28 industrial firms on CRSP/Compustat that report at least $1 billion in real earnings in 2000, with firms ranked in descending order of 2000
earnings. Real dividends and earnings in 2000 are nominal values converted to 1978 dollars using the consumer price index. A firm’s dividends and earnings are
the amounts reported for the fiscal years ending in 1978 or 2000. The next-to-last and last columns respectively give year 2000 dividends and earnings in nominal
terms (i.e., denominated in year 2000 dollars). WorldCom is classified by Compustat as not paying dividends in 2000, even though the tracking stock for its
MCI unit did pay dividends in that year, and we follow Compustat’s classification. Verizon (Bell Atlantic), Microsoft, SBC, Oracle, BellSouth, WorldCom,
UPS, and Cisco are not in our 1978 sample. However, Verizon, SBC, and BellSouth are ‘‘baby bells’’ that were spun off from AT&T in 1984, and thus in 1978
were subsidiaries of AT&T (which is in the 1978 sample). The numbers are rounded to the nearest significant digit, which accounts for a few discrepancies across
category totals.
Real dividends Real earnings Nominal dividends
($ millions, 1978 base) ($ millions, 1978 base) and earnings
($ millions)
1978 2000 Change 1978 2000 Change 2000 2000
1. Exxon Mobil $1,472 $2,318 $846 $2,763 $6,054 $3,291 $6,122 15,989
2. General Electric 570 2,138 1,568 1,230 4,822 3,592 5,647 12,735
3. Verizon — 1,672 1,672 — 4,093 4,093 4,416 10,810
4. Intel 0 178 178 44 3,989 3,945 470 10,535
5. Microsoft — 0 0 — 3,567 3,567 0 9,421
6. Philip Morris 125 1,722 1,597 409 3,222 2,814 4,548 8,510
7. IBM 1,763 344 �1,419 3,111 3,064 �46 909 8,092
8. SBC — 1,304 1,304 — 3,017 3,017 3,444 7,968
9. Merck 132 1,100 968 308 2,583 2,275 2,905 6,822
10. Oracle — 0 0 — 2,384 2,384 0 6,296
11. Wal-Mart 2 337 335 22 2,111 2,089 890 5,575
12. Ford 417 1,036 619 1,589 2,048 460 2,736 5,409
13. Chevron 435 639 205 1,106 1,963 857 1,688 5,184
14. Johnson & Johnson 101 653 552 299 1,817 1,518 1,725 4,799
15. AT&T 3,038 941 �2,097 5,273 1,768 �3,505 2,485 4,669
16. Tyco 1 32 31 12 1,711 1,699 85 4,519
17. General Motors 1,713 490 �1,223 3,508 1,686 �1,822 1,294 4,453
18. BellSouth — 539 539 — 1,598 1,598 1,424 4,220
19. WorldCom — 0 0 — 1,580 1,580 0 4,173
H.
DeA
ng
eloet
al.
/J
ou
rna
lo
fF
ina
ncia
lE
con
om
ics7
2(
20
04
)4
25
–4
56
447
ARTIC
LEIN
PRES
STable 12. (Continued)
Real dividends Real earnings Nominal dividends
($ millions, 1978 base) ($ millions, 1978 base) and earnings
($ millions)
1978 2000 Change 1978 2000 Change 2000 2000
20. Bristol Myers Squibb 77 731 654 203 1,551 1,348 1,931 4,096
21. Pfizer 82 973 890 206 1,408 1,202 2,570 3,719
22. Hewlett-Packard 14 242 228 153 1,348 1,195 639 3,560
23. Procter & Gamble 223 636 413 512 1,341 829 1,680 3,542
24. Texas Instruments 40 53 13 140 1,169 1,029 140 3,087
25. Eli Lilly 116 439 322 277 1,158 880 1,159 3,058
26. UPS — 298 298 — 1,111 1,111 787 2,934
27. Abbott Labs 47 446 399 149 1,055 906 1,178 2,786
28. Cisco — 0 0 — 1,010 1,010 0 2,668
Total for 28 firms $10,368 $19,261 $8,892 $21,314 $64,229 $42,916 $50,872 $169,629
Total as a % of aggregate 33.1% 50.1% 24.8% 65.6% 50.1% 65.6%
for all industrials
H.
DeA
ng
eloet
al.
/J
ou
rna
lo
fF
ina
ncia
lE
con
om
ics7
2(
20
04
)4
25
–4
56
448
pay very large dividends, but they also include some profitable younger technologyfirms that pay either modest or no dividends. Of the four large earners that failedto pay 2000 dividends, Microsoft has since initiated a dividend, Oracle and Ciscohave said they would consider doing so, and WorldCom’s accounting fraud impliesthat its #19 ranking in Table 11 substantially overstates its true earnings position in2000.
Overall, industrial firms are characterized by a two-tier structure based onearnings, with 25 or so firms (about one-half of 1% of all industrials) accounting formost earnings and dividends in 2000, and with the vast majority of firms collectivelydelivering small earnings and dividends. Tables 9–11 show that the top handful ofearners generated the bulk of corporate earnings and, despite some large earners likeMicrosoft that did not pay dividends, also supplied the majority of industrialdividends in 2000. We also know from Table 6 that 3,726 firms or 77.7% of allindustrial firms in 2000 individually earned $10 million or less, and these firms as agroup lost about $50 billion. These 3,726 firms paid total dividends of $2.1 billion, or5.5% of the aggregate industrial supply. More than half of this $2.1 billion total waspaid by seven large firms with current losses or very low earnings, and more thanthree-quarters was paid by 30 firms in a similar situation (including American HomeProducts, Xerox, Lockheed, USX, Dow Jones, and Pennzoil). Therefore, in 2000,some 3,700 firms (over three-quarters by number) collectively paid dividends ofabout $0.5 billion (1.3% of the aggregate), whereas the top 25 payers (0.5% bynumber) paid roughly 40 times that amount.
6. What happened to the dividend payers of 1978?
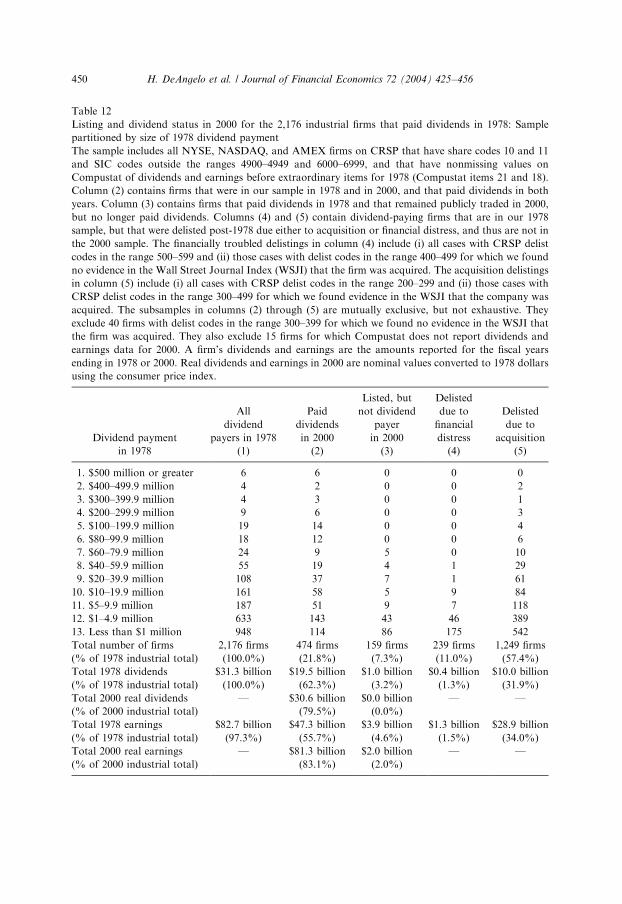
Table 12 classifies the 2,176 firms that paid dividends in 1978 (column (1))according to whether they also paid dividends in 2000 (column (2)), remained listedin 2000 but did not pay dividends in that year (column (3)), and the primary reasonsfor delisting, either financial distress (column (4)) or acquisition (column (5)).Financially distressed delists include all firms with CRSP delist codes 500–599(delisted or stopped trading) or 400–499 delist codes (liquidations) for which TheWall Street Journal Index (WSJI) provides no clear indication that the firm wasacquired. Acquisition delists include all firms with delist codes 200–299 (mergers), or300–499 (security exchanges and liquidations) for which the WSJI indicates that thecompany was acquired.7
Although much reduced in number, the set of 474 firms that paid dividends inboth 1978 and 2000 accounts for a large majority of industrial dividends andearnings in 2000 (79.5% and 83.1% respectively)—another manifestation of the fact
ARTICLE IN PRESS
7This classification scheme is similar to that of Fama and French (2001b, Table 4), who treat codes 200–
399 as delisted due to merger and 400–599 as delisted for ‘‘cause’’. The 1,647 firm total of columns (3)–(5)
in our Table 12 falls 55 firms short of the 1,702 firm difference between columns (1) and (2). The reason is
that we omit 40 delists with codes 300–399 that the WSJI did not show as acquired and 15 firms without
dividends and earnings on Compustat for 2000. The former firms had paid $136 million in 1978 dividends,
while the latter had paid $254 million.
H. DeAngelo et al. / Journal of Financial Economics 72 (2004) 425–456 449
ARTICLE IN PRESS
Table 12
Listing and dividend status in 2000 for the 2,176 industrial firms that paid dividends in 1978: Sample
partitioned by size of 1978 dividend payment
The sample includes all NYSE, NASDAQ, and AMEX firms on CRSP that have share codes 10 and 11
and SIC codes outside the ranges 4900–4949 and 6000–6999, and that have nonmissing values on
Compustat of dividends and earnings before extraordinary items for 1978 (Compustat items 21 and 18).
Column (2) contains firms that were in our sample in 1978 and in 2000, and that paid dividends in both
years. Column (3) contains firms that paid dividends in 1978 and that remained publicly traded in 2000,
but no longer paid dividends. Columns (4) and (5) contain dividend-paying firms that are in our 1978
sample, but that were delisted post-1978 due either to acquisition or financial distress, and thus are not in
the 2000 sample. The financially troubled delistings in column (4) include (i) all cases with CRSP delist
codes in the range 500–599 and (ii) those cases with delist codes in the range 400–499 for which we found
no evidence in the Wall Street Journal Index (WSJI) that the firm was acquired. The acquisition delistings
in column (5) include (i) all cases with CRSP delist codes in the range 200–299 and (ii) those cases with
CRSP delist codes in the range 300–499 for which we found evidence in the WSJI that the company was
acquired. The subsamples in columns (2) through (5) are mutually exclusive, but not exhaustive. They
exclude 40 firms with delist codes in the range 300–399 for which we found no evidence in the WSJI that
the firm was acquired. They also exclude 15 firms for which Compustat does not report dividends and
earnings data for 2000. A firm’s dividends and earnings are the amounts reported for the fiscal years
ending in 1978 or 2000. Real dividends and earnings in 2000 are nominal values converted to 1978 dollars
using the consumer price index.
Listed, but Delisted
All
dividend
Paid
dividends
not dividend
payer
due to
financial
Delisted
due to
Dividend payment payers in 1978 in 2000 in 2000 distress acquisition
in 1978 (1) (2) (3) (4) (5)
1. $500 million or greater 6 6 0 0 0
2. $400–499.9 million 4 2 0 0 2
3. $300–399.9 million 4 3 0 0 1
4. $200–299.9 million 9 6 0 0 3
5. $100–199.9 million 19 14 0 0 4
6. $80–99.9 million 18 12 0 0 6
7. $60–79.9 million 24 9 5 0 10
8. $40–59.9 million 55 19 4 1 29
9. $20–39.9 million 108 37 7 1 61
10. $10–19.9 million 161 58 5 9 84
11. $5–9.9 million 187 51 9 7 118
12. $1–4.9 million 633 143 43 46 389
13. Less than $1 million 948 114 86 175 542
Total number of firms 2,176 firms 474 firms 159 firms 239 firms 1,249 firms
(% of 1978 industrial total) (100.0%) (21.8%) (7.3%) (11.0%) (57.4%)
Total 1978 dividends $31.3 billion $19.5 billion $1.0 billion $0.4 billion $10.0 billion
(% of 1978 industrial total) (100.0%) (62.3%) (3.2%) (1.3%) (31.9%)
Total 2000 real dividends — $30.6 billion $0.0 billion — —
(% of 2000 industrial total) (79.5%) (0.0%)
Total 1978 earnings $82.7 billion $47.3 billion $3.9 billion $1.3 billion $28.9 billion
(% of 1978 industrial total) (97.3%) (55.7%) (4.6%) (1.5%) (34.0%)
Total 2000 real earnings — $81.3 billion $2.0 billion — —
(% of 2000 industrial total) (83.1%) (2.0%)
H. DeAngelo et al. / Journal of Financial Economics 72 (2004) 425–456450
that dividends and earnings are highly concentrated among ‘‘old line’’ firms. The 159firms that stopped paying dividends between 1978 and 2000 had paid only $1.0billion (3.2% of the aggregate) in 1978. These firms’ 2000 nonpayments reflectfinancial distress for at least some companies, since 2000 total earnings were nearly50% below 1978 earnings for this group. Most of the 239 financially distressed delistswere small payers, with 221 firms (92.5%) having paid $5 million or less, and thesefirms’ 1978 dividends totaled $0.4 billion, or 1.3% of the aggregate. So, whilefinancial distress and earnings difficulties together reduced the number of dividendpayers by 398 firms between 1978 and 2000, the associated dividend loss is just $1.4billion. The $10.0 billion (31.9%) dividend loss from acquisition delists is markedlylarger, as is the loss in the number of payers due to acquisitions (1,249 firms, or57.4% of the 1978 payers).
While acquisitions are thus the primary, and financial distress the secondary,reason why so many 1978 payers no longer disburse dividends, these two factorsaffect aggregate dividends in different ways. The dividends of financially distressedfirms are lost, whereas in many cases an acquired firm’s dividends are not lost, butare simply relabeled. For example, the issuance of acquirer shares to targetstockholders increases the acquirer’s total dividend, and thereby continues thetarget’s dividend at least in part.8 Exxon and Mobil respectively paid $4.0 billion and$1.8 billion in 1998 dividends, while after their November 1999 merger, the newExxon Mobil paid $6.1 billion in 2000 dividends. In the aggregate, such acquisitionsdo not eliminate dividends, but simply channel them to investors through a smallernumber of firms. Thus, acquisitions reduce the number of dividend-paying firms withno necessary reduction in aggregate dividends, a point that carries specialsignificance here because the post-1978 decline in the number of payers occurredduring a massive merger wave.
In fact, the merger wave of the 1980s and 1990s explains a substantial portionof the decline in the number of dividend payers over 1978–2000. The abnormalnumber of delists attributable to the merger wave equals the actual merger delists(1,249 firms, per Table 12) minus the number of mergers that would have occurred,absent the wave. Fama and French (2001a, Table 2) report that dividend payers wereacquired at average annual rates of 3.9% over 1978–1999, 2.7% over 1963–1977,and 0.6% over 1927–1962. The normal merger rate probably lies somewherebetween 0.6% and 2.7% since 1927–1962 is a wave-free period, while 1963–1977includes the conglomerate wave. If 0.6% is the relevant benchmark, the abnormaldelists attributable to the recent merger wave is 979 firms, and it is 265 firms if 2.7%is the appropriate benchmark.9 In either case, a reasonable portion of the actual
ARTICLE IN PRESS
8Acquisitions for stock were especially prevalent in the 1990s. Andrade et al. (2001, pp. 104–106) report
that 57.8% of acquisitions over 1990–1998 were for all stock, while 70.9% involved at least some stock.
They also report that, during the 1980s, 32.9% of acquisitions were for all stock, and 45.6% involved some
stock.9We calculate the expected attrition (compounded at either 0.6% or 2.7%) over 22 years starting from a
base of 2,176 firms, the number of 1978 payers. The abnormal number of acquisitions equals 1,249minus
the expected attrition. The expected attrition at Fama and French’s 3.9% merger rate over 1978–1999 is
1,269 firms, which is virtually identical to the 1,249-firm decline in Table 12.
H. DeAngelo et al. / Journal of Financial Economics 72 (2004) 425–456 451
merger delists, hence of the decline in the number of dividend payers, is due tothe recent merger wave. However, as Fama and French (2001a, p.11) point out,since dividend payers and nonpayers were acquired at about the same rates duringthe last two decades, acquisitions cannot explain the decline in the proportion ofpayers.
7. Summary and implications
This paper reports evidence that industrial firms’ dividends are highlyconcentrated, and that dividend concentration has increased over the past twodecades. We document that, while many fewer firms paid dividends in 2000 than didso in 1978, aggregate real dividends increased over that period. The combination of adecreased number of payers and increased aggregate dividends reflects high andincreased earnings concentration. In 2000, most firms with very high earnings paiddividends, and the increased real earnings of the largest dividend payers isresponsible for the aggregate increase in dividends and the concomitant increase individend concentration over 1978–2000. In 2000, nearly half of industrial firmsreported losses and, as one would expect, few of these firms paid dividends. Thedecline over 1978–2000 in the number of dividend payers occurred predominantlyamong firms that previously paid very small real dividends, and is due primarily toacquisitions and secondarily to financial distress. For example, we find that 57.4% ofthe firms that paid dividends in 1978 were subsequently delisted because they wereacquired, and that the abnormal level of acquisitions during the recent mergerwave accounts for much, but not all, of the decline in the number of payers. We alsofind that the payout ratios of firms that pay dividends exhibit little change over1978–2000.
These findings collectively suggest that the decline in dividend payers over 1978–2000 is not attributable to factors that put across-the-board downward pressure ondividends or on payout ratios. For example, income tax law changes cannotplausibly underlie the decline in payers, since any increase in the dividend tax penaltythat led many more firms to pay zero dividends also should have led dividend payersto markedly reduce their payout ratios, and we observe no such reduction. The samelogic implies that the sharp reduction in the number of payers was not caused bydemand- and/or supply related factors that generated a cross-sectionally pervasivereduction in the marginal incentive to pay dividends. This inference is reinforced bythe fact that the earnings of nonpayers, like those of payers, are highly concentrated,with 25 firms accounting for almost half the total earnings of all nonpayers withpositive earnings in 2000. Over one-third of these total earnings come from just 13firms with a strong technology bent: Microsoft, Oracle, WorldCom, Cisco, AppliedMaterials, Comcast, Cox Communications, Sun, EMC, Dell, Micron Technology,AOL Time Warner, and Amgen. The decision to forgo dividends by high growthtechnology firms with substantial earnings more likely reflects industry-specificinvestment opportunities rather than economy-wide factors that reduced all firms’incentives to pay dividends.
ARTICLE IN PRESSH. DeAngelo et al. / Journal of Financial Economics 72 (2004) 425–456452
Our findings on dividend concentration cast doubt on the empirical importance ofthe dividend clientele and signaling hypotheses (Allen and Michaely, 1995, surveythe extensive literatures on these two hypotheses). Clientele theories attributeheterogeneity in dividend policies to the demands of different investors who, for taxor behavioral reasons, prefer either to hold or to avoid dividend-paying stocks. Blackand Scholes (1974) discuss the difficulties of forming well-diversified portfolios ofstocks that pay either high or low dividends, and note the dearth of nondividendpayers to service the demands of the many investors who prefer capital gains. Whileon the surface the large increase since the late 1970s in the number of nondividend-paying firms might appear to rectify this shortcoming, the attributes of the currentpopulation of nonpayers suggest that well-diversified portfolios of their stocks arenot easily constructed. Among nonpayers in 2000, the majority of firms has negativeearnings averaged over 1996–2000, many are newly listed growth firms, and manyare from the technology sector. Even if some investors could construct well-diversified but dividend-free portfolios from this population, it is questionablewhether the aggregate demands of all clienteles seeking to invest in such portfolioscould be met, given the substantial dividend concentration that characterizes today’sstock market.
If the demand to satisfy heterogeneous clienteles were truly a first-orderdeterminant of dividend policies, we would expect to observe substantial dividendheterogeneity among the prominent firms whose securities are important compo-nents of well-diversified portfolios. As long as high tax bracket investors desire toinvest substantial amounts of wealth, we should observe a comparably large set ofprominent firms that do not pay dividends, and these nonpayers should be spreadacross a broad spectrum of industries. And, within any given industry, we should seea mix of large dividend-paying and nonpaying firms. What we observe, instead, is (i)few firms with very high earnings fail to pay dividends, (ii) these firms are mainlybunched in a narrow industry sector (technology), and (iii) very large firms in otherindustries all tend to pay dividends. The fact that the market does not supply a broadspectrum of dividend heterogeneity either across or within industries suggests thatpressure to satisfy heterogeneous clienteles is at best a second-order determinant ofdividend decisions. It would seem to follow that clientele pressure can have a majorimpact only in unusual circumstances, for example, when a controlling stockholder’spreferences shape a given firm’s dividend policy as, e.g., in DeAngelo and DeAngelo(2000).
Our finding that dividends are highly concentrated among a small number of firmswith substantial earnings also raises doubts that signaling is a first-order determinantof corporate dividend policy. If managers use dividends to communicate withstockholders, dividend signaling should occur primarily in small, relatively unknownfirms with limited access to the financial press, Wall Street analysts, and otherconventional information dissemination outlets. But the vast majority of dividendsare paid by prominent corporations like Exxon Mobil and General Electric thatenjoy major coverage by analysts and journalists—exactly the firms whose managersshould have little need to use financial decisions to communicate with investors. Howmuch of aggregate dividends can be motivated by signaling when 92.0% of industrial
ARTICLE IN PRESSH. DeAngelo et al. / Journal of Financial Economics 72 (2004) 425–456 453
dividends are paid by the top 200 dividend payers? While it is possible that signalingmotives may be important on the margin for some prominent dividend-paying firms,it is hard to envision plausible scenarios in which a material portion of aggregatedividends reflects signaling motives.
Our evidence on the high and increasing level of dividend concentration adds to agrowing body of empirical research that documents major changes in corporatepayout practices over the last 25–50 years. Prior studies have identified a number ofother important trends, including (i) a marked reduction in the 1970s in thesensitivity of dividends to earnings, as evidenced by a decline in the typical Lintner(1956) speed-of-adjustment coefficient coupled with target payout ratio stabilityfrom the late 1940s through at least the mid-1980s (Choe, 1990, 1991), (ii) the virtualdisappearance of special dividends in recent years, despite their prominence in the1950s and earlier (DeAngelo et al., 2000), (iii) a reduction in firms’ propensity to paydividends over the last two decades of the 20th century (Fama and French, 2001a),(iv) the emergence of stock repurchase as a popular payout technique in the 1960sand early 1970s (Dann, 1981; Masulis, 1980; Vermaelen, 1981), and (v) the massiveincrease in repurchase activity in the mid-1980s (Bagwell and Shoven, 1989; Allenand Michaely, 1995). The interplay of these trends and their possible relation to thehigh and increasing concentration of earnings documented here are issues that meritfuture investigation.
Finally, our evidence reveals that publicly traded industrial firms exhibit a two-tierstructure based on dollar earnings. The first tier contains a few very high earners,most of which pay dividends, and these firms’ dividends collectively dominate theaggregate supply. The second tier contains many firms which, individually andjointly, have modest earnings and which collectively contribute little to the aggregatedividend supply. In essence, the differing behavior of first- and second-tier firmsexplains why aggregate dividends increased as the number of payers declined overthe past two decades. The two-tier structure also raises a possible inconsistencybetween the findings of Lintner (1956) and Fama and Babiak (1968) and dividendtheories in which supply adjustments play a central role. For example, the Black andScholes’ (1974) equilibrium would seem to periodically require material dividendchanges by first-tier firms, since second-tier companies’ collective dividends aresmall. But Lintner and Fama and Babiak show that such well-established firms tendto adjust dividends only marginally and then primarily upward in response to theirown earnings increases. The interesting empirical question is whether the apparently‘‘sticky’’ dividend practices of first-tier firms exhibit sufficient variation (in bothdirections) to provide the supply adjustments critical to the Black and Scholesdividend theory.
The two-tier structure is perhaps the signature characteristic that determines thedividend supply of industrial firms, and it has been so for at least two decades (andprobably longer). Although our evidence is limited to dividends, we conjecture thatthe small set of top-tier firms is also responsible for the majority of cash payouts viastock repurchase. Three observations are consistent with this conjecture. First, Famaand French (2001a) report that stock repurchases are primarily the province ofdividend-paying firms. Second, earnings are highly concentrated, with a handful of
ARTICLE IN PRESSH. DeAngelo et al. / Journal of Financial Economics 72 (2004) 425–456454
firms generating the bulk of industrial earnings and dividends, and these firms mayalso use their earnings to support repurchases. Finally, for S&P 500 firms in the late1990s, Liang and Sharpe (1999, fig. 1) document substantial gross (as well as net ofstock option exercise) dollar repurchase volume, with gross repurchases the sameorder of magnitude as dividends—facts consistent with our conjecture that top-tierfirms dominate aggregate repurchase activity. Whatever the ultimate verdict onthe concentration of repurchase volume, future analyses of payout policyshould recognize that a few large earners dominate the dividend supply, while thevast majority of firms collectively contributes little to aggregate earnings anddividends.
References
Allen, F., Michaely, R., 1995. Dividend policy. In: Jarrow, R.A., Maksimovic, V., Ziemba, W.T. (Eds).
Operations Research and Management Science, Elsevier Science, Amsterdam.
Andrade, G., Mitchell, M., Stafford, E., 2001. New evidence and perspective on mergers. Journal of
Economic Perspectives 15, 103–120.
Bagwell, L., Shoven, J., 1989. Cash distributions to shareholders. Journal of Economic Perspectives 3,
129–140.
Black, F., Scholes, M., 1974. The effect of dividend yield and dividend policy on common stock prices and
returns. Journal of Financial Economics 1, 1–22.
Burgstahler, D., Dichev, I., 1997. Earnings management to avoid earnings decreases and losses. Journal of
Accounting and Economics 24, 99–126.
Choe, H., 1990. Intertemporal and cross-sectional variation of corporate dividend policy. University of
Chicago, Ph.D. Dissertation, Chicago, IL.
Choe, H., 1991. Intertemporal variation of corporate dividend policy. Unpublished working paper, The
Pennsylvania State University.
Dann, L., 1981. Common stock repurchases: an analysis of returns to bondholders and stockholders.
Journal of Financial Economics 9, 101–138.
DeAngelo, H., DeAngelo, L., 1990. Dividend policy and financial distress: an empirical examination of
troubled NYSE firms. Journal of Finance 45, 1415–1431.
DeAngelo, H., DeAngelo, L., 2000. Controlling stockholders and the disciplinary role of payout policy: a
study of the Times Mirror Company. Journal of Financial Economics 56, 153–207.
DeAngelo, H., DeAngelo, L., Skinner, D., 1992. Dividends and losses. Journal of Finance 47, 1837–1863.
DeAngelo, H., DeAngelo, L., Skinner, D., 2000. Special dividends and the evolution of dividend signaling.
Journal of Financial Economics 57, 309–354.
Fama, E., Babiak, H., 1968. Dividend policy: an empirical analysis. Journal of the American Statistical
Association 63, 1132–1161.
Fama, E., French, K., 2001a. Disappearing dividends: changing firm characteristics or lower propensity to
pay? Journal of Financial Economics 60, 3–43.
Fama, E., French, K., 2001b. Newly listed firms: fundamentals, survival rates, and returns. Center for
Research in Security Prices working paper No. 530, University of Chicago, Graduate School of
Business.
Hayn, C., 1995. The information content of losses. Journal of Accounting and Economics 20, 125–153.
Liang, J., Sharpe, S., 1999. Share repurchases and employee stock options and their implications for S&P
500 share retirements and expected returns. Federal Reserve Board working paper, Washington, DC.
Lintner, J., 1956. Distribution of incomes of corporations among dividends, retained earnings, and taxes.
American Economic Review 46, 97–113.
Masulis, R., 1980. Stock repurchase by tender offer: an analysis of the causes of common stock price
changes. Journal of Finance 35, 305–319.
ARTICLE IN PRESSH. DeAngelo et al. / Journal of Financial Economics 72 (2004) 425–456 455

Miller, M., 1977. Debt and taxes. Journal of Finance 32, 261–275.
Ritter, J., Welch, I., 2002. A review of IPO activity, pricing, and allocations. Journal of Finance 57,
1795–1828.
Shoven, J., 1986. The tax consequences of share repurchases and other non-dividend cash payments to
equity owners. In: Summers, L. (Ed.), Tax Policy and the Economy, Vol. I. NBER and MIT Press,
Boston, pp. 29–54.
Vermaelen, T., 1981. Common stock repurchases and market signaling. Journal of Financial Economics 9,
139–183.
ARTICLE IN PRESSH. DeAngelo et al. / Journal of Financial Economics 72 (2004) 425–456456