Embed Size (px)
Citation preview

Are Discretionary Accruals a Good Measure of Audit Quality?
Essam Elshafie Northeastern Illinois University
Emmanuel Nyadroh
Northeastern Illinois University
Numerous studies use discretionary accruals (DA) as a proxy of audit quality; yet, there is no conclusive evidence on whether DA are a good proxy for audit quality. To test whether DA are a good measure of audit quality, we examine the association between DA and five measures of audit quality, namely; the likelihood restatement, f4 audit, negative internal control report, going concern opinion, and auditor’s industry specialization. The results show that while there is an association between DA and each of the first three audit quality measures, such an association is absent in the case of each of the last two. These mixed results indicate that DA are not necessarily a good measure of audit quality. INTRODUCTION
Knapp (1991) and Schroeder et al. (1986) indicate that despite the importance of the audit quality concept, it is not explicitly defined by technical standards nor, have researchers arrived at a consensual understanding of its meaning. Francis (2011) explains that audit quality is a complex concept and cannot be reduced to a simple definition; however, he indicates that “audit standards imply that audit quality is achieved by the issuance of the “appropriate audit report on the client’s compliance with Generally Accepted Accounting Principles.” He also states that a good audit is “one in which the auditor complies with auditing standards and issues the correct opinion regarding the client’s financial statements at an appropriate level of audit risk.” He indicates that audit quality is affected by factors included in a framework he has introduced that includes testing procedures, team personnel, audit processes, accounting firms, audit industry, and institutions that affect auditing, such as AICPA, PCAOB, FASB, etc.
DeAngelo (1981) defines audit quality as “the market assessed joint probability that a given auditor will both (a) discover a breach in the client’s accounting system and (b) report the breach.” She indicates that audit quality is positively associated with auditor independence. On the other hand, audit failure is defined as: “issuing an erroneous audit opinion as the result of an underlying failure to comply with the requirements of Generally Accepted Auditing Standards” (Arens et al., 2008). PCAOB Audit Standard No. 7 (AS7) addresses the issue of engagement quality review. The objective of this standard is to provide guidance for those who perform a second-partner review of audit or review engagements quality. This standard provides a definition of an audit deficiency. It states: “A significant engagement deficiency in an audit exists when (1) the engagement team failed to obtain sufficient appropriate evidence in accordance with the standards of the PCAOB, (2) the engagement team reached an inappropriate overall
Journal of Management Policy and Practice vol. 15(2) 2014 43

conclusion on the subject matter of the engagement, (3) the engagement report is not appropriate in the circumstances, or (4) the firm is not independent of its client.” From these definitions, we can identify major characteristics of a high audit quality, namely: issuing an appropriate opinion by an independent firm, while following auditing standards. Since in most cases, data on whether the auditor followed the standards is not readily available, the majority of the audit research articles that address audit quality use discretionary accruals (DA) as a proxy for audit quality, despite the fact that DA may not be the best measure of audit quality. For example, Francis (2011) indicates that “while earnings quality is an important stream of research in financial accounting, it could be argued that earnings-quality metrics are not an appropriate measure of audit quality.” He explains that financial statements of firms with extreme value of earnings quality measures, not necessarily imply that such financial statements are misstated.
In his top 10 wish list for audit research, Nusbaun (2007) identifies “the meaning of improving audit quality” as an important area for future research. He adds that “we need to begin by addressing more fundamental questions: What is quality? What does it mean to bring quality to an audit?” The importance and implication of our paper stem from these questions.
The purpose of this paper is to examine whether DA are really a relevant proxy of audit quality or whether they are used for lack of data on other measures of audit quality. The concern is that DA are used extensively in the accounting and auditing research as a “silver bullet” to measure or serve as a proxy for many things. In addition to audit quality, they are used as a proxy for earnings quality (Bedard et al., 2012), accounting conservatism (Ahmed et al., 2002), auditor conservatism (Ajona et al., 2008), etc. The lack of empirical evidence that supports the robustness of DA as a measure of all these variables, especially audit quality, drives our research question. Our study is the first, to the best of our knowledge, to attempt to address whether DA are a good measure for audit quality.
Chambers and Payne (2011) address whether the quality of accruals, measured by their persistence, relates to an audit quality attribute which is Big N firm independence. Their research does not address directly whether DA is a proxy for audit quality. In this paper, we hypothesize that if DA are a good measure of audit quality, then they should be highly associated with other indicators of audit quality, such as the likelihood of restating the company’s financial statements (Stanley and DeZoort, 2007), performing the audit by one of the Big N firms (Lennox, 1999), the likelihood of issuing a going concern opinion (Carey and Simnett, 2006; Knechel and Vanstraelen, 2007), the level of industry specialization (Balsam et al., 2003), and the efficiency of the internal control.
Data on entities with restatements of financial statements, going concern reports, negative internal control reports, are collected from AUDIT ANALYTICS, and the necessary financial data for these entities are collected from COMPUSTAT over the period, 1995 to 2010. The accruals are estimated using the Modified Jones Model (Dechow et al., 1995). The results of examining the association between DA and these measures are mixed. While the associations between DA and the restatements of financial statements, audit by Big 4 firms, and negative internal control reports are in the expected direction, the association between DA and going concern opinions is insignificant and the association of DA with the industry specialization of the audit firms is in the opposite direction.
BACKGROUND AND HYPOTHESES DEVELOPMENT
Allen and Woodland (2010) find that even though higher education requirements (150 hours) lead to
increase in audit fees, it does not affect audit quality as measured by DA. Using a sample of Taiwanese companies, Chen et al. (2008) examine whether audit firm/partner tenure affects earnings quality measured by performance adjusted DA. Contrary to the arguments supporting Sarbanes-Oxley Act’s 5 year partner rotation requirements, Chen et al. (2008) find a negative association between audit firm/partner rotation and DA. However, Chi et al. (2009) criticize this article and indicate that the research sample period used by Chen et al. (2008) is prior to 2003 when partner rotation in Taiwan was voluntary; therefore, the results do not reflect the effect of mandatory auditor rotation on earnings quality. Instead, Chi et al. (2009) examine audit quality after 2004 when partner rotation became mandatory. Using performance-matched abnormal accruals as a proxy for audit quality, they do not find that partner
44 Journal of Management Policy and Practice vol. 15(2) 2014

rotation enhances audit quality. Also, Manry et al. (2008) address the association of audit quality and partner tenure. They use DA as a measure of audit quality and they also provide evidence on the increased audit quality with the length of partner tenure.
Balsam et al. (2003) extend the research on audit quality and earnings quality. They state that: “because auditor quality is multidimensional and inherently unobservable, there is no single auditor characteristic that can be used to proxy for it,” and that: “Earnings quality is a concept that does not have a common definition in the literature.” They use auditor industry specialization as a proxy of audit quality and two measures of earnings quality, namely, DA and earnings response coefficient. Their findings generally support a positive relation between earnings and audit quality measures. Choi, Kim, Kim, and Zang (2010) examine the effect of office, not firm, size on audit quality measured by unsigned DA; they find that office size has a positive effect on both audit quality and audit fees. Using the magnitude of absolute DA, Choi, Kim, and Zang (2010) study the association between abnormal audit fees and audit quality. They find that the association between the two is asymmetric. That is, for abnormally low audit fees, there is no significant association, but for positive abnormal audit fees, the association is negative. This means that the auditors’ incentive to perform quality audit work is based on the amount of fees received. Becker et al. (1998) do not use DA as a measure of audit quality, but as a measure of earnings management, and use firm size as a proxy for audit quality. They find that non-Big six audit firms’ clients report income-increasing DA more than big-six clients. In addition, they report that non-big six firms allow their clients more accounting flexibility that lead to a higher level of earnings management.
We notice from this brief literature review that some studies examine the association between audit quality and DA as variables independent from each other (e.g., Becker et al., 1998), while other studies use DA as a proxy or a measure of audit quality (e.g., Allen and Woodland, 2010). This inconsistency is another motivation for our study.
Restatements of Financial Statements
Francis (2011) shows that restatements indicate a higher rate of low-quality audits. Also, Gunny and Zhang (2009) indicate that clients of audit firms, which Public Company Accounting Oversight Board (PCAOB) reports as having failed to discover a significant departure from GAAP, are more likely to have a subsequent restatement of earnings. This implies that there is a negative association between restatements and audit quality. Also, Chen and Chi (2009) study the restatements of financial statements and the auditor’s industry expertise. Even though they find no evidence that firm-level experts lower the likelihood of accounting restatements, the results of their study indicate a negative association between signing partner expertise and accounting restatements. Romanus et al. (2008) examine the effect of auditor’s industry specialization on audit quality. They measure audit quality by the likelihood of accounting restatements. They state that: “Restatements provide more direct evidence that the auditor failed to either detect or report an accounting treatment that is inconsistent with GAAP than other common proxies for audit quality such as accrual-based metrics (DeFond and Francis 2005).” All of these studies use accounting restatements as an indicator of audit quality. Therefore, if DA are a proxy for audit quality, they are expected to be associated with the restatements of financial statements. Based on this we examine the following hypothesis:
H1: There is a significantly positive relationship between the level of DA and the restatements of companies’ financial statement.
Going Concern Opinion
Another measure of audit quality is issuing a going concern opinion (Carey and Simnett, 2006). Lennox (1999) uses the going concern opinion to measure auditor reporting accuracy. Also, Francis and Yu (2009) test the prediction that larger offices of Big 4 firms have higher quality audits by measuring the likelihood of larger offices issuing more going-concern reports. That is, they measure audit quality by the likelihood of audit firms issuing going concern opinion. Then, if the DA are a good proxy for audit
Journal of Management Policy and Practice vol. 15(2) 2014 45
quality, there should be a lower level of DA when a firm receives a going concern opinion, i.e., a negative association between the DA and the going concern opinion. Thus we stipulate the following hypothesis:
H2: DA tend to be lower for companies receiving going concern opinions.
Big 4 Audit Firms
Lennox (1999) documents that the Big 4 firms issue more accurate audit reports than do the non-Big 4 accounting firms. Arguing that big firms have more to lose in case of litigation, Dye (1993) indicates that these firms will provide higher audit quality. Francis and Yu (2009) find that larger offices of Big 4 firms provide higher quality audits. Knapp (1991) finds that audit committee members perceive auditor size and tenure to have a significant influence on the quality of the audit service. These studies suggest a positive relationship between audit quality and Big 4 audit. Therefore, if DA measure audit quality, Big 4 clients should have significantly lower DA. Hence our third hypothesis is stated as follows:
H3: DA are lower in companies receiving Big 4 audits.
Internal Control Efficiency
Internal control (IC) is defined as a set of policies and procedures that are designed and implemented by the management of an entity to help achieve the entity’s goals in terms of reliable financial reporting, efficient operations, and following laws and regulations. Sarbanes-Oxley Act of 2002, section 404, requires management of accelerated filers to issue a statement on the effectiveness of each filer’s the IC and the auditors of accelerated filers to obtain an understanding, audit, and issue an opinion on the effectiveness of the IC systems of these entities. We assume that an auditor issuing a negative IC opinion is a sign of a high level of auditor independence, and, therefore if the DA reflect audit quality, they should be low in entities receiving negative IC opinions.
H4: DA are low in firms after receiving IC negative report.
Industry Specialization of Audit Firms
Balsam et al. (2003) find clients of industry specialist auditors have lower DA. Romanus et al. (2008) list several studies that provide evidence that industry specialization appears to enhance the auditors' error detection and mitigate the use of accruals-based earnings management. Jensen and Payne (2005) use industry experience levels (industry expertise) as a proxy for auditor quality in examining the links between audit service procurement, audit quality, and audit fees. We reexamine these findings by testing the following hypothesis:
H 5: DA are lower in a company which is audited by a firm with a high level of industry specialization.
RESEARCH METHOD AND RESULTS
A unique feature of this paper is that we relate different audit quality measures to DA; therefore, we
collect several data sets on each of these measures, namely: restatements of financial statements, going concern opinions, internal control negative reports, industry specialization of audit firms, and Big 4 audits. To test the first three hypotheses, we collected data from AUDIT ANALYTICS, then we collect samples that have observations on restatements, going concern opinions, and internal control negative reports, then we match them with firms that are free of these attributes based on 4 digit SIC code and size measured by total assets. Data on the matching groups are collected from COMPUSTAT. For testing hypotheses related to the Big 4 audit firms and the industry specialization, data are collected from COMPUSTAT.
46 Journal of Management Policy and Practice vol. 15(2) 2014

The following model is used to examine all five hypotheses:
AQF it = α + β1 DA it + β2 ln_TA it + β3 ROA it + β4 DTEQ it + β5 MKBK it + β6 IND it + β7 BIG4 it + ε it (1)
Where, for each company I in period t, AQF it is the audit quality factor, DA it is the discretionary accruals, ln_TA it is the natural log of the total assets to control for the size of the entity, ROA it is return on assets to control for the profitability, DTEQ it is debt to equity ratio to control for the leverage, MKBKit is the market value to book value ratio to control for the growth, IND it is the industry controlled by the SIC code to control for the company’s industry, and BIG4 it is a dummy variable that equal 1 if the auditor is one of the Big 4, and 0 otherwise, to control for the accounting firm size. DA it are estimated following Dechow et al. (1995), as we use the Modified Jones Model to estimate the DA as follow: ACC it / TA it-1 = α 0 /TA it-1 + α 1 (Δ Revenue it - Δ AR it) /TA it-1 + α 2 PPE it /TA it-1 + ε it (2) where, for each company i and period t, ACC it is the accruals, measured, in (3), as the change in current assets minus the change in current liabilities, minus the change in cash and cash equivalent, plus the change in short term debt included in the current liability, and minus the depreciation expense; TA it is the total asset it; Δ Revenue it is the change in revenue; and PPE it is the level of gross property, plant, and equipment. ACC it = Δ CA it – Δ CL it – Δ CASH it + Δ STD it – DEP it (3) Restatements of Financial Statements
We start with data on all positive and negative restatements from AUDIT ANALYTICS 1995 to 2010. Total number of observations was 11,355 observations. After removing observations missing tickers or other relevant variables we are left with 5,194 observations. After merging these observations with data from COMPUSTAT and removing other missing observations, we have 2,940 observations left. Then we remove observations of firms in the financial services industries (SIC code 6000-6999), with 1,806 usable observations left. We match the firms in this usable set with firms with no financials statement restatements based on the SIC code and size (10% over or under of the total assets). After removing observations without a match, and removing the upper and lower 1% of the variables used in the model, we are left with a total of 3,861 observations. Table 1 shows descriptive statistics of the main variables. Panel A shows the descriptive statistics for all firms in the sample, while Panel B and C show the descriptive statistics for companies with restated financial statements and companies without restated financial statements, respectively. Comparing the DA levels on average in companies with versus companies without restatements, the results in panel B show that firms with restated financial statements have a mean DA of 0.02 which is larger than that in Panel C of the companies without restated financial statements, -0.05, which is in the same direction expected under our first hypothesis, H1.
Journal of Management Policy and Practice vol. 15(2) 2014 47

TABLE 1 DESCRIPTIVE STATISTICS FOR THE RESTATEMENTS
Panel A - All firms with and without restatements: Variable N Mean SD Min Max Discretionary Accruals 3861 -0.03 0.19 -1.44 0.97 Current Assets 3861 331.87 847.50 0.00 14509.00 Current Liabilities 3861 216.98 656.53 0.02 8120.35 Cash 3861 110.29 368.74 0.00 10110.00 Short Term Debt 3861 40.77 182.24 0.00 3678.66 Depreciation 3861 4505 133.53 0.00 2199.00 Sales 3861 841.51 2551.85 0.00 51760.00 Net PPE 3861 366.46 1272.52 0.00 16675.69 ROA 3861 -13.02 44.79 -399.22 34.49 Total Assets 3861 958.76 2561.34 0.65 23754.00 Debt to Equity 3861 61.41 139.39 -659.72 1274.42 Market to Book 3861 3.33 5.62 -28.37 54.31 Panel B - Control group (firms with restatements of financial statements): Variable N Mean SD Min Max Discretionary Accruals 1806 0.02 0.17 -1.32 0.89 Current Assets 1806 312.26 825.27 0.00 9267.00 Current Liabilities 1806 206.53 639.77 0.02 7484.40 Cash 1806 99.55 313.43 0.00 4674.00 Long Term Debt 1806 39.49 180.39 0.00 3678.66 Depreciation 1806 42.92 127.56 0.00 1599.00 Sales 1806 818.71 2624.45 -26.48 51760.00 Net PPE 1806 348.16 1195.21 0.00 16675.69 ROA 1806 -16.56 49.60 -399.22 33.10 Total Assets 1806 925.20 2480.01 0.85 23184.73 Debt to Equity 1806 63.24 152.86 -659.72 1268.24 Market to Book 1806 2.83 5.27 -26.12 52.73 Panel C - Matching group (firms without restatements of financial statements): Variable N Mean SD Min Max Discretionary Accruals 2055 -0.05 0.19 -1.43 0.58 Current Assets 2055 349.09 915.44 0.00 14509.00 Current Liabilities 2055 226.17 670.94 0.04 8120.35 Cash 2055 119.74 411.10 0.00 10110.00 Long Term Debt 2055 41.91 183.88 0.00 3227.82 Depreciation 2055 46.91 138.56 0.00 2199.00 Sales 2055 869.06 2486.71 0.00 37406.00 Net PPE 2055 382.54 1336.85 0.00 15833.00 ROA 2055 -9.91 39.84 -342.99 34.49 Total Assets 2055 988.24 2630.99 0.65 23754.00 Debt to Equity 2055 59.81 126.27 0.00 1274.42 Market to Book 2055 3.77 5.88 -28.37 54.31 Discretionary Accruals, using Modified Jones Model, are the residual in model (2) run with no intercept, Current Assets are year-end current assets (COMPUSTAT item A4 ), current liabilities are the year-end current liabilities (COMPUSTAT item A5 ), cash is cash and cash equivalent (COMPUSTAT item A1), Long Term Debt is
48 Journal of Management Policy and Practice vol. 15(2) 2014
(COMPUSTAT item A9), Depreciation is depreciation and amortization expense (COMPUSTAT item A14 ), Sales are net sales (COMPUSTAT item A12), Net PPE is net property plant and equipment (COMPUSTAT item A8 ), ROA is return on assets (COMPUSTAT item A237 divided by item A6 multiplied by100 ), Total Assets (COMPUSTAT item A2), Debt to Equity is the long term debt to shareholders equity ratio (COMPUSTAT item 100 x (COMPUSTAT item A9 / (COMPUSTAT item A60 + COMPUSTAT item A130) ), Market to Book ratio of a company’s market value to its book value.
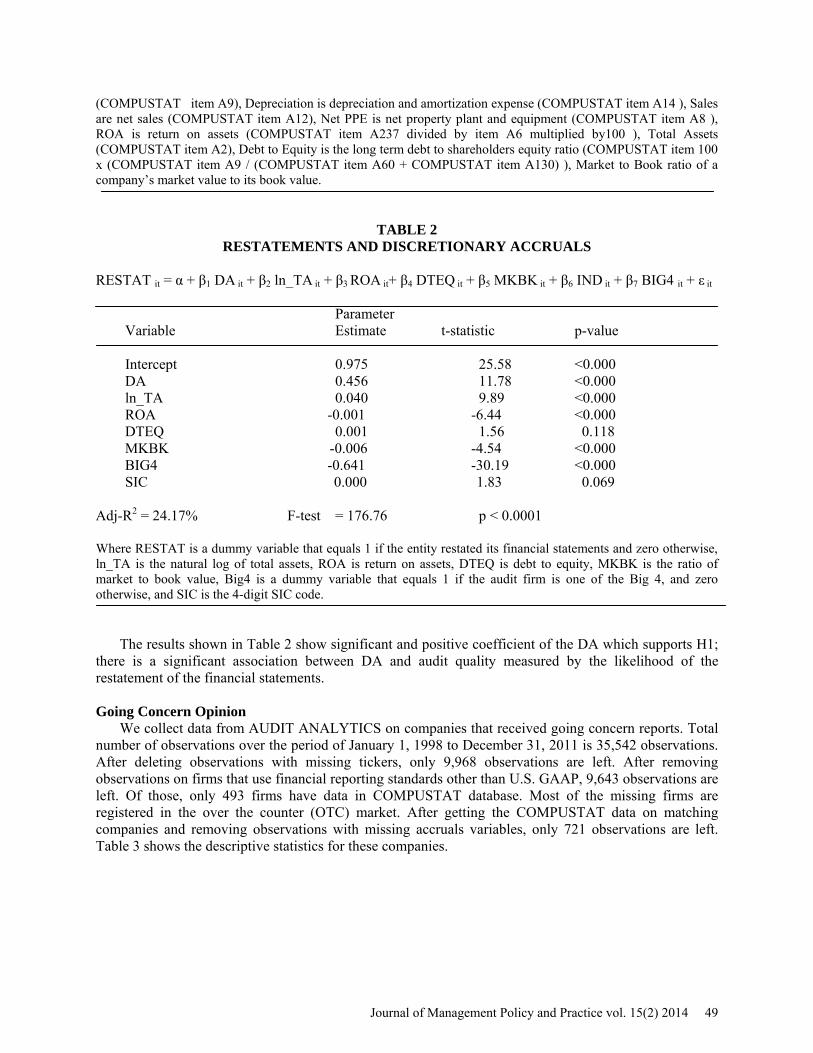
TABLE 2 RESTATEMENTS AND DISCRETIONARY ACCRUALS
RESTAT it = α + β1 DA it + β2 ln_TA it + β3 ROA it+ β4 DTEQ it + β5 MKBK it + β6 IND it + β7 BIG4 it + ε it Parameter Variable Estimate t-statistic p-value Intercept 0.975 25.58 <0.000 DA 0.456 11.78 <0.000 ln_TA 0.040 9.89 <0.000 ROA -0.001 -6.44 <0.000 DTEQ 0.001 1.56 0.118 MKBK -0.006 -4.54 <0.000 BIG4 -0.641 -30.19 <0.000 SIC 0.000 1.83 0.069 Adj-R2 = 24.17% F-test = 176.76 p < 0.0001 Where RESTAT is a dummy variable that equals 1 if the entity restated its financial statements and zero otherwise, ln_TA is the natural log of total assets, ROA is return on assets, DTEQ is debt to equity, MKBK is the ratio of market to book value, Big4 is a dummy variable that equals 1 if the audit firm is one of the Big 4, and zero otherwise, and SIC is the 4-digit SIC code.
The results shown in Table 2 show significant and positive coefficient of the DA which supports H1; there is a significant association between DA and audit quality measured by the likelihood of the restatement of the financial statements. Going Concern Opinion
We collect data from AUDIT ANALYTICS on companies that received going concern reports. Total number of observations over the period of January 1, 1998 to December 31, 2011 is 35,542 observations. After deleting observations with missing tickers, only 9,968 observations are left. After removing observations on firms that use financial reporting standards other than U.S. GAAP, 9,643 observations are left. Of those, only 493 firms have data in COMPUSTAT database. Most of the missing firms are registered in the over the counter (OTC) market. After getting the COMPUSTAT data on matching companies and removing observations with missing accruals variables, only 721 observations are left. Table 3 shows the descriptive statistics for these companies.
Journal of Management Policy and Practice vol. 15(2) 2014 49

TABLE 3 DESCRIPTIVE STATISTICS FOR THE GOING CONCERN
Panel A - All firms with and without going concern reports: Variable N Mean SD Min Max Discretionary Accruals 721 -0.04 0.55 -4.04 6.20 Current Assets 721 136.95 400.22 0.03 1806.03 Current Liabilities 721 125.42 434.96 0.05 6341.47 Cash 721 46.43 142.03 0.00 1248.00 Short Term Debt 721 49.46 271.96 0 5164.31 Depreciation 721 19.40 75.03 0 1301.10 Sales 721 365.19 1263.16 0 14995.00 Net PPE 721 167.87 628.21 0 7944.46 ROA 721 -161.07 364.93 -4400.00 138.03 Total Assets 721 415.03 1282.05 0.27 12009.63 Debt to Equity 721 46.80 207.38 -1243.56 1206.24 Market to Book 721 2.90 14.20 -78.90 111.66 Panel B - Control group (firms with going concern reports): Variable N Mean SD Min Max Discretionary Accruals 493 -0.05 0.50 -4.04 5.04 Current Assets 493 138.46 386.52 0.03 3239.00 Current Liabilities 493 140.89 453.87 0.05 6341.47 Cash 493 47.21 145.46 0.00 1248.00 Short Term Debt 493 64.65 324.46 0 5164.31 Depreciation 493 19.90 77.59 0 1301.10 Sales 493 374.54 1247.56 0.00 14995.00 Net PPE 493 171.47 621.92 0 6933.80 ROA 493 -89.96 149.56 -13.11.45 32.30 Total Assets 493 413.60 1255.17 0.27 12009.55 Debt to Equity 493 47.75 235.84 -1234.56 1206.24 Market to Book 493 2.91 14.92 -.69.75 111.66 Panel C - Matching group (firms without going concern reports): Variable N Mean SD Min Max Discretionary Accruals 228 0.02 0.65 -3.80 6.20 Current Assets 228 123.62 403.62 0.21 4806.03 Current Liabilities 228 85.73 367.47 0.17 4944.03 Cash 228 40.81 130.56 0 1232.55 Long Term Debt 228 17.31 78.29 0 772.26 Depreciation 228 17.17 61.23 0.02 565.44 Sales 228 321.68 1113.61 0.00 12780.70 Net PPE 228 164.60 642.95 0.00 8021.27 ROA 228 -40.66 104.88 -1228.59 24.34 Total Assets 228 395.81 1254.14 0.65 10322.13 Debt to Equity 228 49.97 138.74 -472.45 831.56 Market to Book 228 2.22 12.98 -114.79 65.25 Discretionary Accruals, using Modified Jones Model, are the residual in model (2) run with no intercept, Current Assets are year-end current assets (COMPUSTAT item A4 ), current liabilities are the year-end current liabilities (COMPUSTAT item A5 ), cash is cash and cash equivalent (COMPUSTAT item A1), Long Term Debt is
50 Journal of Management Policy and Practice vol. 15(2) 2014

(COMPUSTAT item A9), Depreciation is depreciation and amortization expense (COMPUSTAT item A14 ), Sales are net sales (COMPUSTAT item A12), Net PPE is net property plant and equipment (COMPUSTAT item A8 ), ROA is return on assets (COMPUSTAT item A237 divided by item A6 multiplied by100), Total Assets (COMPUSTAT item A2), Debt to Equity is the long term debt to shareholders equity ratio (COMPUSTAT item 100 x (COMPUSTAT item A9 / (COMPUSTAT item A60 + COMPUSTAT item A130) ), Market to Book is the ration of a company’s market to it book value.
The results in Panels B and C show that the DA level is higher in firms receiving going concern opinion compared to those that did not receive it, which seems to support our hypothesis H2.
TABLE 4 GOING CONCERN AND DISCRETIONARY ACCRUALS
GC it = α + β1 DA it + β2 ln_TA it + β3 ROA it + β4 DTEQ it + β5 MKBK it + β6 IND it + β7 BIG4 it + ε it Parameter Variable Estimate t-statistic p-value Intercept 0.641 25.54 <0.000 DA -0.043 -1.20 0.230 ln_TA 0.003 0.29 0.774 ROA -0.001 -3.62 <0.001 DTEQ 0.001 0.69 0.487 MKBK -0.001 -0.45 0.652 BIG4 -0.009 0.21 0.833 SIC -0.000 -0.48 0.632 Adj-R2 = 1.6% F-test = 2.75 p = 0.009 GC is a dummy variable that equals one if the entity received a going concern report and zero otherwise, ln_TA is the natural log of total assets, ROA is return on assets, DTEQ is debt to equity, MKBK is the ratio of market to book value, Big4 is a dummy variable that equals 1 if the audit firm is one of the Big 4, and zero otherwise, and SIC is the 4-digit SIC code.
In Table 4, the coefficient of the DA is negative. Even though the sign of the DA coefficient is in the expected direction, the coefficient is insignificant. Therefore, the results do not appear to provide support for our hypothesis H2. Big 4 Audit Firms
In his study of the effect of audit quality on the pricing of DA, Krishnan (2003) uses Big 6, as an indicator of high audit quality. He finds that value relevance of DA is greater for firms audited by Big 6 firms. To test H4, we collect data from COMPUSTAT on all active firms from January 1, 1998 to December 31, 2011. Total number of observations is 134,400. After removing observations with missing variables, 52,193 observations are left, and after removing the upper and lower 1% of variables used in the model, 47,092 observations left. Of these observations, 32,603 are Big 4 audit firms and 14,489 are for companies audited by non-Big 4 audit firms. Table 5 shows descriptive statistics for both groups of companies audited by Big 4 and non-Big 4 audit firms. Results in Panel B and Panel C show that companies audited by Big 4 firms are large in terms of their assets, sales, and PPE. Also they are more profitable on average, and have higher growth potentials as measured by the market to book ratio. In addition, the results show that they have lower levels of DA.
Journal of Management Policy and Practice vol. 15(2) 2014 51

TABLE 5 DESCRIPTIVE STATISTICS FOR BIG 4 DATA
Panel A - All companies audited by Big 4 audit firms and non-Big 4 audit firms: Variable N Mean SD Min Max Discretionary Accruals 47092 -0.01 0.22 -2.26 2.59 Current assets 47092 808.03 2389.84 0.00 42778.03 Current Liabilities 47092 571.95 1819.86 0.00 31538.00 Cash 47092 247.90 960.04 -0.16 31600.00 Short Term Debt 47092 109.62 487.41 -882.00 11251.27 Depreciation 47092 107.99 353.93 0.00 7951.61 Sales 47092 2054.57 6324.70 0.00 137634.00 Net PPE 47092 895.32 3047.42 0.00 51444.79 ROA 47092 -22.58 106.81 -1723.34 36.22 Total Assets 47092 2414.85 6650.65 0.06 61519.25 Debt to equity 47092 48.42 117.98 -644.64 945.22 Market to Book 47092 2.89 5.94 -44.38 61.92 Panel B - Control group (Companies audited by Big 4 audit firms): Variable N Mean SD Min Max Discretionary Accruals 32603 -0.01 0.15 -2.26 2.16 Current Assets 32603 1123.93 2777.25 0.00 42778.03 Current Liabilities 32603 800.16 2123.51 0.00 31538.00 Cash 32603 342.94 1123.81 -0.16 31600.00 Short Term Debt 32603 152.25 572.23 -882.00 11251.27 Depreciation 32603 150.73 412.58 0.00 7951.61 SALE 32603 2878.27 7402.85 0.00 137634.00 Net PPE 32603 1258.00 3579.97 0.00 51444.79 ROA 32603 -6.05 49.88 -1706.42 36.15 Total assets 32603 3381.00 7727.09 0.07 61519.25 Debt to equity 32603 58.23 114.15 -644.64 945.22 Market to Book 32603 3.06 4.97 -43.98 61.78 Panel C - Matching group (Companies audited by non-Big 4 audit firms): Variable N Mean SD Min Max Discretionary Accruals 14489 -0.02 0.32 -2.25 2.59 Current Assets 14489 97.18 690.90 0.00 24531.99 Current Liabilities 14489 58.43 486.49 0.00 19707.04 Cash 14489 34.05 296.23 -0.01 13408.17 Short Term Debt 14489 13.71 148.50 -0.00 5656.00 Depreciation 14489 11.82 103.76 0.00 4023.60 Sales 14489 201.09 1318.02 0.00 49576.43 Net PPE 14489 79.21 618.96 0.00 28983.36 ROA 14489 -59.788 171.70 -1723.34 36.22 Total assets 14489 240.83 1606.21 0.06 48440.07 Debt to Equity 14489 26.35 123.38 -643.43 941.90 Market to Book 14489 2.45 7.68 -44.38 61.92 Discretionary Accruals, using Modified Jones Model, are the residual in model (2) run with no intercept, Current Assets are year-end current assets (COMPUSTAT item A4 ), current liabilities are the year-end current liabilities (COMPUSTAT item A5 ), cash is cash and cash equivalent (COMPUSTAT item A1), Long Term Debt is
52 Journal of Management Policy and Practice vol. 15(2) 2014

(COMPUSTAT item A9), Depreciation is depreciation and amortization expense (COMPUSTAT item A14 ), Sales are net sales (COMPUSTAT item A12), Net PPE is net property plant and equipment (COMPUSTAT item A8 ), ROA is return on assets (COMPUSTAT items (COMPUSTAT item A237 divided by item A6 multiplied by100), Total Assets (COMPUSTAT item A2), Debt to Equity is the long term debt to shareholders equity ratio (COMPUSTAT item 100 x (COMPUSTAT item A9 / (COMPUSTAT item A60 + COMPUSTAT item A130) ), Market to Book is company’s market value to its book value.
As predicted, Table 6 shows that the DA coefficient is significantly negative, which means that the DA levels are lower in companies audited by the Big 4; these results support our hypothesis H3.
TABLE 6 BIG 4 AND DISCRETIONARY ACCRUALS
BIG4 it = α + β1 DA it + β2 ln_TA it + β3 ROA it + β4 DTEQ it + β5 MKBK it + β6 IND it + ε it Parameter Variable Estimate t-statistic p-value Intercept 0.129 21.26 <0.000 DA -0.059 -7.38 <0.000 ln_TA 0.104 139.94 <0.000 ROA -0.001 -1.55 0.120 DTEQ 0.000 -7.81 <0.000 MKBK -0.003 10.79 <0.000 SIC 0.000 2.06 0.040 Adj-R2 = 33.99% F-test = 4043.13 p <.0001 Big4 is a dummy variable that equals one if the audit firms is one of the Big 4 firms and zero otherwise, ln_TA is the natural log of total assets, ROA is return on assets, DTEQ is debt to equity, MKBK is the ratio of market to book value, and SIC is the 4-digit SIC code. Internal Control Weaknesses
From AUDIT ANALYTICS, we collect 2,373 observations with negative internal control reports, over the period 2004 to 2011. Of these observations, only 1,525 companies have tickers, 993 of those companies are listed in the COMPUSTAT with available data. We pick a matching sample based on the same 4 digit SIC code and a total assets within 10% higher or lower. The matching sample contains 537 observations. The descriptive statistics for the control, matching, and total sample are shown in Table 7. Results in Panel B and C show that firms receiving qualified internal control reports have lower levels of DA. While both groups of companies are similar in term total sales and total assets, there is a difference in the about of DA. Panel B shows that the DA are lower in companies receiving IC qualified report, compared to companies receiving unqualified IC report, these results are in line with our hypothesis H 4.
Journal of Management Policy and Practice vol. 15(2) 2014 53
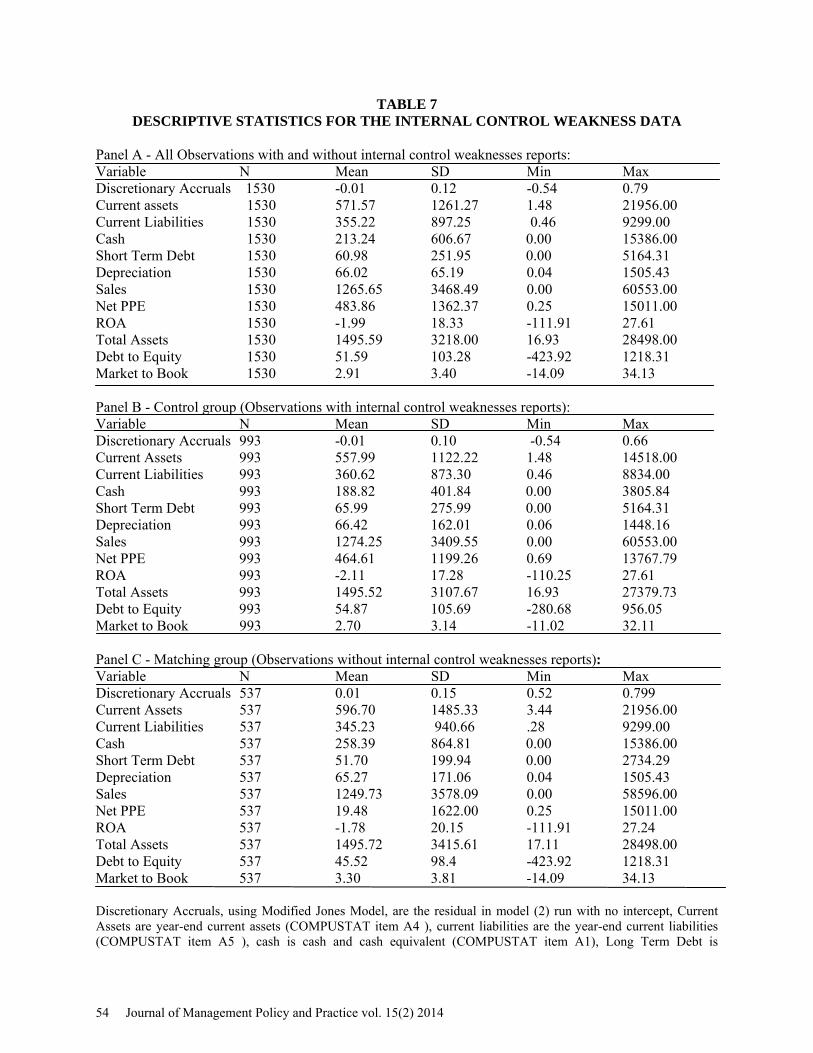
TABLE 7 DESCRIPTIVE STATISTICS FOR THE INTERNAL CONTROL WEAKNESS DATA
Panel A - All Observations with and without internal control weaknesses reports: Variable N Mean SD Min Max Discretionary Accruals 1530 -0.01 0.12 -0.54 0.79 Current assets 1530 571.57 1261.27 1.48 21956.00 Current Liabilities 1530 355.22 897.25 0.46 9299.00 Cash 1530 213.24 606.67 0.00 15386.00 Short Term Debt 1530 60.98 251.95 0.00 5164.31 Depreciation 1530 66.02 65.19 0.04 1505.43 Sales 1530 1265.65 3468.49 0.00 60553.00 Net PPE 1530 483.86 1362.37 0.25 15011.00 ROA 1530 -1.99 18.33 -111.91 27.61 Total Assets 1530 1495.59 3218.00 16.93 28498.00 Debt to Equity 1530 51.59 103.28 -423.92 1218.31 Market to Book 1530 2.91 3.40 -14.09 34.13 Panel B - Control group (Observations with internal control weaknesses reports): Variable N Mean SD Min Max Discretionary Accruals 993 -0.01 0.10 -0.54 0.66 Current Assets 993 557.99 1122.22 1.48 14518.00 Current Liabilities 993 360.62 873.30 0.46 8834.00 Cash 993 188.82 401.84 0.00 3805.84 Short Term Debt 993 65.99 275.99 0.00 5164.31 Depreciation 993 66.42 162.01 0.06 1448.16 Sales 993 1274.25 3409.55 0.00 60553.00 Net PPE 993 464.61 1199.26 0.69 13767.79 ROA 993 -2.11 17.28 -110.25 27.61 Total Assets 993 1495.52 3107.67 16.93 27379.73 Debt to Equity 993 54.87 105.69 -280.68 956.05 Market to Book 993 2.70 3.14 -11.02 32.11 Panel C - Matching group (Observations without internal control weaknesses reports): Variable N Mean SD Min Max Discretionary Accruals 537 0.01 0.15 0.52 0.799 Current Assets 537 596.70 1485.33 3.44 21956.00 Current Liabilities 537 345.23 940.66 .28 9299.00 Cash 537 258.39 864.81 0.00 15386.00 Short Term Debt 537 51.70 199.94 0.00 2734.29 Depreciation 537 65.27 171.06 0.04 1505.43 Sales 537 1249.73 3578.09 0.00 58596.00 Net PPE 537 19.48 1622.00 0.25 15011.00 ROA 537 -1.78 20.15 -111.91 27.24 Total Assets 537 1495.72 3415.61 17.11 28498.00 Debt to Equity 537 45.52 98.4 -423.92 1218.31 Market to Book 537 3.30 3.81 -14.09 34.13 Discretionary Accruals, using Modified Jones Model, are the residual in model (2) run with no intercept, Current Assets are year-end current assets (COMPUSTAT item A4 ), current liabilities are the year-end current liabilities (COMPUSTAT item A5 ), cash is cash and cash equivalent (COMPUSTAT item A1), Long Term Debt is
54 Journal of Management Policy and Practice vol. 15(2) 2014
(COMPUSTAT item A9), Depreciation is depreciation and amortization expense (COMPUSTAT item A14 ), Sales are net sales (COMPUSTAT item A12), Net PPE is net property plant and equipment (COMPUSTAT item A8 ), ROA is return on assets (COMPUSTAT items (COMPUSTAT item A237 divided by item A6 multiplied by100), Total Assets (COMPUSTAT item A2), Debt to Equity is the long term debt to shareholders equity ratio (COMPUSTAT item 100 x (COMPUSTAT item A9 / (COMPUSTAT item A60 + COMPUSTAT item A130) ), Market to Book is company’s market value to its book value.
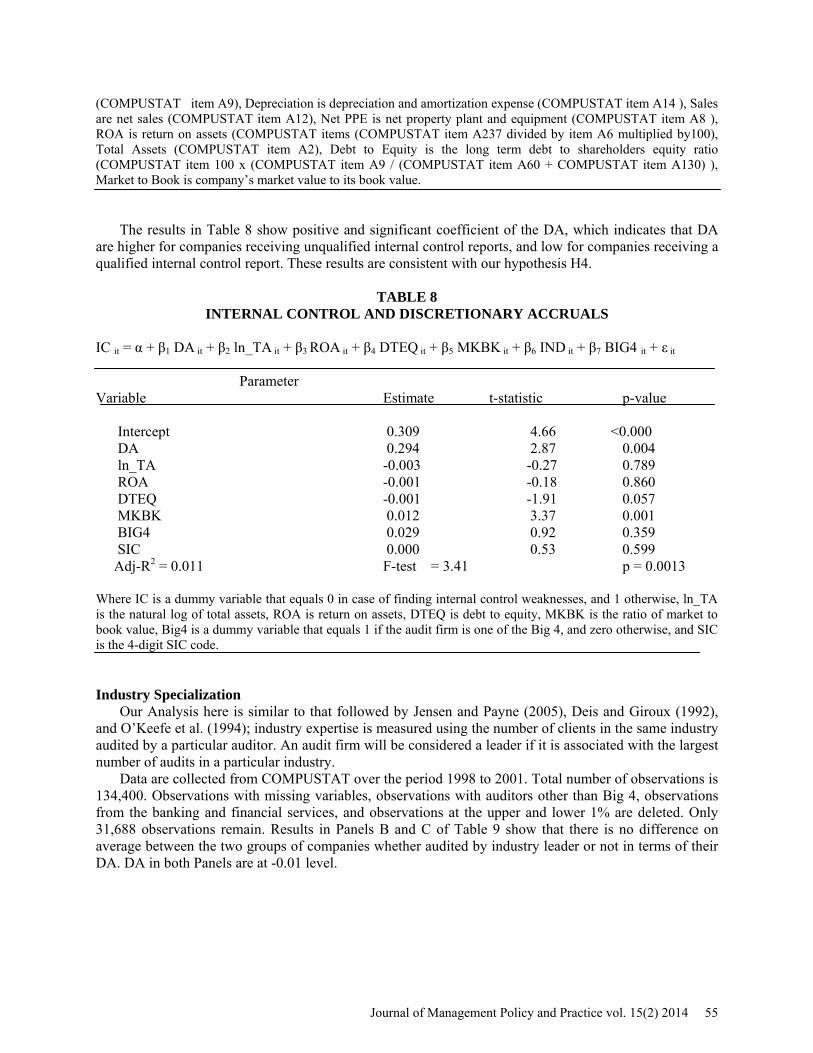
The results in Table 8 show positive and significant coefficient of the DA, which indicates that DA are higher for companies receiving unqualified internal control reports, and low for companies receiving a qualified internal control report. These results are consistent with our hypothesis H4.
TABLE 8 INTERNAL CONTROL AND DISCRETIONARY ACCRUALS
IC it = α + β1 DA it + β2 ln_TA it + β3 ROA it + β4 DTEQ it + β5 MKBK it + β6 IND it + β7 BIG4 it + ε it Parameter Variable Estimate t-statistic p-value Intercept 0.309 4.66 <0.000 DA 0.294 2.87 0.004 ln_TA -0.003 -0.27 0.789 ROA -0.001 -0.18 0.860 DTEQ -0.001 -1.91 0.057 MKBK 0.012 3.37 0.001 BIG4 0.029 0.92 0.359 SIC 0.000 0.53 0.599 Adj-R2 = 0.011 F-test = 3.41 p = 0.0013 Where IC is a dummy variable that equals 0 in case of finding internal control weaknesses, and 1 otherwise, ln_TA is the natural log of total assets, ROA is return on assets, DTEQ is debt to equity, MKBK is the ratio of market to book value, Big4 is a dummy variable that equals 1 if the audit firm is one of the Big 4, and zero otherwise, and SIC is the 4-digit SIC code. Industry Specialization
Our Analysis here is similar to that followed by Jensen and Payne (2005), Deis and Giroux (1992), and O’Keefe et al. (1994); industry expertise is measured using the number of clients in the same industry audited by a particular auditor. An audit firm will be considered a leader if it is associated with the largest number of audits in a particular industry.
Data are collected from COMPUSTAT over the period 1998 to 2001. Total number of observations is 134,400. Observations with missing variables, observations with auditors other than Big 4, observations from the banking and financial services, and observations at the upper and lower 1% are deleted. Only 31,688 observations remain. Results in Panels B and C of Table 9 show that there is no difference on average between the two groups of companies whether audited by industry leader or not in terms of their DA. DA in both Panels are at -0.01 level.
Journal of Management Policy and Practice vol. 15(2) 2014 55

TABLE 9 DESCRIPTIVE STATISTICS FOR THE INDUSTRY SPECIALIZATION DATA
Panel A - All companies audited Variable N Mean SD Min Max Discretionary Accruals 31688 -0.01 0.15 -2.28 2.15 Current Assets 31688 1118.17 2756.95 0.00 42778.03 Current Liabilities 31688 793.02 2100.38 0.00 31538.00 Cash 31688 333.67 1075.98 -0.16 31600.00 Short Term Debt 31688 153.86 577.02 -882.00 11251.27 Depreciation 31688 153.60 417.60 0.00 7951.61 Sales 31688 2879.24 7361.85 -0.87 137634.00 Net PPE 31688 1288.51 3625.10 0.00 51444.79 ROA 31688 -6.02 48.90 -1706.42 35.73 Total Assets 31688 3375.06 7686.45 0.07 61097.44 Debt to Equity 31688 58.66 114.51 -644.64 940.98 Market to book 31688 3.08 4.94 -43.98 61.78 Panel B – Companies audited by a leader Variable N Mean SD Min Max Discretionary Accruals 10263 -0.01 0.16 -2.28 2.10 Current Assets 10263 1137.22 2786.95 0.00 42778.03 Current Liabilities 10263 791.94 2039.03 0.00 28332.12 Cash 10263 345.44 1123.19 0.00 26235.00 Short Term Debt 10263 153.12 553.51 -882.00 10600.00 Depreciation 10263 151.07 375.94 0.00 5177.00 Sales 10263 2896.10 7173.12 -0.87 99512.40 Net PPE 10263 1396.05 3829.27 0.00 48043.24 ROA 10263 -7.42 53.04 -1706.42 35.54 Total Assets 10263 3506.34 7706.22 0.21 60966.00 Debt to equity 10263 59.60 115.00 -620.07 938.05 Market to book 10263 3.05 4.94 -43.98 61.63 Panel C – Companies audited by a non-leader Variable N Mean SD Min Max Discretionary Accruals 21425 -0.01 0.14 -1.91 2.15 Current Assets 21425 1109.04 2742.48 0.00 39637.00 Current Liabilities 21425 793.55 2129.19 0.00 31538.00 Cash 21425 328.04 1052.60 -0.16 31600.00 Short Term Debt 21425 154.20 587.96 0.00 11251.27 Depreciation 21425 154.81 436.14 0.00 7951.61 Sales 21425 2871.17 7450.72 -0.23 137634.00 Net PPE 21425 1237.00 3522.04 0.00 51444.79 ROA 21425 -5.35 46.78 -1561.29 35.73 Total Assets 21425 3312.18 7676.35 0.072 61097.44 Debt to equity 21425 58.22 114.28 -644.63 940.98 Market to book 21425 3.09 4.94 -43.83 61.78 Discretionary Accruals, using Modified Jones Model, are the residual in model (2) run with no intercept, Current Assets are year-end current assets (COMPUSTAT item A4 ), current liabilities are the year-end current liabilities (COMPUSTAT item A5 ), cash is cash and cash equivalent (COMPUSTAT item A1), Long Term Debt is
56 Journal of Management Policy and Practice vol. 15(2) 2014
(COMPUSTAT item A9), Depreciation is depreciation and amortization expense (COMPUSTAT item A14 ), Sales are net sales (COMPUSTAT item A12), Net PPE is net property plant and equipment (COMPUSTAT item A8 ), ROA is return on assets (COMPUSTAT items (COMPUSTAT item A237 divided by item A6 multiplied by100), Total Assets (COMPUSTAT item A2), Debt to Equity is the long term debt to shareholders equity ratio (COMPUSTAT item 100 x (COMPUSTAT item A9 / (COMPUSTAT item A60 + COMPUSTAT item A130) ), Market to Book is company’s market value to its book value.
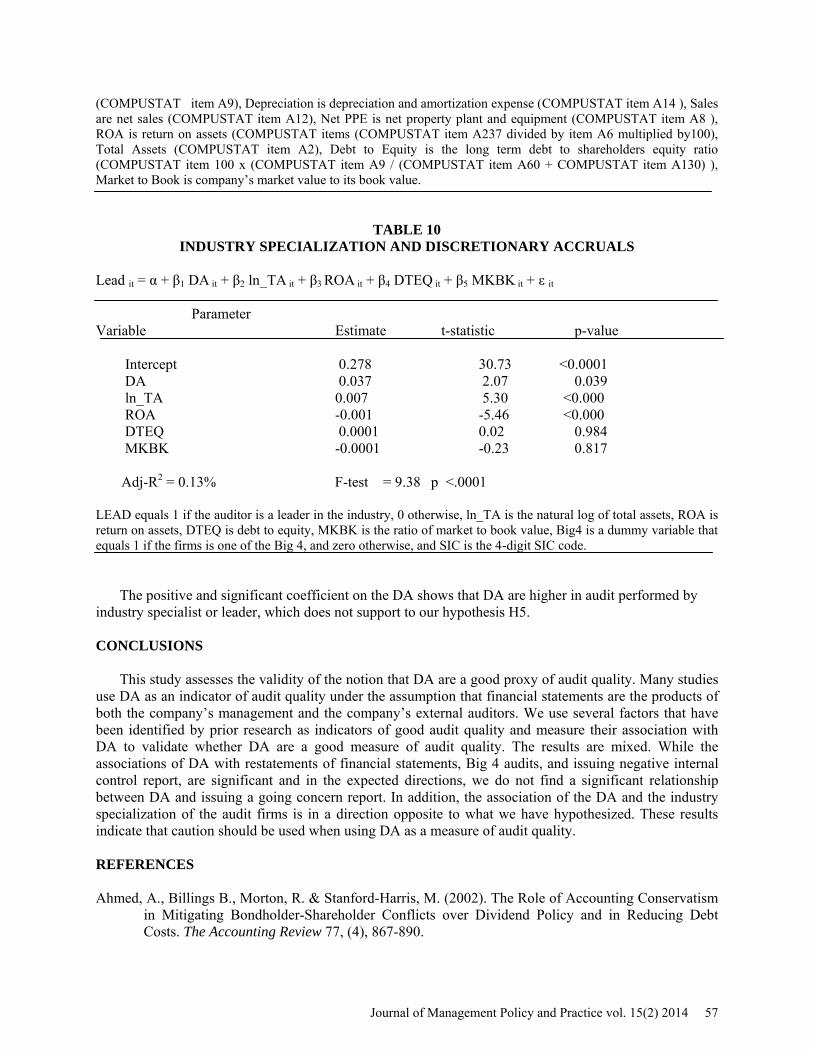
TABLE 10 INDUSTRY SPECIALIZATION AND DISCRETIONARY ACCRUALS
Lead it = α + β1 DA it + β2 ln_TA it + β3 ROA it + β4 DTEQ it + β5 MKBK it + ε it Parameter Variable Estimate t-statistic p-value Intercept 0.278 30.73 <0.0001 DA 0.037 2.07 0.039 ln_TA 0.007 5.30 <0.000 ROA -0.001 -5.46 <0.000 DTEQ 0.0001 0.02 0.984 MKBK -0.0001 -0.23 0.817 Adj-R2 = 0.13% F-test = 9.38 p <.0001 LEAD equals 1 if the auditor is a leader in the industry, 0 otherwise, ln_TA is the natural log of total assets, ROA is return on assets, DTEQ is debt to equity, MKBK is the ratio of market to book value, Big4 is a dummy variable that equals 1 if the firms is one of the Big 4, and zero otherwise, and SIC is the 4-digit SIC code.
The positive and significant coefficient on the DA shows that DA are higher in audit performed by industry specialist or leader, which does not support to our hypothesis H5. CONCLUSIONS
This study assesses the validity of the notion that DA are a good proxy of audit quality. Many studies use DA as an indicator of audit quality under the assumption that financial statements are the products of both the company’s management and the company’s external auditors. We use several factors that have been identified by prior research as indicators of good audit quality and measure their association with DA to validate whether DA are a good measure of audit quality. The results are mixed. While the associations of DA with restatements of financial statements, Big 4 audits, and issuing negative internal control report, are significant and in the expected directions, we do not find a significant relationship between DA and issuing a going concern report. In addition, the association of the DA and the industry specialization of the audit firms is in a direction opposite to what we have hypothesized. These results indicate that caution should be used when using DA as a measure of audit quality. REFERENCES Ahmed, A., Billings B., Morton, R. & Stanford-Harris, M. (2002). The Role of Accounting Conservatism
in Mitigating Bondholder-Shareholder Conflicts over Dividend Policy and in Reducing Debt Costs. The Accounting Review 77, (4), 867-890.
Journal of Management Policy and Practice vol. 15(2) 2014 57

Ajona, L, Dallo F.L. & Alegria, S.S. (2008). Discretionary Accruals and Auditor Behavior in Code-Law Contexts: An Application to Failing Spanish Firms. European Accounting Review 17, (4), 641-666.
Allen, A. & Woodland, A. (2010). Education Requirements, Audit Fees, and Audit Quality. Auditing: A Journal of Practice & Theory 29, (2), 1-25.
Arnes, A., Elder, R.J. & Beasley, M.S. (2008). Auditing and Assurance Services, an Integrated Approach, 12th ed., McGraw-Hill.
Balsam, S., Krishnan, J. & Yang, J.S. (2003). Auditor Industry Specialization and Earnings Quality. Auditing: A Journal of Practice & Theory 22, (2), 71-97.
Bartov, E., Gul F.A. & Tsui, J. (2000). Discretionary-Accruals Models and Audit Qualifications. Journal of Accounting and Economics 30, (3), 421-52.
Becker, C.L., Defond M.L., Jiambalvo, L. & Subrammanyan, K.R. (1998). The Effect of Audit Quality on Earnings Management. Contemporary Accounting Research 15, (1), 1-24.
Bedard, J.C., Hoitash, R., Hoitash, U. & Westermann, K. (2012). Material Weakness Remediation and Earnings Quality: A Detailed Examination by Type of Control Deficiency. Auditing: A Journal of Practice & Theory 31, (1), 57-78.
Carey, P. & Simnett, R. (2006). Audit Partner Tenure and Audit Quality. The Accounting Review 81, (3), 653-676.
Chambers, D. & Payne, J. (2011). Audit Quality and Accrual Persistence: Evidence from the Pre- and Post-Sarbanes-Oxley Periods. Managerial Auditing Journal 26, (5), 437-456.
Chen, C.Y., Lin, C.J. & Lin, Y.C. (2008). Audit Partner Tenure, Audit Firm Tenure, and Discretionary Accruals: Does Long Auditor Tenure Impair Earnings Quality? Contemporary Accounting Research 25, (2), 415-445.
Chi, W., Huang, H., Liao, Y. & Xie, H. (2009). Mandatory Audit Partner Rotation, Audit Quality, and Market Perception: Evidence from Taiwan. Contemporary Accounting Research 26, (2), 359-391.
Chi, W., Lisic L.L. & Pevzner, M. (2011). Is Enhanced Audit Quality Associated with Greater Real Earnings Management? Accounting Horizons 25, (2), 315-335.
Chin, C.L. & Chi, H.Y. (2009). Reducing Restatements with Increased Industry Expertise. Contemporary Accounting Research 26, (3), 729-765.
Choi, J.-H., Kim, C., Kim, J. B. & Zang, Y. (2010). Audit Office Size, Audit Quality, and Audit Pricing. Auditing: A Journal of Practice & Theory 29, (1), 73-97.
Choi, J. H., Kim, J. B. & Zang, Y. (2010). Do Abnormally High Audit Fees Impair Audit Quality? Auditing: A Journal of Practice & Theory 29, (2), 115-140.
Chung, H. & Kallapur, S. (2003). Client Importance, Nonaudit Services, and Abnormal Accruals. The Accounting Review 78, (4), 931–955.
DeAngelo, L. (1981). Auditor Size and Audit Quality. Journal of Accounting and Economics 3, (3), 183-199.
DeFond, M.L. & Francis, J.R. (2005). Audit research after Sarbanes-Oxley. Auditing: A Journal of Practice &Theory 24, (Supplement), 5-30.
DeFond, M.L. & Subramanyam, K.R. (1998). Auditor Changes and Discretionary Accruals. Journal of Accounting and Economics 25, (1), 36-76.
Deis, D.R. & Giroux, G. (1992). Determinants of audit quality in the public sector. The Accounting Review 67, (3), 462–479.
Dye, R. (1993). Auditing Standards, Legal Liability, and Auditor Wealth. The Journal of Political Economy 101, (5), 887-914.
Francis, J. & Yu, M.D. (2009). Big 4 Office Size and Audit Quality. The Accounting Review September 84, (5), 1521-1552.
Francis, J. R. (2011). A Framework for Understanding and Researching Audit Quality. Auditing: A Journal of Practice & Theory 30, (2), 125-152.
Gunny, K. & Zhang, T. (2009). PCAOB Inspection Report and Audit Quality. Working Paper. http://ssrn.com/abstract=1339449
58 Journal of Management Policy and Practice vol. 15(2) 2014

Heninger, W.G. (2001). The Association between Auditor Litigation and Abnormal Accruals. The Accounting Review 76, (1), 111–126.
Jensen, K.L. & Payne, J.L. (2005). Audit Procurement: Managing Audit Quality and Audit Fees in Response to Agency Costs. Auditing: A Journal of Practice and Theory 24, (2), 27-48.
Knechel, W.R. & Vanstraelen, A. (2007). The Relationship between Auditor Tenure and Audit Quality Implied By Going Concern Opinions. Auditing: A Journal of Practice & Theory 26, (1), 113-131.
Knapp, M.C. (1991). Factors that Audit Committee Members Use as Surrogate for Audit Quality. Auditing: A Journal of Practice & Theory 10, (1), 53-52.
Krishnan, G.V. (2003). Audit Quality and The Pricing Of Discretionary Accruals. Auditing: A Journal of Practice & Theory 22, (1), 109-126.
Krishnan, G.V. (2003). Does Big 6 Auditor Industry Expertise Constrain Earnings Management? Accounting Horizons 17, (Supplement), 1–16.
Lee, H. & Mande, V. (2003). The Effect of the Private Securities Litigation Reform Act of 1995 on Accounting Discretion of Client Managers of Big 6 and Non-Big 6 Auditors. Auditing: A Journal of Practice and Theory 22, (1), 93–108.
Lennox, C. (1999). Are Large Auditors More Accurate than Small Auditors? Accounting and Business Research 29, (3), 217–227.
Manry D.L., Mock, T.J. & Turner, J.L. (2008). Does Increased Audit Partner Tenure Reduce Audit Quality? Journal of Accounting Auditing and Finance 23, (4), 553-572.
Nagy, A. (2005). Mandatory Audit Firm Turnover, Financial Reporting Quality, and Client Bargaining Power: The Case of Arthur Andersen. Accounting Horizons 19, (2), 51–68.
Nusbaun, E.E. (2007). Top 10 Wish List for Audit Research. Current Issues in Auditing 3, C3-C9. O’Keefe, T.B., King R.D. & Gaver, K.M. (1994). Audit Fees, Industry Specialization, and Compliance
with GAAS Reporting Standards. Auditing: A Journal of Practice & Theory 13, (2), 41– 55. Romanus, R.N., Maher J.J. & Fleming, D.M. (2008). Auditor Industry Specialization, Auditor Changes,
and Accounting Restatements. Accounting Horizons 22, (4), 389-413. Schroeder, M.S., Solomon, I. & Vickery, D. (1986). Audit Quality: The Perceptions of Audit-Committee
Chairpersons and Audit Partners. Auditing: A Journal of Practice & Theory 5, (2), 86-94. Stanley, J.D. & DeZoort, F.T. (2007). Audit Firm Tenure And Financial Restatements: An Analysis Of
Industry Specialization And Fee Effects. Journal of Accounting & Public Policy 26, (2), 131-159.
Journal of Management Policy and Practice vol. 15(2) 2014 59