Embed Size (px)
Citation preview
LiveabiLity
StandardS in Cities

2 | LiveabiLity StandardS in Cities

Table of Contents
OVERVIEW 1
A. Background 1
B. Framework 2
Pillar: INSTITUTIONAL 4
Category 1: GOVeRnAnCe 5
Pillar: SOCIAL 7
Category 2: iDentitY AnD CULtURe 8
Category 3: eDUCAtiOn 10
Category 4: HeALtH 12
Category 5: sAFetY AnD seCURitY 14
Pillar: ECONOMIC 15
Category 6: eCOnOMY AnD eMPLOYMent 16
Pillar: PHYSICAL 18
Category 7: HOUsinG AnD inCLUsiVeness 19
Category 8: PUBLiC OPen sPACes 20
Category 9: MiXeD LAnD Use AnD COMPACtness 21
Category 10: POWeR sUPPLY 22
Category 11: tRAnsPORtAtiOn AnD MOBiLitY 24
Category 12: AssUReD WAteR sUPPLY 27
Category 13: WAste WAteR MAnAGeMent 29
Category 14: sOLiD WAste MAnAGeMent 31
Category 15: ReDUCeD POLLUtiOn 32
ANNEX 1 34
List OF inDiCAtORs 35


LiveabiLity StandardS in Cities | 1
table 1: Categories of indicators
FeatUre COntained in SCPs CateGOry PiLLar OF COMPreHenSive deveLOPMent
Citizen Participationit ConnectivityiCt-enabled Government services
1. Governance institutional
identity and Culture 2. identity and Culture social
education 3. education
Health 4. Health
safety and security 5. safety and security
economy and employment 6. economy and employment economic
Housing and inclusiveness 7. Housing and inclusiveness Physical
Open spaces 8. Public Open spaces
Mixed Land useCompactness
9. Mixed Land Use and Compactness
energy supplyUnderground electric Wiringenergy source energy efficiency
10. Power supply
transportation and MobilityWalkability
11. transportation and Mobility
Water supplyWater Management
12. Assured Water supply
sanitationWaste Water Management
13. Waste Water Management
Waste Management 14. solid Waste Management
Air Quality 15. Reduced Pollution(‘noise Pollution’ and ‘Pollution of surface Water Bodies’ have also been included)
goal of the various missions and schemes is to
make indian cities more ‘Liveable’. the Ministry of
Urban Development (MoUD) has developed a set
of ‘Liveability standards in Cities’ to generate a
A. Background
the Government of india along with the various
state and Local Governments is implementing
several flagship Urban Missions. An overarching
Overview

2 | LiveabiLity StandardS in Cities
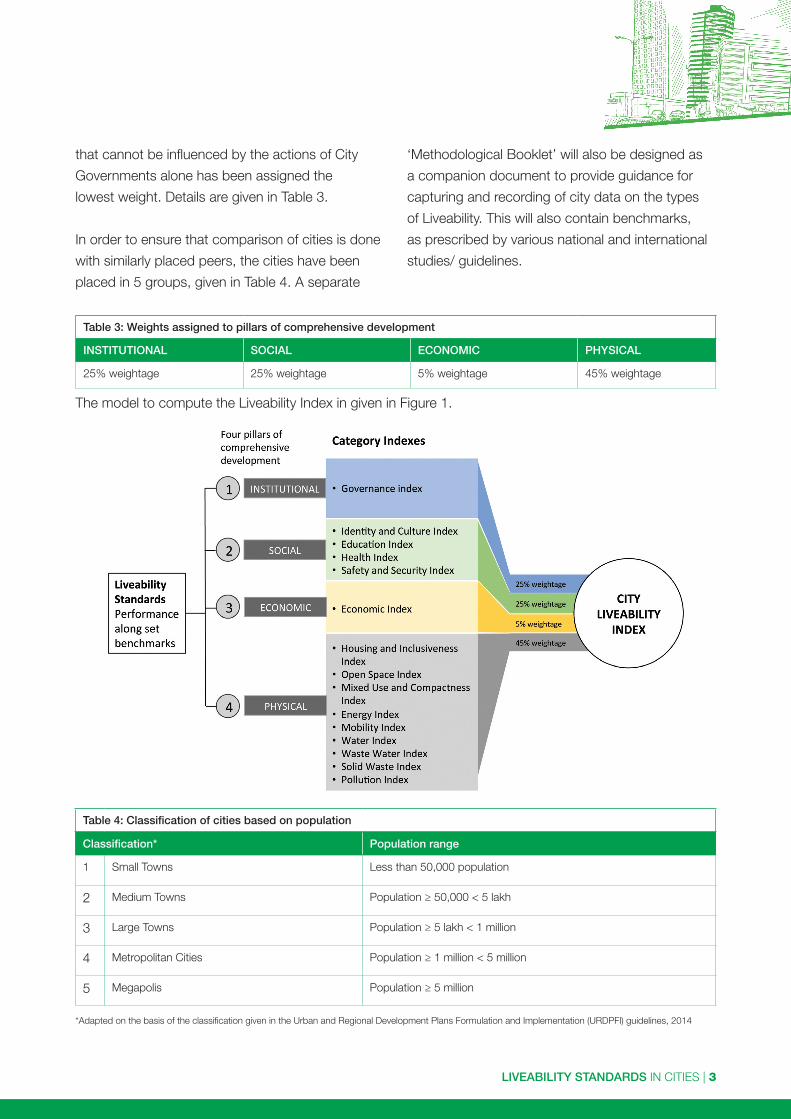
sub-indexes will be developed for each of the
categories to form 15 ‘Category indexes’, which
will be aggregated to a common ‘City Liveability
index’ for each city on the 79 indicators. Annex
1 gives the list of 79 indicators and the way they
will contribute to achievement of sDGs. Weights
will be assigned to Category indexes during the
calculation of the City Liveability index, depending
upon the pillar of comprehensive development.
‘Physical’ pillar has been accorded the highest
weightage, followed by ‘institutional’ and ‘social’
pillar, which includes aspects such as safety and
security (as per Maslow Pyramid of needs). the
weights also recognize the extent to which, City
Governments can actively make improvements
in the indicators. thus, the ‘economic’ pillar
Liveability index and rate cities. the source of the
Liveability standards are the 24 features contained
in the smart City Proposals (sCPs), which have
been grouped into 15 categories. these categories
are part of the four pillars of comprehensive
development of cities. the details are given
in table 1.
B. Framework
A total of 79 indicators (57 Core indicators and
22 supporting indicators) have been prescribed
in the document. While the Core indicators are
considered an essential measure of liveability of
cities, the supporting indicators supplement the
Core indicators by adding value to them.these
are organized in 15 ‘Categories’ given earlier. the
details are given in table 2.
table 2: Category-wise number of indicators
CateGOry NUMBER OF INDICATORS
COre SUPPOrtinG tOtaL
1. Governance 7 1 8
2. identity and Culture 3 2 5
3. education 4 2 6
4. Health 3 2 5
5. safety and security 3 1 4
6. economy and employment 4 1 5
7. Housing and inclusiveness 2 - 2
8. Public Open space 2 - 2
9. Mixed Land Use and Compactness 2 - 2
10. Power supply 4 5 9
11. transportation and Mobility 6 6 12
12. Assured Water supply 4 2 6
13. Waste Water Management 5 - 5
14. solid Waste Management 3 - 3
15. Reduced Pollution 5 - 5
tOtAL 57 22 79
LiveabiLity StandardS in Cities | 3
‘Methodological Booklet’ will also be designed as
a companion document to provide guidance for
capturing and recording of city data on the types
of Liveability. this will also contain benchmarks,
as prescribed by various national and international
studies/ guidelines.
that cannot be influenced by the actions of City
Governments alone has been assigned the
lowest weight. Details are given in table 3.
in order to ensure that comparison of cities is done
with similarly placed peers, the cities have been
placed in 5 groups, given in table 4. A separate
table 3: Weights assigned to pillars of comprehensive development
inStitUtiOnaL SOCiaL eCOnOMiC PHySiCaL
25% weightage 25% weightage 5% weightage 45% weightage
the model to compute the Liveability index in given in Figure 1.
*Adapted on the basis of the classification given in the Urban and Regional Development Plans Formulation and implementation (URDPFi) guidelines, 2014
Classification* Population range
1 small towns Less than 50,000 population
2 Medium towns Population ≥ 50,000 < 5 lakh
3 Large towns Population ≥ 5 lakh < 1 million
4 Metropolitan Cities Population ≥ 1 million < 5 million
5 Megapolis Population ≥ 5 million
table 4: Classification of cities based on population

4 | LiveabiLity StandardS in Cities
Pillar: INSTITUTIONAL
LiveabiLity StandardS in Cities | 5
1.3 Percentage of citizens using online services
(Core)
Description: the extent to which citizens have
started using the online portals and phone-based
smart applications for accessing various citizen
services that are being provided online.
expressed as
Average for all citizen services
number of registered users using online services
in a month
--------------------------------------- X 100 = _____%
total number of households
1.4 average delay in grievance redressal (Core)
Description: this denotes the efficiency achieved
in addressing complaints/issues raised by citizens
regarding the various services being provided by
the ULB. Most cities have committed grievance
redressal timelines as part of their Citizen Charters.
the Guidelines on national Mission Mode Project
on e-Governance in Municipalities of the MoUD
provide the guidelines and benchmarks for
grievance acknowledgement and redressal.
expressed as
Average of all services
[Average redressal period for a service - Committed
redressal period for the service] = ______ days
1.5 tax collected as percentage of tax billed
(Core)
Description: this denotes the efficiency achieved
by a city in collecting property taxes against the
1.1 Percentage of citizen services available
online (Core)
Description: the extent to which, various citizen
services can be accessed by citizens remotely,
through online portals, phone applications,
e-kiosks etc. Citizen services will include various
online payments of taxes and charges, applications
and approvals, grievance management, issue of
documents like birth and death certificates etc.
expressed as
number of citizen services available online
---------------------------------------- X 100 = _____%
total number of citizen services provided by the
ULB
1.2 Percentage of services integrated through
Command Centre (Supporting)
Description: the extent to which, various city
services like water supply, sewerage, waste
management, e-governance, urban transport etc.
have been integrated through singular Operations
or Command and Control Centres. such
integration can facilitate better data management
and horizontal integration across various services,
leading to overall efficiency in service provision
and optimal use of resources.
expressed as
number of services integrated through singular
operations centre
--------------------------------------- X 100 = _____%
total number of services provided by the ULB
Category 1: Governance
6 | LiveabiLity StandardS in Cities
1.7 Capital spending as percentage of total
expenditure (Core)
Description: the extent to which, a ULB is able
to re-invest its revenues into creation of capital
(infrastructure and assets), after taking care of
annual establishment and O&M costs. this is
a strong measure of the financial health of cities
and a higher percentage indicates that the city
is proactively improving its services and facilities.
expressed as
total capital expenditure during a year
------------------------------------ X 100 = _____%
total expenditure (revenue and capital accounts)
in the same year
1.8 Percentage of population covered under
Ward Committees/ area Sabhas (Core)
Description: the participation of citizens in matters
of governance, planning and development is critical
for ensuring inclusive and participatory growth
of cities. this indicator determines the extent of
institutionalization of citizen participation, through
implementation of the provisions of the Community
Participation Law.
expressed as
Population covered under ward committees/ area
sabhas
--------------------------------------- X 100 = _____%
total population of the city
tax demand raised in a given year. implementation
of smart solutions in cities will be expected to
improve systemic efficiencies in issuance of regular
and timely demand notices, and facilitate ease
of payment (online, m-applications etc.), thereby
leading to improvement in collection of taxes and
ULB revenues.
expressed as
total tax collected in a year
---------------------------------------- X 100 = _____%
total demand raised for the year
1.6 extent of cost recovery (O&M) in water
supply services (Core)
Description: the extent to which O&M expenditure
on provision of water supply services is being
recovered by city administrations through user
charges. O&M cost can be reduced through
the implementation of monitoring systems like
sCADA, installation of smart meters and reduction
in nRW. this coupled with adoption of telescopic
and volume based tariffs, and efficient billing and
collection systems can result in better recovery of
costs.
expressed as
total collection of user charges in water supply in a
year
--------------------------------------- X 100 = _____%
total O&M cost for providing water supply services
during the year

LiveabiLity StandardS in Cities | 7
Pillar: SOCIAL

8 | LiveabiLity StandardS in Cities
and suffer from invasive development along the
edges, deterioration due to dumping of wastes and
waste water, pollution, silting and narrowing etc.
Restoration of such sites can lead to better urban
environment and sustainable development.
expressed as
ecologically important sites covered through
projects for restoration
------------------------------------- X 100 = _____%
total number of ecologically important sites
identified in the city
2.3 Hotel Occupancy (Core)
Description: this indicates the extent to which the
city is frequented by tourists/visitors coming to the
city for various purposes such as tourism, business
or other work related activities. High average hotel
occupancy rates across different times of the
year indicate a flourishing inflow of visitors, fuelled
by improvements in economic productivity and
business environment, concerted efforts towards
upkeep and marketing of local heritage and
ecological assets (eco-tourism), and availability of
adequate opportunities for exploring local identity
and culture.
expressed as
Average of various categories of hotels
total number of hotel rooms occupied
---------------------------------------- X 100 = _____%
total number of hotel rooms available
2.1 restoration and reuse of historic buildings
(Core)
Description: the extent to which planning
and development in the city respects historic
buildings/sites and the existing cultural landscape,
through projects for preservation/restoration and
adaptive reuse. Heritage assets are listed by the
Archaeological survey of india (Asi) and various
state Asis. City governments may also undertake
listing of buildings, sites, precincts considered
historically significant locally due to their cultural
importance. the guidelines for local listing and
grading of heritage assets are provided by the
town and Country Planning Organization (tCPO),
MoUD (Model Heritage Regulations, 2011).
expressed as
Average for buildings listed by Asi, state Asi and
Local Authority
number of historic buildings/sites restored/
preserved/brought under adaptive reuse
---------------------------------------- X 100 = _____%
total number of historic buildings/sites identified
2.2 Percentage of ecologically important areas
covered through projects for restoration (Core)
Description: the extent to which the city has
taken ecologically sensitive areas (natural heritage)
into consideration during the process of planning
and development. ecologically sensitive sites will
include surface water bodies, urban watershed
(natural drainage lines), coastlines, riverfronts,
wetlands and urban forests. such sites are often
ignored in the process of urban development
Category 2: Identity and culture

LiveabiLity StandardS in Cities | 9
2.4 Percentage of budget allocated towards
cultural/sports activities (Supporting)
Description: this indicates the focus of the
City Government on encouraging cultural and
sports activities in the city. Active budgeting and
expenditure by city governments on such cultural/
sports activities can facilitate a vibrant socio-
cultural environment within cities.
expressed as
Budget allocated for cultural/sports activities
--------------------------------------- X 100 = _____%
total budget of the ULB (capital and revenue)
2.5 number of cultural/sports events hosted by
city authority (Supporting)
Description: this along with the previous indicator
2.4 indicates the focus of the City Government on
encouraging cultural and sports activities in the city.
While some of the activities may be actively funded
through ULB funds, others may be supported
by the city administration through facilitation of
permissions and provision of land/facilities.
expressed as
number of cultural/sports events hosted by
the city authority in the preceding year

10 | LiveabiLity StandardS in Cities
Category 3: Education
3.1 Percentage of school-aged population
enrolled in schools (Core)
Description: education is one of the most important
aspects of human development. this indicator
denotes educational opportunity, and determines
the coverage of formal education among school-
aged population in the city. the Right of Children to
Free and Compulsory education Act (Rte Act) of
2009 provides for children below the age of 14 to
be provided free and compulsory education.
expressed as
total enrolment in primary and secondary schools
(public and private)
---------------------------------------- X 100 = _____%
total population in the age group of 6-14 years
3.2 Percentage of female school-aged
population enrolled in schools (Core)
Description: this indicator determines the
availability of educational opportunity for girls.
Reporting on differential enrolment by gender is
also consistent with the sustainable Development
Goals. the Rte Act 2009 provides for children
below the age of 14 to be provided free and
compulsory education.
expressed as
total female enrolment in primary and secondary
schools (public and private)
---------------------------------------- X 100 = _____%
total female population in the age group of 6-14
years
3.3 Primary education student-teacher
ratio (Core)
Description: this denotes the availability of
adequate number of teachers in schools for
providing primary education. A lower ratio indicates
better individual attention and support for students
in the primary grades. the norms for an acceptable
student-teacher ratio are set out under the Rte Act
2009.
expressed as
total number of students in primary grades (public
and private)
------------------------------------------------ = _____
total number of teachers available for primary
grades (public and private schools)
3.4 Percentage of schools with access to digital
education (Supporting)
Description: the extent to which government
schools have facilities for accessing digital
educational content, thereby reducing the complete
dependence on the quality of teachers as well
as improving learning outcomes through use of
innovative audio-visual pedagogy and providing
access to vast online knowledge repositories.
it is important for schools to not only focus on
procuring digital infrastructure but also focus on
connecting to robust digital learning networks
such as the national Knowledge network (nKn)
developed by the Government of india.

LiveabiLity StandardS in Cities | 11
expressed as
number of schools (public and private) with
facilities for using digital educational content
(availability of necessary infrastructure and
connection to digital
resources such as nKn)
---------------------------------------- X 100 = _____%
total number of schools
3.5 Percentage of students completing primary
education (Core)
Description: the ability of the primary education
system in the city to hold enrolled students until the
completion of primary education (survival rate). it is
the percentage of students belonging to a school-
cohort who have reached each successive grade
of primary education without failing or moving to
another jurisdiction. survival rate, particularly at
the primary level, is considered a pre-requisite
for sustainable literacy, and indicates the holding
power and efficiency of the primary education
system.
expressed as
Average for all school cohorts enrolled in base year
number of students from a school cohort
completing primary education
---------------------------------------- X 100 = _____%
total number of students belonging to the school
cohort
3.6 Percentage of students completing
secondary education (Supporting)
Description: the ability of the secondary
education system to hold enrolled students until
the completion of secondary education (survival
rate). it is the percentage of students belonging
to a school-cohort i.e. those originally enrolled in
the first grade of secondary education, who have
reached each successive grade of secondary
education without failing or moving to another
jurisdiction.
expressed as
Average for all school cohorts enrolled in base year
number of students from a school cohort
completing secondary education
---------------------------------------- X 100 = _____%
total number of students belonging to the school
cohort

12 | LiveabiLity StandardS in Cities
4.1 number of in-patient hospital beds per
10,000 population (Core)
Description: this denotes the adequacy of in-
patient medical infrastructure measured in the
form of availability of in-patient beds in hospitals
(public and private) in the city. the World Health
Organization (WHO) provides the benchmarks for
health services as part of its service Availability and
Readiness Assessment initiative (sARA Reference
Manual 2015).
expressed as
number of in-patient hospital beds in public and
private hospitals
--------------------- X 10,000 = ________ per 10,000
total population of the city
4.2 Healthcare professionals per 10,000
population (Supporting)
Description: this denotes the availability of health
workers in the city (health worker density) that
cater to the health needs of citizens. this includes
various qualified human resources for healthcare
including doctors, nurses, mid-wives etc. the
World Health Organization (WHO) provides the
benchmarks for health services as part of its
service Availability and Readiness Assessment
initiative (sARA Reference Manual 2015).
expressed as
total number of qualified healthcare professionals
--------------------- X 10,000 = ________ per 10,000
total population of the city
Category 4: Health
4.3 average response time in case of health
emergencies (Supporting)
Description: the average response time taken by
emergency Medical services (eMs) to respond
to an initial distress call. Response time is the time
elapsed from receiving the initial call to arrival on-
site of emergency personnel and equipment. Lower
response times indicate better preparedness and
response to emergency calls, resulting in effective
and timely medical attention.
expressed as
sum of all response times for distress calls received
during the year
--------------------------- = ___mins ____seconds
total number of emergency responses in the same
year
4.4 Period prevalence of water borne diseases
(Core)
Description: this denotes the prevalence of water
borne diseases such as cholera, typhoid, dysentery
etc. in the city during a particular time period.
it is an indicator of the quality of water used for
drinking, washing, bathing etc. in the city.
expressed as
number of cases of persons affected by water
borne diseases in a year
---------------------------------------- X100 = _____%
total population of the city

LiveabiLity StandardS in Cities | 13
4.5 Period prevalence of vector borne diseases
(Core)
Description: this denotes the prevalence of
vector borne diseases such as malaria, dengue,
chikungunya etc. in the city during a particular time
period. it is an indicator of the measures taken
by city administrations to control the growth of
mosquitoes and other organisms that spread such
diseases, and the general level of hygiene and
sanitation in the city.
expressed as
number of cases of persons affected by vector
borne diseases in a year
------------------------------------ X100 = _____%
total population of the city
14 | LiveabiLity StandardS in Cities
to be expressed as
total number of crimes recorded in a year
------------------------- X 1,00,000 = _____ per lakh
total population of the city
5.3 extent of crimes recorded against women,
children and elderly per year (Core)
Description: this denotes the proportion of crimes
committed against vulnerable groups such as
women, children and elderly.
to be expressed as
number of crimes recorded against vulnerable
groups (women, children and elderly) in a year
------------------------------------- X 100 = _____%
total crimes recorded in the same year
5.4 transport-related fatality per lakh
population (Supporting)
Description: this denotes the level of safety of
transport networks in the city. Better managed
transport systems will tend to be safer and record
lower transport related fatalities. service Level
Benchmarks (sLBs) for Urban transport developed
by the MoUD provide guidance on the service
levels for transport.
to be expressed as
total number of fatalities recorded in road
accidents in a year
------------------------ X 1,00,000 = _____ per lakh
total population of the city
Category 5: Safety and Security
5.1 number of streets, public places, junctions
covered through surveillance systems (Core)
Description: the extent to which public areas
such as streets, public places like transport
interchanges, government buildings, recreational
spaces etc. and major traffic junctions in the city
are covered through Closed-circuit television
(CCtV) surveillance cameras. this can facilitate real
time monitoring of instances of crime or accident
and quicker responses in emergency situations.
such surveillance systems can result in improved
security and incidence management, and in the
specific case of traffic junctions, also help in
obtaining real time information regarding pedestrian
and vehicular flow for monitoring road accidents.
to be expressed as
number of streets, public places and major traffic
junctions covered through CCtV cameras
-------------------------------------- X 100 = _____%
total number of streets, public places and major
traffic junctions in the city
5.2 number of recorded crimes per lakh
population (Core)
Description: this denotes the prevalent crime
rate in a city. Lower crime rates are indicative of
higher levels of safety and security in a city, due
to effective surveillance in public spaces, better
sOs and crime registration systems, and police
response mechanisms. Better planning and
programming of public spaces, illumination of
streets, compact and active neighbourhoods can
also contribute to safer cities.

LiveabiLity StandardS in Cities | 15
Pillar: ECONOMIC

16 | LiveabiLity StandardS in Cities
6.3 increase in issuance of Construction
Permits (Core)
Description: this is one of the important indicators
of economic productivity and competitiveness of
a city, along with indicators 6.1 and 6.2. increases
in issuance of construction permits indicates
improvements in the construction/real estate sector
in the city.
expressed as
(number of construction permits issued during
the year – number of construction permits during
preceding year)
---------------------------------------- X 100 = _____%
number of construction permits during preceding
year
6.4 Unemployment rate (Core)
Description: employment generation is one of the
key channels through which economic growth
translates into prosperity for the population.
Unemployment rate of a city denotes the
proportion of work force in a city that is not
engaged in gainful employment or economic
activity, and is given as persons unemployed per
1000 persons in the labour force (employed and
unemployed).
expressed as
number of unemployed persons (seeking or
available for work)
-------------------------------------- X 1000 = _____
total labour force in the city
6.1 increase in vat/GSt collection (Core)
Description: this is one of the important indicators
of economic productivity and competitiveness of
a city, along with indicators 6.2 and 6.3. increase
in collection of Value-added tax (VAt) or Goods
and services tax (Gst) is a proxy for improvements
in trade and services in the city.
expressed as
(total VAt/Gst collection during the year – total
VAt/Gst collection during preceding year)
------------------------------------- X 100 = _____%
total VAt/Gst collection during preceding year
6.2 increase in collection of Professional tax
(Core)
Description: this is one of the important indicators
of economic productivity and competitiveness of
a city, along with indicators 6.1 and 6.3. increase
in collection of Professional tax is a proxy for
improvements in organized sector employment
in the city.
expressed as
(total Professional tax collection during the year –
total Professional tax collection during preceding
year)
---------------------------------------- X 100 = _____%
total Professional tax collection during preceding
year
Category 6: Economy And Employment

LiveabiLity StandardS in Cities | 17
6.5 Percentage of vendors registered and
provided formal spaces (Supporting)
Description: the extent to which the city has
implemented inclusive strategies for protecting
livelihoods of street vendors, by integrating such
activities with public places (including streets) in line
with the street Vendors Act of 2014.
expressed as
number of street vendors registered and provided
formal spaces
------------------------------------- X 100 = _____%
total number of vendors in the city

18 | LiveabiLity StandardS in Cities
Pillar: PHYSICAL

LiveabiLity StandardS in Cities | 19
7.2 Percentage of slum areas covered through
basic services (Core)
Description: this denotes the extent to which basic
services of water supply, waste water management
and solid waste management (sWM) are available
in slum areas of the city.
expressed as
slum areas covered through basic services
-------------------------------------- X 100 = _____ %
total area under slums in the city
7.1 Percentage of Slum/eWS households
covered through formal/affordable housing
(Core)
Description: the extent to which slum households
have been provided formal housing through
redevelopment projects, and eWs (economically
weaker section) households have been covered
through various affordable housing projects and
schemes. improved housing supply to the poorer
sections can to lead to overall improvement in the
living conditions of the poor.
expressed as
total number of slum and eWs households
covered through formal/affordable housing
--------------------------------------- X 100 = _____ %
total number of slum and eWs households in the
city
Category 7: Housing And Inclusiveness
20 | LiveabiLity StandardS in Cities
8.2 Per capita availability of public and
recreational places (Core)
Description: this indicator denotes the extent to
which recreational and public spaces are available
in the city for recreation, social interaction and
active physical activities. such spaces can include
playgrounds, stadiums and sports complexes, city
and district parks, neighbourhood parks and tot
lots, zoological/botanical gardens, multi-use open
spaces and maidans for cultural events, publicly
accessible waterfront areas, promenades, public
squares etc.
expressed as
total area of public and recreational places (sq.m.)
------------------------------------------ = _____ sq.m.
total population of the city
8.1 Per capita availability of green spaces
(Core)
Description: the extent to which urban greens
and open spaces such as recreational spaces,
organized greens and common spaces like flood
plains, forest cover, vacant lands etc. are available
in the city leading to a better urban environment.
the Urban and Regional Development Plans
Formulation and implementation (URDPFi)
guidelines, 2014 prescribe benchmarks for open
spaces in cities.
expressed as
total area of green space (sq.m.)
------------------------------------------ = _____ sq.m.
total population of the city
Category 8: Public Open Spaces
LiveabiLity StandardS in Cities | 21
9.2 net density (Core)
Description: this denotes the intensity of
development in the city. Higher net densities
coupled with mixed land use areas can result
in a compact development pattern, potentially
forming walkable and inviting activity centres and
neighbourhoods.
expressed as
total population of the city
------------------------ = _____ persons per hectare
Area allocated for residential land use (in hectares)
9.1 Share of mixed land use area in overall city
land use (Core)
Description: this indicates the proportion of areas
in the city which have been developed as multi-
functional zones, i.e. areas where residential,
commercial and non-polluting industrial activity/
service industry are planned in close proximity
to one another as an integrated mix. this is
an important departure from the emphasis of
modern planning on functional separation leading
to unsustainable land use patterns (large mono-
functional land uses, longer trip distances, overt
reliance on motorized transport etc.). the URDPFi
guidelines, 2014 provide the guidelines for planning
of mixed land use areas.
expressed as
total area under mixed land use
--------------------------------------- X 100 = _____%
total area of the city (total area of all land uses)
Category 9: Mixed Land Use And Compactness

22 | LiveabiLity StandardS in Cities
in terms of frequency of electrical interruptions causing inconvenience to users. this indicator is also known as the system Average interruption Frequency index (sAiFi), defined as the average number of sustained interruptions (outages that last more than 5 minutes) per consumer during the year. this is one of the critical reliability indicators prescribed under the ieee standard 1366, 2012.
expressed as total number of sustained electrical interruptions in a year------------------------------------------------ = _____ total number of consumers (residential and commercial) served in the same year
10.4 average length of electrical interruptions per customer per year (Supporting)Description: in combination with indicator 10.3 this denotes the reliability of electrical supply for both residential and commercial users, in terms of average duration of unscheduled electrical interruptions causing inconvenience to users. this indicator is also known as the system Average interruption Duration index (sAiDi), defined as the average duration of sustained interruptions (outages that last more than 5 minutes) per consumer during the year. this is one of the critical reliability indicators prescribed under the ieee standard 1366, 2012.
expressed as sum of duration of all sustained electrical interruptions in a year (in hours)------------------------------------------ = _____ hourstotal number of consumers (residential and commercial) served in the same year
10.1 Percentage of city population with authorized electrical service (Core)Description: this denotes the extent to which households in the city are being served through authorized electrical connections, and enjoy associated services such as complaint registration and timely grievance redressal.
expressed as number of authorized electrical connections at household level--------------------------- X 100 = _____ %total number of households in the city
10.2 Percentage of electrical connections covered through smart meters (Supporting)Description: the extent to which electrical connections in the city are covered through smart meters, leading to better monitoring and reduction in losses. smart metering is an essential component of a smart grid, and supplies the required meter data and events’ information to the utility’s various it systems, including its outage management system. this allows better management of power outages and restoration, and can improve reliability of supply in the long run.
expressed as number of electrical connections (residential and commercial) with smart meters------------------------------- X 100 = _____ %total number of electricity connections in the city
10.3 average number of electrical interruptions per customer per year (Core)Description: this denotes the reliability of electric supply for both residential and commercial users,
Category 10: Power Supply
LiveabiLity StandardS in Cities | 23
expressed asenergy consumption on street lighting------------------------------ = kWh per installationtotal number of street light installations
10.8 Percentage of new and redeveloped buildings following green building norms (Supporting)Description: the extent to which new developments and redevelopments have adopted green building norms and have received GRiHA, LeeDs or equivalent green ratings, leading to reduction in overall energy consumption.
expressed asBuilt up area of new/redeveloped buildings completed in a year that have received green ratings--------------------------------------- X 100 = _____ %total built up area of all new/redeveloped buildings completed during the same year
10.9 total energy consumption per capita (Core)Description: this denotes the per capita energy consumption by residential, commercial and industrial users in the city. this is an important indicator that can be used by cities to plan various conservation and efficiency-related interventions for optimizing energy use.
expressed astotal energy consumption (for all uses) in the city------------------------------ = _____ kWh per capitatotal population of the city
10.5 Percentage of total energy derived from renewable sources (Core)Description: the extent to which energy demand is met from non-conventional energy sources such as solar energy, wind energy etc. thereby reducing the dependence on energy produced through non-renewable sources. Cities can actively promote installation of renewable energy systems both in public buildings and public spaces, as well as individual households and community facilities.
expressed as total installed capacity for generation of renewable energy in the city--------------------------------------- X 100 = _____ %total energy consumption from all sources
10.6 energy consumption per unit - water supply and sewerage (Supporting)Description: the extent to which ULB has adopted energy saving options to reduce the energy consumption on water supply and sewerage services through interventions such as use of energy efficient pumps for water and wastewater systems.
expressed asenergy consumption on water supply and sewerage services-------------------------------- = kWh per million litrestotal quantum of water and waste water handled during the period
10.7 energy consumption per unit - street lighting (Supporting)Description: the extent to which ULB has adopted energy saving options to reduce the energy consumption on street lighting through interventions such as installation of energy saving LeD lights and/or solar panels in street lights, and general lighting in public places such as plazas, squares etc.
24 | LiveabiLity StandardS in Cities
of public transport or non-motorized transport is
desirable. the national transport Development
Policy Committee (ntDPC), 2013 provides the
benchmarks for the level of service in a city.
expressed as
total public transport trips
-------------------------------------- X 100 = _____ %
total trips through all modes in the city
11.4 Percentage of road network with dedicated
bicycle tracks (Core)
Description: this denotes the availability of
dedicated Right of Way (ROW) for bicycles in the
city, thereby encouraging the use of such non-
polluting transport options. Higher percentage
would indicate a better non-motorised transport
(nMt) network in the city. sLBs for Urban transport
developed by the MoUD provide guidance on the
service levels for transport.
expressed as
total length of bicycle network
--------------------------------------- X 100 = _____ %
total length of road network in the city
11.5 Percentage of interchanges with bicycle
parking facilities (Supporting)
Description: the extent to which use of bicycles is
encouraged in a city by providing adequate parking
facilities at the major transport interchanges – bus
depots/stations, metro or suburban rail stations
and water transport terminals (e.g. ferry terminal).
this is thus an indicator of the extent to which
Category 11: Transportation And Mobility
11.1 Geographical coverage of public transport
(Core)
Description: this denotes the geographical
coverage of public transport services (road,
rail or water based) in the city, and along with
indicator 11.2 is indicative of the overall availability
of public transport facilities in the city. sLBs for
Urban transport developed by the MoUD provide
guidance on the service levels for transport.
expressed as
total length of public transport network (road km)
------------------- = _____ road kms. per square km.
total area of the city (sq.km)
11.2 availability of public transport (Supporting)
Description: this denotes the availability of public
bus or rail transport in the city, in proportion to
the population of the city. Along with indicator
11.1 it is indicative of the overall availability of
public transport facilities in the city. sLBs for
Urban transport developed by the MoUD provide
guidance on the service levels for transport.
expressed as
Average number of public transport vehicles
available per day
--------------- X 1,000 = _____ (per 1,000 persons)
total population of the city
11.3 Mode share of public transport (Core)
Description: this is a critical indicator that denotes
the extent to which people use public transport for
moving within the city. Higher modal share in favour

LiveabiLity StandardS in Cities | 25
transport interchanges, such as major bus stops
and bus depots, suburban rail stations, metro
stations and water transport terminals. sLBs for
Urban transport developed by the MoUD provide
guidance on the service levels for transport.
expressed as
total number of major interchanges with Pis
--------------------------------------- X 100 = _____ %
total number of major interchanges in the city
11.8 extent of signal synchronisation
(Supporting)
Description: the extent to which signals installed at
traffic junctions on major roads in the city are inter-
connected and synchronised, so as to facilitate
smooth traffic flow along the road networks.
synchronisation means that the phasing of the
signal at any specific intersection is in tune with
the phasing of the intersection before and after
it so as to provide a continuous green phase for
the traffic stream, resulting in reduced congestion
and stopping time at each intersection. sLBs for
Urban transport developed by the MoUD provide
guidance on the service levels for transport.
expressed as
total number of signalised intersections that are
synchronised
-------------------------------------- X 100 = _____ %
total number of signalised intersections in the city
11.9 availability of paid parking spaces (Core)
Description: this is indicative of the restriction
on free parking spaces for all vehicles in a city
and measures the availability of paid public on-
street parking spaces in the city, particularly along
major arterial and sub-arterial roads. sLBs for
Urban transport developed by the MoUD provide
guidance on the service levels for transport.
nMt has been integrated with the public transport
network in the city. sLBs for Urban transport
developed by the MoUD provide guidance on the
service levels for transport.
expressed as
total number of major transport interchanges with
bicycle parking facility (within 250m radius)
--------------------------------------- X 100 = _____ %
total number of major transport interchanges
in the city
11.6 Mode share of non-motorised transport
(Core)
Description: this denotes the extent to which
people walk or use bicycles and cycle rickshaws
for moving within the city. Higher number of
trips indicate better infrastructure available for
pedestrian movement and cycling as well as higher
acceptability of nMt as a transport option. the
national transport Development Policy Committee,
2013 provides the benchmarks for the level of
service in a city.
expressed as
total nMt (pedestrian, cycling and cycle rickshaws)
trips
--------------------------------------- X 100 = _____ %
total trips through all modes in the city
11.7 availability of Passenger information
System (Supporting)
Description: Passenger information systems
(Pis) are the key communication link between
transportation operators and the travelling
passengers. they provide accurate information
regarding arrival and departure times, gates etc.
such information is provided in the form of digital
displays as well as through loud speakers installed
at appropriate locations. this indicator denotes the
extent to which such Pis are installed at all major

26 | LiveabiLity StandardS in Cities
11.12 extent to which universal accessibility
is incorporated in public rights-of-way
(Supporting)
Description: the extent to which public right-of-way
areas such as Government buildings, sidewalks/
footpaths, subways and foot-over-bridges (FOB)
have been designed in accordance with universal
design principles (including design of appropriate
signage) so as to facilitate use and access by
all, including the differently abled. Guidelines
have been provided by the MoUD for barrier-free
environment (Harmonized Guidelines and space
standards for Barrier Free Built environment for
Persons with Disability and elderly persons, 2016)
expressed as
number of government buildings, sidewalks,
subways and FOBs as per universal design
principles
-------------------------------------- X 100 = _____ %
total number of government buildings, sidewalks,
subways and FOBs
expressed as
total available on-street paid parking spaces in the
city
--------------------------------------- X 100 = _____ %
total available on-street parking spaces in the city
11.10 Percentage coverage of footpaths – wider
than 1.2m (Core)
Description: this denotes the availability of
pedestrian facilities (footpaths wider than 1.2
metres) along the road network in the city. sLBs for
Urban transport developed by the MoUD provide
guidance on the service levels for transport.
expressed as
total length of footpaths (wider than 1.2 m)
available in the city
--------------------------------------- X 100 = _____ %
total length of road network in the city
11.11 Percentage of traffic intersections with
pedestrian crossing facilities (Supporting)
Description: the extent to which pedestrian
crossing facilities such as zebra crossing,
pedestrian signals, grade separators etc. are
available at all traffic junctions on major roads in the
city.
expressed as
total number of intersections with pedestrian
crossing facilities on major roads
------------------------------------- X 100 = _____ %
total number of junctions/ intersections on major
roads in the city

LiveabiLity StandardS in Cities | 27
expressed as
total quantity of water supplied into the distribution
system
-------------------------------------------------- = _____
total population of the city
12.3 Quality of water supplied (Core)
Description: this denotes the quality of water
supplied to citizens, as per specified potable
water standards. this is an important aspect,
since poor water quality can pose serious public
health hazards. Quality standards for potable water
are laid down by the Central Public Health and
environmental engineering Organization (CPHeeO)
as part of the Manual on Water supply and
treatment, 1999.
expressed as
number of samples meeting or exceeding specified
potable water standards
-------------------------------------- X 100 = _____ %
total number of samples tested for water quality
12.4 Level of non-revenue water - nrW (Core)
Description: this denotes the quantity of water
produced and supplied by the ULB that does not
earn the utility any revenue. nRW comprises of - a)
consumption which is authorized but not billed,
such as public stand posts; b) apparent losses
such as illegal water connections, water theft and
metering inaccuracies; and c) real losses due
to leakages in the transmission and distribution
networks. sLBs for Urban services developed by
the MoUD provide guidance on the service levels
for water supply.
12.1 Household level coverage of direct water
supply connections (Core)
Description: the extent to which households in the
city are connected to the water supply network
with a direct service connection, as percentage of
total number of households. Household level water
supply connection i.e. direct piped connection, is
the minimum acceptable standard for water supply
service. Water provision through public stand posts
or tankers is not considered as an acceptable long-
term service provision standard. sLBs for Urban
services developed by the MoUD provide guidance
on the service levels for water supply.
expressed as
total number of households with direct water
supply connection
--------------------------------------- X 100 = _____ %
total number of households in the city
12.2 Per capita supply of water (Core)
Description: Per capita water supplied, indicates
the adequacy of the municipal water supply
system to source adequate raw water, treat water
to potable standards and supply the same into
the distribution system. this denotes the overall
sufficiency of water supplied into the municipal
network to meet the needs of the population. sLBs
for Urban services developed by the MoUD provide
guidance on the service levels for water supply.
Category 12: Assured Water Supply
28 | LiveabiLity StandardS in Cities
12.6 Percentage of plots with rainwater
harvesting facility (Supporting)
Description: the extent to which individual plots
within a city have the ability to retain storm water
within the site through rain water harvesting (RWH)
structures. the MoUD under the AMRUt Mission
has recommended that all new developments/
redevelopments with minimum plot size of 300
sq.m., and all commercial and public buildings
should have rainwater harvesting facilities.
expressed as
number of new developments/redevelopments (of
designated plot size),
commercial and public buildings with RWH facility
-------------------------------------- X 100 = ____ %
total number of new developments/
redevelopments (of designated plot size),
commercial and public buildings in the city
expressed as
Quantum of water put into distribution system (mld)
- Quantum of water sold (mld)
------------------------------------ X 100 = _____ %
Quantum of water put into the distribution system
(mld)
12.5 Percentage of water connections covered
through meters (Supporting)
Description: the extent to which water supply
connections in the city are covered through
functional meters (including smart meters), thereby
facilitating better monitoring, volumetric billing
and reduction in losses. sLBs for Urban services
developed by the MoUD provide guidance on the
service levels for water supply.
expressed as
number of metered water connections
--------------------------------------- X 100 = _____ %
total number of water connections in the city
LiveabiLity StandardS in Cities | 29
expressed as
total number of properties with connection to
waste water management systems
-------------------------------------- X 100 = _____ %
total number of properties in the city
13.3 Collection efficiency of sewerage network
(Core)
Description: this indicator denotes the actual
proportion of waste water generated in the city that
is collected by the available sewerage network.
sLBs for Urban services developed by the MoUD
provide guidance on the service levels for waste
water management.
expressed as
total waste water collected per day
--------------------------------------- X 100 = _____ %
total waste water generated in the city per day
13.4 extent of reuse and recycling of waste
water (Core)
Description: this denotes the proportion of waste
water received at the treatment plant that is
recycled or reused for various purposes. treated
waste water can be used for horticultural purposes
in parks and gardens, irrigation of farmlands on
city periphery, and/or supplied to power plants and
industries. sLBs for Urban services developed by
the MoUD provide guidance on the service levels
for waste water management.
13.1 Coverage of toilets (Core)
Description: the extent to which citizens have
access to individual or community toilets in the
city. these would include toilets in the category of
residential, commercial, industrial and institutional
properties. this should be computed for the
number of properties recorded in municipal records
and not households. sLBs for Urban services
developed by the MoUD provide guidance on the
service levels for waste water management.
expressed as
total number of properties with access to individual
and/or community toilets
--------------------------------------- X 100 = _____ %
total number of properties in the city
13.2 Coverage of sewerage network and/or
septage (Core)
Description: Denotes the extent to which waste
water management facilities are available to
individual properties across the city, whether
through centralized underground sewerage,
decentralized systems or on-site systems such
as septic tanks. this should be computed for
the number of properties recorded in municipal
records and not households, and should include all
residential, commercial, industrial and institutional
properties. sLBs for Urban services developed by
the MoUD provide guidance on the service levels
for waste water management.
Category 13: Waste Water Management

30 | LiveabiLity StandardS in Cities
expressed as
Quantum of waste water recycled or reused per
day
------------------------------------- X 100 = _____ %
total waste water received at treatment plants per
day
13.5 Coverage of storm water drains (Core)
Description: the extent to which the road network
in the city is covered through a storm water
drainage network (pucca covered drains). sLBs for
Urban services developed by the MoUD provide
guidance on the service levels for storm water
drainage.
expressed as
total length of covered primary, secondary and
tertiary drains (of pucca construction)
--------------------------------------- X 100 = _____ %
total length of road network (wider than 3.5m) in
the city
LiveabiLity StandardS in Cities | 31
14.3 extent of municipal solid waste recovered
through reuse (Core)
Description: the extent to which municipal solid
waste generated in the city is either recycled or
processed through centralised and decentralised
recycling processes. sLBs for Urban services
developed by the MoUD provide guidance on the
service levels for solid waste management.
expressed as
Average quantum of MsW that is processed or
recycled (tons per month)
--------------------------------------- X 100 = _____ %
Average MsW generated in the city (tons per
month)
14.1 Household level coverage of municipal
solid waste collection (Core)
Description: the extent to which households
and establishments in the city are covered
through door-to-door collection of municipal solid
wastes on a daily basis. sLBs for Urban services
developed by the MoUD provide guidance on the
service levels for solid waste management.
expressed as
total number of households and establishments
covered through doorstep collection
--------------------------------------- X 100 = _____ %
total number of households and establishments in
the city
14.2 efficiency of collection of municipal solid
waste (Core)
Description: the extent to which the quantum of
municipal solid waste (MsW) generated in the city
is collected by the ULB or its authorised service
providers (private operators). sLBs for Urban
services developed by the MoUD provide guidance
on the service levels for solid waste management.
expressed as
total quantum of MsW collected by the ULB or
private operator
--------------------------------------- X 100 = _____ %
total quantum of MsW generated in the city
Category 14: Solid Waste Management

32 | LiveabiLity StandardS in Cities
expressed as
Annual mean concentration OR Mean
concentration over 24 hours of nO2 given in μg/m3
15.3 Concentration of PM10 - air pollution (Core)
Description: this indicator along with 15.1 and
15.2 denotes the acceptable levels of air pollutants
in the city. Respirable suspended Particulate
Matter (size less than 10μm) or PM10 is considered
one of the critical urban air pollutants, monitored
on a regular basis by the CPCB through a nation-
wide programme for ambient air quality monitoring
known as national Air Quality Monitoring
Programme (nAMP). exposure to high levels of
PM10 can cause respiratory and cardiovascular
diseases. the standards for acceptable level of air
pollutants (including PM10) have been prescribed as
part of the national Air Quality standards (2009) by
the CPCB.
expressed as
Annual mean concentration OR Mean
concentration over 24 hours of PM10 given in μg/m3
15.4 Level of noise pollution (Core)
Description: this denotes the level of noise
pollution in a city. Prolonged exposure to ambient
noise from industrial activity, construction, vehicles,
loud speakers, generator sets etc. can have
negative health effects on citizens, in addition to
causing annoyance and sleep deprivation. Cities
can implement various measures to regulate
noise pollution as per the provisions of the noise
Pollution (Regulation and Control) Rules, 2000. the
rules also provide benchmarks for acceptable noise
15.1 Concentration of SO2 - air pollution (Core)
Description: this indicator along with 15.2 and
15.3 denotes the acceptable levels of air pollutants
in the city. sulphur Dioxide (sO2) is considered
one of the critical urban air pollutants, monitored
on a regular basis by the Central Pollution Control
Board (CPCB) through a nation-wide programme
for ambient air quality monitoring known as
national Air Quality Monitoring Programme
(nAMP). High levels of sO2 can potentially affect
the health of citizens, particularly those suffering
from asthma and chronic lung diseases, and
exacerbate respiratory symptoms. the standards
for acceptable level of air pollutants (including sO2)
have been prescribed as part of the national Air
Quality standards (2009) by the CPCB.
expressed as
Annual mean concentration OR Mean
concentration over 24 hours of sO2 given in μg/m3
15.2 Concentration of nO2 - air pollution (Core)
Description: this indicator along with 15.1
and 15.3 denotes the acceptable levels of air
pollutants in the city. nitrogen Dioxide (nO2) is
considered one of the critical urban air pollutants,
monitored on a regular basis by the CPCB
through a nation-wide programme for ambient air
quality monitoring known as national Air Quality
Monitoring Programme (nAMP). Continued and
frequent exposure to high levels of nO2 can cause
irritation of lungs and acute respiratory illnesses.
the standards for acceptable level of air pollutants
(including nO2) have been prescribed as part of the
national Air Quality standards (2009) by the CPCB.
Category 15: Reduced Pollution

LiveabiLity StandardS in Cities | 33
levels in industrial, commercial, residential and
sensitive (silence) zones such as hospitals, nursing
homes, educational institutions and courts.
expressed as
number of noise samples meeting acceptable
noise levels
------------------------------------- X 100 = _____ %
total number of noise samples
15.5 Quality of water in public surface water
bodies (Core)
Description: this denotes the quality of water
in public surface water bodies such as rivers,
lakes and ponds in the city, which is critical for
maintaining the health of the overall water ecology
associated with these surface water bodies.
the CPCB has classified water bodies into 5
categories based on the designated best use of
the water bodies and prescribed water quality
standards in terms of chemical requirements for
each of the categories (Guidelines for Water Quality
Management, 2008).
expressed as
number of tested samples meeting prescribed
standards
------------------------------------- X 100 = _____ %
total number of samples tested

34 | LiveabiLity StandardS in Cities
ANNEX 1

LiveabiLity StandardS in Cities | 35
PiLLar CateGOry indiCatOr tyPeC=CoreS=Supporting
SdG reference(s)
institUtiOnAL Governance 1.1 Percentage of citizen services available online
C target 16.6
1.2 Percentage of services integrated through Command Centre
s target 16.6
1.3 Percentage of citizens using online services
C target 16.6
1.4 Average delay in grievance redressal
C target 16.6
1.5 tax collected as percentage of tax billed
C target 17.1
1.6 extent of cost recovery (O&M) in water supply services
C target 17.1
1.7 Capital spending as percentage of total expenditure
C target 16.6
1.8 Percentage of population covered under Ward Committees/ Area sabhas
C target 11.3indicator 11.3.2
sOCiAL identity and Culture 2.1 Restoration and reuse of historic buildings
C target 11.4indicator 11.4.1
2.2 Percentage of ecologically important areas covered through projects for restoration
C target 6.6target 11.4indicator 11.4.1target 15.1
2.3 Hotel occupancy C target 8.9
2.4 Percentage of budget allocated towards cultural/sports activities
s target 11.4
2.5 number of cultural/sports events hosted by city authority
s target 11.4
List of Indicators
36 | LiveabiLity StandardS in Cities
PiLLar CateGOry indiCatOr tyPeC=CoreS=Supporting
SdG reference(s)
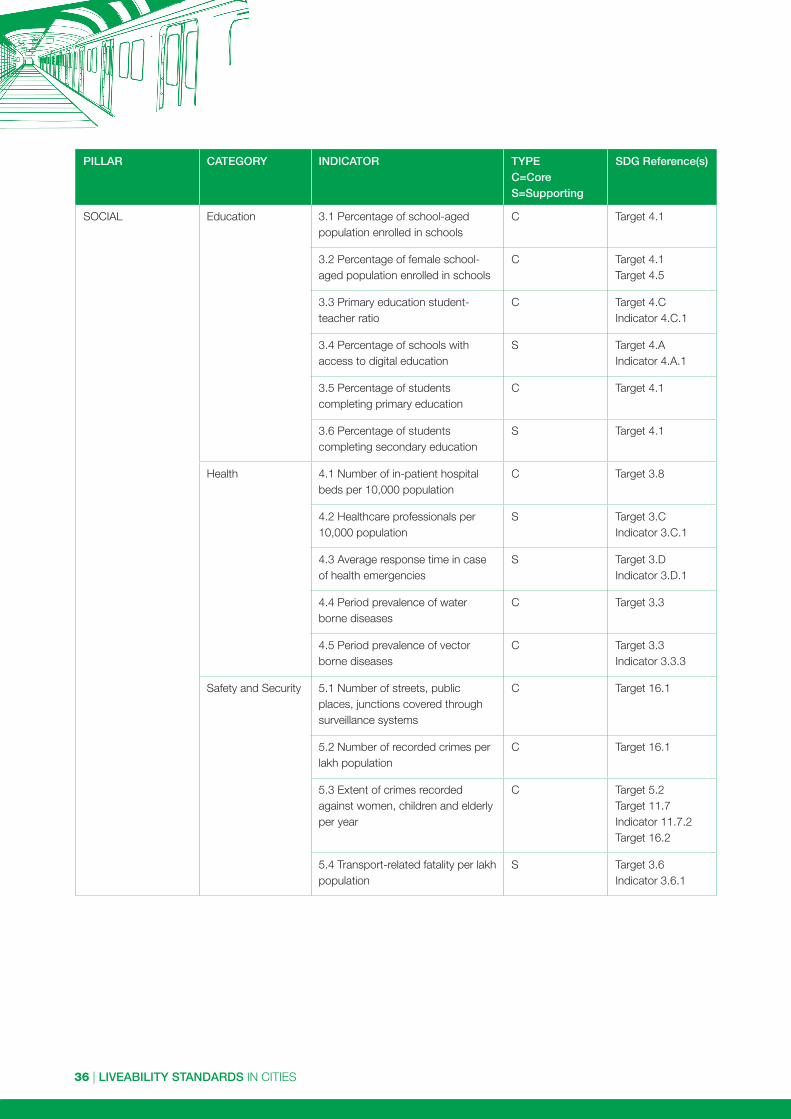
sOCiAL education 3.1 Percentage of school-aged population enrolled in schools
C target 4.1
3.2 Percentage of female school-aged population enrolled in schools
C target 4.1target 4.5
3.3 Primary education student-teacher ratio
C target 4.Cindicator 4.C.1
3.4 Percentage of schools with access to digital education
s target 4.Aindicator 4.A.1
3.5 Percentage of students completing primary education
C target 4.1
3.6 Percentage of students completing secondary education
s target 4.1
Health 4.1 number of in-patient hospital beds per 10,000 population
C target 3.8
4.2 Healthcare professionals per 10,000 population
s target 3.Cindicator 3.C.1
4.3 Average response time in case of health emergencies
s target 3.Dindicator 3.D.1
4.4 Period prevalence of water borne diseases
C target 3.3
4.5 Period prevalence of vector borne diseases
C target 3.3indicator 3.3.3
safety and security 5.1 number of streets, public places, junctions covered through surveillance systems
C target 16.1
5.2 number of recorded crimes per lakh population
C target 16.1
5.3 extent of crimes recorded against women, children and elderly per year
C target 5.2target 11.7indicator 11.7.2target 16.2
5.4 transport-related fatality per lakh population
s target 3.6indicator 3.6.1

LiveabiLity StandardS in Cities | 37
PiLLar CateGOry indiCatOr tyPeC=CoreS=Supporting
SdG reference(s)
eCOnOMiC economy and employment
6.1 increase in VAt/Gst collection C target 8.2
6.2 increase in collection of Professional tax
C target 8.2
6.3 increase in issuance of Construction permits
C target 8.2
6.4 Unemployment rate C target 8.5indicator 8.5.2target 8.6
6.5 Percentage of vendors registered and provided formal spaces
s target 8.3
PHYsiCAL Housing and inclusiveness
7.1 Percentage of slum/eWs households covered through formal/affordable housing
C target 1.4indicator 1.4.2target 11.1
7.2 Percentage of slum areas covered through basic services
C target 1.4indicator 1.4.1target 11.1
Public Open spaces
8.1 Per capita availability of green spaces
C target 11.7
8.2 Per capita availability of public and recreational places
C target 11.7
Mixed Land Use and Compactness
9.1 share of mixed land use area in overall city land use
C target 11.3
9.2 net Density C target 11.3

38 | LiveabiLity StandardS in Cities
PiLLar CateGOry indiCatOr tyPeC=CoreS=Supporting
SdG reference(s)
PHYsiCAL Power supply 10.1 Percentage of city population with authorized electrical service
C target 7.1indicator 7.1.1
10.2 Percentage of electrical connections covered through smart meters
s target 7.1
10.3 Average number of electrical interruptions per customer per year
C target 7.1
10.4 Average length of electrical interruptions per customer per year
s target 7.1
10.5 Percentage of total energy derived from renewable sources
C target 7.2indicator 7.2.1target 12.2
10.6 energy consumption per unit - water supply and sewerage
s target 7.3target 12.2
10.7 energy consumption per unit - street lighting
s target 7.3target 12.2
10.8 Percentage of new and redeveloped buildings following green building norms
s target 7.3target 11.3target 12.2
10.9 total energy consumption per capita
C target 7.3target 12.2
transportation and Mobility
11.1 Geographical coverage of public transport
C target 11.2
11.2 Availability of public transport s target 11.2
11.3 Mode share of public transport C target 11.2target 12.2
11.4 Percentage of road network with dedicated bicycle tracks
C target 11.2
11.5 Percentage of interchanges with bicycle parking facilities
s target 11.2
11.6 Mode share of non-motorized transport
C target 11.2target 11.3target 12.2
11.7 Availability of Passenger information system
s target 11.2
11.8 extent of signal synchronization s target 11.2
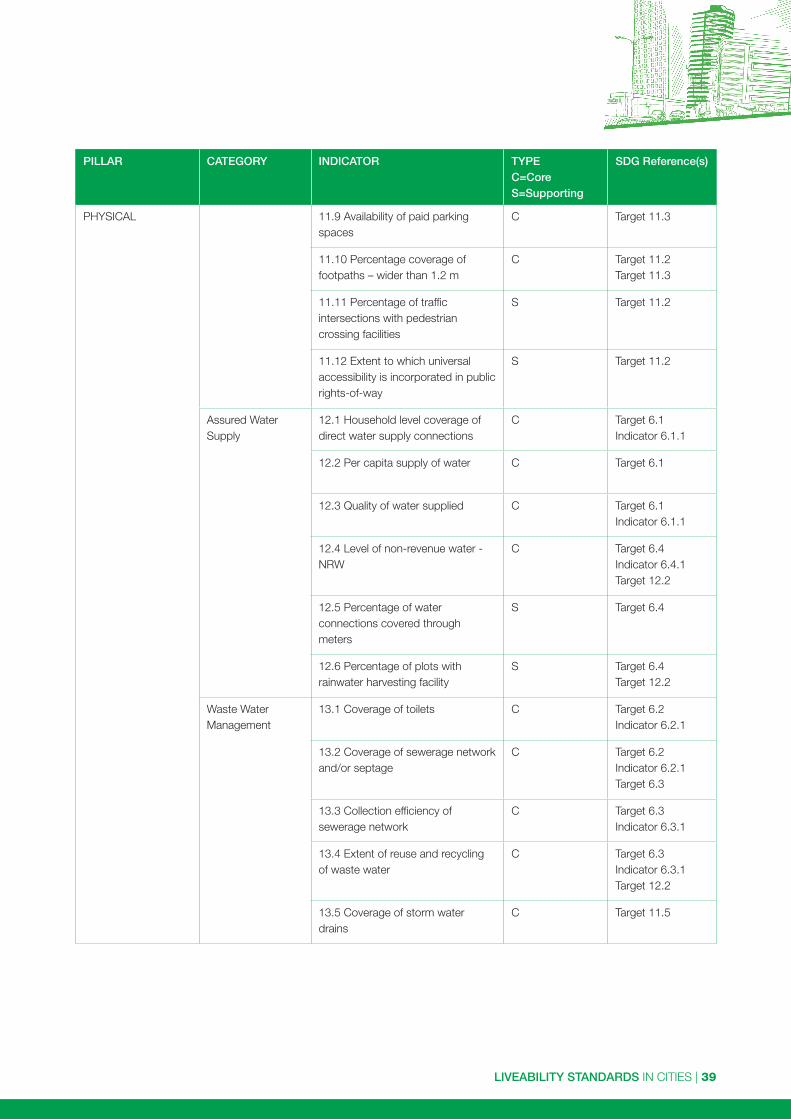
LiveabiLity StandardS in Cities | 39
PiLLar CateGOry indiCatOr tyPeC=CoreS=Supporting
SdG reference(s)
PHYsiCAL 11.9 Availability of paid parking spaces
C target 11.3
11.10 Percentage coverage of footpaths – wider than 1.2 m
C target 11.2target 11.3
11.11 Percentage of traffic intersections with pedestrian crossing facilities
s target 11.2
11.12 extent to which universal accessibility is incorporated in public rights-of-way
s target 11.2
Assured Water supply
12.1 Household level coverage of direct water supply connections
C target 6.1indicator 6.1.1
12.2 Per capita supply of water C target 6.1
12.3 Quality of water supplied C target 6.1indicator 6.1.1
12.4 Level of non-revenue water - nRW
C target 6.4indicator 6.4.1target 12.2
12.5 Percentage of water connections covered through meters
s target 6.4
12.6 Percentage of plots with rainwater harvesting facility
s target 6.4 target 12.2
Waste Water Management
13.1 Coverage of toilets C target 6.2indicator 6.2.1
13.2 Coverage of sewerage network and/or septage
C target 6.2indicator 6.2.1target 6.3
13.3 Collection efficiency of sewerage network
C target 6.3indicator 6.3.1
13.4 extent of reuse and recycling of waste water
C target 6.3indicator 6.3.1 target 12.2
13.5 Coverage of storm water drains
C target 11.5

40 | LiveabiLity StandardS in Cities
PiLLar CateGOry indiCatOr tyPeC=CoreS=Supporting
SdG reference(s)
PHYsiCAL solid Waste Management
14.1 Household level coverage of municipal solid waste collection
C target 11.6indicator 11.6.1
14.2 efficiency of collection of municipal solid waste
C target 11.6indicator 11.6.1
14.3 extent of municipal solid waste recovered through reuse
C target 11.6indicator 11.6.1target 12.5indicator 12.5.1
Reduced Pollution 15.1 Concentration of sO2 - air pollution
C target 3.9target 11.6
15.2 Concentration of nO2 - air pollution
C target 3.9target 11.6
15.3 Concentration of PM10 - air pollution
C target 3.9target 11.6indicator 11.6.2
15.4 Level of noise pollution C target 11.6
15.5 Quality of water in public surface water bodies
C target 3.9target 6.3indicator 6.3.2target 6.6

LiveabiLity StandardS in Cities | 41
Notes

42 | LiveabiLity StandardS in Cities
Notes


44 | LiveabiLity StandardS in Cities