Embed Size (px)
Citation preview

Partnership for AiR Transportation Noise and Emissions ReductionAn FAA/NASA/Transport Canada-sponsored Center of Excellence
Architecture Studyfor theAviation Environmental Portfolio Management Tool
prepared by
Ian Waitz, Stephen Lukachko, Karen Willcox,Peter Belobaba, Elena Garcia, Peter HollingsworthDimitri Mavris, Kate Harback, Fred Morser,Michele Steinbach
June 2006
REPORT N0. PARTNER-COE-2006-002
APMT Architecture Study 1
Architecture Study for the Aviation
Environmental Portfolio Management Tool
Ian Waitz, Stephen Lukachko, Karen Willcox, Peter Belobaba — MIT Elena Garcia, Peter Hollingsworth, Dimitri Mavris — Georgia Tech
Kate Harback, Fred Morser, Michele Steinback — MITRE
The authors express their appreciation to the individuals who reviewed drafts of this report,
offering their thoughtful comments and expert counsel. Following careful examination, we
addressed many of these suggestions in this final version. Other suggestions are being
considered as part of ongoing development; we will address these suggestions in future
documents. This inclusive process is inherent to PARTNER's mission and philosophy. It greatly
contributes to the thoroughness of our research, enhancing accuracy, validity, and
communication with a broad-based constituency.
Submitted to:
Maryalice Locke
APMT Program Manager
Office of Environment and Energy
U.S. Federal Aviation Administration
800 Independence Avenue, S.W.
Washington, D.C. 20591
Phone: (202)-267-3495
Contact:
Professor Ian A. Waitz, Director
PARTNER Massachusetts Institute of Technology 77 Massachusetts Avenue 33-207 Cambridge, MA 02139 [email protected]
Funded under FAA Cooperative Agreement No. 03-C-NE-MIT © 2006 Massachusetts Institute of Technology
Cover photo: Shutterstock

APMT Architecture Study 2
APMT Architecture Study 3
EXECUTIVE SUMMARY
The Federal Aviation Administration's Office of Environment and Energy (FAA-AEE) is
developing a comprehensive suite of software tools that will allow for thorough assessment of
the environmental effects of aviation. The main goal of the effort is to develop a new capability
to assess the interdependencies between aviation-related noise and emissions effects and
associated environmental costs, and to provide comprehensive cost analyses of aviation
environmental impacts. The economic analysis function of this suite of software tools has been
given the rubric Aviation Environmental Portfolio Management Tool (APMT)1. This function
will ultimately be derived from existing tools, tools currently under development, and new tools
to be developed.
FAA-AEE has provided a grant to the Partnership for AiR Transportation Noise and Emissions
Reduction (PARTNER), an FAA/NASA/Transport Canada-sponsored Center of Excellence, to
develop three reports focusing on: APMT requirements2, APMT architecture, and APMT
prototype development3, respectively. This Architecture Study is the second of the series. It
describes in detail the components of the APMT architecture, outlines the interfaces that will be
required among those components, and establishes how APMT will interface with other tools
that exist or are under development, including the Environmental Design Space4 (EDS) and the
Aviation Environmental Design Tool (AEDT). The Architecture Study also reviews existing
tools available for these types of analysis, assesses their suitability for use in APMT, and
determines additional development that will be necessary to meet APMT requirements.
The recommended APMT architecture is composed of five functional blocks:
• the Partial Equilibrium Block simulates economic flows in the aviation market;
• the Aviation Environmental Design Tool (AEDT) Block converts aviation activity into
quantities of emissions and noise distributed in time and space;
• the Benefits Valuation Block converts the quantities of emissions and noise to monetized
health and welfare impacts (including broader socioeconomic and ecological effects);
1 Throughout this document, as is typical in environmental economic analysis, we will label changes in monetary
flows in the aviation markets and the general economy as “costs” although it is recognized that they may be positive
or negative. Similarly, we will label changes in health and welfare that occur through environmental pathways as
“benefits” although they may be positive or negative. 2 The first document in the series is the APMT Requirements Document, which provides a detailed list of the
functional requirements and guidance on implementation of APMT, with supporting background discussions to help
place these requirements within the broader context of current practice. The Requirements Document also defines
the recommended time frames for development and use as well as the geographical and economic scope for analyses
performed using APMT. 3 The third companion document in the series is an APMT Prototype Work Plan describing an initial APMT
prototyping effort that is intended to identify gaps or weaknesses in the APMT architecture and stimulate
advancements in development. The Prototype Work Plan delineates all of the entities necessary for the analyses and
their roles, the data requirements, and the proposed cost and schedule. 4 The Environmental Design Space (EDS) is a numerical simulation capable of estimating source noise and exhaust
emissions, as well as performance and economic parameters for future aircraft designs under different technological,
operational, policy, and market scenarios. EDS will also provide these parameters for existing aircraft designs when
there is a need to simulate existing aircraft at a higher fidelity than exists in current tools. In addition, EDS will serve
as a mechanism for collecting, incorporating, and quantifying long-term technology forecasts.
APMT Architecture Study 4
• the General Economy Block evaluates the changes in economic flows in other markets
due to changes in the aviation market; and
• the Analysis and Display Block allows the results to be analyzed graphically and
provides quantitative estimates of uncertainty.
These five blocks are described in greater detail below.
1) The Partial Equilibrium5 Block takes estimates of future aviation demand and other
assumptions specific to various policy scenarios, establishes a future fleet and flight
schedule for input to the AEDT Block, and assesses manufacturer costs, operator costs,
and consumer surplus.
An assumption about the extent to which costs are passed on to consumers, leading to a
modification of the initial demand assumption, completes the partial-equilibrium loop.
Airline costs, manufacturer costs, and consumer surplus can be used directly for cost-
effectiveness6 and benefit-cost assessments
7, or can be multiplied to reflect indirect and
induced effects associated with broader effects in the general economy.
The Partial Equilibrium Block includes a link to EDS to provide new technology aircraft
that may be introduced as part of the policy scenario and to ensure that the future aircraft
characteristics provided by EDS are developed using assumptions and requirements
consistent with the APMT scenario. To develop this functionality, an Aviation
Operations Generator module will be developed in concert with AEDT. This module will
be based upon methods used by the Wyle/FAA Model for Assessing Global Exposure
from Noise of Transport Airplanes (MAGENTA), but modified to enable the introduction
of new aircraft from EDS. Manufacturer cost and aircraft price estimates will be based
upon correlations drawn from regression analyses of historical price data with a range of
assumptions for manufacturer profits. Uncertainty will be addressed through
parametrically varying the estimates. Higher fidelity modeling of manufacturing costs
associated with technology trade-offs will be accomplished using the NASA/GaTech
Aircraft Life Cycle Cost Analysis code (ALCCA), but further assessment and
development of ALCCA will be required.
Airline operating costs will be estimated using methods derived from the Dutch Aviation
Emission and Evaluation of Reduction Options Modeling System Aviation Operating
Cost Model (AERO-MS ACOS). Airline cost pass-through to fares will be modeled
5 Partial equilibrium refers to analysis of change in one market, here the market for air transport, without taking into
consideration how changes in one market imply changes in other markets. In the context of APMT, this means
capturing the new equilibrium in the market for air travel after a change in policy, and the impact of that change on
the traveling public and on air carriers. 6 Cost-Effectiveness Analysis (CEA) is used to determine the outcome or impact of alternative regulatory choices. It
is useful for answering the question: “Given several options for addressing an environmental problem through
regulation—each (ideally) with similar benefits, which choice has the lowest costs?” Typically the benefits are
defined using some surrogate for the ultimate environmental effect (e.g., kg NOx vs. incidence of adverse health
effects). 7 Benefit-Cost Analysis (BCA) seeks to determine the extent to which a policy option will produce a net benefit to
society (independent of distributional aspects such as who wins and who loses). By estimating the net present value
of benefits less costs relative to a well-defined baseline scenario, BCA can be used to determine the degree to which
a policy scenario improves economic efficiency. BCA requires that benefits and costs be expressed in the same units
(typically monetary). BCA is the recommended basis in North America and Europe for assessing policy alternatives.
APMT Architecture Study 5
parametrically in a manner similar to that done within AERO-MS, although work to
improve these techniques is recommended for longer-term application within APMT.
2) The Aviation Environmental Design Tool (AEDT) Block represents the significant
development efforts already underway within the FAA to integrate the existing noise and
emissions modeling tools, including the Integrated Noise Model (INM), MAGENTA,
Emissions and Dispersion Modeling System (EDMS), and the System for Assessing
Aviation’s Global Emissions (SAGE).
In aggregate, the AEDT Block will take as input the detailed schedule and fleet
information from the Partial Equilibrium Block, and will provide as output the noise and
emissions inventories, both locally and globally. These outputs may be used directly with
the costs from the Partial Equilibrium Block to form cost-effectiveness assessments, or
can be passed to the Benefits Valuation Block to enable benefit-cost assessments.
3) The Benefits Valuation Block takes noise and emissions inventory information from the
AEDT Block, demographic and socioeconomic data, measurements of background
concentrations of pollutants (e.g., from the US EPA), and estimates of changes in health
and welfare endpoints for climate, local air quality, and noise. To a large extent, this is
accomplished through reliance on external sources of information (e.g., concentration-
response curves established by other agencies for relating pollutants to mortality and
morbidity incidences).
Changes in health and welfare are then monetized to enable benefit-cost analyses. The
monetization will draw heavily on a wide range of published studies within the U.S. and
Europe that have focused on this topic. The block will be developed starting from the
existing capabilities of the MIT Multi-Attribute Impact Pathway Analysis tool (MAIPA),
but will be augmented to include components of the US EPA Environmental Benefits
Mapping and Analysis Program (BenMAP).
4) The General Economy Block is currently envisioned as a simplified mechanism for
including multiplier effects associated with indirect and induced costs in markets beyond
the primary aviation markets. These multiplier effects will be specified exogenously and
drawn from the literature as well as from external general equilibrium8 models. However,
future versions of APMT may consider a more complete integration of a general
equilibrium model with the other components of APMT.
5) The Analysis and Display Block will collect costs and benefits, provide assessments of
propagated uncertainty, and allow cost-effectiveness and benefit-cost analyses.
Depending on the level of maturity of the modeling tools and the specific assessment
scenario being studied, varying types of distributional analyses9 will be available. For
example, for the cost-effectiveness analysis it will be possible to understand the effects of
policy scenarios on broad geographical regions and primary market categories. For the
8 General equilibrium analysis explicitly models relationships and feedback amongst industries that are related as
suppliers and demanders of intermediate goods. 9 Distributional analyses seek to determine what segments of the economy will gain or lose as a result of a policy
option. The segments of the economy may be components of markets, or may be specific parts of the population as
defined by demographic information or geographical location.

APMT Architecture Study 6
benefit-cost assessments, it will be possible to consider a variety of categories of
impacted populations consistent with the level of detail present within the census data.
Work must start immediately on all of these blocks to meet near-term and mid-term needs for
policy guidance. It is anticipated that the first version (years 1-3) of APMT will include the
Partial Equilibrium Block, the Aviation Environmental Design Tool (AEDT) Block, and the
Analysis and Display Block, thus enabling only cost-effectiveness analyses. APMT Version 2
will incorporate the Benefits Valuation Block, providing a first capability for benefit-cost
assessment. However, it is expected that due to limited data availability, the Benefits Valuation
Block will be restricted initially to application within the U.S. (years 1-3) with expansion to
other parts of the world enabled later through international partnerships (years 4-6) where data
are available. APMT Version 3 will incorporate the General Economy Block and improvements
to the other model components (years 3-8).
APMT Architecture Study 7
TABLE OF CONTENTS
EXECUTIVE SUMMARY .......................................................................................................... 3
LIST OF ACRONYMS .............................................................................................................. 12
1 INTRODUCTION............................................................................................................... 14
1.1 Overview of APMT Requirements and Development Plan...................................................................14
1.2 Architecture Overview............................................................................................................................16
1.3 APMT Versions.......................................................................................................................................20 1.3.1 Version 1..............................................................................................................................................20 1.3.2 Version 2..............................................................................................................................................21 1.3.3 Version 3 and later versions..................................................................................................................23
1.4 Considerations During Review of Existing Tools...................................................................................23
2 PARTIAL EQUILIBRIUM BLOCK................................................................................ 25
2.1 Aviation Operations Generator Module ................................................................................................25 2.1.1 MAGENTA Use of FESG Forecasts.....................................................................................................26
2.1.1.1 Processing sequence ....................................................................................................................26 2.1.1.2 User-defined substitutions ...........................................................................................................27 2.1.1.3 Aircraft phase-outs ......................................................................................................................27 2.1.1.4 Aircraft retirement.......................................................................................................................28 2.1.1.5 Operations growth.......................................................................................................................29 2.1.1.6 Common aircraft replacement approach ......................................................................................29
2.1.2 Aviation Operations Generator Module Development Needs ................................................................30
2.2 Environmental Design Space Module ....................................................................................................31
2.3 Manufacturer Costs / Aircraft Prices Module .......................................................................................32 2.3.1 Aircraft Price Model.............................................................................................................................32 2.3.2 Manufacturer Cost Estimation ..............................................................................................................32 2.3.3 Development Needs for the Manufacturer Costs/Aircraft Prices Module...............................................34
2.4 Airline Operating Costs Module.............................................................................................................34 2.4.1 ICAO-CAEP Analyses of Airline Cost Impacts ....................................................................................35 2.4.2 Airline Operating Costs Module Development Needs...........................................................................35
2.5 Fares Assumptions Module.....................................................................................................................36 2.5.1 Fares Assumptions module development needs ....................................................................................37
2.6 Future Air Transport Demand Module .................................................................................................37
3 AVIATION ENVIRONMENTAL DESIGN TOOL BLOCK ........................................ 39
APMT Architecture Study 8
4 BENEFITS VALUATION BLOCK.................................................................................. 40
4.1 Concepts from Environmental Economics.............................................................................................41
4.2 Estimating the Environmental Damage Function for Aviation.............................................................42
4.3 AEDT Emissions and Noise Inputs.........................................................................................................42
4.4 Tools Considered.....................................................................................................................................43
4.5 Benefits Valuation Block Development Needs .......................................................................................46
5 GENERAL ECONOMY BLOCK..................................................................................... 47
5.1 General Economy Block Development Needs ........................................................................................47
6 ANALYSIS AND DISPLAY BLOCK............................................................................... 48
6.1 Cost Effectiveness Analysis.....................................................................................................................48
6.2 Benefit-Cost Analysis ..............................................................................................................................49
6.3 Distributional Analysis............................................................................................................................50
6.4 Analysis and Display Block Development Needs ...................................................................................51
7 INTERFACES..................................................................................................................... 51
7.1 Aviation Operations Generator Module ................................................................................................51 7.1.1 Inputs ...................................................................................................................................................51 7.1.2 Outputs.................................................................................................................................................52
7.2 Environmental Design Space Module ....................................................................................................52 7.2.1 Inputs ...................................................................................................................................................52
7.2.1.1 Discount Rates ............................................................................................................................52 7.2.1.2 Production Numbers....................................................................................................................52 7.2.1.3 Emissions and Noise Rules..........................................................................................................52 7.2.1.4 Aircraft and Engine Characteristics .............................................................................................52
7.2.2 Outputs.................................................................................................................................................53 7.2.2.1 Airframe and Engine Costs..........................................................................................................53 7.2.2.2 Aircraft Performance...................................................................................................................53 7.2.2.3 Aircraft Emissions and Noise ......................................................................................................53
7.3 Manufacturer Costs/Aircraft Prices Module .........................................................................................53 7.3.1 Inputs ...................................................................................................................................................53 7.3.2 Outputs.................................................................................................................................................54
7.4 Airline Operating Costs ..........................................................................................................................54 7.4.1 Inputs ...................................................................................................................................................54 7.4.2 Outputs.................................................................................................................................................55
7.5 Fares Assumptions Module.....................................................................................................................56
APMT Architecture Study 9
7.5.1 Inputs ...................................................................................................................................................56 7.5.2 Outputs.................................................................................................................................................56
7.6 Future Air Transport Demand Module .................................................................................................56 7.6.1 Inputs ...................................................................................................................................................56 7.6.2 Outputs.................................................................................................................................................56
7.7 The Aviation Environmental Design Tool Block ...................................................................................57 7.7.1 Inputs ...................................................................................................................................................57 7.7.2 Outputs.................................................................................................................................................57
7.8 Benefits Valuation Block.........................................................................................................................57 7.8.1 Inputs ...................................................................................................................................................57 7.8.2 Outputs.................................................................................................................................................58
7.9 General Economy Block..........................................................................................................................58 7.9.1 Outputs.................................................................................................................................................58
7.10 Analysis and Display Block.....................................................................................................................59 7.10.1 Inputs...............................................................................................................................................59 7.10.2 Output..............................................................................................................................................59
8 RECOMMENDATIONS.................................................................................................... 60
8.1 Partial Equilibrium Block.......................................................................................................................60
8.2 AEDT Block ............................................................................................................................................61
8.3 Benefits Valuation Block.........................................................................................................................61
8.4 General Economy Block..........................................................................................................................61
8.5 Analysis and Display Block.....................................................................................................................62
8.6 Summary .................................................................................................................................................62
APPENDIX A. CRITERIA FOR TOOL SELECTION....................................................... 64
A.1 Area of Applicability and Scope .............................................................................................................64
A.2 Consistency with Other Regulatory Practices........................................................................................64
A.3 Consistency of Assumptions....................................................................................................................64
A.4 Parametric Inputs ...................................................................................................................................64
A.5 Quantitative Outputs ..............................................................................................................................64
A.6 Flexibility.................................................................................................................................................65
A.7 Robustness...............................................................................................................................................65
A.8 Transparency ..........................................................................................................................................65
APMT Architecture Study 10
A.9 Accessible to the Intended Users ............................................................................................................65
A.10 Data Availability .....................................................................................................................................65
A.11 Minimal Internal Optimization and Feedback Loops ...........................................................................66
A.12 Batch Execution ......................................................................................................................................66
A.13 Rapid Execution......................................................................................................................................66
A.14 Platform Independence...........................................................................................................................66
APPENDIX B. REVIEW OF TOOLS FOR MANUFACTURER COSTS ESTIMATION .
......................................................................................................................... 67
B.1 Current CAEP Practices.........................................................................................................................67
B.2 Price Databases for Existing Aircraft.....................................................................................................68 B.2.1 Airliner Price Guide .............................................................................................................................68 B.2.2 Price calculations within AERO-MS.....................................................................................................68
B.3 Non-Aviation Specific Cost Tools ...........................................................................................................69 B.3.1 PRICE-H..............................................................................................................................................69 B.3.2 SEER ...................................................................................................................................................70 B.3.3 ACEIT-ACE.........................................................................................................................................70
B.4 Aviation-Specific Cost Tools...................................................................................................................71 B.4.1 ALCCA................................................................................................................................................71 B.4.2 TCM.....................................................................................................................................................72
B.5 Profit Assumptions..................................................................................................................................72
APPENDIX C. REVIEW OF TOOLS FOR AIRLINE OPERATING COSTS
ESTIMATION 73
C.1 AERO-MS ...............................................................................................................................................73
C.2 SCSM.......................................................................................................................................................74
C.3 Comparative Study of AERO-MS and SCSM .......................................................................................75 C.3.1 Fleet and Demand Forecasts .................................................................................................................75
C.4 Cost Impacts of Measures.......................................................................................................................75
C.5 ACIM – The ASAC Air Carrier Investment Model ..............................................................................76
C.6 ALCCA – Airline Operating Costs.........................................................................................................77
C.7 FATE – Future Aviation Timetable Estimator......................................................................................78
C.8 NEMS – The National Energy Modeling System...................................................................................79
APMT Architecture Study 11
APPENDIX D. THE ASIA-PACIFIC INTEGRATED MODEL (AIM) ............................ 81
REFERENCES............................................................................................................................ 84
APMT Architecture Study 12
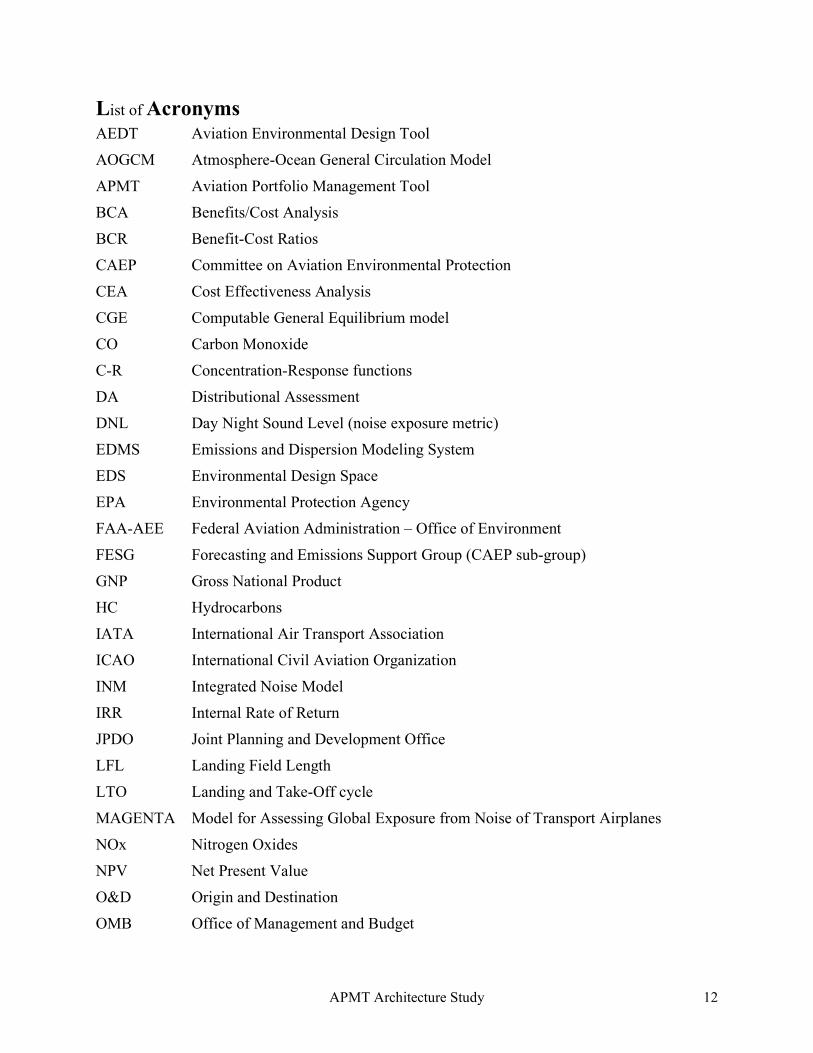
List of Acronyms
AEDT Aviation Environmental Design Tool
AOGCM Atmosphere-Ocean General Circulation Model
APMT Aviation Portfolio Management Tool
BCA Benefits/Cost Analysis
BCR Benefit-Cost Ratios
CAEP Committee on Aviation Environmental Protection
CEA Cost Effectiveness Analysis
CGE Computable General Equilibrium model
CO Carbon Monoxide
C-R Concentration-Response functions
DA Distributional Assessment
DNL Day Night Sound Level (noise exposure metric)
EDMS Emissions and Dispersion Modeling System
EDS Environmental Design Space
EPA Environmental Protection Agency
FAA-AEE Federal Aviation Administration – Office of Environment
FESG Forecasting and Emissions Support Group (CAEP sub-group)
GNP Gross National Product
HC Hydrocarbons
IATA International Air Transport Association
ICAO International Civil Aviation Organization
INM Integrated Noise Model
IRR Internal Rate of Return
JPDO Joint Planning and Development Office
LFL Landing Field Length
LTO Landing and Take-Off cycle
MAGENTA Model for Assessing Global Exposure from Noise of Transport Airplanes
NOx Nitrogen Oxides
NPV Net Present Value
O&D Origin and Destination
OMB Office of Management and Budget
APMT Architecture Study 13
RoW Rest-of-the-World countries
RPK Revenue Passenger Kilometer
RPMS Revenue Passenger Mile
SAGE System for Assessing Global Aviation Emissions
TAF Terminal Area Forecast
TL Technology Level (CAEP6 indicator of engine technology improvement needed
to meet NOx stringency)
TOFL Take-off Field Length
TRB Transportation Research Board
WBS Work Breakdown Structure
APMT Architecture Study 14
1 INTRODUCTION
The Federal Aviation Administration Office of Environment and Energy (FAA-AEE) is
developing a suite of tools to evaluate the impact of policy decisions on aviation and the
environment The economic analysis will be carried out using the Aviation Environmental
Portfolio Management Tool (APMT) whose requirements are described in a separate document.
This document is intended to define the components of APMT in early and future
implementations, review existing capabilities and tools to determine how they may be used or
leveraged, and establish those developments that will be necessary to create the desired
capabilities. This architecture study will therefore lay the groundwork for a detailed development
plan.
The FAA is pursuing the development of APMT to assist the International Civil Aviation
Organization Committee on Aviation Environmental Protection (ICAO-CAEP) decision-making
process and to address the Next Generation Air Transportation System goals as laid out in the
Joint Planning and Development Office (JPDO) Integrated Plan [JPDO, 2004]. Therefore,
flexibility and transparency are required throughout the development and use of APMT, as well
as consistency with existing practices.
The initial version of APMT is expected to encompass existing CAEP assessment capabilities
that focus on the cost-effectiveness of policies only within the primary aviation markets.
However, APMT is also expected to expand upon this to allow assessment of interdependencies
among noise and various emissions. It must also provide for sensitivity and uncertainty,
assessments that are difficult to accomplish with the current CAEP approach. Subsequent
versions of APMT will include costs beyond the primary aviation market, and will include
identification, quantification, and monetization of the benefits resulting from policy alternatives
and market scenarios. This will allow a progression to benefit-cost analyses and a better
understanding of the distribution of costs and benefits among the stakeholders. The
environmental impacts that will be addressed with these tools are local air quality, community
noise, and climate change.
Because of the immediacy of upcoming global decisions and the need to adequately inform these
decisions, the highest priority for the geographical and economic scope for all of these analyses
is global and regional (or national). Thereafter, focused studies over smaller geographical areas
and economies will be pursued (e.g., within a single airport community).
This document describes the types of analysis that will be included in progressive versions of
APMT. It reviews existing tools available for these types of analysis, assesses their suitability for
use in APMT, and establishes what additional development will be necessary to achieve APMT
requirements. Thus, the document describes the components of the APMT architecture, outlines
the interfaces that will be required among those components, and establishes how APMT will
interface with other FAA-AEE tools that exist or are under development, including the
Environmental Design Space (EDS) and the Aviation Environmental Design Tool (AEDT).
1.1 Overview of APMT Requirements and Development Plan
The APMT Requirements Document provides a detailed list of functional requirements and
guidance for implementation of APMT. It defines the recommended time frames for
APMT Architecture Study 15
development and use, as well as the geographical and economic scope for analyses performed
using APMT. An overview of this information as it appears in the APMT Requirements
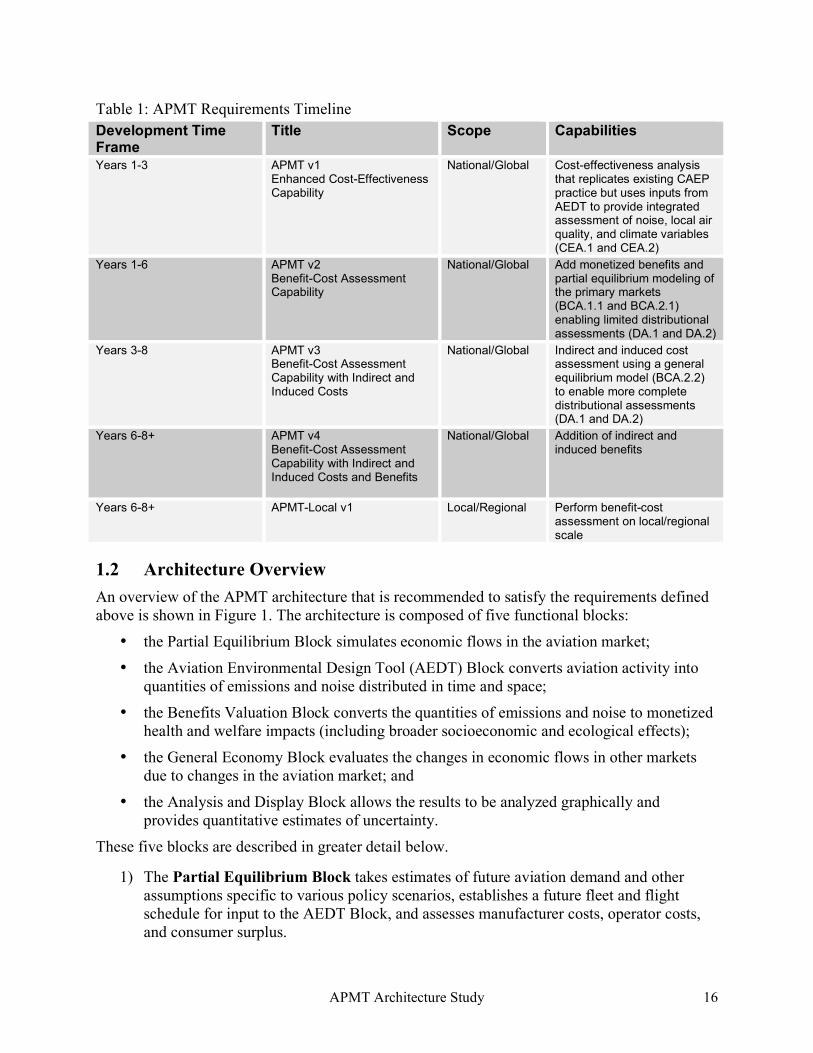
Document is presented in Table 1. The recommendations are briefly reviewed below.
To respond to near-term needs, the APMT Requirements Document recommends that the FAA
start immediately to develop the capabilities for cost-effectiveness analysis that would
encompass but go beyond current ICAO CAEP capabilities. The capability should be operational
within 1-3 years, accept a range of environmental performance indicators from AEDT (e.g.,
number of people living within DNL 65dB; kg NOx; kg fuel burn, etc.) and enable a first
assessment of indirect environmental effects that policy options in one domain may produce in
another domain (e.g., the effects of noise stringency on NOx levels). It is also recommended that
the FAA immediately start to develop the capabilities for benefit-cost analysis within the primary
aviation markets, to include monetization of benefits and partial-equilibrium modeling of the
consumers and producers in the primary market. Pending the availability of data, it is expected
that this capability would be developed first for application within the U.S. (within 1-3 years)
and then expanded internationally through partnerships and collaborations (4-6 years). The
objective is for benefit-cost analysis (the recommended basis for policy analysis in the North
America and Europe) to ultimately supplant the near-term reliance on cost-effectiveness analysis.
To address longer-term needs (3-8 years), APMT development should focus on expanding the
above capabilities first to include the addition of indirect and induced costs within the broader
economy. This should be done through developing a general equilibrium model, which would
also allow for a greater range of distributional analyses. Then, as environmental economics
research continues to mature, it will be necessary to include indirect and induced benefits to
provide a complete capability for environmental economics analyses.
APMT Architecture Study 16
Table 1: APMT Requirements Timeline
Development Time Frame
Title Scope Capabilities
Years 1-3 APMT v1 Enhanced Cost-Effectiveness Capability
National/Global Cost-effectiveness analysis that replicates existing CAEP practice but uses inputs from AEDT to provide integrated assessment of noise, local air quality, and climate variables (CEA.1 and CEA.2)
Years 1-6 APMT v2 Benefit-Cost Assessment Capability
National/Global Add monetized benefits and partial equilibrium modeling of the primary markets (BCA.1.1 and BCA.2.1) enabling limited distributional assessments (DA.1 and DA.2)
Years 3-8 APMT v3 Benefit-Cost Assessment Capability with Indirect and Induced Costs
National/Global Indirect and induced cost assessment using a general equilibrium model (BCA.2.2) to enable more complete distributional assessments (DA.1 and DA.2)
Years 6-8+ APMT v4 Benefit-Cost Assessment Capability with Indirect and Induced Costs and Benefits
National/Global
Addition of indirect and induced benefits
Years 6-8+ APMT-Local v1 Local/Regional Perform benefit-cost assessment on local/regional scale
1.2 Architecture Overview
An overview of the APMT architecture that is recommended to satisfy the requirements defined
above is shown in Figure 1. The architecture is composed of five functional blocks:
• the Partial Equilibrium Block simulates economic flows in the aviation market;
• the Aviation Environmental Design Tool (AEDT) Block converts aviation activity into
quantities of emissions and noise distributed in time and space;
• the Benefits Valuation Block converts the quantities of emissions and noise to monetized
health and welfare impacts (including broader socioeconomic and ecological effects);
• the General Economy Block evaluates the changes in economic flows in other markets
due to changes in the aviation market; and
• the Analysis and Display Block allows the results to be analyzed graphically and
provides quantitative estimates of uncertainty.
These five blocks are described in greater detail below.
1) The Partial Equilibrium Block takes estimates of future aviation demand and other
assumptions specific to various policy scenarios, establishes a future fleet and flight
schedule for input to the AEDT Block, and assesses manufacturer costs, operator costs,
and consumer surplus.
APMT Architecture Study 17
An assumption about the extent to which costs are passed on to consumers, leading to a
modification of the initial demand assumption, completes the partial-equilibrium loop.
Airline costs, manufacturer costs, and consumer surplus can be used directly for cost-
effectiveness and benefit-cost assessments, or can be multiplied to reflect indirect and
induced effects associated with broader effects in the general economy.
The Partial Equilibrium Block includes a link to EDS to provide new technology aircraft
that may be introduced as part of the policy scenario and to ensure that the future aircraft
characteristics provided by EDS are developed using assumptions and requirements
consistent with the APMT scenario. To develop this functionality, an Aviation
Operations Generator module will be developed in concert with AEDT. This module will
be based upon methods used by the Wyle/FAA Model for Assessing Global Exposure
from Noise of Transport Airplanes (MAGENTA), but modified to enable the introduction
of new aircraft from EDS. Manufacturer cost and aircraft price estimates will be based
upon correlations drawn from regression analyses of historical price data with a range of
assumptions for manufacturer profits. Uncertainty will be addressed through
parametrically varying the estimates. Higher fidelity modeling of manufacturing costs
associated with technology trade-offs will be accomplished using the NASA/GaTech
Aircraft Life Cycle Cost Analysis code (ALCCA), but further assessment and
development of ALCCA will be required.
Airline operating costs will be estimated using methods derived from the Dutch Aviation
Emission and Evaluation of Reduction Options Modeling System Aviation Operating
Cost Model (AERO-MS ACOS). Airline cost pass-through to fares will be modeled
parametrically in a manner similar to that done within AERO-MS, although work to
improve these techniques is recommended for longer-term application within APMT.
2) The Aviation Environmental Design Tool Block represents the significant development
efforts already underway within the FAA to integrate the existing noise and emissions
modeling tools, including the Integrated Noise Model (INM), MAGENTA, Emissions
and Dispersion Modeling System (EDMS), and the System for Assessing Aviation’s
Global Emissions (SAGE).
In aggregate, the AEDT Block will take as input the detailed schedule and fleet
information from the Partial Equilibrium Block, and will provide as output the noise and
emissions inventories, both locally and globally. These outputs may be used directly with
the costs from the Partial Equilibrium Block to form cost-effectiveness assessments, or
can be passed to the Benefits Valuation Block to enable benefit-cost assessments.
3) The Benefits Valuation Block takes noise and emissions inventory information from the
AEDT Block, demographic and socioeconomic data, measurements of background
concentrations of pollutants (e.g., from the US EPA), and estimates of changes in health
and welfare endpoints for climate, local air quality, and noise. To a large extent, this is
accomplished through reliance on external sources of information (e.g., concentration-
response curves established by other agencies for relating pollutants to mortality and
morbidity incidences).
Changes in health and welfare are then monetized to enable benefit-cost analyses. The
monetization will draw heavily on a wide range of published studies within the U.S. and
APMT Architecture Study 18
Europe that have focused on this topic. The block will be developed starting from the
existing capabilities of the MIT Multi-Attribute Impact Pathway Analysis tool (MAIPA),
but will be augmented to include components of the US EPA Environmental Benefits
Mapping and Analysis Program (BenMAP).
4) The General Economy Block is currently envisioned as a simplified mechanism for
including multiplier effects associated with indirect and induced costs in markets beyond
the primary aviation markets. These multiplier effects will be specified exogenously and
drawn from the literature as well as from external general equilibrium models. However,
future versions of APMT may consider a more complete integration of a general
equilibrium model with the other components of APMT.
5) The Analysis and Display Block will collect costs and benefits, provide assessments of
propagated uncertainty, and allow cost-effectiveness and benefit-cost analyses.
Depending on the level of maturity of the modeling tools and the specific assessment
scenario being studied, varying types of distributional analyses will be available. For
example, for the cost-effectiveness analysis it will be possible to understand the effects of
policy scenarios on broad geographical regions and primary market categories. For the
benefit-cost assessments, it will be possible to consider a variety of categories of
impacted populations consistent with the level of detail present within the census data.
In addition to the general functionality described above, there are several overarching
requirements that must be met by APMT. These are defined in detail in the APMT Requirements
Document and are only briefly mentioned here. In particular, it is critical that all versions of
APMT enable quantitative assessment of uncertainty and that all versions enable scenario and
sensitivity analyses. Further, throughout the development of APMT it will be necessary to
balance thoroughness against practicality while being inclusive of stakeholders’ perspectives and
maintaining transparency.
Not all of these capabilities will be realized at the same time. The following section discusses the
time-line for development of APMT.
APMT Architecture Study 19
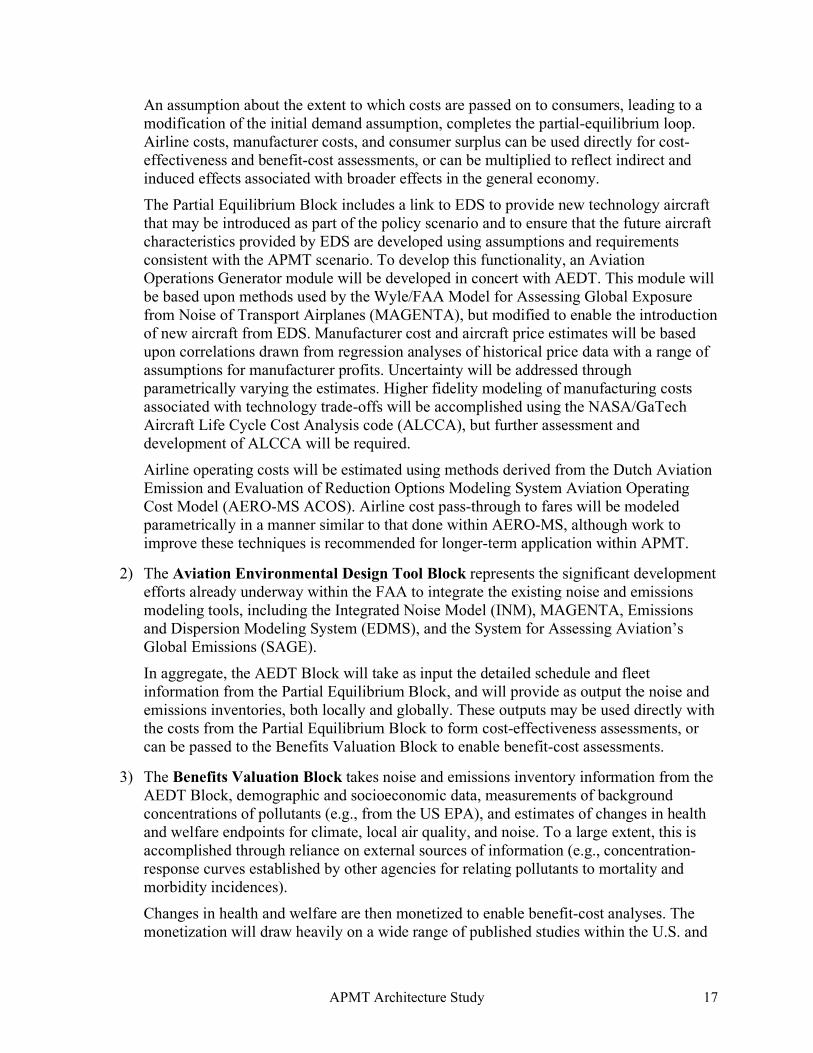
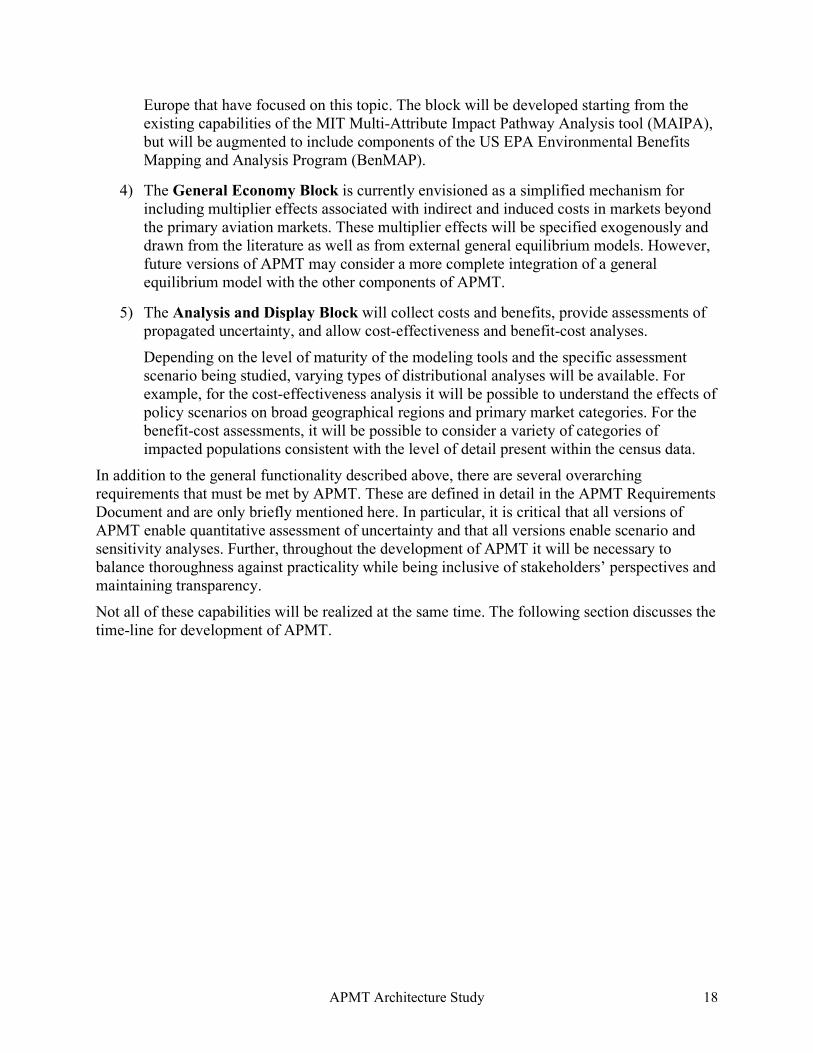
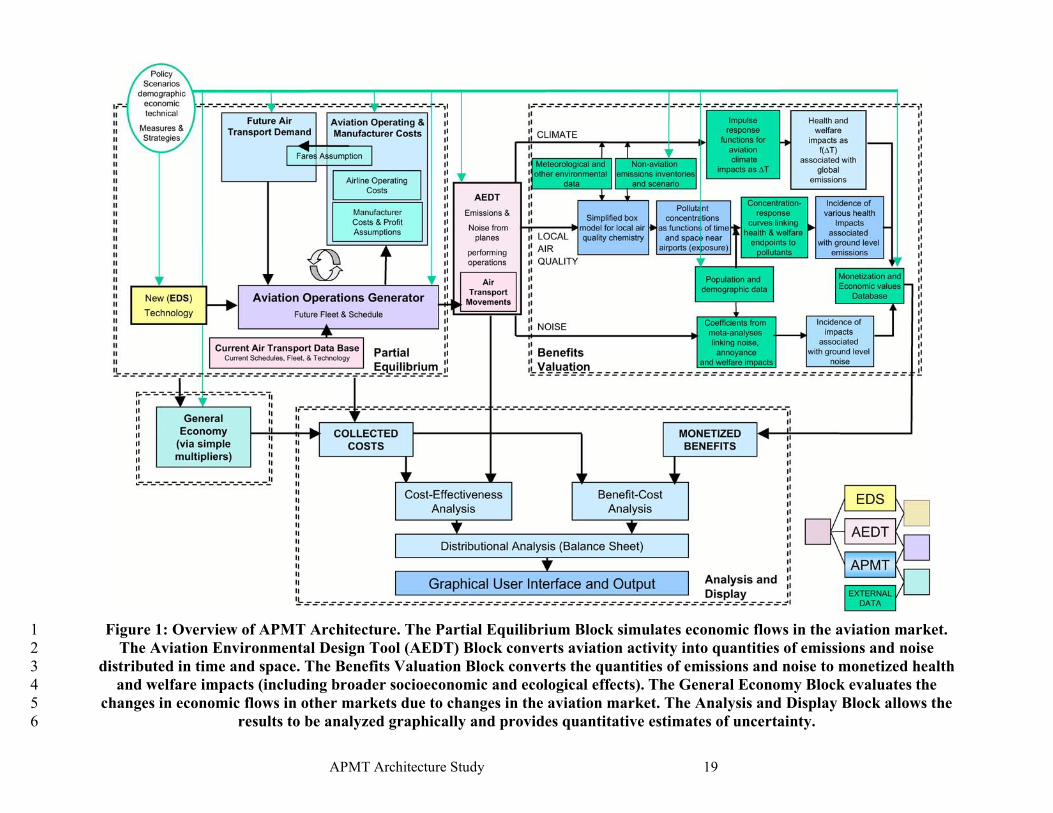
Figure 1: Overview of APMT Architecture. The Partial Equilibrium Block simulates economic flows in the aviation market. 1
The Aviation Environmental Design Tool (AEDT) Block converts aviation activity into quantities of emissions and noise 2
distributed in time and space. The Benefits Valuation Block converts the quantities of emissions and noise to monetized health 3
and welfare impacts (including broader socioeconomic and ecological effects). The General Economy Block evaluates the 4
changes in economic flows in other markets due to changes in the aviation market. The Analysis and Display Block allows the 5
results to be analyzed graphically and provides quantitative estimates of uncertainty. 6
APMT Architecture Study 20
1.3 APMT Versions
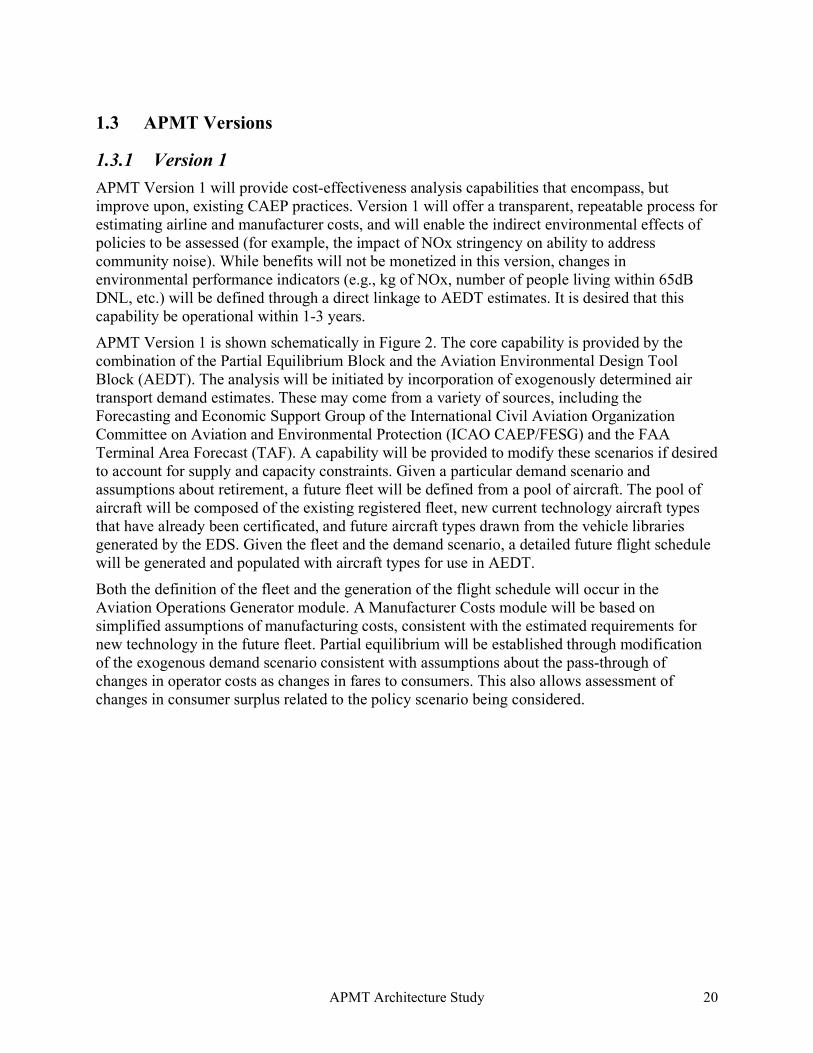
1.3.1 Version 1
APMT Version 1 will provide cost-effectiveness analysis capabilities that encompass, but improve upon, existing CAEP practices. Version 1 will offer a transparent, repeatable process for estimating airline and manufacturer costs, and will enable the indirect environmental effects of policies to be assessed (for example, the impact of NOx stringency on ability to address community noise). While benefits will not be monetized in this version, changes in environmental performance indicators (e.g., kg of NOx, number of people living within 65dB DNL, etc.) will be defined through a direct linkage to AEDT estimates. It is desired that this capability be operational within 1-3 years.
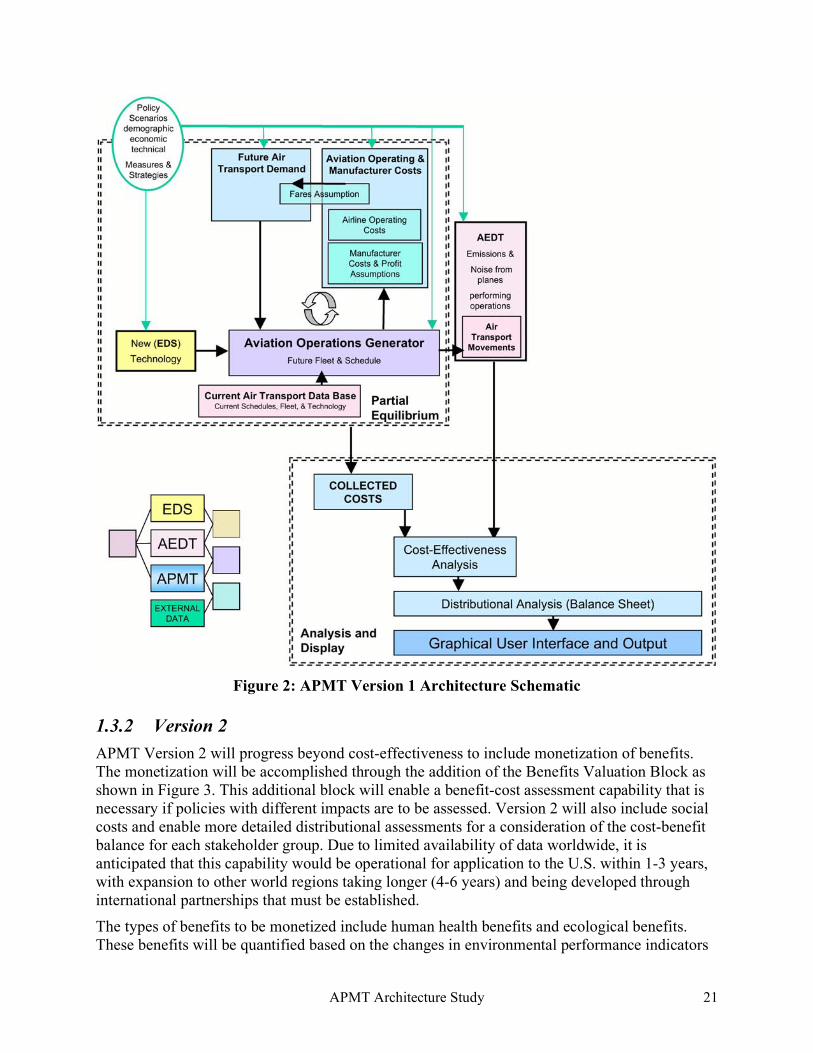
APMT Version 1 is shown schematically in Figure 2. The core capability is provided by the combination of the Partial Equilibrium Block and the Aviation Environmental Design Tool Block (AEDT). The analysis will be initiated by incorporation of exogenously determined air transport demand estimates. These may come from a variety of sources, including the Forecasting and Economic Support Group of the International Civil Aviation Organization Committee on Aviation and Environmental Protection (ICAO CAEP/FESG) and the FAA Terminal Area Forecast (TAF). A capability will be provided to modify these scenarios if desired to account for supply and capacity constraints. Given a particular demand scenario and assumptions about retirement, a future fleet will be defined from a pool of aircraft. The pool of aircraft will be composed of the existing registered fleet, new current technology aircraft types that have already been certificated, and future aircraft types drawn from the vehicle libraries generated by the EDS. Given the fleet and the demand scenario, a detailed future flight schedule will be generated and populated with aircraft types for use in AEDT.
Both the definition of the fleet and the generation of the flight schedule will occur in the Aviation Operations Generator module. A Manufacturer Costs module will be based on simplified assumptions of manufacturing costs, consistent with the estimated requirements for new technology in the future fleet. Partial equilibrium will be established through modification of the exogenous demand scenario consistent with assumptions about the pass-through of changes in operator costs as changes in fares to consumers. This also allows assessment of changes in consumer surplus related to the policy scenario being considered.
APMT Architecture Study 21
Figure 2: APMT Version 1 Architecture Schematic
1.3.2 Version 2
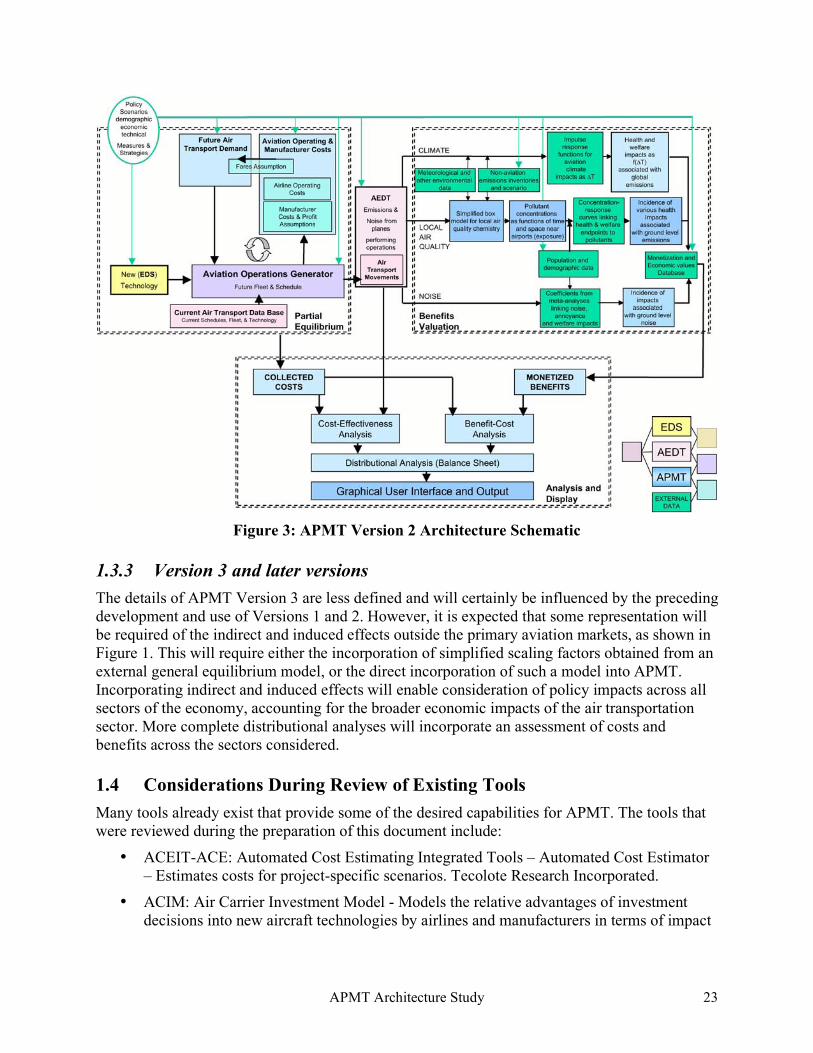
APMT Version 2 will progress beyond cost-effectiveness to include monetization of benefits. The monetization will be accomplished through the addition of the Benefits Valuation Block as shown in Figure 3. This additional block will enable a benefit-cost assessment capability that is necessary if policies with different impacts are to be assessed. Version 2 will also include social costs and enable more detailed distributional assessments for a consideration of the cost-benefit balance for each stakeholder group. Due to limited availability of data worldwide, it is anticipated that this capability would be operational for application to the U.S. within 1-3 years, with expansion to other world regions taking longer (4-6 years) and being developed through international partnerships that must be established.
The types of benefits to be monetized include human health benefits and ecological benefits. These benefits will be quantified based on the changes in environmental performance indicators
APMT Architecture Study 22
for local air quality emissions, climate emissions, and noise, provided by AEDT. It will then be necessary to translate changes in these indicators into changes in health and welfare impacts (e.g., changes in NOx emissions lead to changes in ozone concentrations which lead to changes in the incidence of asthma). For climate, due to the high uncertainty in understanding the impacts of aviation, the conversion of emissions changes to health and welfare changes will be based on exogenously-supplied climate impulse response functions that are specific to aviation, allowing for changes as the science improves. The health and welfare impacts of climate change (including broad socio-economic and ecological effects) will be estimated through reference to a range of studies available in the literature. For local air quality, airport-local emissions for aviation and non-aviation sources will be incorporated into a simplified, perfectly-mixed reactor model to estimate changes in pollutant chemistry. Then concentration-response curves in use by the U.S. Environmental Protection Agency (EPA) as well as demographic information from census data will be used to estimate changes in health endpoints. For community noise, the AEDT Block provides estimates of the number of people within different noise level contours around airports. This input will be used directly, but will be augmented with additional census information (e.g., housing and income values around airports) to allow for monetization. The monetization of all of these benefits will employ commonly used valuation methods such as stated preference, out-of-pocket expenditures, and market models, and will draw heavily on well-established studies such as those in use by EPA and the European Union.
The scope of costs assessed within APMT Version 2 will remain at the aggregate global/national level. However, analysis of the health and welfare impacts will be accomplished for the region local to the airport in a way that is consistent with the geographical scale and resolution of the census track data.
APMT Architecture Study 23
Figure 3: APMT Version 2 Architecture Schematic
1.3.3 Version 3 and later versions
The details of APMT Version 3 are less defined and will certainly be influenced by the preceding development and use of Versions 1 and 2. However, it is expected that some representation will be required of the indirect and induced effects outside the primary aviation markets, as shown in Figure 1. This will require either the incorporation of simplified scaling factors obtained from an external general equilibrium model, or the direct incorporation of such a model into APMT. Incorporating indirect and induced effects will enable consideration of policy impacts across all sectors of the economy, accounting for the broader economic impacts of the air transportation sector. More complete distributional analyses will incorporate an assessment of costs and benefits across the sectors considered.
1.4 Considerations During Review of Existing Tools
Many tools already exist that provide some of the desired capabilities for APMT. The tools that were reviewed during the preparation of this document include:
• ACEIT-ACE: Automated Cost Estimating Integrated Tools – Automated Cost Estimator – Estimates costs for project-specific scenarios. Tecolote Research Incorporated.
• ACIM: Air Carrier Investment Model - Models the relative advantages of investment decisions into new aircraft technologies by airlines and manufacturers in terms of impact
APMT Architecture Study 24
on fleets, fares, and airline traffic. Developed by the Logistics Management Institute for NASA.
• AERO-MS: Aviation Emission and Evaluation of Reduction Options Modeling System - Provides a comprehensive approach to quantifying the economic and environmental impacts of emissions policy in aviation, under different future scenarios. It uses a projection framework that leaves demand and traffic proportional to a base year (1992). Developed by the Netherlands Ministry of Transport.
• ALCCA: Aircraft Life Cycle Cost Analysis – Estimates manufacturing costs and operating costs for a single aircraft. Developed by NASA and Georgia Institute of Technology.
• AOGCM: Atmosphere-Ocean General Circulation Model
• BenMap: (Environmental) Benefits Mapping and Analysis Program - Estimates economic values for air quality endpoints given an estimate of the change in air quality for communities in proximity to airports. Developed by Abt Associates, Inc. for the U.S. EPA.
• BeTa: Benefit Table (database) - Contains values per ton of several emissions differentiated by country and by urban versus rural, providing a source of comparative damage costs. Created for the European Commission DG Environment by netcen.
• EDMS: Emissions and Dispersion Modeling System - Computational, local aviation emissions modeling code. Developed by CSSI for the FAA.
• FATE: Future Aviation Timetable Estimator - Translates passenger demand for air travel into a forecast of aircraft operations based on existing route networks. Developed by MITRE.
• INM: Integrated Noise Model – Computational, local aviation noise modeling code. Developed by ATAC Corporation for the FAA.
• MAGENTA: Model for Assessing Global Exposure from Noise of Transport Airplanes - Global, computational noise code. Developed by Wyle Laboratories for the FAA.
• MAIPA: Multi-Attribute Impact Pathway Analysis – Calculates environmental costs resulting from aviation noise and emissions. Developed by MIT.
• NEMS: National Energy Modeling System - Models the entire supply-side and demand-side of the energy sector, and the resulting impacts on the economy, as well as policy changes and their impacts on energy demand and supply. Energy Information Administration of the U.S. Department of Energy.
• PRICE-H: Price Systems Hardware cost estimator - Software used to estimate the cost of hardware-related items for projects of any scale. PRICE Systems Incorporated.
• SAGE: System for Assessing Global Aviation Emissions - Computational, global aviation emissions modeling code. Developed by MIT and Volpe National Transportation Systems Center for the FAA.
APMT Architecture Study 25
• SCSM: Stratus Consulting Spreadsheet Model - Designed to build upon, enhance, and validate the AERO-MS model in the evaluation of potential CO2 reduction measures. Developed by Stratus Consulting, Inc.
• SEER-H: Hardware element of SEER tools - a decision support tool providing lifecycle cost (LCC) for any scale hardware project. Galorath Incorporated.
• TAF: Terminal Area Forecast – Estimates airport operation growth given a database for passenger, general aviation, military, and air taxi categories by individual airports. FAA
• TCM: Tailored Cost Model – Estimates manufacturing and operating costs for a single aircraft. Developed by NASA.
Particular strengths and weaknesses of these tools are described in the following sections along with recommendations on components of these tools that could serve as a foundation for APMT. During the review of these tools, several criteria were considered to determine the development that would be required in their use and integration with APMT. These criteria are discussed in greater detail in Appendix A.
2 PARTIAL EQUILIBRIUM BLOCK
The Partial Equilibrium Block takes estimates of future aviation demand and other assumptions specific to various policy scenarios, establishes a future fleet and flight schedule for input to AEDT, and assesses manufacturer costs, operator costs, and consumer surplus. This section describes how the different components of the Partial Equilibrium Block work together to capture the new equilibrium in the market for air travel after a change in policy, as well as the impact of that change on the traveling public and air carriers.
2.1 Aviation Operations Generator Module
As stated in the APMT Requirements Document and emphasized in Section 1 of this document, FAA-AEE is undertaking the development of the APMT tool in accordance with the FAA's Flight Plan, the NGATS Integrated Plan, and the ICAO-CAEP mission. Of these, the ICAO-CAEP mission presents the most stringent timeline. As a result, much of the production timeline proposed in the APMT Requirements Document is driven by the schedule of CAEP analyses over the next several years. Because APMT must have world-wide applicability, it is important that it be flexible and transparent. The Aviation Operations Generator module must ultimately be capable of taking in initial input from FAA, EUROCONTROL, and other traffic forecasts.
CAEP’s Forecasting and Economics Support Group (FESG) produces traffic and fleet forecasts for use in CAEP policy and economic analyses. Using a common forecast across different CAEP analyses helps make different studies comparable and more credible. As CAEP has been identified as a primary user of APMT analysis results, it is critical that APMT be capable of using the FESG forecast as input.
The FESG traffic and fleet forecast represents a global consensus forecast. This forecast starts with the ICAO traffic forecast (which is based on econometric analysis) and is later combined with global fleet forecast data contributed by experts from the aerospace industry. These experts form a consensus on the critical economic parameters needed for the forecast, including GDP and aircraft retirement curves. Once the consensus on these critical economic parameters is
APMT Architecture Study 26
reached, expectations on the trajectories of the world economic data can be parametrically translated into estimated future behavior of scheduled passenger fleet and traffic. In practice, these estimates are reviewed and adjusted for factors not captured in the econometric model (for instance, for a new regional trade agreement). This analysis is carried out at the global level and then decomposed, based on historical relationships (traffic and market shares), into airline traffic projections for airlines regionally. The final format of the traffic forecast is Revenue Passenger Kilometers (RPK) by 22 major domestic and international route groups.
The FESG fleet [ICAO-CAEP, 2004b] is for nine generic seat categories. It assumes retirement of the existing fleet based on statistically estimated survival curves for four classes of aircraft. From there, replacement is modeled to meet the projected RPK growth while maintaining load factors determined by FESG that vary regionally. The RPK growth can be met by flying a smaller fleet more frequently or flying bigger planes less frequently—this frequency/capacity split is modeled based on historical data.
The process described below for using the FESG fleet forecast is in place for the MAGENTA model, which has been used in CAEP analyses and will be a component of AEDT. The process uses the FESG forecast, has gained approval from CAEP, and produces the required output for APMT. Modification to the process will be required for policy scenario runs to reflect information regarding future aircraft technology from the EDS module and updates in growth from the Future Air Transport Demand module.
2.1.1 MAGENTA Use of FESG Forecasts
The MAGENTA forecast processing engine was initially developed during the CAEP5 cycle under the guidance and oversight of the CAEP-MAGENTA task group and was utilized to generate both the CAEP5 and CAEP6 noise exposure estimates. A modified version of MAGENTA was also developed to accommodate FAA’s research and reporting needs.
The software allows the development of future operational scenarios from a baseline database by modifying the initial aircraft fleet and associated operations to reflect the forecasted conditions. It can directly model many aspects of the world movements and fleet evolution: operations growth and decline, fleet changes due to retirement or phase-out, and fleet evolution based on future stringency requirements and local economic necessities (i.e. acquisition of used equipment.
The MAGENTA forecast processing software uses a bottom-up approach in the development of the new dataset and derives its input information from various databases provided by the user. The input databases can be divided into two groups: operations and fleet related databases. Inputs that are projected into the future come from FESG forecasts of the fleet (with retirement curves) and RPK traffic. How the traffic is distributed by characteristics such as time of day or location is scaled from existing data.
2.1.1.1 Processing sequence
The processing of forecasts in the MAGENTA system is executed in distinct self-contained steps, allowing the execution of individual forecasting processes as needed. The process flow can be divided into two logical sections: fleet composition processes and operations processes (which also affect fleet composition.) The order of execution is as follows:
APMT Architecture Study 27
1) User-defined substitutions of aircraft,
2) Aircraft phase-outs,
3) Aircraft retirement, and
4) Operations growth, which is subdivided into passenger and freight operations growth for the CAEP version and commercial, military, and general aviation (GA) growth for the US version.
2.1.1.2 User-defined substitutions
The user-defined substitution process is designed as a flexible tool for the implementation of fleet changes. It was originally developed to model the fleet composition in the midst of the Chapter 2 aircraft phase-out, but it has proven to be a valuable tool in other situations as well. The process is designed to first select a subset of operations records based on aircraft, engine, service type, and record source information provided by the user. Once the records are selected, the operations are reassigned to a new aircraft type using the aircraft information and distribution percentages listed, along with the selection parameters. The strength of this process is that the user can utilize wildcards, keywords, and partial information to create either very broad or very narrow selection definitions based on specific needs. In addition, this process does not enforce a 1-to-1 rule in the reassignment of the selected operations, thus allowing the user to affect the number of operations along with the fleet mix.
2.1.1.3 Aircraft phase-outs
Given the fact that the MAGENTA operations database contains records both with and without engine information, the phase-out processor had to be designed to utilize two separate databases to fully apply phase-outs. One database is used to process records in which the aircraft is fully identified with airframe and engine information. This database contains all airframe and engine combinations slated for retirement along with the appropriate retirement percentage. The latter value is calculated during the database generation and depends on the retirement schedule and the year being modeled. The second database is used to process records in which the engine is not identified10, which is an issue when an aircraft’s retirement is dependent on the engines it mounts. To overcome this problem, the phase-out percentages listed in this database for each aircraft are calculated based not only on the phase-out schedule and the year being modeled, but also on the ratio of compliant versus non-compliant aircraft, derived by querying the fleet database.
Once the records of the aircraft to be phased-out are selected, the associated number of operations is computed according to the phase-out percentage, and then the operations are reassigned to new aircraft using the common replacement approach appropriate to the airport being processed (as described in Section 2.1.1.6).
10 When the IATA aircraft code listed for a carrier’s operation in the IOAG database cannot be successfully mapped to entries in the fleet database for that carrier (or when the carrier is not listed,) the operation is split evenly among all aircraft types that the IATA ID represents.
APMT Architecture Study 28
2.1.1.4 Aircraft retirement
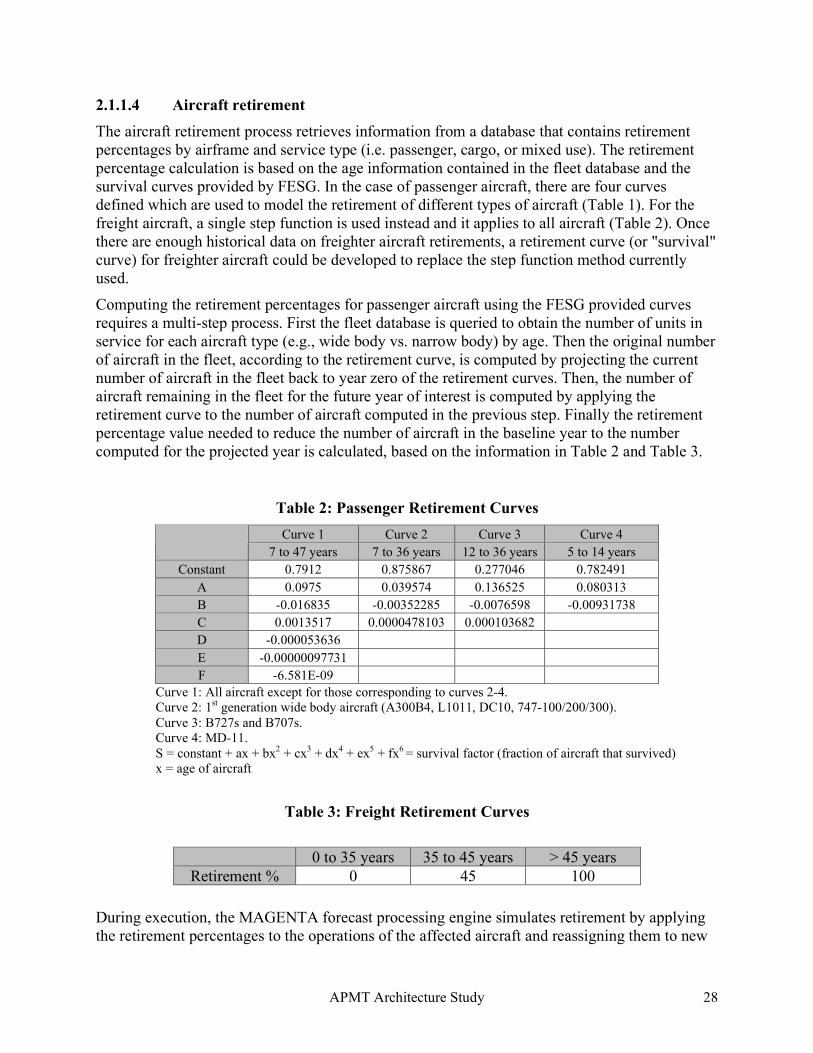
The aircraft retirement process retrieves information from a database that contains retirement percentages by airframe and service type (i.e. passenger, cargo, or mixed use). The retirement percentage calculation is based on the age information contained in the fleet database and the survival curves provided by FESG. In the case of passenger aircraft, there are four curves defined which are used to model the retirement of different types of aircraft (Table 1). For the freight aircraft, a single step function is used instead and it applies to all aircraft (Table 2). Once there are enough historical data on freighter aircraft retirements, a retirement curve (or "survival" curve) for freighter aircraft could be developed to replace the step function method currently used.
Computing the retirement percentages for passenger aircraft using the FESG provided curves requires a multi-step process. First the fleet database is queried to obtain the number of units in service for each aircraft type (e.g., wide body vs. narrow body) by age. Then the original number of aircraft in the fleet, according to the retirement curve, is computed by projecting the current number of aircraft in the fleet back to year zero of the retirement curves. Then, the number of aircraft remaining in the fleet for the future year of interest is computed by applying the retirement curve to the number of aircraft computed in the previous step. Finally the retirement percentage value needed to reduce the number of aircraft in the baseline year to the number computed for the projected year is calculated, based on the information in Table 2 and Table 3.
Table 2: Passenger Retirement Curves
Curve 1 Curve 2 Curve 3 Curve 4
7 to 47 years 7 to 36 years 12 to 36 years 5 to 14 years
Constant 0.7912 0.875867 0.277046 0.782491
A 0.0975 0.039574 0.136525 0.080313
B -0.016835 -0.00352285 -0.0076598 -0.00931738
C 0.0013517 0.0000478103 0.000103682
D -0.000053636
E -0.00000097731
F -6.581E-09
Curve 1: All aircraft except for those corresponding to curves 2-4. Curve 2: 1st generation wide body aircraft (A300B4, L1011, DC10, 747-100/200/300). Curve 3: B727s and B707s. Curve 4: MD-11. S = constant + ax + bx2 + cx3 + dx4 + ex5 + fx6 = survival factor (fraction of aircraft that survived) x = age of aircraft
Table 3: Freight Retirement Curves
0 to 35 years 35 to 45 years > 45 years
Retirement % 0 45 100
During execution, the MAGENTA forecast processing engine simulates retirement by applying the retirement percentages to the operations of the affected aircraft and reassigning them to new
APMT Architecture Study 29
ones. The selection of the new replacement aircraft is once again based on the common replacement approach appropriate to the airport being processed (as described in Section 2.1.1.6).
2.1.1.5 Operations growth
The operations growth process was initially developed only to accept information derived from the FESG forecast. Subsequently, it was adapted to also accept information derived from the US Terminal Area Forecast (TAF) database. The FESG forecast is subdivided into 22 route group matrices of distinct seat class and stage length combinations, or cells, while the TAF gives passenger, general aviation, military and air taxi categories by individual airports.
For both FESG and TAF forecasts, the operations growth estimates are calculated by comparing the baseline year operations to the projected year’s operations and computing the percentage value required to grow/shrink the baseline operations to the future year’s levels. During the execution, the software matches operations records to the appropriate growth values based on route group, seat class, and stage length for a FESG forecast-based scenario, or by airport and aircraft category for a TAF-based forecast. If the provided value represents an increase, the additional operations are redistributed to new aircraft based on the common replacement approach appropriate to the airport being processed (as described in the following section). If the growth value represents a decrease in operations, the values stored in the database are decreased accordingly.
2.1.1.6 Common aircraft replacement approach
One important aspect common to all forecasting processes, with the exclusion of the user-defined substitutions, is that they generate new operations records with the appropriate aircraft information in the database being updated. There are two approaches the system can utilize in selecting the appropriate replacement aircraft; which aircraft is selected depends on the classification of the airport associated with the records being processed.
The first method is used for airports located in countries that adopted the ICAO Chapter 2 Noise phase-out, where it is assumed that the airline fleets are at full utilization and that new growth will be accommodated by acquiring new aircraft from the manufacturers. In this case, the replacement aircraft types are selected from the Substitution Aircraft database based on the Seat Class and Stage Length IDs. Since each ID combination matches multiple records in the substitutions database, the replacement aircraft are assigned a distribution percentage that is used to properly apportion the operations of the new records generated by the forecasting process.
The second methodology available to the system is utilized at airports in the Rest-of-the-World countries (RoW – countries that did not adopt the Noise Chapter 2 phase-out). This methodology also assumes that airline fleets are fully utilized, but in these regions the increased demand will be satisfied by the acquisition of both new and used aircraft. In this case, the system first generates two copies of the new records and scales their operations based on the percentages provided by the user to indicate the ratio of new to used aircraft. Once the adjustment is performed, the set of records that was adjusted using the used aircraft fleet percentage is added back into the main operations database, which simulates the acquisition of used aircraft. The other set is processed using the first method to simulate the acquisition of new aircraft. The benefit of this methodology is that it does not rely on a centralized database to select the used
APMT Architecture Study 30
aircraft fleet mix, but rather uses the fleet currently operating at each individual airport. Consequently, this approach generates a fleet mix that is more consistent with local realities.
2.1.2 Aviation Operations Generator Module Development Needs
The MAGENTA approach to the generation of an operating schedule does not recognize that changes in stringency policy and/or aircraft technology will affect the choice of aircraft types by air carriers, and potentially the operating characteristics (stage length, utilization), other than through allowing the user to manually define replacements. These airline decisions, driven by business strategy and competitive factors, directly affect the assumed schedule and, in turn, the calculation of airline operating costs. AERO-MS offers an alternative platform for development of the Aviation Operations Generator module, but it also lacks the necessary feedback between the aircraft choice and the stringencies imposed. MAGENTA may have an advantage in the areas of accessibility and transparency.
A fleet choice capability that enables replacement with aircraft types from EDS with sensitivity to the cost incentives created by specific policy scenarios is a necessary extension to the MAGENTA approach in the near term. This capability might be integrated into the MAGENTA process through the user-defined replacements. This capability is required to complete the Partial Equilibrium Block as a self-contained integrated set of modules with feedback loops as shown in Figure 2.
In the long term, it would be desirable to develop a more sophisticated approach to fleeting and scheduling that takes into account air carrier business decisions, although these are difficult to predict. Under changing regulatory policies, fleet and operational decisions are driven not only by operating cost considerations (e.g., lower fuel consumption of a newer technology aircraft), but also by a wide range of factors more difficult to quantify and to predict 20 years into the future, including:
• Importance of flight frequency and smaller aircraft in capturing market share in a competitive market
• Availability of old vs. new aircraft and commitments to individual manufacturers, all of which affect plans for fleet growth, retirements, and replacements.
• Limitations on airspace and/or airport capacity (which do not necessarily lead to rational fleet decisions – for example, proliferation of regional jets at LaGuardia despite record delays), and
• Government regulations and/or incentives that encourage or discourage acceptance of new technology aircraft.
Specifically, the modeled carrier responses should include projected shifts in airline network and operational characteristics such as:
• Average stage length
• Aircraft utilization (block hours/day)
• Average aircraft size
• Average load factor
• Point-to-point vs. hub-and-spoke operations
APMT Architecture Study 31
• Different airline business models (low-cost vs. legacy airlines)
The feasibility of developing such an expanded, more realistic Aviations Operations Generator module for APMT will depend upon the continued necessity of relying on FESG or other exogenous forecasts (vs. developing a forecast directly integrated into the other APMT components), as well as the nature of the FESG or other forecasts over time (they could become more detailed).
2.2 Environmental Design Space Module
Within APMT, the Environmental Design Space (EDS) will be the tool used to estimate source noise, exhaust emissions, performance, and economic parameters for potential future aircraft designs under different technological, policy and economic scenarios. EDS will serve as a mechanism for collecting, incorporating, and quantifying long-term technology forecasts. This will be an inherently expert-driven process, drawing on industry advice. The FAA, in collaboration with NASA, began development of EDS in February 2005 through the Partnership for Air Transportation Noise and Emissions Reduction (PARTNER) Center of Excellence. A five-year development program is planned. Detailed EDS documentation is available and may be requested from FAA-AEE. Here we provide only a brief review of EDS. EDS simulates an airframe and engine preliminary design activity. For a given seat class and mission, an optimal design is sought which maximizes some objective function (e.g., airline return on investment), while satisfying hundreds of constraints (e.g., no tail strike during take-off rotation) and physical relationships (e.g., the thermodynamic and fluid mechanical relationships within in an engine). For example, to assess the impacts of policy alternatives, constraints would include different certification levels for NOx emissions and noise. EDS will allow estimates to be made of potentially important trade-offs (e.g., increased NOx stringency leading to heavier aircraft with higher noise and larger capital and operating costs). EDS is intended to improve upon current ICAO CAEP practice where these trade-offs and interdependencies are not fully assessed during decision-making. Further, most ICAO CAEP policy analyses assume “frozen technology”; future aircraft are assumed to have fuel burn, cost, emissions and noise performance typical of the best available technology in the current fleet. The errors introduced by this assumption may be significant for some of the longer-term (20 and 30 year) policy analyses performed by ICAO CAEP. By providing estimates of performance under different ranges of potential future technological capability (e.g., improvements in engine turbine inlet temperature, airframe composite mass fraction, etc.), EDS will allow better estimates of potential future aircraft performance. As noted above, incorporating such long-term technology forecasts will be an inherently expert-driven process.
Within APMT, EDS will take inputs regarding policy and market scenarios (e.g., certification stringency levels and fuel price) and provide estimates of aircraft operating costs (e.g., block fuel burn as a function of stage length) to the Airline Operating Costs module. EDS will also provide information to the AEDT Block, including general aircraft characteristics, aerodynamic performance parameters, engine specifications, noise-power-distance curves, and emissions indices.
An initial version of EDS has been assembled from existing NASA tools for estimating aircraft and engine performance, noise, and cost. These tools include the Numerical Propulsion System Simulation (NPSS), the Weight Analysis of Turbine Engines (WATE) program, the Flight
APMT Architecture Study 32
Optimization System Aircraft Performance and Sizing Code (FLOPS), the Noise Prediction Computer Code for Advanced Subsonic Propulsion Systems (ANOPP), and the Aircraft Life-Cycle Cost Analysis Code (ALCCA).
A comprehensive assessment of EDS is being undertaken as part of a five-year development program. The assessment is addressing modeling assumptions, modeling accuracy, and input assumptions, and is being conducted in close collaboration airframe and engine manufacturers. To facilitate this, an EDS Technical Advisory Board has been established comprised of experts from airframe and engine companies. Also, several collaborative assessment activities are being initiated to directly engage industry in the assessment of the accuracy and fidelity of EDS. In the first phase of these activities, EDS-derived environmental and performance estimates will be compared to those obtained by industry collaborators who will use proprietary analysis tools. The collaborative assessment will enable the accuracy of the EDS tools to be better understood and will also highlight components of EDS that should be improved.
2.3 Manufacturer Costs / Aircraft Prices Module
The Manufacturer Costs / Aircraft Prices module is intended to provide the price of all aircraft to be considered in the Aviation Operations Generator module and the Airline Operating Costs modules. For currently available, certificated aircraft types, databases of list prices with various discount assumptions will be used. However, when considering new technology aircraft, the ability to predict aircraft price is needed. The module must also consider impacts on manufacturer costs, as described in more detail below. Tools and databases relating to both new and existing aircraft as well as current practices are reviewed in more detail in Appendix B.
2.3.1 Aircraft Price Model
The Aircraft Price Model is a predictive tool for aircraft price and is the most important component in the Manufacturer Costs/Aircraft Prices module. The price of existing aircraft can be based on existing aircraft databases, whereas estimating the price of new aircraft (or aircraft with new technologies) requires a predictive model. A suitable model is one that determines the market value of the aircraft based on a relevant set of characteristics (e.g., aircraft range, payload capacity, speed, fuel efficiency, etc.). The relationship between price and aircraft characteristics can be established using simple regression models. This is the approach used commonly for commercial aircraft price models, and it should be noted that, in these regression models, the effects of competition do not affect the price. Competitive effects are assumed to impact only the demand for the aircraft, i.e. the percentage market share that it can achieve.
This market value-based approach is recommended for implementation in APMT. This approach has been used with success in the past. For example, in Lee, et al. [2001], models of aircraft price were determined via regression as a function of key aircraft variables such as fuel efficiency and number of seats. In Markish [2002], models of aircraft price were determined via regression as a function of aircraft range, payload capacity, and fuel efficiency. Such an approach is simple and transparent, and assumptions can be assessed via parametric studies.
2.3.2 Manufacturer Cost Estimation
The second element of the Manufacturer Costs/Aircraft Prices module is a methodology to quantify the manufacturing costs of new aircraft and new technologies. A two-pronged approach
APMT Architecture Study 33
is recommended for this element: the first focusing on market value-based price and manufacturer profit assumptions to provide cost impacts at the aircraft level, and the second a bottom-up method for estimating cost impacts directly for component level technology trades.
At the aircraft level, predictions of price (based on market value as described above) can be combined with different manufacturer profit scenarios to provide estimates of a ceiling on manufacturer costs. This method is simple and transparent, allows a number of different scenarios to be considered, and does not require a detailed cost estimation to be performed. It is important to note that a value-based estimate of a ceiling on manufacturer costs does not imply the technology can be delivered at this cost, only that this is the limit that the market for new airplanes and the manufacturers will bear (given realistic manufacturer profit assumptions). However, these cost impacts could then be compared with external estimates, where available, and possibly also with simple regression-based cost estimates. For example, in Markish [2002], regression was used to establish models of manufacturing cost and non-recurring costs, where costs were broken down by the aircraft component level, e.g., wing, fuselage, empennage, systems, etc. While regression is obviously limited to existing data, past studies have shown that the cost impacts of new technologies and new configurations can be incorporated in these simple models. For example, it has been shown that complexity factors and configuration factors can be applied at the component level to achieve cost estimates for a substantially different aircraft configuration (e.g., estimating the cost of a blended-wing-body aircraft based on tube-and-wing cost data). These simple cost modeling methodologies are very transparent and the fidelity of the models can be assessed by parametric sensitivity studies in which key parameters are varied.
The Aircraft Life Cycle Cost Analysis (ALCCA) code is an alternative manufacturer cost estimation tool that may be suitable to provide more detailed cost estimation for some technology assessments. It may also be useful for making comparisons to the costs derived from a market value-based pricing method as described above. The ALCCA program was originally developed by NASA Ames, and has been subsequently modified at Georgia Tech. ALCCA was originally developed by NASA as a means to estimate a priori the cost of developing, manufacturing, and operating a commercial aircraft from the bottom up. ALCCA utilizes a set of cost-estimating relationships based on historical data, but it also has an extensive input list allowing for manipulation of numerous internal assumptions. This has the benefit of giving the user a lot of modeling flexibility, but may reduce transparency unless properly documented and assessed. Thus, the following development steps are recommended prior to ALCCA inclusion in APMT:
• Additional documentation of the basis for the cost estimates
• Input of yearly or multiple inflation rates
• Further investigation of cost-price relationships
The recommended development approach is to start with the simple statistical models described above and to assess them via parametric studies. A higher fidelity cost estimation tool, such as ALCCA, to assess the cost impacts of technologies should also be considered. Research to determine which types of scenarios require higher levels of fidelity may also be required.
APMT Architecture Study 34
2.3.3 Development Needs for the Manufacturer Costs/Aircraft Prices Module
The tool development required for the Manufacturer Costs/Aircraft Prices module of APMT follow:
• Price databases for existing aircraft need to be obtained (e.g., the Airliner Price Guide or AISI’s Jet Price Guide)
• Price adjustments to reflect minor technology changes may be possible in the manner carried out by AERO-MS, as described in Appendix B.
• Price predictions for new aircraft will require development of a market value-based regression model
• Models are needed that couple price models with different profit scenarios for estimation of manufacturer cost impacts
• Regression models should be developed to estimate the manufacturer costs of new technologies, along with detailed parametric studies to determine the applicability of these models
• To provide additional fidelity for technology trades, a bottom-up cost estimation tool (ALCCA) should also be considered
• Research to determine the appropriate level of fidelity based on scenario types will also be required.
• EDS interface development, as described in Section 7 Interfaces.
2.4 Airline Operating Costs Module
The estimation of the impacts of noise and emission stringency options on airline operations and aircraft operating costs requires forecasts of future demand for air travel and future fleet composition (which is driven by air travel demand). Air travel demand and, in turn, fleet composition are determined both by global economic trends and, in the evaluation of alternative policy options, will also be affected by the nature and the costs of the policy options themselves.
The primary objective of the Airline Operating Costs module is the estimation of aircraft
operating costs and how they might change under different policy scenarios. However, we refer more broadly in this section to airline operating costs because APMT must have the capability to estimate cost impacts under alternative future airline network, fleet, and operating environments. As air travel demand, competitive conditions, and fuel prices change, for example, projected changes in fleet composition (e.g., aircraft sizes), network characteristics (e.g., hub-and-spoke vs. point-to-point flights), and airline operations (e.g., stage length and daily aircraft utilization) can change dramatically. These airline-related characteristics should be captured by APMT, in addition to the direct impacts on aircraft operating costs of new policies, regulations, and/or technologies.
In this section we review existing tools available for estimating the airline operating cost impacts of potential policy options. As we review these models and their calculation of direct operating cost effects, we will also discuss their ability to calculate these effects under different scenarios of forecast air travel demand and fleet composition. More detailed descriptions of these tools can be found in Appendix C.
APMT Architecture Study 35
Given the reliance of several previous ICAO-CAEP studies on the AERO-MS model for airline costs estimation, we focus on this model. Comparisons with the SCSM model and discussion of additional models of relevance to airline cost estimation are reviewed in Appendix C.
2.4.1 ICAO-CAEP Analyses of Airline Cost Impacts
As described in the APMT Requirements Document, CAEP has carried out extensive analyses of the impacts on airline costs of noise and emissions abatement policies. These analyses have been performed by the FESG. FESG has generally relied on ICAO forecasts of future fleet composition and air traffic, while the AERO-MS model has been used for estimating airline cost impacts of different noise and emissions stringency options.
The cost estimates made in the CAEP/6 study include most of the important impacts on airline operating costs of the different stringency options. As with the fleet forecasts and air travel demand projections, there is room for refinement of the cost estimates. This has a greater implication for future requirements of any similar modeling effort/tool, which should allow for sensitivity analysis of the principal cost assumptions. For example, the cost impacts may be significantly higher at today’s fuel prices of $1.50 per gallon or more. Landing fees also warrant more detailed analysis, including the growing trend toward use of noise and emissions environment-related charges by airport authorities.
The implications for APMT development are that the airline operations and cost module must be able to incorporate a wide range of parameters that define each future airline operations scenario. The capability to model different future trends in air travel demand, combined with various responses of the airlines in terms of aircraft size, utilization, and load factors (perhaps constrained by infrastructure capacity limits), will be important to ensure adequate flexibility.
2.4.2 Airline Operating Costs Module Development Needs
The APMT Requirements Document states that APMT has to record results for each identified use and affected party, including manufacturers, airlines, air navigation service providers, airports, military, general aviation, passengers and shippers, and the members of society who are adversely impacted by environmental effects. Furthermore, APMT must be capable of reproducing existing capabilities for cost analyses for the primary market (e.g., compliance costs for manufacturers and airlines) as employed within ICAO/CAEP. This has direct implications for the Airline Operating Costs module
The air travel demand forecasts and airline supply responses generated by the Aviation Operations Generator module of APMT provide input to both the Airline Operating Cost module and the AEDT Block. For the purposes of calculating airline operating costs, the detailed capabilities of AERO-MS, specifically the ACOS module, are closely suited to the requirements of APMT.
The Aviation Operating Cost Model (ACOS) of AERO-MS performs detailed calculations of airline operating costs under different scenarios. The airline operating cost framework used by ACOS is quite detailed and compatible with the cost categorization schemes in US DOT Form 41. AERO-MS combines these cost components into measures of variable operating cost per unit of capacity, and these measures can be reported by flight stage, aircraft type, aircraft function (e.g., passenger, freighter), and aircraft technology level. Airline operating cost results can also
APMT Architecture Study 36
be reported by spatial definitions of up to 14 world regions, consistent with IATA regional definitions.
The ACOS model generates airline operating cost estimates for different scenarios by incorporating policy measures that can result in changes to the inputs required to operate a flight stage, changes to capital costs of certain aircraft, reductions in availability of certain aircraft types, or modifications to the technical performance characteristics of aircraft. Of the primary modules proposed for APMT’s Partial Equilibrium Block shown in the schematic, the Airline Operating Costs module should be able to rely most directly on the AERO-MS ACOS modeling approach, with relatively little modification required. Therefore, APMT should incorporate the ACOS module for the cost impact calculations if possible. The airline operating cost model itself might be improved by integrating higher fidelity aircraft cost calculations into ACOS. This will benefit the analysis of technological impacts of policy choices on airline operating costs.
2.5 Fares Assumptions Module
The Fares Assumptions module is the bridge between changes in airline costs and demand. Changes in regulatory policy change costs to airlines; airlines then may change fares. Without the Fares Assumptions module, APMT can only produce a static analysis of the aviation markets and there is no partial equilibrium. This biases the impact on airlines, as they are likely to attempt some recovery of compliance costs through changes in fares, and ignores the impact on the traveling public, who will undertake fewer trips with higher fares. Just as importantly, the ultimate emissions inventories and noise exposure levels depend on the flights flown—if rising fares mean fewer flights, a particular policy may reduce pollution by more than estimated in a static analysis.
Analysis of the relationship between fares and costs is not a particularly well-developed branch in the field of aviation economics. In part this is due to the fact that the industry profile has changed rapidly over the years. It is also due to the fact that it is difficult to model the market for multiple interrelated products (flights) sold by firms who experience strategic interdependence.
There are several ways in which policy analysis tends to proceed when the impact on fares is potentially significant. One way to understand the impact of cost changes on the amount of air travel undertaken is to conduct a bounding analysis, which establishes outcomes for a range of scenarios governing cost pass-through to fares—for example, if the carrier attempts to pass 100% or 50% or 0% of a cost increase through into fares. This may be the most transparent kind of fare assumption that can be made for policy makers. The danger of this degree of transparency is its lack of guidance relative to the most likely scenario. Policy makers may or may not have reliable instincts over which scenarios are more likely and which are implausible.
The AERO-MS model has a more rigorous methodology for understanding how increased costs translate into increased fares . It uses a profit maximization framework constrained by existing per unit profit levels by flight stage. The constraint implies that carriers can do no better in per unit profits than they do for the baseline case, even given a cost increase (though stages experiencing losses could reduce losses by restricting capacity). It determines the corresponding amount to increase fares across all classes consistent with the different elasticities.
The Air Carrier Investment Model (ACIM) has two options for calculating a change in fares resulting from a change in costs. The first is to let the user specify yields and how yields are expected to change over time. The second is to fix a particular operating profit (the default is 3%,
APMT Architecture Study 37
though other levels can be specified), and then ACIM will adjust fares to produce the yields that create this return. ACIM, because it is designed for analysis of new technology, does not constrain profits to being no better than existing levels; if the user specifies constant or rising yields, and costs fall, profits would rise. One advantage ACIM has is that it differentiates amongst carriers when estimating costs (allowing the possibility for fare differentiation or profit differentiation).
Both approaches are similar in that they do not explicitly take into account competition, other than through assuming that competition keeps profits below a certain level. The presence of strong competition makes explicitly modeling a fare response (rather than assuming one) to an increase in costs difficult. Many carriers have been operating at considerable losses due to the nature of competition in the market currently. While it is not expected that the industry will be able to continue to experience such losses over a long period of time, modeling that assumes a particular level of profits may be distorted for the nearer (five year) time frame. This may make the constraints of the AERO-MS fare adjustment mechanism more desirable as a near term option for APMT.
The degree of resolution of carriers and the markets they serve will influence the design/selection of a fare capability for APMT. In reality, different carriers will experience different relationships between costs and fares, as well as different relationships between costs and fares across their own routes and market segments. For instance, a hub and spoke carrier may accept considerable losses on a feeder route and ignore increases in cost for those flights if the bank of flights the feeder connects to is sufficiently profitable. The existing methods for calculating fare adjustment to cost do not take into account this kind of network relationship, though they may have some bearing on the distribution of flights (and thus pollution) in response to policy. AERO-MS seems to allow for some differentiation amongst flight stages that may begin to provide control for these relationships or may be built upon to do so.
2.5.1 Fares Assumptions module development needs
The AERO-MS fares mechanism is a good starting point for fare adjustment for APMT, though it could certainly be improved upon during the intermediate-term with research into modeling fare determination. Because of its transparency, a bounding analysis capability (a “dial” on cost pass-through) to complement the AERO-MS fares mechanism or future fare model is probably advisable, though its use must be accompanied with appropriate caveats.
2.6 Future Air Transport Demand Module
When used in the fields of forecasting and economic analysis, the term demand generally can have two different meanings:
• The number of flights, passengers, or other units expected to be serviced by air carriers over a period of time
• The relationship between the number of consumers who fly and the fares they are charged
The first definition is typically applied in describing traffic forecasts and stems from the perspective of the forecasters—as the forecasters are often providers of air navigation services.
APMT Architecture Study 38
In APMT, the use of traffic forecasts (also known as demand forecasts) is considered under the heading of the Aviation Operations Generator module in Section 2.1.
The second definition—the traditional economic definition of demand—is what is described in this section. The Future Air Transport Demand module uses the relationships between fares and the amount of travel undertaken to adjust the forecasts in response to upward pressure on fares from policy compliance costs. The Future Air Transport Demand module is not active in creation of the baseline case, but requires information from the baseline case to carry out its role in the policy case.
The Future Air Transport Demand module is part of the Partial Equilibrium Block of APMT. Partial equilibrium refers to analysis of change in one market, here the market for air transport, without taking into consideration how changes in one market imply changes in other markets.11 In the context of APMT, this means capturing the new equilibrium in the market for air travel after a change in policy, and the impact of that change on the traveling public and air carriers. Environmental policies may raise air carrier costs (for example, a new stringency requires purchase and maintenance of new equipment) or lower air carrier costs (for example, relaxing a stringency, or allowing different operational procedures). This kind of industry-wide change in the structure of costs puts direct pressure on fares (up for a rise in costs, down for a decline). Fare changes are an output of the Airline Operating Costs module. The demand adjustment component of the Future Air Transport Demand module will need to take this fare change as an input, and then will output an adjusted level of passengers/flights/units to replace the original forecast.
The most straightforward way to accomplish the demand adjustment is using fare elasticities defined by market characteristics, including business vs. leisure, short haul vs. long haul, international travel vs. domestic travel, and regional variations. In general, the term elasticity means the proportional change in one factor, given a proportional change in another factor. Fare elasticity describes the proportional change in the quantity of air transport demanded, given a proportional change in fare. Fare elasticities are negative, reflecting an inverse relationship between fare and the amount of travel undertaken while holding the other factors that influence the demand for air travel constant.
If the proportional change in fares is taken from the Fares Assumptions module, elasticities can be applied with varying degrees of resolution according to geographical region, class, and market characteristics to determine the impact on the market (see, for example Gillen et al. [2003] and Hancox and Lowe [2000]).
Once the change in fares is known and the change in the amount of travel undertaken is known, the change in consumer surplus can be determined. A graphical illustration of consumer surplus is given in Figure 4. Consumer surplus is a measure of the overall value to consumers associated with a given combination of fares and amount of travel. Along a demand curve, consumer surplus is defined as the amount over the market price that consumers would have paid for each unit of the good. The amount the market was willing to pay for each unit of output reflects what it was worth to them.
11 The kind of analysis that does take the relationships amongst all markets under consideration is known as general equilibrium analysis. General equilibrium analysis would explicitly control for relationships and feedback amongst industries that are related as suppliers and consumers of intermediate goods. See Section 5, General Economy
Block.
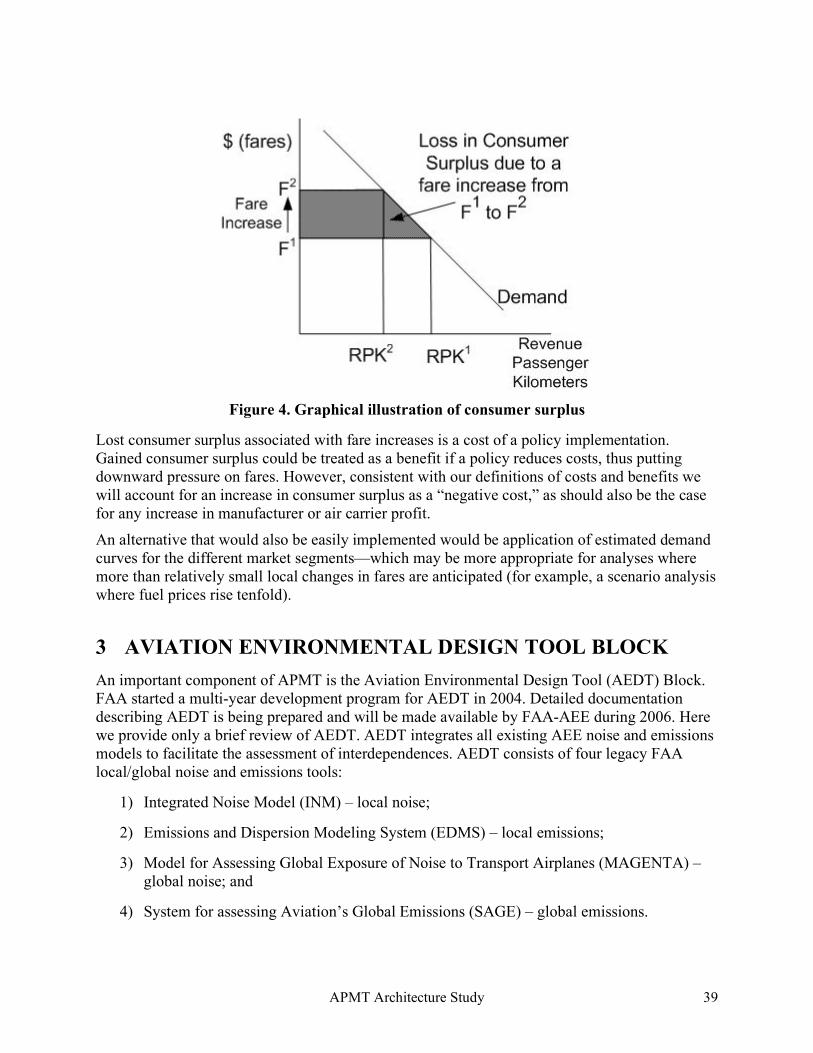
APMT Architecture Study 39
Figure 4. Graphical illustration of consumer surplus
Lost consumer surplus associated with fare increases is a cost of a policy implementation. Gained consumer surplus could be treated as a benefit if a policy reduces costs, thus putting downward pressure on fares. However, consistent with our definitions of costs and benefits we will account for an increase in consumer surplus as a “negative cost,” as should also be the case for any increase in manufacturer or air carrier profit.
An alternative that would also be easily implemented would be application of estimated demand curves for the different market segments—which may be more appropriate for analyses where more than relatively small local changes in fares are anticipated (for example, a scenario analysis where fuel prices rise tenfold).
3 AVIATION ENVIRONMENTAL DESIGN TOOL BLOCK
An important component of APMT is the Aviation Environmental Design Tool (AEDT) Block. FAA started a multi-year development program for AEDT in 2004. Detailed documentation describing AEDT is being prepared and will be made available by FAA-AEE during 2006. Here we provide only a brief review of AEDT. AEDT integrates all existing AEE noise and emissions models to facilitate the assessment of interdependences. AEDT consists of four legacy FAA local/global noise and emissions tools:
1) Integrated Noise Model (INM) – local noise;
2) Emissions and Dispersion Modeling System (EDMS) – local emissions;
3) Model for Assessing Global Exposure of Noise to Transport Airplanes (MAGENTA) – global noise; and
4) System for assessing Aviation’s Global Emissions (SAGE) – global emissions.
APMT Architecture Study 40
INM, the model required for use on federally funded aircraft noise projects, is used primarily to model aircraft noise exposure near airports. Based on the Society of Automotive Engineers SAE-AIR-1845 guidance document titled "Procedure for the Calculation of Airplane Noise in the Vicinity of Airports," INM has been available to the public and continuously developed since 1978. The INM is generally used to estimate population noise exposure based on the day-night average sound level (DNL).
EDMS is used to perform air quality analyses near airports. Listed as an Environmental Protection Agency (EPA) “Preferred Guideline” model since 1993, EDMS was designated by the FAA as a “Required Model” for aviation air quality analyses in 1998. EDMS predicts emissions in the vicinity of airports and is also capable of evaluating dispersion of those emissions.
MAGENTA has been approved and used for ICAO CAEP global noise exposure analyses since 1998. Based on the INM’s core noise prediction module, MAGENTA calculates the aggregate global noise exposure due to aircraft operations.
SAGE calculates annual global aircraft-related emissions inventories. SAGE has also been used to analyze the sensitivity of those inventories to changes in operational, policy, and technology-related scenarios. SAGE is a high fidelity computer model used to predict aircraft fuel burn and emissions for all commercial (civil) flights globally in a given year. The model is capable of analyzing scenarios from a single flight to airport, country, regional, and global levels. SAGE is able to dynamically model aircraft performance, fuel burn and emissions, and capacity and delay at airports, as well as forecasts of future scenarios. Although the results from SAGE have been made available to the international aviation community, SAGE is currently an FAA government research tool and has not been released to the general public.
Given the significant amount of legacy code to be combined in the development of AEDT, the integration of the legacy models is being undertaken in a stepwise, prototype-driven process. The prototype analyses are currently envisioned to include: (1) NOx stringency; (2) greenhouse gases; (3) noise trends; (4) continuous descent approaches; and (5) CNS/ATM. The prototype process allows for a gradual conversion to AEDT-specific coding standards in concert with continued and seamless support of legacy users. In particular, database and module harmonization will take place throughout the prototype process, as FAA-specified analyses will be undertaken in support of CAEP.
4 BENEFITS VALUATION BLOCK
An important element of APMT functionality is the construction of a damage function to estimate changes in social welfare resulting from technological or operational modifications to the air transport system; these modifications are intended to reduce environmental impacts on people and their resource systems. The integral of the damage function, over some interval of environmental quality, is equal to the environmental opportunity costs associated with noise and emissions. Benefit-cost analysis (BCA) entails weighing environmental quality improvements against the costs of achieving such changes.
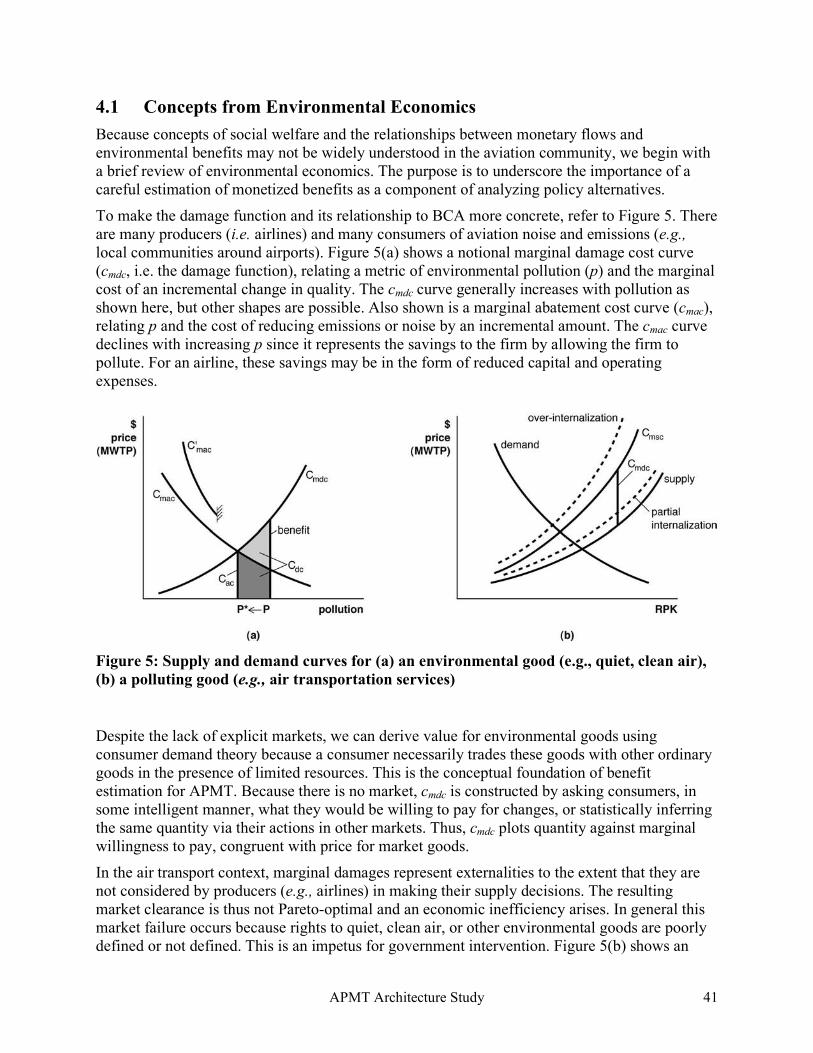
APMT Architecture Study 41
4.1 Concepts from Environmental Economics
Because concepts of social welfare and the relationships between monetary flows and environmental benefits may not be widely understood in the aviation community, we begin with a brief review of environmental economics. The purpose is to underscore the importance of a careful estimation of monetized benefits as a component of analyzing policy alternatives.
To make the damage function and its relationship to BCA more concrete, refer to Figure 5. There are many producers (i.e. airlines) and many consumers of aviation noise and emissions (e.g., local communities around airports). Figure 5(a) shows a notional marginal damage cost curve (cmdc, i.e. the damage function), relating a metric of environmental pollution (p) and the marginal cost of an incremental change in quality. The cmdc curve generally increases with pollution as shown here, but other shapes are possible. Also shown is a marginal abatement cost curve (cmac), relating p and the cost of reducing emissions or noise by an incremental amount. The cmac curve declines with increasing p since it represents the savings to the firm by allowing the firm to pollute. For an airline, these savings may be in the form of reduced capital and operating expenses.
Figure 5: Supply and demand curves for (a) an environmental good (e.g., quiet, clean air),
(b) a polluting good (e.g., air transportation services)
Despite the lack of explicit markets, we can derive value for environmental goods using consumer demand theory because a consumer necessarily trades these goods with other ordinary goods in the presence of limited resources. This is the conceptual foundation of benefit estimation for APMT. Because there is no market, cmdc is constructed by asking consumers, in some intelligent manner, what they would be willing to pay for changes, or statistically inferring the same quantity via their actions in other markets. Thus, cmdc plots quantity against marginal willingness to pay, congruent with price for market goods.
In the air transport context, marginal damages represent externalities to the extent that they are not considered by producers (e.g., airlines) in making their supply decisions. The resulting market clearance is thus not Pareto-optimal and an economic inefficiency arises. In general this market failure occurs because rights to quiet, clean air, or other environmental goods are poorly defined or not defined. This is an impetus for government intervention. Figure 5(b) shows an
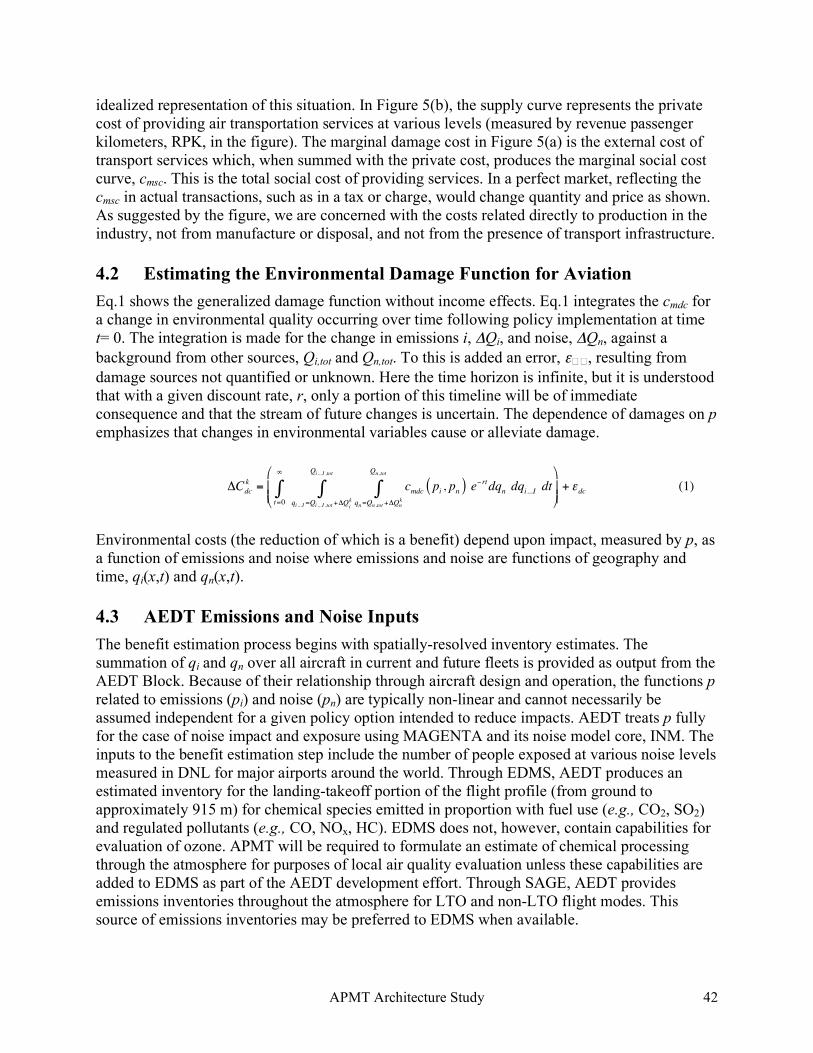
APMT Architecture Study 42
idealized representation of this situation. In Figure 5(b), the supply curve represents the private cost of providing air transportation services at various levels (measured by revenue passenger kilometers, RPK, in the figure). The marginal damage cost in Figure 5(a) is the external cost of transport services which, when summed with the private cost, produces the marginal social cost curve, cmsc. This is the total social cost of providing services. In a perfect market, reflecting the cmsc in actual transactions, such as in a tax or charge, would change quantity and price as shown. As suggested by the figure, we are concerned with the costs related directly to production in the industry, not from manufacture or disposal, and not from the presence of transport infrastructure.
4.2 Estimating the Environmental Damage Function for Aviation
Eq.1 shows the generalized damage function without income effects. Eq.1 integrates the cmdc for a change in environmental quality occurring over time following policy implementation at time t= 0. The integration is made for the change in emissions i, !Qi, and noise, !Qn, against a
background from other sources, Qi,tot and Qn,tot. To this is added an error, "� � , resulting from
damage sources not quantified or unknown. Here the time horizon is infinite, but it is understood that with a given discount rate, r, only a portion of this timeline will be of immediate consequence and that the stream of future changes is uncertain. The dependence of damages on p emphasizes that changes in environmental variables cause or alleviate damage.
!Cdc
k = cmdc pi , pn( ) e"rtdqn dqi...I dt
qn=Qn ,tot +!Qnk
Qn ,tot
#qi ...I =Qi ...I ,tot +!Qi
k
Qi ...I ,tot
#t=0
$
#%
&''
(
)**+ +dc (1)
Environmental costs (the reduction of which is a benefit) depend upon impact, measured by p, as a function of emissions and noise where emissions and noise are functions of geography and time, qi(x,t) and qn(x,t).
4.3 AEDT Emissions and Noise Inputs
The benefit estimation process begins with spatially-resolved inventory estimates. The summation of qi and qn over all aircraft in current and future fleets is provided as output from the AEDT Block. Because of their relationship through aircraft design and operation, the functions p
related to emissions (pi) and noise (pn) are typically non-linear and cannot necessarily be assumed independent for a given policy option intended to reduce impacts. AEDT treats p fully for the case of noise impact and exposure using MAGENTA and its noise model core, INM. The inputs to the benefit estimation step include the number of people exposed at various noise levels measured in DNL for major airports around the world. Through EDMS, AEDT produces an estimated inventory for the landing-takeoff portion of the flight profile (from ground to approximately 915 m) for chemical species emitted in proportion with fuel use (e.g., CO2, SO2) and regulated pollutants (e.g., CO, NOx, HC). EDMS does not, however, contain capabilities for evaluation of ozone. APMT will be required to formulate an estimate of chemical processing through the atmosphere for purposes of local air quality evaluation unless these capabilities are added to EDMS as part of the AEDT development effort. Through SAGE, AEDT provides emissions inventories throughout the atmosphere for LTO and non-LTO flight modes. This source of emissions inventories may be preferred to EDMS when available.
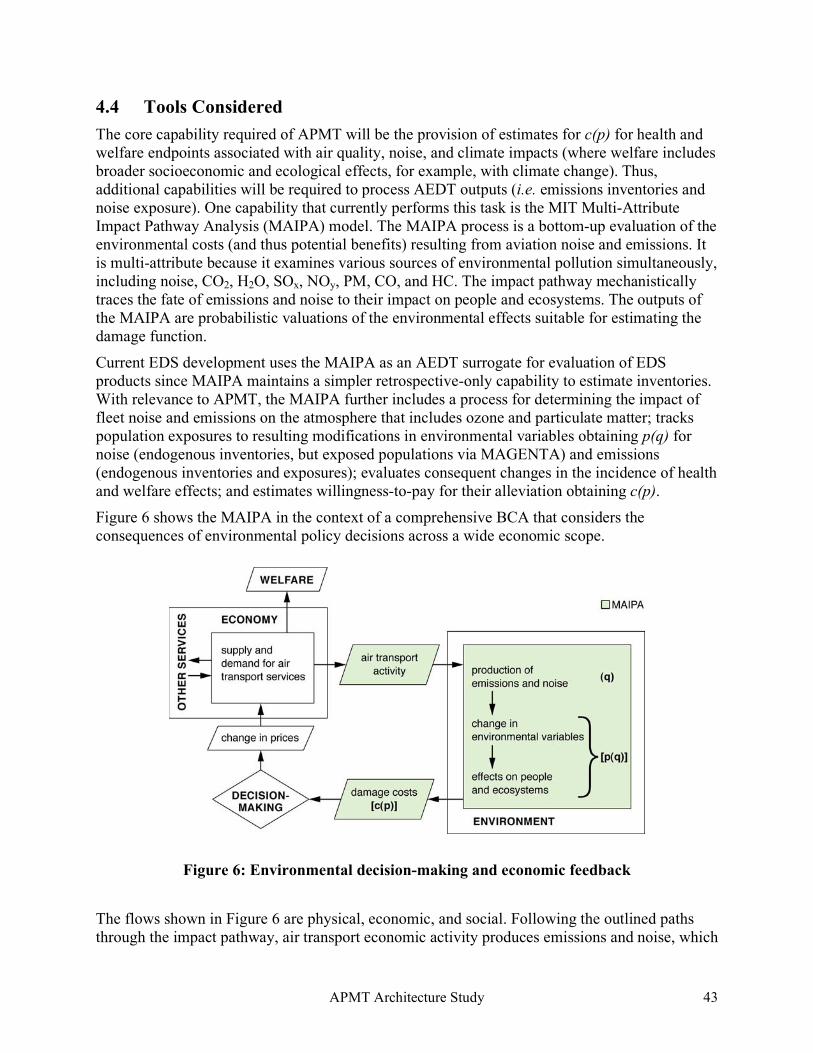
APMT Architecture Study 43
4.4 Tools Considered
The core capability required of APMT will be the provision of estimates for c(p) for health and welfare endpoints associated with air quality, noise, and climate impacts (where welfare includes broader socioeconomic and ecological effects, for example, with climate change). Thus, additional capabilities will be required to process AEDT outputs (i.e. emissions inventories and noise exposure). One capability that currently performs this task is the MIT Multi-Attribute Impact Pathway Analysis (MAIPA) model. The MAIPA process is a bottom-up evaluation of the environmental costs (and thus potential benefits) resulting from aviation noise and emissions. It is multi-attribute because it examines various sources of environmental pollution simultaneously, including noise, CO2, H2O, SOx, NOy, PM, CO, and HC. The impact pathway mechanistically traces the fate of emissions and noise to their impact on people and ecosystems. The outputs of the MAIPA are probabilistic valuations of the environmental effects suitable for estimating the damage function.
Current EDS development uses the MAIPA as an AEDT surrogate for evaluation of EDS products since MAIPA maintains a simpler retrospective-only capability to estimate inventories. With relevance to APMT, the MAIPA further includes a process for determining the impact of fleet noise and emissions on the atmosphere that includes ozone and particulate matter; tracks population exposures to resulting modifications in environmental variables obtaining p(q) for noise (endogenous inventories, but exposed populations via MAGENTA) and emissions (endogenous inventories and exposures); evaluates consequent changes in the incidence of health and welfare effects; and estimates willingness-to-pay for their alleviation obtaining c(p).
Figure 6 shows the MAIPA in the context of a comprehensive BCA that considers the consequences of environmental policy decisions across a wide economic scope.
Figure 6: Environmental decision-making and economic feedback
The flows shown in Figure 6 are physical, economic, and social. Following the outlined paths through the impact pathway, air transport economic activity produces emissions and noise, which
APMT Architecture Study 44
affect the economic well-being of people and ecosystems through health and other impacts that can be expressed economically as damage costs. Policy-makers, manufacturers, airlines, and citizens may take various actions in response to these costs (options k in Eq.1). These decisions affect the economy either directly within the primary markets associated with air transportation (e.g., changing ticket prices), or indirectly through other avenues in the economy to impact supply and demand for mobility by air (e.g., changing household production12 so that less income is available for leisure).
MAIPA uses a simplified U.S. county-level model of chemistry to estimate changes in p(q) in application to air quality. Higher fidelity model alternatives exist that could be adapted to this process in the longer-term. For example, EDMS maintains a dispersion capability that can be used to estimate the spatial distribution of chemical emissions around an airport. This facility could be improved to include chemistry, or this dispersion field could be used as input to one of the established EPA air quality models. The fundamental difficulty in carrying out such a task is that none of these models can handle emissions from an aircraft that is not on the ground. Thus, some measure of development work would be required if such a facility were desired, and it is recommended that this work be included in longer term AEDT and APMT development plans. In contrast, climate models exist that have been used to estimate the change in environmental variables (such as surface temperature) associated with aircraft emissions. However, the overhead of such a complicated model of the coupled ocean and atmosphere (an atmosphere-ocean general circulation model or AOGCM) would likely be out of scope for application to early versions of APMT. Instead, a simplified response model is desired, which relates emissions to temperature (or other climate variable) perturbations via a simple transfer function. Derived from the more complicated AOGCM, few of these simplified models, exist. MAIPA has developed a facility to apply transfer functions for each of the primary chemical and microphysical impacts from aviation in order to estimate changes in surface temperature or other climate variables.
Perhaps the most uncertain element of the benefits estimation process is the placement of valuations on health and welfare endpoints to obtain c(p). Empirically-based valuation methods have been and continue to be developed and employed by other industries (e.g., automotive, power generation) and agencies (e.g., EPA and the U.S. National Park Service) in the conduct of policy analysis, and they offer techniques applicable to APMT. Valuation of noise impacts continues to be dominated by hedonic techniques (one class of revealed preference methods) that estimate willingness to pay for noise reduction through the statistical comparison of impacted and non-impacted housing. These studies are typically performed in a specific city and there has been a question of whether these studies could be applied more widely given the particular characteristics of the local situation. Some meta-studies have been published recently that
12 Household production is the production of goods and services by the members of a household, for their own consumption, using their own capital and their own unpaid labor. Goods and services produced by households for their own use include accommodation, meals, clean clothes, and child care. The process of household production involves the transformation of purchased intermediate commodities (for example, supermarket groceries and power-utility electricity) into final consumption commodities (meals and clean clothes). Households use their own capital (kitchen equipment, tables and chairs, kitchen and dining room space) and their own labor (hours spent in shopping, cooking, laundry and ironing). [D. Ironmonger, International Encyclopedia of the Social & Behavioral Sciences, Elsevier Science (2001)].
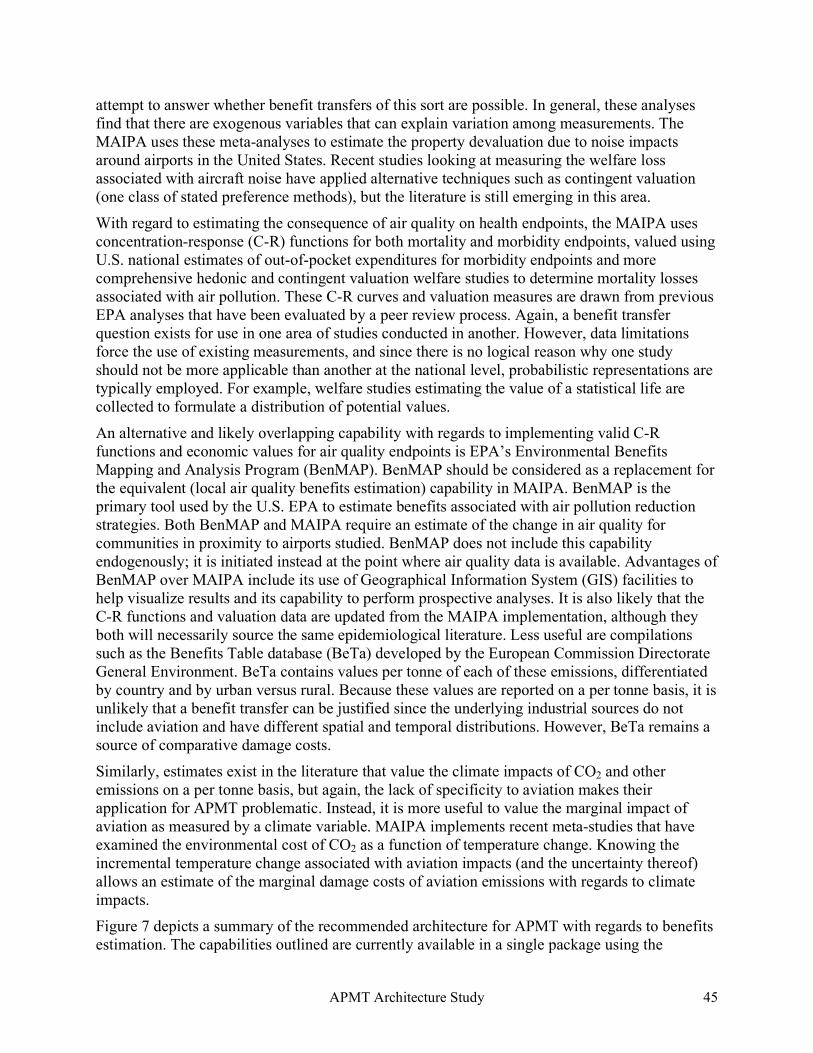
APMT Architecture Study 45
attempt to answer whether benefit transfers of this sort are possible. In general, these analyses find that there are exogenous variables that can explain variation among measurements. The MAIPA uses these meta-analyses to estimate the property devaluation due to noise impacts around airports in the United States. Recent studies looking at measuring the welfare loss associated with aircraft noise have applied alternative techniques such as contingent valuation (one class of stated preference methods), but the literature is still emerging in this area.
With regard to estimating the consequence of air quality on health endpoints, the MAIPA uses concentration-response (C-R) functions for both mortality and morbidity endpoints, valued using U.S. national estimates of out-of-pocket expenditures for morbidity endpoints and more comprehensive hedonic and contingent valuation welfare studies to determine mortality losses associated with air pollution. These C-R curves and valuation measures are drawn from previous EPA analyses that have been evaluated by a peer review process. Again, a benefit transfer question exists for use in one area of studies conducted in another. However, data limitations force the use of existing measurements, and since there is no logical reason why one study should not be more applicable than another at the national level, probabilistic representations are typically employed. For example, welfare studies estimating the value of a statistical life are collected to formulate a distribution of potential values.
An alternative and likely overlapping capability with regards to implementing valid C-R functions and economic values for air quality endpoints is EPA’s Environmental Benefits Mapping and Analysis Program (BenMAP). BenMAP should be considered as a replacement for the equivalent (local air quality benefits estimation) capability in MAIPA. BenMAP is the primary tool used by the U.S. EPA to estimate benefits associated with air pollution reduction strategies. Both BenMAP and MAIPA require an estimate of the change in air quality for communities in proximity to airports studied. BenMAP does not include this capability endogenously; it is initiated instead at the point where air quality data is available. Advantages of BenMAP over MAIPA include its use of Geographical Information System (GIS) facilities to help visualize results and its capability to perform prospective analyses. It is also likely that the C-R functions and valuation data are updated from the MAIPA implementation, although they both will necessarily source the same epidemiological literature. Less useful are compilations such as the Benefits Table database (BeTa) developed by the European Commission Directorate General Environment. BeTa contains values per tonne of each of these emissions, differentiated by country and by urban versus rural. Because these values are reported on a per tonne basis, it is unlikely that a benefit transfer can be justified since the underlying industrial sources do not include aviation and have different spatial and temporal distributions. However, BeTa remains a source of comparative damage costs.
Similarly, estimates exist in the literature that value the climate impacts of CO2 and other emissions on a per tonne basis, but again, the lack of specificity to aviation makes their application for APMT problematic. Instead, it is more useful to value the marginal impact of aviation as measured by a climate variable. MAIPA implements recent meta-studies that have examined the environmental cost of CO2 as a function of temperature change. Knowing the incremental temperature change associated with aviation impacts (and the uncertainty thereof) allows an estimate of the marginal damage costs of aviation emissions with regards to climate impacts.
Figure 7 depicts a summary of the recommended architecture for APMT with regards to benefits estimation. The capabilities outlined are currently available in a single package using the
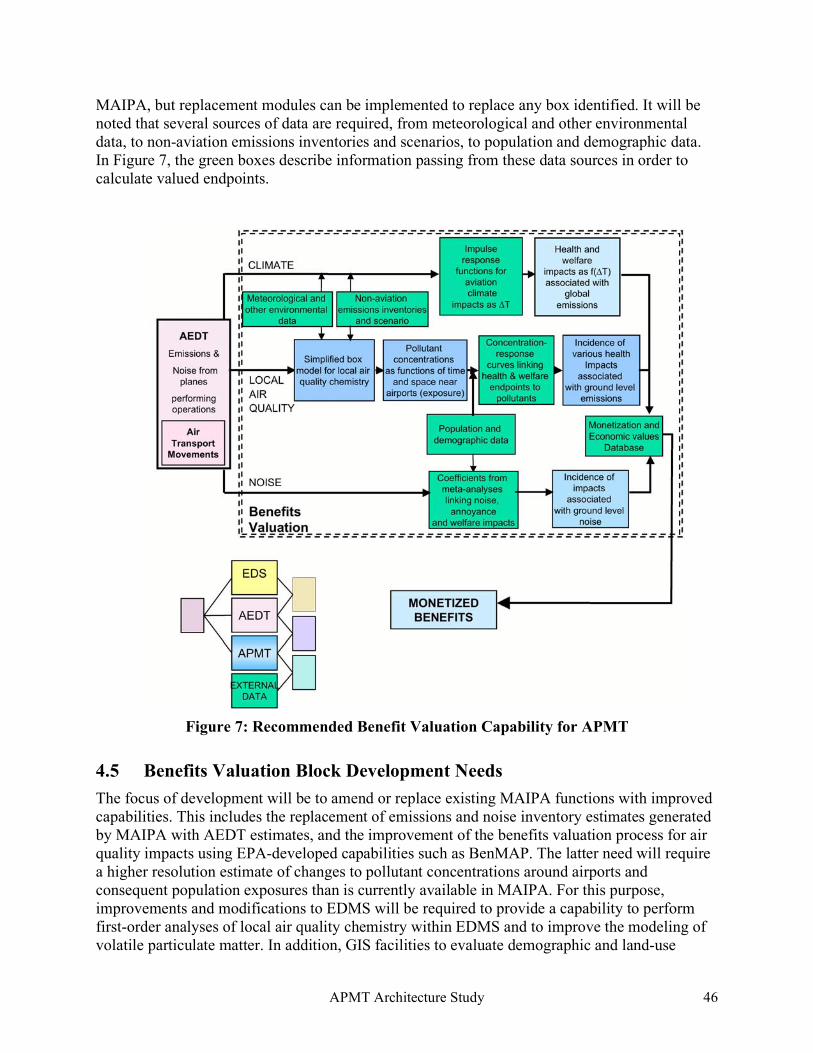
APMT Architecture Study 46
MAIPA, but replacement modules can be implemented to replace any box identified. It will be noted that several sources of data are required, from meteorological and other environmental data, to non-aviation emissions inventories and scenarios, to population and demographic data. In Figure 7, the green boxes describe information passing from these data sources in order to calculate valued endpoints.
Figure 7: Recommended Benefit Valuation Capability for APMT
4.5 Benefits Valuation Block Development Needs
The focus of development will be to amend or replace existing MAIPA functions with improved capabilities. This includes the replacement of emissions and noise inventory estimates generated by MAIPA with AEDT estimates, and the improvement of the benefits valuation process for air quality impacts using EPA-developed capabilities such as BenMAP. The latter need will require a higher resolution estimate of changes to pollutant concentrations around airports and consequent population exposures than is currently available in MAIPA. For this purpose, improvements and modifications to EDMS will be required to provide a capability to perform first-order analyses of local air quality chemistry within EDMS and to improve the modeling of volatile particulate matter. In addition, GIS facilities to evaluate demographic and land-use
APMT Architecture Study 47
patterns will be developed and these will have to be coordinated with related activities within AEDT.
5 GENERAL ECONOMY BLOCK
The world and regional economies have strong connections to the aviation industry. Some firms supply inputs to manufacturers and carriers (catering, sheet metal, etc.), some businesses use air transport services as inputs (business trips), while others rely on air carriers to deliver their customers to their locations (tourism and recreation). When costs in the aviation industry change, changing outputs and prices, there may be impacts to the general economy beyond those measured in the Airline Operating Costs and Manufacturer Costs modules.
While the state of the art in measuring these impacts is to explicitly model connections between different parts of the economy using a Computable General Equilibrium model (CGE), this is difficult to reconcile with taking exogenous traffic forecasts as input and difficult to implement with a degree of resolution that captures air carriers and aircraft and engine manufacturers. This is seen as a longer-term area of development for APMT.
In the near term, however, a family of statistically-based analyses relying on observed relationships between inputs and outputs of different detailed pieces of the economy exist that could be used to describe some of these impacts. Known as “multiplier effects,” these are not recommended by the United States Office of Management and Budget [OMB, 2004], but are widely used in local environmental economic assessments within the U.S.
Once outputs of the Partial Equilibrium Block are calculated, multiplier parameters that may vary locally or regionally can be applied to capture the impact of changes in the aviation sector (manufacturers and carriers) on the rest of the economy. Because of their wide use in different kinds of economic analysis (in fields other than environmental policy including tax policy, trade policy, and so on), estimates of these multipliers exist for most countries, and in significant detail within many countries.
Some software tools exist for the application of these, such as the U.S. Department of Commerce’s RIMS (Regional Input-Output Modeling System). However, given the parametric nature of this kind of analysis, adopting a particular tool is unlikely to be an advantage—rather the focus in development should be on collecting multiplier parameters from such tools and from the literature to populate a matrix that can be applied to the Partial Equilibrium Block output.
Another possible avenue for development of the capability for assessing impacts on the general economy of aviation environmental policy would be to work with a commercial economic impact package such as REMI (Regional Economic Modeling, Inc.). REMI uses an approach that is between the CGE and statistical multiplier approaches. It has been applied to different kinds of economic analysis, including that of environmental policy, in the United States and Europe.
5.1 General Economy Block Development Needs
Near-term development needs for the General Economy Block include a matrix of multipliers as described above that reflect the relationship between the aviation industry and the other parts of the economy. In the longer term, development needs may include a complete Computable General Equilibrium framework.
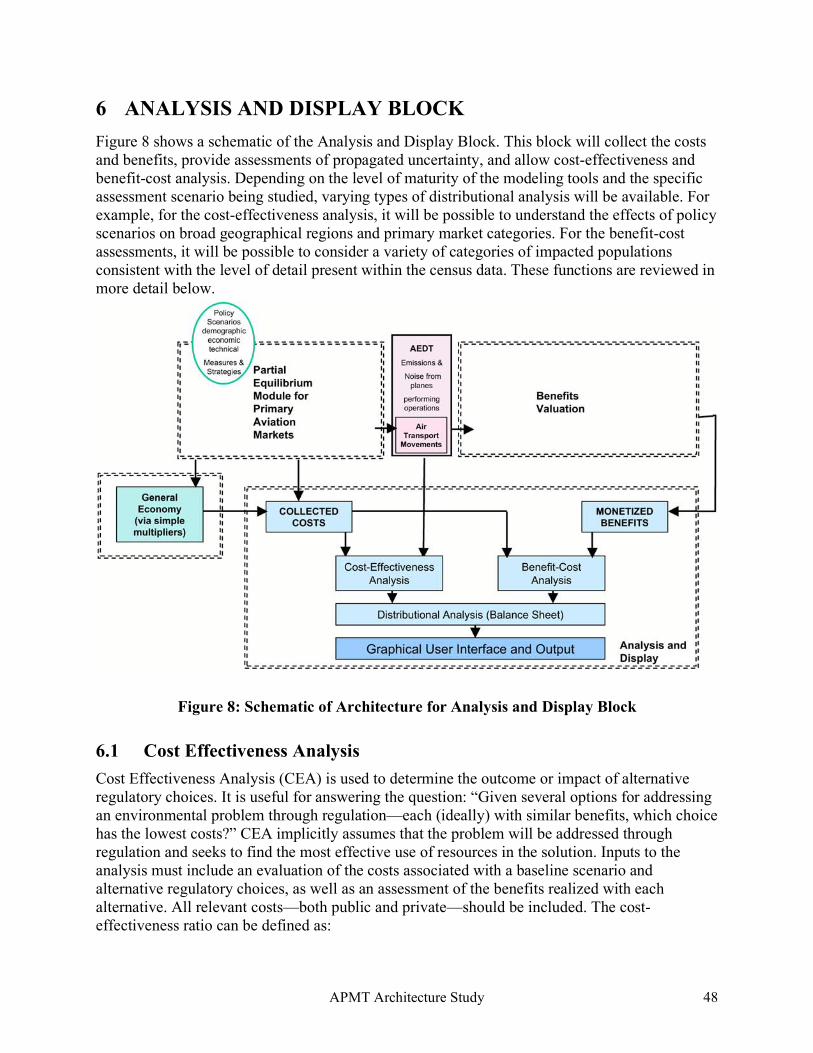
APMT Architecture Study 48
6 ANALYSIS AND DISPLAY BLOCK
Figure 8 shows a schematic of the Analysis and Display Block. This block will collect the costs and benefits, provide assessments of propagated uncertainty, and allow cost-effectiveness and benefit-cost analysis. Depending on the level of maturity of the modeling tools and the specific assessment scenario being studied, varying types of distributional analysis will be available. For example, for the cost-effectiveness analysis, it will be possible to understand the effects of policy scenarios on broad geographical regions and primary market categories. For the benefit-cost assessments, it will be possible to consider a variety of categories of impacted populations consistent with the level of detail present within the census data. These functions are reviewed in more detail below.
Figure 8: Schematic of Architecture for Analysis and Display Block
6.1 Cost Effectiveness Analysis
Cost Effectiveness Analysis (CEA) is used to determine the outcome or impact of alternative regulatory choices. It is useful for answering the question: “Given several options for addressing an environmental problem through regulation—each (ideally) with similar benefits, which choice has the lowest costs?” CEA implicitly assumes that the problem will be addressed through regulation and seeks to find the most effective use of resources in the solution. Inputs to the analysis must include an evaluation of the costs associated with a baseline scenario and alternative regulatory choices, as well as an assessment of the benefits realized with each alternative. All relevant costs—both public and private—should be included. The cost-effectiveness ratio can be defined as:
APMT Architecture Study 49
Net Costs / Measured Effectiveness
where net costs is equal to gross compliance costs minus any cost savings, and effectiveness is measured in terms of final outcomes, such as lives saved.
For APMT, the evaluation of cost effectiveness through partial equilibrium modeling requires costs associated with the proposed regulation in terms of aircraft manufacturers, airline operators, and consumers as inputs.13
The CEA module should be constructed to accept ranges of cost values or cost values distributed along some probability curve. It is unlikely that cost estimates will be accurate enough to use a single cost value as input; using a range or distribution of values enables the analyst to accommodate different assumptions about cost estimates.
From the AEDT Block, CEA requires inputs in terms of the impacts on emissions and noise from the proposed regulation. Reduced emissions (e.g., kg NOx reduced, as calculated by AEDT) are measures of intermediate outputs from regulatory policy. Ideally, the CEA will measure net costs against final outcomes, such as lives saved. With addition of the Benefit Valuation Block, APMT Version 2 will translate intermediate outputs into final outcomes for more complete analysis.14
Beyond these model-supplied inputs, CEA will require user-specified rates for discounting future costs of compliance where this is desired as part of the policy analysis. In addition, any cost savings not incorporated into compliance costs (such as manufacturing efficiency derived from reducing multiple lines of production into a single, mandated engine type) need to be supplied by the user in order to calculate the net cost of compliance.
In any type of economic analysis, the measurement of costs should be approached with care. In the market economy, some or all of the costs of production are normally passed on to users and consumers. This cost “pass through” is a function of supply and demand. In the case of the aviation industry, airframe and engine manufacturers will attempt to pass increased production costs on to operators, who, in turn, will make decisions about fares and revenues that depend on market demand and passenger sensitivity to fare prices. It is important to isolate the incremental costs associated with each actor in the supply chain and the ultimate change in consumer surplus in order to avoid double-counting of compliance costs. One way to approach this issue is to examine changes in profit that accrue to manufacturers and operators as a result of new regulations instead of changes in cost inputs alone.
6.2 Benefit-Cost Analysis
Benefit-cost analysis (BCA) requires examination of a broader range of benefits and costs associated with a proposed regulation (regardless of the party to whom they accrue). OMB states that the primary indicator of relative efficiency of a regulation is the net present value (NPV); both OMB and FAA require NPV analysis to inform decision-making. Benefit-cost ratios (BCR) and internal rates of return (IRR) are not meaningful indicators of net benefits and should not be
13 In a general equilibrium model, the effects of other costs to society such as decreased travel or tourism would be included through the use of multipliers. Future versions of APMT may incorporate general equilibrium effects. 14 The Office of Management and Budget (OMB) does not require any specific measure of effectiveness in the analysis of regulatory impacts, but in Circular A-4 it does specify a preference for final outcomes over intermediate outputs.
APMT Architecture Study 50
used as the sole criteria for decisions, although OMB permits reporting IRR as a supplement to NPV[OMB, 2004]. The BCA module, therefore, should output an NPV or a range of probable NPVs for the analyst to use in making policy choices. Any value over zero suggests the policy should be undertaken; among different regulatory policy alternatives, all else being equal, the largest value indicates the most-preferred alternative.
Figure 8 shows that the BCA uses the same costs from the Partial Equilibrium Block as used by CEA. Like the CEA module, this module should be constructed to accept ranges of cost values or cost values distributed along some probability curve. Any cost savings associated with the implementation of the proposed regulation should be included as well, in order to compute the net cost of the regulatory policy. Some of those costs savings may need to be input directly from the user if they are not captured in the modules within the Partial Equilibrium Block.
Inputs from the AEDT Block into the BCA module must be monetized. Unlike the CEA, when the effectiveness of the regulation can be measured in some intermediate output such as “emissions reduced” or final outcome such as “lives saved,” to calculate a valid NPV both cost and benefits must be expressed in the same units. Beginning with APMT Version 2, the Benefits Estimation Block will take inputs from AEDT and estimate dollar values for the environmental improvements realized from the regulation under analysis.15 It is likely that the benefits estimation will be expressed as a range or distribution of values—the BCA module should accept benefits estimates in this format.
Like the CEA, additional inputs required for conducting an NPV analysis include the discount rate at which future benefits and costs will be discounted to present-day values. It is important to restrict the analysis to the same time period when comparing alternative policy actions to each other and to the baseline scenario. The baseline scenario itself should be computed by the APMT in the same way that any alternative would be computed in order to construct a valid comparison among different policy choices. Finally, the same recommendations expressed in the cost-effectiveness section to avoid double-counting, apply to the BCA, both for costs and for benefits.
6.3 Distributional Analysis
In order to complete the economic analysis of proposed environmental regulations, the distribution of any costs and benefits associated with the policy under analysis should be expressed. Distribution of costs and benefits can be examined in many ways, including:
• By economic actor (both representative and specific: e.g., “manufacturer” or General Electric Aircraft Engines, “airline” or Southwest Airlines, “passenger” or New York to Boston business traveler)
• By region or locality (e.g., airport operating area, city limits, country, along city-pair route corridor)
• By demographic or census groups (e.g., income, age, or race cohort)
Output from the Future Air Transport Demand, the Airline Operating Costs and the Manufacturer Costs/Aircraft Prices modules within the Partial Equilibrium Block of APMT will be aggregated for both CEA and BCA. Assuming the aggregation step occurs within the CEA
15 Given the disparity among different sources for benefits valuation, the BCA analysis will require either ranges of values for benefits or some probability distribution to describe the likelihood of benefit values.
APMT Architecture Study 51
and BCA modules themselves, the distributional analysis will need to capture the costs prior to that step. This process can occur through an interface to the Future Air Transport Demand, the Airline Operating Costs and Manufacturer Costs/Aircraft Prices modules directly or through an intermediate output of the CEA and BCA modules. The Benefits Valuation Block census data to determine local and global air quality effects; capturing Benefits Valuation Block output at the point where benefits are assigned and monetized will enable the analysis of distributional effects along census/demographic lines.
The results of the cost-effectiveness and benefit-cost analyses must be presented in a way that enables the policy maker to judge the impacts and outcomes of alternative regulatory actions. At the Transportation Research Board (TRB) workshop held in February, 2005, the participants endorsed the idea of using “balance sheets” to organize the results of the regulatory analysis [TRB, 2005]. A corporate balance sheet typically shows both the assets and liabilities accrued to an organization at a particular point in time. In the same sense, a regulatory policy balance sheet should show the projected costs and benefits of a particular alternative at a specific point in the future as they accrue to a stakeholder. The analysis of a single alternative could generate several balance sheets as its distributional impact is measured across different actors. Alternatively, all costs and benefits could be grouped to present a single, aggregated balance sheet for a particular policy.
6.4 Analysis and Display Block Development Needs
The Analysis and Display Block will have to be fully created as part of the APMT development program. However, it is recommended that this work be closely coordinated with, build upon, and leverage similar activities within the AEDT development effort.
7 INTERFACES
This section summarizes the important inputs, outputs and interfaces required among the various APMT blocks and modules.
7.1 Aviation Operations Generator Module
7.1.1 Inputs
The Aviation Operations Generator module takes FESG fleet and traffic (demand) forecasts as its primary input, along with data on the existing fleet (types and ages) and existing/historic operations (distributions of flights), as well as assumptions about retirements, all already approved by CAEP for MAGENTA. It additionally takes scenario input, such as phase-out rules.
The Aviation Operations Generator module also will be required to take EDS information about potential future aircraft types, including performance and cost characteristics, possibly supplemented by cost input from the Airline Operating Costs module.
The Future Air Transport Demand module will supply input in the form of adjustments to the base operations levels for scenario runs.
APMT Architecture Study 52
7.1.2 Outputs
The primary output of the Aviation Operations Generator module will be the schedule of flights flown by specific aircraft that will transfer as input to the AEDT Block and the Airline Operating Costs module. Additional output parameters that may be useful to policy makers may include summary statistics on the schedule and fleet, particularly with respect to the scenario cases relative to the baseline.
7.2 Environmental Design Space Module
The interface between EDS and APMT must be designed to enable potential future, technologically advanced, aircraft to be included in the fleet. The characteristics of these aircraft must be consistent with the policies and regulations explored in a given scenario.
7.2.1 Inputs
EDS requires a number of economic and policy scenario inputs to ensure that the results produced are consistent with the scenarios and portfolios being investigated within APMT. The following is a list of parameters that must be passed from APMT to EDS.
7.2.1.1 Discount Rates
EDS aircraft cost models calculate manufacturer cash flow to determine if an aircraft program is profitable. Since these monetary flows need to be discounted, they should be discounted using a rates that are consistent with APMT assumptions (different rates would need to be employed for different economic and environmental effects).
7.2.1.2 Production Numbers
Determination of aircraft/engine production cost is dependent upon the number of units produced and the length of the production run. This sensitivity necessitates the inclusion of production numbers and rates. These numbers would, necessarily, be consistent with the fleet forecast that APMT uses or creates.
7.2.1.3 Emissions and Noise Rules
Determination of technology portfolios and design feasibility depend on the requirements placed upon a system. As such, it is important that any emissions and noise certification standards, limits, charging schemes, etc. be passed down from APMT to EDS for each vehicle class.
7.2.1.4 Aircraft and Engine Characteristics
The EDS also requires parameters typically required to perform a preliminary design of an aircraft and engine. These include:
• Vehicle specifications – Number of seats, mission definition, material structural selections, aerodynamic inputs, and constraints such as maximum field length and maximum approach speed.
• Engine cycle variables – Overall engine arrangement, maximum compressor pressure ratio, material limit temperatures, typical component performance maps and maximum achievable component efficiencies.
APMT Architecture Study 53
• Technology impacts – factors used to model improvements in technology performance such as composite mass fraction, maximum turbine inlet temperature, cooling effectiveness and maximum lift-to-drag ratio.
7.2.2 Outputs
APMT will ultimately use a variety of information provided by EDS to determine the effectiveness of proposed environmental regulations. Much of this information will be passed to and acted upon by the AEDT Block.
7.2.2.1 Airframe and Engine Costs
EDS must provide cost estimates for potential future or modified aircraft/engine combinations. This information is dependent upon production number and schedule information provided by APMT and, thus, represents a feedback loop that must be understood in APMT-EDS operations.
7.2.2.2 Aircraft Performance
In order to properly schedule operations of new technology aircraft, it is necessary to provide basic aircraft performance information to APMT. This information includes parameters such as:
• Cruise speed/Mach
• Cruise Altitude
• Approach speed
• Fuel burn as a function of stagelength
• Aircraft weight
7.2.2.3 Aircraft Emissions and Noise
In order for the future fleet to be adequately assessed within the AEDT Block it is necessary that EDS produce emissions and noise performance predictions. These will be specified using the same framework used within AEDT for representing existing aircraft (to include aerodynamic and engine performance parameters, noise-power-distance curves and emissions indices).
7.3 Manufacturer Costs/Aircraft Prices Module
The Manufacturer Costs/Aircraft Prices module of APMT will be executed for each aircraft type considered in the fleet within the Airline Operating Costs module.
7.3.1 Inputs
• For determining a market value-based price for potential future aircraft, EDS must provide aircraft performance characteristics that are commonly used as regressors within price correlations, such as the number of seats, aircraft weight and fuel efficiency.
• Assumptions regarding manufacturer profit margins are required to establish ceilings on allowable manufacturing costs given the market value-based aircraft price.
• For bottom-up estimates of manufacturing costs using ALCCA, production quantity, rate, and complexity based on the level of technology change must be taken from the Aviation
APMT Architecture Study 54
Operations Generator module and scenarios. Other inputs required from EDS include detailed aircraft and engine component weights, parts count and materials definitions.
• Assumptions regarding the key factors of production (including labor rates, materials, etc.) and discount rates consistent with other components of APMT must be provided.
7.3.2 Outputs
This module can provide:
• Price estimates for existing aircraft types based on publicly available aircraft price databases
• Price estimates for potential future aircraft based on estimated market value
• Manufacturing cost ceiling estimates
• For potential future aircraft where bottom-up detailed cost estimates are required, ALCCA will provide
o Development costs
o Component costs
o Production costs
o 1st aircraft cost
o Average aircraft cost
o Aircraft price
7.4 Airline Operating Costs
The Airline Operating Costs module of APMT will need to be executed for each aircraft type considered in the fleet mix within the Airline Operating Costs section.
7.4.1 Inputs
This module requires the following information:
• Distance of flight stage city i to city j
• Price of fuel
• Varying by aircraft class
o Cycle related direct maintenance cost per flight (including overhead)
o Hourly related direct maintenance cost per block hour (including overhead)
o Total block hours required for a single flight (defined as the total travel time for an aircraft between i and j, including all taxi and runway movement)
o Average flight crew cost per block hour for aircraft movement type m (scheduled or charter)
o Average cabin crew cost per block hour for aircraft movement type m (scheduled or charter)
APMT Architecture Study 55
o Capital costs (aircraft rental, depreciation and finance costs) of one block hour of flight
o Cycle-related component of fuel used on a single flight
o Distance-related component of fuel used on a single flight for distance band d
o Cycle-related landing and slot costs incurred on a single flight
o Distance-related navigation costs incurred on a single flight
7.4.2 Outputs
This module can provide:
• Operating cost for 1 unit capacity as function of
o Flight stage (city pair)
o Aircraft type (reflecting size and range capability)
o Aircraft function (passenger, combined passenger and freight, or dedicated freighter)
o Aircraft technology level (old or current)
• Unit costs by region pair (14 world regions, 196 combinations, based on IATA regional definition)
• Unit costs by flight stage and aircraft category
• Unit costs by traffic line averaged across aircraft categories
• Composite change in unit cost by traffic line, including the cost effect of reduced aircraft choice
• Cost components:
o Fuel
o Maintenance
o Flight crew
o Cabin crew
o Landing and slot costs
o Navigation costs
o Depreciation/leasing
o Aircraft finance costs
o Cost of spares
• Cost differences between datum and future scenario
• Modification of capital costs due to policy measures
• Derivation of policy-induced changes in unit operating costs per flight stage
APMT Architecture Study 56
7.5 Fares Assumptions Module
The Fares Assumptions module is the bridge between changes in airline costs and demand. Changes in regulatory policy change airline costs, and thus may influence fares.
7.5.1 Inputs
The AERO-MS methodology uses a profit maximization framework constrained by existing per unit profit levels by flight stage. These existing profit levels are required as inputs. The methodology also requires class-specific demand elasticities as inputs.
7.5.2 Outputs
The Fares Assumption Module determines the amount to change fares across all classes, consistent with the different elasticities, and constrained by existing per unit profit levels by flight stage. The changes in fares are used along with the changes in demand by the Future Air Transport Demand module to estimate changes in consumer surplus. The changes in consumer surplus are one of the costs collected within the Analysis and Display Block.
7.6 Future Air Transport Demand Module
7.6.1 Inputs
The Future Air Transport Demand module takes input from the Fares Assumptions module in order to adjust the projected amounts of air travel undertaken when airline operating cost changes induce fare changes.
Second, the Future Air Transport Demand module needs to be capable of accepting different parameter values (elasticities) for use in adjusting demand levels in response to fare changes.
Finally, the Future Air Transport Demand module needs to be capable of accepting scenario input, which will probably take the form of altered forecast input, altered fare input, or altered parameter values.
7.6.2 Outputs
The adjustments to the numbers of flights associated with changes in fares output from the Future Air Transport Demand module are provided as input to the Aviation Operations Generator module.
The other principal output of the Future Air Transport Demand module, aside from change in projected demand levels for the scenario cases, is the change in consumer surplus of particular policy cases relative to the baseline case. The change in consumer surplus is one of the costs included in CEA and BCA analysis.
APMT Architecture Study 57
7.7 The Aviation Environmental Design Tool Block
7.7.1 Inputs
The AEDT Block takes as input from the Aviation Operations Generator module the day-by-day schedule of global aircraft operations for each year considered in the scenario. For each flight in the schedule a specific aircraft type is specified.
The AEDT Block also requires many databases to define aircraft and the air transportation system. These include an airports database, a population and demographic information database, a database of existing aircraft/engine combinations, and a database containing the aerodynamic, engine and environmental performance of aircraft and engines (both existing and future scenario aircraft from EDS).
7.7.2 Outputs
The AEDT Block passes emissions inventory and noise exposure information for the baseline and policy scenario cases to the Benefits Valuation Block. This information is necessary for BCA. The AEDT Block also passes emissions and noise exposure information directly to the Analysis and Display Block to be used for CEA. AEDT will provide:
• Airport-specific landing and take-off operations organized by aircraft type, preferably using INM designations, with equivalency method estimates of noise contour area contributions for 55, 60, 65, 70 and 75 DNL
• Area of MAGENTA estimated noise contours for 55, 60, 65, 70 and 75 DNL, including estimated population exposure within these contours and averaged demographic information for population, income, and housing variables
• Emissions inventories with altitude resolution, including specific information as to landing – take-off emissions arranged by airport and aircraft type, preferably using INM designations
7.8 Benefits Valuation Block
7.8.1 Inputs
The benefits valuation step occurs after the characteristics of each representative aircraft have been established and fleet movements have been executed by the AEDT Block to obtain the spatial and temporal distribution of noise and emissions. Section 7.7 provides a list of AEDT outputs that are used as inputs to the Benefits Valuation Block. During the process of estimating monetized benefits, several additional data inputs are required, including:
• meteorological data including temperatures, pressures, relative humidity, and winds relevant to the landing – take-off cycle and en-route segments of the flight profile
• other environmental data such as EPA AirData monitor measurements for locations near airports, which are used to estimate ambient concentrations of key pollutants and their precursor species
APMT Architecture Study 58
• non-aviation emissions inventories including EPA AirData Tier Emissions reports and the EPA National Emissions Inventory, which are used to estimate county-level (or finer resolution) aviation contributions to changes in ambient concentrations
• population and demographic data and projections from sources such as the U.S. Census at county-level (or finer resolution), including population breakdowns by sex, age, race, and ethnicity, population density, housing information such as mean home price, and income information
• hedonic models linking noise exposure with property depreciation
• concentration-response models linking changes in ambient concentrations and noise with incidence of health concerns
• impulse response models linking emissions loading with change in surface temperature and other climate impact variables
• economic welfare valuations as willingness to pay or accept (or equivalent approximations) relevant to changes in environmental variables and incidence of health effects, including mortality and morbidity endpoints
7.8.2 Outputs
The benefits valuation is executed for each policy scenario for which a separate spatial and temporal distribution of noise and emissions has been provided from the AEDT Block. For each of the three categories of benefits valuation—noise, air quality, and climate—summary impact metrics are estimated and then valued using the welfare measures (or approximations thereof) described in Section 7.8.1. Although other metrics may be considered, the primary summary metrics are the area and population exposed to various levels of noise around airports, incidence of various health impacts associated with air quality and noise levels around airports, and change in surface temperature and other environmental variables associated with changes in climate. The final output consists of the summation of welfare changes estimated for each category of benefits valuation in monetary units.
7.9 General Economy Block
The General Economy Block will require outputs from the Partial Equilibrium Block regarding levels of output and revenue for both the air carriers and manufacturers. The level of detail possible for applying simple multipliers will depend on the degree of geographic detail provided by the partial equilibrium model. The minimum level of resolution acceptable would be at the country level, but multipliers exist down to nearly a county level for the United States.
The multiplier effects to be applied to the Partial Equilibrium Block data are exogenous inputs from the economic literature or policy sources that should be capable of being updated or changed.
7.9.1 Outputs
The output of the General Economy Block would be the change in overall output in the economy for the scenario case relative to the baseline case. This would be captured by the collected costs mechanism and passed through to both CEA and BCA.
APMT Architecture Study 59
7.10 Analysis and Display Block
7.10.1 Inputs
The Analysis and Display Block has three modules: Cost Effectiveness Analysis (CEA), Benefit Cost Analysis (BCA), and Distributional Analysis. Below, the inputs and outputs for each module are described.
The CEA module requires as input an evaluation of the costs associated with a baseline scenario and alternative regulatory choices. Specifically, it requires costs associated with the proposed regulation from the perspective of aircraft manufacturers, airline operators, and consumers. The module should be able to process both point estimates and probabilistic ranges of values.
The CEA module also requires an assessment of the benefits realized with each alternative from the AEDT Block, in terms of impacts on emissions and noise from the proposed regulation. Ideally, those benefits will be translated into final outcome metrics, such as lives saved, by the Benefits Valuation Block.
The CEA module will require direct user input of a rate for discounting future compliance costs. The user should also supply any cost savings not captured in the calculation of compliance cost inputs.
The BCA module requires as input the same costs used to conduct the cost effectiveness analysis. In order to conduct a BCA, the module will require the benefits associated with the regulation or policy under analysis to be monetized. This requirement means the output from the AEDT Block will need to be transformed into the dollar value of benefits (or the range of dollar values for benefits) within the Benefits Valuation Block before it can be used by the BCA module.
As in the CEA, additional inputs supplied directly from the user are the discount rate and any cost savings associated with the regulation or policy that are not captured elsewhere in the calculation of costs.
Inputs to the Distributional Analysis module are the raw costs and benefits used in the CEA and BCA modules prior to the point where they are aggregated over the region or geographic area being studied. The calculation of distributional effects requires that impacts on specific stakeholders be examined separately; this requires calculating net benefits for each actor in the policy scenario being analyzed.
7.10.2 Output
The output of the CEA is the computed cost effectiveness ratio, (net costs)/(measured effectiveness), for each of the regulatory alternatives being analyzed.
The output of the BCA module is the net present value (NPV) of the aggregated and monetized cost and benefit streams that result from the analyzed policy alternatives. Each alternative being considered will have its own calculated NPV.
The output of the Distributional Analysis module is a “regulatory balance sheet” that shows the projected costs and benefits of a particular alternative at some specific point in the future. This module must be able to describe and assign these costs and benefits at several levels of granularity: by demographic group, by economic actor, and by region or community, for
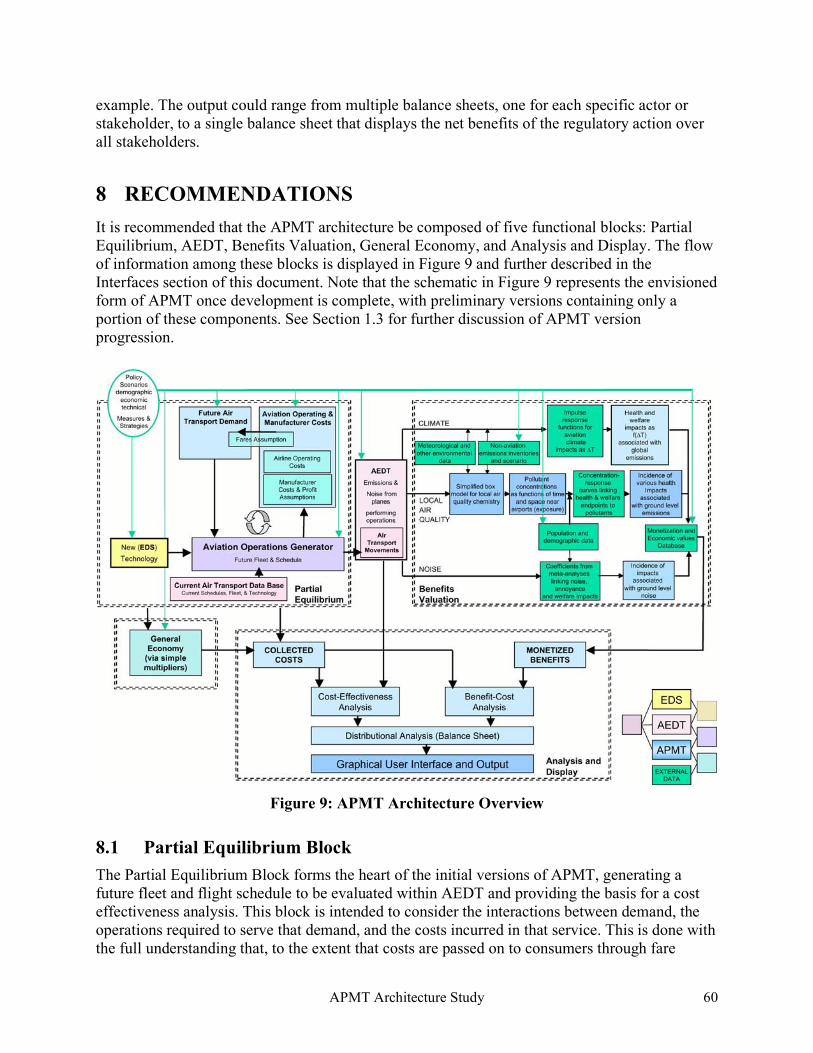
APMT Architecture Study 60
example. The output could range from multiple balance sheets, one for each specific actor or stakeholder, to a single balance sheet that displays the net benefits of the regulatory action over all stakeholders.
8 RECOMMENDATIONS
It is recommended that the APMT architecture be composed of five functional blocks: Partial Equilibrium, AEDT, Benefits Valuation, General Economy, and Analysis and Display. The flow of information among these blocks is displayed in Figure 9 and further described in the Interfaces section of this document. Note that the schematic in Figure 9 represents the envisioned form of APMT once development is complete, with preliminary versions containing only a portion of these components. See Section 1.3 for further discussion of APMT version progression.
Figure 9: APMT Architecture Overview
8.1 Partial Equilibrium Block
The Partial Equilibrium Block forms the heart of the initial versions of APMT, generating a future fleet and flight schedule to be evaluated within AEDT and providing the basis for a cost effectiveness analysis. This block is intended to consider the interactions between demand, the operations required to serve that demand, and the costs incurred in that service. This is done with the full understanding that, to the extent that costs are passed on to consumers through fare
APMT Architecture Study 61
changes, demand will be affected and an equilibrium state will need to be reached within this economic sector.
Forecasting of demand is considered to be beyond the scope of APMT. Therefore, input demand forecasts will be used, but modifications will be implemented to reflect the impact of fare assumptions and enable the feedback required to establish a supply-demand equilibrium.
The Aviation Operations Generator module is intended to translate the identified demand into the fleet and schedule chosen by the operators. Initially, this operations generator will be based on the MAGENTA approach, described further in Section 2.1.1. However, in order to capture the cost and fare implications of the operations selected, modeling of the operators’ fleet/schedule planning behavior should be considered for future APMT versions.
Manufacturer costs will be considered at two different levels of detail depending on the types of aircraft technology infusion being considered. Regressions of historical price data that vary parametrically and reflect a range of manufacturer profit assumptions will be used for first-order estimates. When higher fidelity is required to reflect technology infusion, a model such as the NASA/Georgia Tech Aircraft Life Cycle Cost Analysis code will be used.
Airline operating costs will be calculated using an approach based on the AERO-MS ACOS module. The fare adjustment mechanism from AERO-MS is considered suitable for near term adoption, with the addition of a capability to parametrically vary the percent of cost pass- through to fares. In the short to intermediate term, a more rigorous, realistic framework for dealing with fare structures should be developed.
8.2 AEDT Block
AEDT is undergoing a significant development effort independently of APMT to integrate legacy FAA tools such as INM, MAGENTA, EDMS and SAGE. However, APMT is intended to provide the future fleet and schedule information required by AEDT and, in turn, to obtain estimates of future noise and emissions inventories. These inventories will be used either as a direct measure of effectiveness in APMT Version 1, or as inputs to the Benefits Valuation Block for later versions.
8.3 Benefits Valuation Block
Although the Benefits Valuation Block will not be included in APMT Version 1, development should start simultaneously for this block to ensure that it is ready for use in Version 2. This block will consider noise and emissions inventories and their impact on the health and welfare of impacted populations. The impacts will then be monetized to enable the benefit-cost analyses desired in future APMT versions. This capability will be developed based on the capabilities of MAIPA, but augmented to include improved components of BenMAP.
8.4 General Economy Block
The General Economy Block will not be implemented in APMT Version 1, but development should start in the near term to enable its implementation in later versions. This block is initially envisioned to use statistically based multiplier effects collected from the literature and tools such as RIMS (but not the tools itself) for incorporation in APMT Version 2 or 3. A full general
APMT Architecture Study 62
equilibrium computation considering other sectors of the economy may be considered for future APMT versions, but is considered beyond the scope of the current development plan.
8.5 Analysis and Display Block
The Analysis and Display Block is intended to collect the information regarding costs and benefits and display it in the form of balance sheets through a graphical interface. This block will increase in complexity with each version of APMT since it provides the ultimate link between the user and the analyses.
The initial version of the Analysis and Display Block is envisioned to contain the following elements:
1) CEA module in accordance with standard OMB procedures, using cost and emissions inputs from the Partial Equilibrium Block, AEDT , and user-supplied discount rates; cost inputs in the form of probability curves or ranges of values should be accepted as well as point estimates
2) Distributional effects module to group outputs of CEA (and eventually, BCA) according to demographic, geographic, or other stakeholder groups
3) “Regulatory balance sheet” to display distributional effects
Later versions of APMT will accommodate the output from the Benefits Valuation Block. Therefore, the Analysis and Display Block will eventually contain a BCA module, in accordance with standard OMB procedures, using monetized benefit outputs from the benefits module and the cost and emissions inputs as described in the CEA recommendations.
8.6 Summary
Table 4 summarizes the recommendations made in this chapter and establishes the foundation for an APMT Prototype Work Plan. It should be noted that these recommendations encapsulate the tools that were identified and described within the Architecture Study. However, the Asia-Pacific Model (AIM) should be examined in more detail for its potential applicability to follow-on versions of APMT, particularly in the areas of cost and health benefits trade-offs and global equilibrium economic models. Appendix D provides more detail on the attributes of this model.
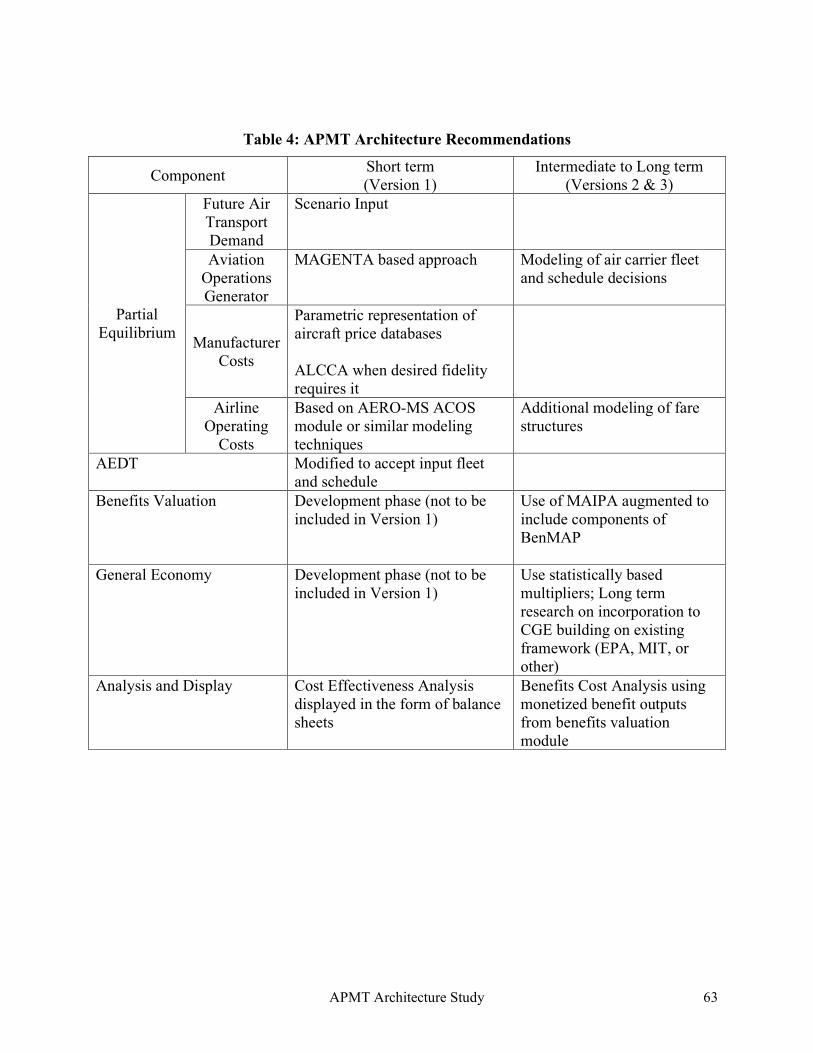
APMT Architecture Study 63
Table 4: APMT Architecture Recommendations
Component Short term (Version 1)
Intermediate to Long term (Versions 2 & 3)
Future Air Transport Demand
Scenario Input
Aviation Operations Generator
MAGENTA based approach Modeling of air carrier fleet and schedule decisions
Manufacturer Costs
Parametric representation of aircraft price databases ALCCA when desired fidelity requires it
Partial Equilibrium
Airline Operating
Costs
Based on AERO-MS ACOS module or similar modeling techniques
Additional modeling of fare structures
AEDT Modified to accept input fleet and schedule
Benefits Valuation Development phase (not to be included in Version 1)
Use of MAIPA augmented to include components of BenMAP
General Economy Development phase (not to be included in Version 1)
Use statistically based multipliers; Long term research on incorporation to CGE building on existing framework (EPA, MIT, or other)
Analysis and Display Cost Effectiveness Analysis displayed in the form of balance sheets
Benefits Cost Analysis using monetized benefit outputs from benefits valuation module
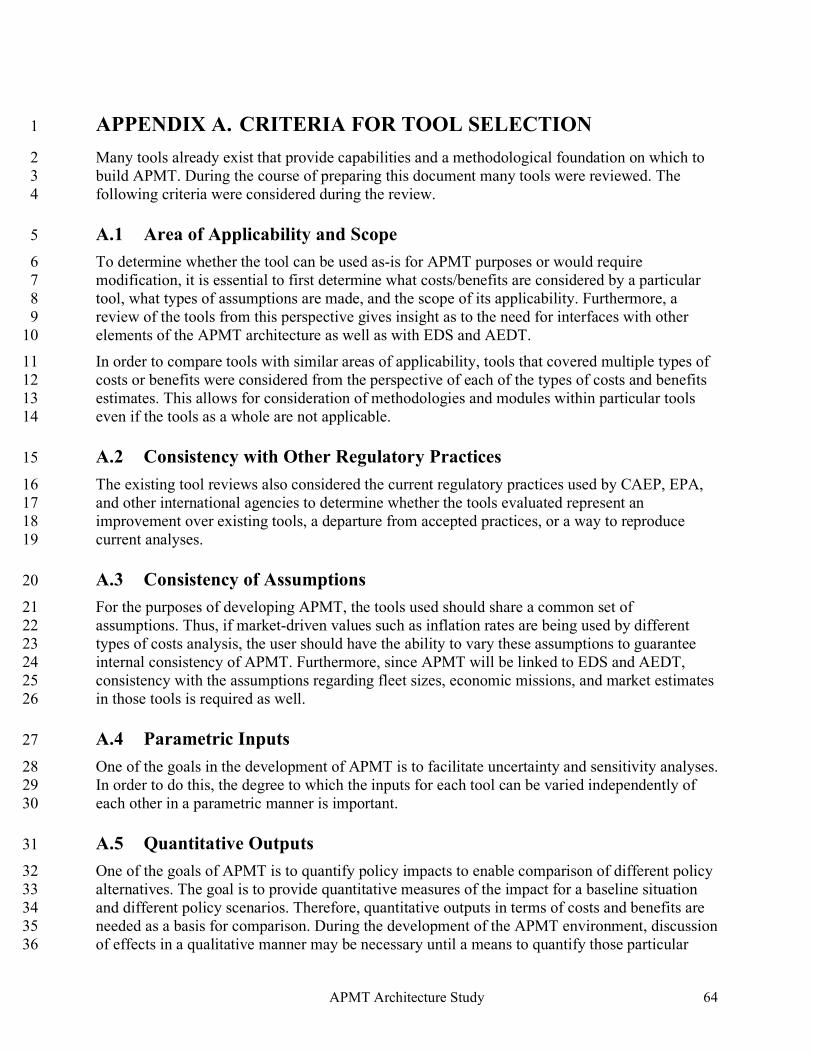
APMT Architecture Study 64
APPENDIX A. CRITERIA FOR TOOL SELECTION 1
Many tools already exist that provide capabilities and a methodological foundation on which to 2 build APMT. During the course of preparing this document many tools were reviewed. The 3 following criteria were considered during the review. 4
A.1 Area of Applicability and Scope 5
To determine whether the tool can be used as-is for APMT purposes or would require 6 modification, it is essential to first determine what costs/benefits are considered by a particular 7 tool, what types of assumptions are made, and the scope of its applicability. Furthermore, a 8 review of the tools from this perspective gives insight as to the need for interfaces with other 9 elements of the APMT architecture as well as with EDS and AEDT. 10
In order to compare tools with similar areas of applicability, tools that covered multiple types of 11 costs or benefits were considered from the perspective of each of the types of costs and benefits 12 estimates. This allows for consideration of methodologies and modules within particular tools 13 even if the tools as a whole are not applicable. 14
A.2 Consistency with Other Regulatory Practices 15
The existing tool reviews also considered the current regulatory practices used by CAEP, EPA, 16 and other international agencies to determine whether the tools evaluated represent an 17 improvement over existing tools, a departure from accepted practices, or a way to reproduce 18 current analyses. 19
A.3 Consistency of Assumptions 20
For the purposes of developing APMT, the tools used should share a common set of 21 assumptions. Thus, if market-driven values such as inflation rates are being used by different 22 types of costs analysis, the user should have the ability to vary these assumptions to guarantee 23 internal consistency of APMT. Furthermore, since APMT will be linked to EDS and AEDT, 24 consistency with the assumptions regarding fleet sizes, economic missions, and market estimates 25 in those tools is required as well. 26
A.4 Parametric Inputs 27
One of the goals in the development of APMT is to facilitate uncertainty and sensitivity analyses. 28 In order to do this, the degree to which the inputs for each tool can be varied independently of 29 each other in a parametric manner is important. 30
A.5 Quantitative Outputs 31
One of the goals of APMT is to quantify policy impacts to enable comparison of different policy 32 alternatives. The goal is to provide quantitative measures of the impact for a baseline situation 33 and different policy scenarios. Therefore, quantitative outputs in terms of costs and benefits are 34 needed as a basis for comparison. During the development of the APMT environment, discussion 35 of effects in a qualitative manner may be necessary until a means to quantify those particular 36
APMT Architecture Study 65
impacts is developed, but the ultimate goal is to provide quantitative estimates. Note that 1 quantitative does not necessarily mean deterministic, as a risk value may be associated with each 2 metric tracked. 3
A.6 Flexibility 4
One of the key criteria for APMT application is the flexibility of the tool to adapt to the data 5 available. Since the intended use for APMT is the regulatory process, the tools used within the 6 architecture should have the ability to make use of existing data, while accommodating future 7 studies with different parameters of interest or the use of simulated data obtained by other 8 models. Therefore, an ability to change many of the inputs to the tools is desired, while 9 providing suitable defaults for parameters that may not be in use under a particular scenario. 10 Furthermore, the ability to change assumptions, especially time spans and uncertain market 11 related factors, or to introduce a step change in behavior due to exogenous technology infusion, 12 will be necessary. 13
An adjustable level of detail for the outputs is also desired so that the level of aggregation can be 14 selected depending on the purpose of the study. 15
A.7 Robustness 16
The APMT architecture will be used to consider policy alternatives that may be outside of 17 current practices. A clear understanding of the boundaries of applicability for the model is 18 necessary, preferably with error checking provided when the boundaries are being crossed. 19 However, while warnings in this respect are useful, failure to execute is also problematic; 20 therefore, a certain degree of robustness is desired. 21
A.8 Transparency 22
APMT use in the regulatory process dictates that the resulting architecture, assumptions, and 23 methodologies should be as transparent as possible. While not all tools need to be fully open 24 with access to each and every detail of their algorithms, they should be well documented. 25 Assumptions should be clearly stated so they can be challenged, and general estimation 26 procedures must be described at a level of detail such that they could be reproduced by others if 27 necessary. 28
A.9 Accessible to the Intended Users 29
While the codes themselves need not be accessible, they must be transparent as described above, 30 and the input and output data they employ must be capable of being released to the international 31 community. Proprietary codes, whose output is also considered proprietary, cannot be 32 considered, given the intended use of APMT within CAEP. 33
A.10 Data Availability 34
The detail required by the tools for execution must be consistent with the type of data that will be 35 available. Should the tools require more detail than can be provided with available data, 36 assumptions will be required that may or may not be justified. For example, if the finest level of 37 detail generally available for demographic and socio-economic data is at the level of U.S. 38
APMT Architecture Study 66
counties, then the tools must be consistent with this level of aggregation. Therefore, the scope 1 and fidelity of the tools to be included in the APMT architecture must conform to the types of 2 data that will be used. 3
A.11 Minimal Internal Optimization and Feedback Loops 4
The tools that were reviewed and assessed were being considered for inclusion in the larger 5 APMT architecture. Optimization and feedbacks should preferably be handled at the architecture 6 level, rather than internally to each tool, since component optimums rarely yield an overall 7 optimum. Furthermore, internal optimization and feedback loops typically increase execution 8 time, making uncertainty assessments more cumbersome. Therefore, whenever possible, internal 9 optimization and feedback loops should be minimal and/or allow for external manipulation. 10
A.12 Batch Execution 11
The ability to execute the tools in batch mode, modifying inputs directly rather than through a 12 user interface, is preferred. This will ease trade-off and uncertainty studies, and will allow for 13 faster, easier interface with other components of the APMT architecture. The tools may have a 14 GUI when operating in stand-alone mode, but there should be a way to bypass this to enable 15 batch mode operation. 16
A.13 Rapid Execution 17
Relatively fast execution, in terms of minutes rather than days, is desired for the individual 18 component models of APMT. This stems from the need to integrate a number of different tools 19 that may not be able to execute in parallel, resulting in lengthy execution times for the 20 architecture if each component is not suitably fast. Fast execution will also enable studies that 21 require numerous runs, such as sensitivity and uncertainty analyses. Alternatively, it may be 22 possible to use surrogate models to capture the general behavior of slower models without 23 executing them fully for each run of APMT. 24
A.14 Platform Independence 25
Since building APMT will likely require integration of multiple tools, a common platform of 26 execution is preferred. Therefore, a certain degree of platform independence would be desired, or 27 the ability to compile a model on a different platform. Alternatively, several integration tools, 28 such as Model Center, exist that may be wrapped around the models to provide a cross-platform 29 integration capability. 30
APMT Architecture Study 67
APPENDIX B. REVIEW OF TOOLS FOR MANUFACTURER 1
COSTS ESTIMATION 2
This appendix is intended to expand on the Manufacturer Costs Tool review presented in the 3 body of the document and provide a more comprehensive review of each model’s suitability to 4 development of APMT. 5
B.1 Current CAEP Practices 6
Current CAEP practices provide quantitative estimates of the changes in non-recurring, 7 recurring, and operating costs due to the introduction of new technologies. A key assumption 8 underlying the CAEP methods is that technology changes can be classified according to a 9 Technology Level (TL). These TLs range from a minor change in an existing system (TL1) to a 10 completely new technology that is beyond current industry best practice (TL5B). Costs in each 11 of the three categories (non-recurring, recurring, and operating) are estimated based on TL as 12 follows. 13
A fixed schedule of manufacturers’ costs is tied directly to assumed technology levels. For 14 example, in the FESG NOx emissions stringency analysis (CAEP/6-IP/13), fixed, non-recurring, 15 and recurring costs were assigned to each of four TL categories ranging from TL1 to TL5B. For 16 a given engine family, the technology level to achieve a certain stringency is first identified. This 17 technology level in turn defines fixed, non-recurring, and recurring costs for that particular 18 engine family. To set the magnitude and timing of the costs, several assumptions are employed 19 as follows. 20
The magnitudes of non-recurring and recurring costs are set by agreement between 21 manufacturers and FESG. In some cases, quantitative estimates of the costs of previous programs 22 (e.g., NASA High Speed Research program) are used to provide guidance. Costs are assigned on 23 the basis of the technology level rather than according to the particular technology under 24 consideration. For new technologies, the total program non-recurring costs are set as a range with 25 upper and lower bounds. Recurring costs are assigned as an incremental manufacturing cost 26 increase per engine. The magnitudes chosen for these costs are based only on the technology 27 level, rather than on the actual costs of particular technology concepts. 28
Similarly, assumptions on the timing of non-recurring costs are established by agreement 29 between manufacturers and FESG. For example, in CAEP/6-IP/13, non-recurring costs 30 associated with a TL1 change were assumed to be incurred in a single year, while those for a 31 TL5B were assumed to be distributed evenly over an 8-year period. 32
CAEP assumptions for operating costs are based on a combination of empirical data, operators’ 33 estimates, and experience with previous technology changes. Changes in operating costs are 34 assumed to result from changes in aircraft fuel burn performance and from an increase in aircraft 35 weight. Fuel burn changes result from the introduction of new technologies; however, the change 36 is assigned a fixed magnitude for a given TL rather than being computed with a physics-based 37 model for a particular technology option. The effects of increased fuel burn are translated into 38 increased operating cost using available fuel burn data, averaged over FESG aircraft seat 39 categories. Increases in aircraft weight are assumed to result in an increase in the total cost per 40 pound, which is computed using regression of available list price data for existing aircraft, and in 41
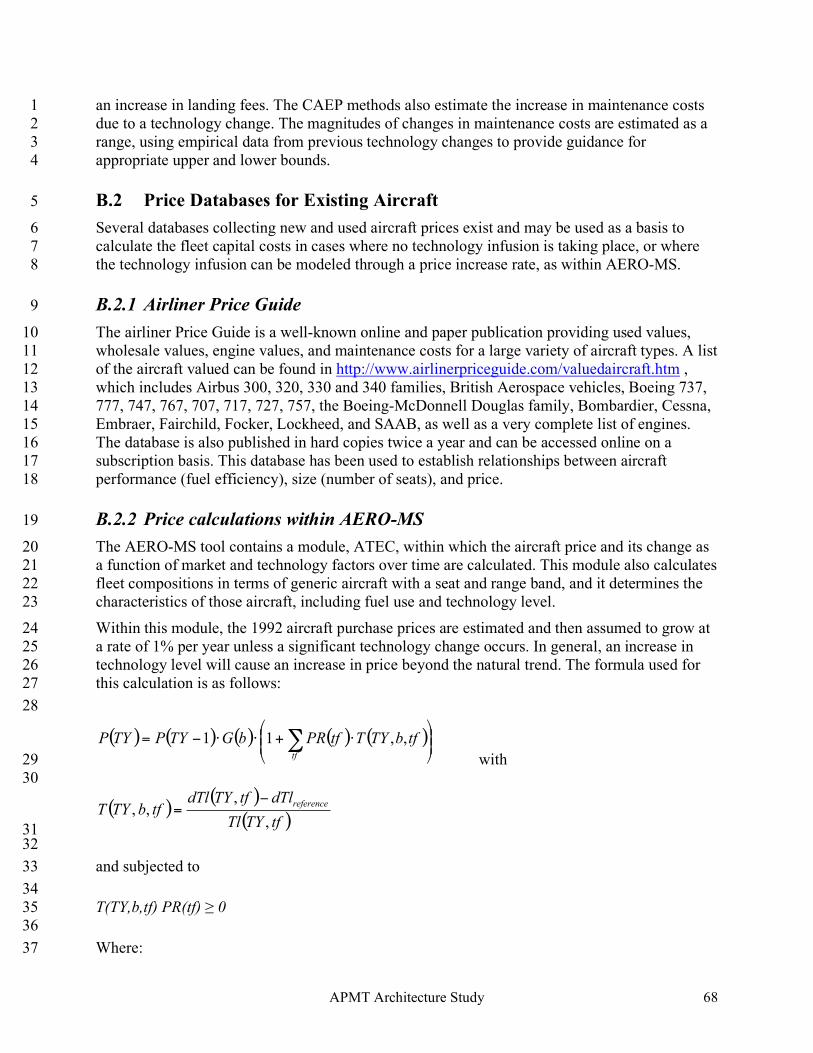
APMT Architecture Study 68
an increase in landing fees. The CAEP methods also estimate the increase in maintenance costs 1 due to a technology change. The magnitudes of changes in maintenance costs are estimated as a 2 range, using empirical data from previous technology changes to provide guidance for 3 appropriate upper and lower bounds. 4
B.2 Price Databases for Existing Aircraft 5
Several databases collecting new and used aircraft prices exist and may be used as a basis to 6 calculate the fleet capital costs in cases where no technology infusion is taking place, or where 7 the technology infusion can be modeled through a price increase rate, as within AERO-MS. 8
B.2.1 Airliner Price Guide 9
The airliner Price Guide is a well-known online and paper publication providing used values, 10 wholesale values, engine values, and maintenance costs for a large variety of aircraft types. A list 11 of the aircraft valued can be found in http://www.airlinerpriceguide.com/valuedaircraft.htm , 12 which includes Airbus 300, 320, 330 and 340 families, British Aerospace vehicles, Boeing 737, 13 777, 747, 767, 707, 717, 727, 757, the Boeing-McDonnell Douglas family, Bombardier, Cessna, 14 Embraer, Fairchild, Focker, Lockheed, and SAAB, as well as a very complete list of engines. 15 The database is also published in hard copies twice a year and can be accessed online on a 16 subscription basis. This database has been used to establish relationships between aircraft 17 performance (fuel efficiency), size (number of seats), and price. 18
B.2.2 Price calculations within AERO-MS 19
The AERO-MS tool contains a module, ATEC, within which the aircraft price and its change as 20 a function of market and technology factors over time are calculated. This module also calculates 21 fleet compositions in terms of generic aircraft with a seat and range band, and it determines the 22 characteristics of those aircraft, including fuel use and technology level. 23
Within this module, the 1992 aircraft purchase prices are estimated and then assumed to grow at 24 a rate of 1% per year unless a significant technology change occurs. In general, an increase in 25 technology level will cause an increase in price beyond the natural trend. The formula used for 26 this calculation is as follows: 27
28
( ) ( ) ( ) ( ) ( )!!"
#$$%
&'+''(= )
tf
tfbTYTtfPRbGTYPTYP ,,11
with 29 30
( )( )
( )tfTYTl
dTltfTYdTltfbTYT
reference
,
,,,
!=
31 32
and subjected to 33
34 T(TY,b,tf) PR(tf) ! 0 35 36
Where: 37
APMT Architecture Study 69
P(TY) is the aircraft new price in a technology year TY. 1
G(b) is the price growth that is established for the base year b. 2
PR(TY,tf) is the price rate or the change in price due to a unit relative technology change for a 3 given technology year TY and technology type tf. 4
T(TY,b,tf) is the relative change in technology per year. 5
Tl is the technology level for a given technology year TY and technology type tf. 6
tf is the type of technology measure 7
This type of treatment on the aircraft price may be applicable to model technology changes that 8 do not significantly impact the aircraft; however, it requires assumptions regarding the rate of 9 change of technology level, as well as rate of change of price relative with technology level. Data 10 to support these assumptions may be difficult to obtain, and larger technology changes will 11 require a more in-depth exploration of the technology change, its cost, and finally a translation 12 into price. 13
B.3 Non-Aviation Specific Cost Tools 14
The tools included in this section are typically based on an input Work Breakdown Structure 15 (WBS) for the system to be analyzed [ISPA/SCEA, 2003], [NASA, 2004] [NASA, 2005]. The 16 Cost Estimating Relationships (CERs) for each of the elements in the WBS must also be entered 17 by the user although libraries including WBS and CERs applicable to similar systems may exist. 18 These tools also contain modules to calculate typical hardware considerations such as 19 depreciation and learning curves. The main strength of these tools is their versatility in 20 accommodating a variety of studies such as risk, sensitivity, and trade-off analyses. They are 21 typically very flexible and transparent, and although they are often driven by a graphical 22 interface, they do allow for repeated execution. The only caveat in their use is the availability of 23 suitable CER libraries. 24
B.3.1 PRICE-H 25
PRICE H is a computerized cost estimating tool developed by Price Systems, L.L.C [2005]. The 26 “H” variant of the software is used to estimate the cost of hardware-related items for projects of 27 any scale, from the component level to a complete assembly such as an aircraft, ship, or space 28 station. The software uses built-in regressions and equations to generate estimates with a 29 minimal amount of known project data. Adding more information about the project as it takes 30 shape increases the fidelity of the estimate. PRICE H can be used for all aspects of hardware 31 acquisition, including the development, production, modification, procurement, upgrade, and 32 system integration and testing. PRICE H also allows decision-making and trade studies through 33 several built-in algorithms that are based on industry-accepted practices. 34
The software runs under the Microsoft Windows Operating System, and interfaces directly with 35 Microsoft Excel. The software can be executed from an Excel-based interface, which increases 36 its functionality for performing design studies. 37
In its simplest form, PRICE H requires some static program information such as the start date, 38 development period, and number of items to be produced. The cost estimate is primarily 39 calculated as a function of two quantities: weight and complexity. The complexity factor is 40
APMT Architecture Study 70
divided into engineering and manufacturing complexity, impacting development and production 1 costs, respectively. A graphical wizard walks the user through the process of generating a 2 complexity value for an unknown component. For the manufacturing complexity, the user can 3 specify the intended use of the part, the level of integration with the system, the primary 4 composition of the component, and the number of parts in the assembly. PRICE H will calculate 5 a complexity factor for the user based on the questions in the wizard, and also allows the use of 6 calibration factors to change the baseline complexity parametrically. Engineering complexity is 7 defined from the degree of change from the state-of-the-art, the skill of the engineering labor 8 involved, and the amount of design work that is anticipated. As with the manufacturing 9 complexity, calibration factors also exist to alter the baseline value. In this manner, a “baseline” 10 vehicle configuration can be defined on a part-by-part basis. Built-in library values do exist for 11 commercial aircraft. 12
B.3.2 SEER 13
SEER tools allow the user to identify, evaluate, and manage the complex array of cost, labor, 14 schedule, reliability, and risks associated with an organization’s critical projects. All the tools in 15 the suite are parametric, which facilitates the mathematical modeling of economic scenarios and 16 the independent variation of control variables. SEER-H [Galorath, 2005] is a decision support 17 tool providing Lifecycle Cost (LCC) for any scale hardware project, from individual components 18 to a variety of complete product assemblies including ground, air, space, and sea vehicles, 19 electronic devices, industrial equipment, consumer electronics, and appliances. Using parametric 20 algorithms, knowledge bases, and user-supplied data, SEER-H can estimate the total cost of 21 ownership for new product development projects, and can provide system and sub-system 22 development, production, system level, operation/support, and disposal costs. To address 23 uncertainty and risk assessment, each input to SEER-H can be assigned least, likely, and most 24 values, and estimates are output as a range, from 1% to 99% likelihood. SEER-H bases its 25 estimate upon a Product Description (what is being built), a Mission Description (how it must 26 perform), and a Program Description (how it will be built). Over time, by customizing 27 knowledge bases and calibrating the tool to actual projects, SEER-H estimates can be refined. 28
SEER-DFM is a decision-support tool that provides estimates for manufacturing costs. In 29 addition, it provides design and production guidance for the management of cost, labor, 30 assembly, process, part design, material, and production variables that can significantly affect 31 manufacturing costs. This tool is used in numerous industries, including electronics, automotive, 32 aerospace, defense, and industrial and consumer products. SEER-DFM is also a highly effective 33 tool for bidding on management tasks, procurement (“should-cost”), and design trade studies. 34
B.3.3 ACEIT-ACE 35
ACE is the estimating portion and heart of the ACEIT application suite [Tecolote Research Inc., 36 2005]. The cost model development environment is used to create project-specific data files that 37 can be shared. ACE is similar in look and feel to a spreadsheet, but it contains numerous features 38 that automate data-handling functions such as data normalization and learning curve analysis. 39 The tool provides a series of libraries with which different estimating methodologies can be 40 queried and selected. Complex estimation equation set-up is aided by built-in wizards that offer 41 traceability of data and error through the equations. Side-by-side analysis can be performed to 42
APMT Architecture Study 71
observe what-if scenarios under various, differing economic assumptions. Plug-ins allow direct 1 application integration with PRICE, SEER, and MS-Project. 2
B.4 Aviation-Specific Cost Tools 3
The tools reviewed in this section contain specific WBS for commercial transports and are 4 therefore only applicable insofar as the WBS used within them is acceptable. 5
B.4.1 ALCCA 6
The Aircraft Life Cycle Cost Analysis (ALCCA) program was originally developed by NASA 7 Ames, and has been subsequently modified at Georgia Tech [Garcia et al., 1999]. ALCCA was 8 originally developed by NASA as a means to estimate a priori the cost of developing, 9 manufacturing and operating a commercial aircraft. The program provides an overview of the 10 life cycle cost of the vehicle being analyzed. While the original version of ALCCA was primarily 11 developed for commercial aircraft, the most current version analyzes military and tilt-rotor 12 aircraft as well. 13
Manufacturer-related costs include the RDT&E and production costs. The RDT&E may be 14 calculated using simplified or detailed equations depending on the user’s intent. The production 15 costs are determined by cost-estimating relationships that are regressed based on historical cost 16 data. The first unit cost is calculated on a per component basis. In determining these costs, the 17 user is able to analyze the effects of many economic parameters such as production and engine 18 learning curves, virtual manufacturing techniques (CAD/CAM), lean manufacturing, production 19 rates, and manufacturing and tooling costs. Manufacturer’s cash flows are generated for several 20 prices (based on average aircraft cost) and production runs (if multiple runs are input). The return 21 on investment (ROI) is then calculated and an interpolation table is created for aircraft price 22 versus ROI. 23
ALCCA has an extensive input list allowing for manipulation of numerous internal assumptions. 24 The main caveat in terms of assumptions is the need to use an average inflation factor throughout 25 the years of interest. A multitude of input variables are available; however, many of them have 26 default values defined within the program to adapt to the data available. While flexible from the 27 perspective of the inputs, the cost estimating relationships are not accessible and can only be 28 modified through the use of complexity factors. ALCCA has been used in numerous parametric 29 studies and contains both parametric inputs and quantitative outputs. Its inexpensive execution 30 and minimal internal optimization render ALCCA very suitable for batch mode operation. The 31 code has been compiled on multiple platforms and could be compiled in additional ones as long 32 as a FORTRAN compiler is available. 33
In summary, ALCCA’s strength lies in its cash flow approach which provides cash flows with 34 variations in ROI, production schedules, and other important variables of interest. The cost 35 estimates for commercial aircraft provided by ALCCA are typically adequate; however, its main 36 weakness is a lack of flexibility in terms of the WBS used and the age of the data used to 37 generate its internal CERs. Ultimately, use of ALCCA may require more detail than necessary 38 since it considers individual aircraft rather than aircraft classes; however, aircraft representative 39 of a seat class may be used. 40
APMT Architecture Study 72
B.4.2 TCM 1
Developed by NASA, the Tailored Cost Model (TCM) is a spreadsheet-based application 2 implemented in Microsoft Excel for life-cycle cost prediction and analysis [Galloway, 2001]. 3 TCM uses a yearly lookup table for depreciation and inflation calculations, as opposed to other 4 aviation life cycle tools such as ALCCA, where average values are implemented. Cost estimation 5 for manufacturing and development activities feature a high level of detail. TCM also features 6 cash flow and return on investment calculations in the most recent versions of the software; these 7 features were added to the original version in an attempt to replicate the capabilities in ALCCA. 8
The modifications made to both ALCCA and TCM have made them fairly similar, apart from a 9 platform difference, which makes TCM less computationally efficient but generally more user-10 friendly. ALCCA is still relatively easier to automate due to its input file-driven format, and it 11 produces easy-to-follow outputs. Some versions of TCM require a substantial amount of 12 experience to navigate the spreadsheets and locate both inputs and outputs. TCM and ALCCA 13 are based on a similar philosophy and therefore have similar problems when dealing with 14 unusual configurations. TCM, however, may have a slight advantage when dealing with 15 evolutionary subsystem type changes since its more detailed system breakdown may make 16 technological impacts more intuitive to implement. 17
B.5 Profit Assumptions 18
The translation of cost estimates to aircraft price will require consideration of the profit 19 assumptions used. There are three typical approaches to this translation: 20
• Cost plus fee: A fee is applied as an increment to the cost of the aircraft to estimate price 21 and therefore all costs of new technology are passed through to the operator. This 22 approach is typically not representative of a competitive environment. 23
• Desired Return on Investment: The desired return on investment is often adjusted to 24 reflect the risk involved in a project. A cash flow approach is required to adjust the 25 aircraft purchase price until the desired ROI is obtained given the calculated costs. Again, 26 this approach is not representative of a competitive market. However, it is more realistic 27 since it takes into account the time value of money. 28
• Market dictated price: In a competitive environment, the balance of supply and demand 29 and the actions of the competition determine what price can be charged to meet delivery 30 expectations. The resulting fee or return on investment can then be calculated based on 31 the cost to determine whether a profit or a loss is incurred. 32
It should be noted that the market-driven approach, while realistic, may introduce excessive 33 detail within the Manufacturer Costs module. Therefore, price structures that assume some level 34 of cost pass-through to the operator, affecting the fleet selection process, may be more 35 appropriate for APMT. Regardless of the approach selected, the assumptions used will need to be 36 consistent with other elements of APMT and properly documented. 37
38
APMT Architecture Study 73
APPENDIX C. REVIEW OF TOOLS FOR AIRLINE 1
OPERATING COSTS ESTIMATION 2
This appendix is intended to expand on the airline operating cost tool review presented in the 3 body of the document and provide a more comprehensive review of each model’s suitability to 4 development of APMT. 5
C.1 AERO-MS 6
AERO-MS, developed in 1994, is available through both CAEP and the Dutch Civil Aviation 7 Authority, the sponsors of its development. The AERO-MS model consists of 9 modules, 8 including modules devoted to air transport demand and traffic levels and airline operating costs. 9
AERO-MS represents a comprehensive approach to quantifying the economic and environmental 10 impacts of emissions policy in aviation under different future scenarios. It uses a projection 11 framework that leaves demand and traffic proportional to a base year (1992). The modules are 12 interdependent so that as direct costs to airlines are calculated, fares are adjusted in response, 13 traffic levels respond to fare changes, emissions levels respond to the change in traffic levels, 14 and so on. 15
Among the key outputs of AERO-MS are those describing the impacts on costs and revenues to 16 airlines and impacts on consumers (in terms of demand levels and changes in consumer surplus 17 due to fare changes). The outputs are generated at a detailed level in the form of a large 18 database, allowing aggregate or detailed summary reports to be produced. 19
The Aviation Operating Cost Model (ACOS) is the module of AERO-MS that performs detailed 20 calculations of airline operating costs under each scenario. Users can determine which 21 forecasting assumptions and policy measures are to be tested, and ACOS then calculates the 22 changes in aircraft operating costs for the new scenario compared to a base case. Thus, the 23 principal outputs of ACOS are estimates of the differences in operating costs resulting from 24 policy measures. 25
The airline operating cost framework used by ACOS is detailed and in line with cost 26 categorization schemes employed by US Form 41. ACOS details each of the following airline 27 operating cost categories in its estimation: fuel, maintenance, flight crew, cabin crew, landing 28 and slot costs, navigation costs, depreciation and leasing, and airline finance costs. These cost 29 components are then combined into measures of variable operating cost per unit of capacity, and 30 these measures can be reported by flight stage, aircraft type, aircraft function (e.g., passenger, 31 freighter), and aircraft technology level. Airline operating cost results can also be reported by 32 spatial definitions of up to 14 world regions, in line with IATA regional definitions. 33
The ACOS model generates airline operating cost estimates for different scenarios by 34 incorporating both changes in the consumption of inputs (e.g., different fuel burn rates or number 35 of flight crew required) and changes in the prices of inputs (e.g., fuel prices or crew wages). 36 Users can specify policy measures that can result in changes to the inputs required to operate a 37 flight stage, changes to capital costs of certain aircraft, reductions in availability of certain 38 aircraft types, or modifications to the technical performance characteristics of aircraft. 39
APMT Architecture Study 74
Within AERO-MS, ACOS is an intermediate model that estimates airline operating cost 1 measures that are used by other AERO-MS modules. ACOS also interacts with another module, 2 ADEM, which is used to forecast aviation travel demand and aircraft movements. The ADEM 3 forecasts of aviation demand and supply are influenced by the differences in operating costs 4 calculated by ACOS for a given policy measure. Specifically, these two modules collaborate to 5 model the interactions between airline costs, fares, demand, and capacity, and to estimate the 6 equilibrium of supply and demand. In the base cases, ADEM provides the forecasts of demand 7 and capacity to ACOS, whereas for the scenarios involving potential policy alternatives, the cost 8 outputs of ACOS are fed back to ADEM for estimation of the impacts on fares and airline 9 response in terms of capacity. 10
Even though AERO-MS modelers acknowledge that the model “has to be up-dated, or made 11 more flexible,” this tool appears to come closest to the scope of the desired APMT economic 12 analysis of the cost impacts of policy options. Its cost estimation process is quite detailed, and 13 reports can be generated at many different levels of aggregation. The demand and fleet forecasts 14 can be changed with numerous parameters set by the user, allowing for the specification of 15 alternative base cases. Additionally, the interactions between the different modules, described 16 above, allow the capture of feedback from the airline operating cost changes to fares, demand, 17 and capacity to be captured. 18
C.2 SCSM 19
Developed by Stratus Consulting, Inc., the Stratus Consulting Spreadsheet Model (SCSM) was 20 designed to build upon and enhance (and validate to some extent) the AERO-MS model in the 21 evaluation of potential CO2 reduction measures. SCSM designers recognized the need for better 22 modeling of the implications of abatement costs on supply-side technologies and operations and 23 the responding effect on demand. 24
The SCSM model developers sought to estimate how increased costs resulting from greater 25 stringency requirements would change demand for airline travel under various CO2 reduction 26 technologies. The developers also sought the capability to use an iterative process to estimate the 27 least-cost solution to a CO2 emission target. SCSM supply-side technology response options 28 include early retirement of aircraft and engine retrofit and upgrade, among others. The model 29 provides estimates of fuel burn reductions and implementation costs to airlines in response to 30 these technological and operational emission reduction options. 31
SCSM takes the supply-side cost increases and estimates demand-side responses on a global 32 scale, using an aggregate spreadsheet-based methodology. It addresses the questions of how the 33 increase in costs associated with a given emissions reduction target translates into technology 34 adoption and/or reduced air transport activity, as well as how much of the cost of abatement is 35 borne by consumers versus airlines. 36
Using a global air travel demand elasticity of -0.7, the model estimates the global response in 37 flights and revenue passenger kilometers, passenger and cargo demand, fuel use, CO2 emissions, 38 and the effect on consumer surplus. 39
Unlike AERO-MS, the SCSM model incorporates supply-side responses, although at an 40 aggregate level. It also acknowledges the impacts of higher operating costs on airline fares and 41 air travel demand. However, its high level of aggregation make it less useful in terms of 42
APMT Architecture Study 75
generating detailed estimates of airline operating costs under different future fleet, demand, and 1 operating scenarios. 2
C.3 Comparative Study of AERO-MS and SCSM 3
A comparative report produced by the FESG Comparative Models Study Task Group [ICAO-4 CAEP, 2004a] provides a detailed review of the structures, assumptions, and outputs of the 5 AERO-MS and SCSM models. In this section, we examine the similarities and differences 6 identified in the comparative report, focusing on components related to demand forecasting, fleet 7 composition, and airline operating cost estimation. 8
Both tools can be used to compare future situations, with and without different stringency 9 measures applied. Although the base years for the two models differ, it is possible to generate 10 outputs for comparable future years if the fleet forecasts are adapted accordingly. The major 11 differences identified between the two models (as they relate to airline fleets, air travel demand 12 and operating costs) can be summarized as follows: 13
C.3.1 Fleet and Demand Forecasts 14
Perhaps the biggest difference is that AERO-MS first determines the level of future air travel 15 demand based on economic growth forecasts, by region, and then calculates the number of 16 flights and mix of aircraft required to accommodate all forecast demand for air travel. Based on 17 assumptions of flight length and aircraft utilization, the required future fleet is created. In 18 contrast, SCSM was created to take FESG forecasts as an input to define future fleet size and 19 composition. Using data from the forecasts and from U.S. DOT Form 41 regarding aircraft 20 productivity (flights/year), average stage length, and load factors, the model calculates airline 21 traffic (passenger and cargo carried). 22
The AERO-MS tool is also more comprehensive and detailed in its treatment of fleet 23 composition and the impact of increased costs on aviation demand levels. AERO-MS covers all 24 commercial and non-commercial flights in all aircraft sizes. SCSM is limited to scheduled 25 passenger and cargo flights in aircraft with more than 50 seats. In terms of demand elasticity, 26 AERO-MS allows for variations in passenger elasticity for different route groups and different 27 passenger purposes, whereas SCMS is limited to a single elasticity for passenger and cargo 28 demand. 29
The AERO-MS approach is both more intuitive (demand drives fleet and then operating costs) 30 and more in line with the requirements of APMT for flexibility in the estimation of impacts of 31 different scenarios. The primary input to SCSM is an external fleet forecast, which will 32 inevitably reflect imbedded assumptions concerning the future patterns of air travel demand and 33 airline fleet composition. 34
C.4 Cost Impacts of Measures 35
Both tools assume that the cost changes resulting from supply side measures are borne by the 36 users of air transport through increased fares, leading to some suppression of demand. AERO-37 MS allows the user to specify alternatives for recovering cost increases, such as higher fares, 38 ticket taxes, or en-route emission fees. SCSM does not allow the user as much latitude in 39
APMT Architecture Study 76
selecting alternatives, as it selects the least-cost alternative needed to reach a given abatement 1 target. 2
For the specific area of airline operations and cost estimation, AERO-MS is substantially more 3 detailed, computing both demand and cost impacts for airlines for 14 carrier regions. SCSM does 4 use operating characteristics data (stage length, utilization, etc.), from US DOT Form 41, 5 supplemented by operating data from other cargo and passenger forecasts where available. In 6 contrast, AERO-MS uses operating characteristic data for the global fleet as developed for its 7 Unified Database. Overall, the operating cost model in AERO-MS is substantially more detailed 8 than SCSM, and it is in line with accepted airline operating cost models. In fact, SCSM does not 9 explicitly compute the economic effects of proposed stringencies on airline costs and revenues. 10
The conclusions of the FESG comparative study point out that both tools are capable of 11 providing “reasonable assessments and analytical results” for its purposes, and recommend the 12 use of both models in future analyses. The potential for using both models “in a conjunctive 13 manner” to address both the demand- and supply-side effect and to provide cross-validation is 14 also highlighted. 15
C.5 ACIM – The ASAC Air Carrier Investment Model 16
The ACIM is an aviation-specific tool, developed by NASA and LMI as part of ASAC (Aviation 17 System Analysis Capability) to model the relative advantages of investment decisions in new 18 aircraft technologies by airlines and manufacturers with the objective of understanding the 19 impacts on fleets, fares, and airline traffic (RPMs) [Wingrove, 1998]. The model is split into a 20 series of modules based on operating region (US, Asia, Europe), depending on the available 21 operating cost data. It is an accurate replica of past performance and conditions for the U.S. 22 airline industry. However, its validity for projecting future conditions in the industry depends 23 upon a continuance of these same kinds of economic conditions (circa 1998) in the future. 24
The model utilizes high level economic parameters such as fare yields, population growth, and 25 labor costs to create projections of future air travel demand and airline cost functions. It also 26 accounts for future productivity growth through projections of both human productivity 27 enhancement factors and equipment efficiency gains. Human productivity gains are accounted 28 for through reductions in labor price parameters over time. The model also predicts airline costs 29 using parameters representing the aggregate characteristics of airline fleets and other factors to 30 describe airline networks. The projections of air travel demand and airline costs are then 31 combined to create industry-level forecasts of future revenue passenger-miles, number of aircraft 32 in the US fleet, and airline operating margins. The model is particularly suitable for projecting 33 the economic benefits that could be expected as a result of improvements in equipment 34 efficiency or modifications of operating procedures that might be achieved from the introduction 35 of new technology. 36
The ACIM econometric models are based on a number of databases including the US 37 Department of Transportation's (DOT) Origin and Destination (O&D) data record, airline cost 38 data from DOT Form 41, and Census Bureau data on the economic characteristics of Standard 39 Metropolitan Statistical Areas surrounding 85 major airports. These data were then used to 40 statistically model the air travel demand for each of 26 US passenger air carriers – classified into 41 one of five clusters and two outliers based on the network, aircraft fleet, cost structure, revenue 42 structure, service structure, and underlying productivity of each airline – and their various 43
APMT Architecture Study 77
manifestations through mergers and acquisitions from 1985 to 1995. Similarly, the Form 41 data 1 and other sources provided information for cost models for each of the air carriers. Included in 2 the cost models are each carrier's labor costs, the characteristics of its network, and its fleet 3 characteristics in terms of numbers and size of various aircraft and efficiency factors for each 4 type of aircraft. 5
The European and Asian models were created using data from ICAO’s Digest of Statistics for 6 Commercial Air Carriers and the Penn World Table [Summers and Heston, 1991], supplemented 7 by IATA’s World Air Transport Statistics and Federal Express Aviation Service’s Commercial 8 Jet Fleets. 9
ACIM accurately portrays the historical economic evolution of the airline industry by capturing 10 the data in relatively simple regression models. The user supplies inputs that characterize a future 11 economic supply and demand situation at high levels, and the model projects the airline and 12 aircraft industry economic situation from these inputs, using its econometric models. Hence 13 ACIM is an accurate extrapolator of the historical industry characteristics, which allows a user to 14 explore the consequences of assumed future economic conditions and industry characteristics 15 through judicious choices of input variables. 16
The analysis regarding the aircraft fleet requirements also includes a static analysis whose results 17 compute the aircraft requirements due to replacement demand, and a dynamic analysis whose 18 results compute the aircraft requirements due to new traffic growth. In particular, the effects of 19 stage 2 and 3 noise replacement aircraft have been modeled with extensions to the basic ACIM 20 model. 21
The user inputs consist of a future annual time series of values. These include demand variables 22 such as fare yield, national income, population growth, and unemployment rate, supply variables 23 such as labor, energy, materials, and capital costs, network variables such as stage length and 24 load factor, and capital attributes such as average seats/aircraft, aircraft age, market share of jet 25 aircraft, market share of wide body aircraft. Additionally, airline target operating margins over 26 future time may also be input. 27
The program output consists of future projections of domestic and international travel demand 28 for scheduled passenger air carriers in revenue passenger miles, size of the total fleet in numbers 29 of aircraft, operating margin in percent, and projected airline employment. It also includes 30 estimated impacts on employment in aircraft manufacturing. Operating cost estimates are broken 31 down for the different airline clusters and by airline operating region (US, Asia, Europe). 32
The model has been implemented as a spreadsheet and is available to run as an application 33 program on either Lotus 1-2-3 or Microsoft Excel. ACIM was later adopted for use in Europe 34 and is also available in a European version, Euro-ACIM. 35
ACIM has characteristics that make it potentially attractive for use in capturing the economic 36 impacts of changes in regulations for APMT analysis. Specifically, the explicit modeling of 37 interrelationships between changes in technology, the expected impacts on airline operating costs 38 and fares, and the equilibrium modeling of supply and demand are important capabilities. 39
C.6 ALCCA – Airline Operating Costs 40
This tool has been in use for decades but has been updated regularly, and is available through 41 NASA [Garcia et al., 1999]. Its primary objective is to model aircraft manufacturing costs; it 42
APMT Architecture Study 78
includes calculation of direct and indirect airline operating costs in order to evaluate the 1 manufacturer’s return on investment of new technology aircraft. As part of this process, ALCCA 2 calculates an airline’s return on aircraft investment. 3
ALCCA is not designed to analyze or predict the actual operating mix of aircraft in airline 4 service, but to assist in the analysis of the effects of different technology and design choices on 5 aircraft economics. As such, the airline cash-flow tool calculates revenues, costs, and returns for 6 a single aircraft in service. Typical factors such as: utilization, load factor, and economic mission 7 range are set as inputs. The economic mission is a representative operational mission typically of 8 shorter distance than the design range. These inputs are used to determine the number of 9 passengers, mission block times, and number of flights for a given aircraft over its lifespan. From 10 this data set, costs are calculated. 11
Using operating costs, ALCCA can either calculate the required average yield to obtain a certain 12 rate of return or the rate of return provided by a specific average yield. ALCCA, however, 13 contains no demand forecasting component, nor any inherent ability to fly multiple aircraft types 14 over multiple missions. Further, it does not take into account any economies derived from the 15 operation of several aircraft of a single type. 16
These basic limitations allow the analyst to quickly vary assumptions such as load factor and 17 utilization based upon demand forecasts. This flexibility, plus the inherent capability for 18 scripting, allow for easy integration with other tools. 19
C.7 FATE – Future Aviation Timetable Estimator 20
Developed in 2004 by MITRE and the FAA to assist in modeling efforts to evaluate National 21 Airspace System performance, this model consists of the following components designed to 22 translate passenger demand for air travel into a forecast of aircraft operations, based on existing 23 route networks [Bahdra et al., 2005]: 24
• Origin-destination passenger forecasts 25
• Route choice and allocation of passengers to itineraries and airline routes 26
• Aircraft choice (by airlines) and their assignment to routes 27
• Time of day assignment of passengers to specific airline flights 28
The outputs of the model replicate an Official Airline Guide (OAG) timetable for a future on 29 year time period, including departure and arrival times, departure and arrival airports, aircraft 30 class, aircraft type, and type of operation (passenger vs. cargo). Using observed data for the 31 period 1995-2002, forecast schedules are derived by calibrating the model to the OAG schedule. 32 Flights with both departure and arrival airports in the contiguous United States are forecast based 33 on this demand-driven methodology. The estimated passenger flows are based on a bottom-up 34 demand using local metropolitan variables as opposed to national economic and demographic 35 conditions. The passenger flows are then assigned to specific routes. A complete national 36 quarterly timetable of flights is the result of the use of a multinomial logit model to select a 37 particular aircraft equipment mix, split into 6 categories. In addition, general aviation, cargo, and 38 international flights are created to supplement the timetable using a top-down economic model. 39 The exact scheduled times are a result of taking into consideration passenger flows, equipment 40
APMT Architecture Study 79
mix, and load factors, based on Bureau of Transportation Statistics (BTS) data and current OAG 1 baseline operations. 2
FATE might be useful in projecting future operations for APMT evaluations of stringency 3 options, both for benefits and airline costs. The detailed airline outputs could be used to generate 4 measures of future fleets, routes, operations, and, in turn, operating costs. The detailed nature of 5 the timetable model, however, also means that forecasted operations and schedules for more than 6 a couple years into the future might not produce any more accurate cost estimates than more 7 aggregate modeling approaches. Also, the underlying assumption that airline network structures 8 will remain unchanged becomes more questionable as the analysis timeframe gets longer. The 9 model overall shows good agreement with real schedules by deviating not at all or only one or 10 two flights per day between city pairs. There are some exceptions to that that are primarily found 11 in medium size airports. The individual flight schedules at each airport also show good 12 agreement. The biggest deviations here occur mostly at airports with a large volume of cargo 13 flights. The nature of deviations is not in the total number of flights, but rather in the timing of 14 the cargo flights that occur mostly during the night. 15
C.8 NEMS – The National Energy Modeling System 16
Available through DOE, this tool models the entire supply-side and demand-side of the energy 17 sector and the resulting impacts on the economy, as well as policy changes and their impacts on 18 energy demand and supply. NEMS is used to project the energy, economic, environmental, and 19 security impacts on the United States of alternative energy policies and of different assumptions 20 about energy markets [DOE, 2003]. Projections are made from the present into a future 21 timeframe of 20 to 25 years. 22
NEMS is a modular system divided into four supply modules (oil, gas, coal, and renewable 23 fuels), two conversion modules (refineries and electricity production), and four end use demand 24 modules, representing fuel consumption in the residential, commercial, transportation, and 25 industrial sectors. Furthermore, it contains one module to simulate energy/economy interactions 26 (macroeconomic activity), one module to simulate world oil markets (international energy 27 activity); and one module that provides the mechanism to achieve a general market equilibrium 28 among all the other modules (integrating module). The integrating module also contains an 29 emissions policy module that estimates carbon emissions, while allowing the application of 30 policy options, specifically a carbon dioxide tax, auction of carbon emission permits, and a 31 market for carbon emission permits. 32
The transportation module contains a very simple aviation travel demand sub-module that 33 accounts for aviation fuel demand by forecasting air travel and freight shipment demands – based 34 on GDP, disposable income, and merchandise exports. It applies an aircraft fuel efficiency model 35 that incorporates trends in average fuel efficiency of different aircraft categories over time as 36 new aircraft are introduced into the existing fleet to meet new demand or replace existing 37 aircraft. New aircraft have improved characteristics based on six technology choices that depend 38 on the trigger fuel price, on the time in which the technology is commercially viable, and on the 39 expected efficiency gains. 40
NEMS is available in a version for Windows PCs that uses input and output files. However, due 41 to the high cost of proprietary libraries used for macroeconomic models and optimization in the 42 model, it is not widely used outside of the Department of Energy. 43
APMT Architecture Study 80
Because the fuel demand module is based on forecasts of future air travel demand and airline 1 operations, this tool is relevant to this review. However, the level of detail of NEMS, both in 2 terms of air travel demand and fleet categorization, is almost certainly too low for use in APMT. 3 In particular, the broad assumptions in the demand forecast are lacking the necessary detail. 4 Additionally, the modeled policy choices and technological improvements to aircraft seem 5 incorrect or outdated. 6
C.9 Campbell Hill Cost Model 7
The Campbell Hill Cost Model was designed to assess the cost of noise policy scenarios for cost 8 effectiveness analysis in complement to the MAGENTA global noise tool, which assess the 9 change in population noise exposure. It was used for CAEP\5 analyses. The scope of cost 10 analysis was limited to carriers and manufacturers direct impacts and the model was static with 11 respect to demand. 12
One of the most important features of the Campbell Hill Cost Model is its use of a highly 13 detailed world fleet database. This database exists at the tail number level and contains data on 14 noise and weight characteristics, even including data on hush kit modifications. This was 15 accomplished by beginning with the BACK Aviation Services database and supplementing it 16 with surveys and industry databases. It is also modified to be compatible with FESG assumptions 17 (including operating costs and seat capacity). 18
The model is made up of three components: 19
. the preprocessor, which assembles and grooms the database 20
. the core model, which “simulates the operations, costs and transactions of the world fleet 21 (including fleet additions) for a specific future period” [year, Campbell Hill, p2] 22
. the post processor, which organizes and cleans up the core model's outputs 23
The tools allow for analysis of phase-outs through tracking the elements of the fleet that do not 24 pass noise standards, allowing for recertification, sale to an area or for a use not cover by the 25 noise standard, or sale as scarp, all while keeping track of aircraft that would be naturally retired 26 without the noise policy.27
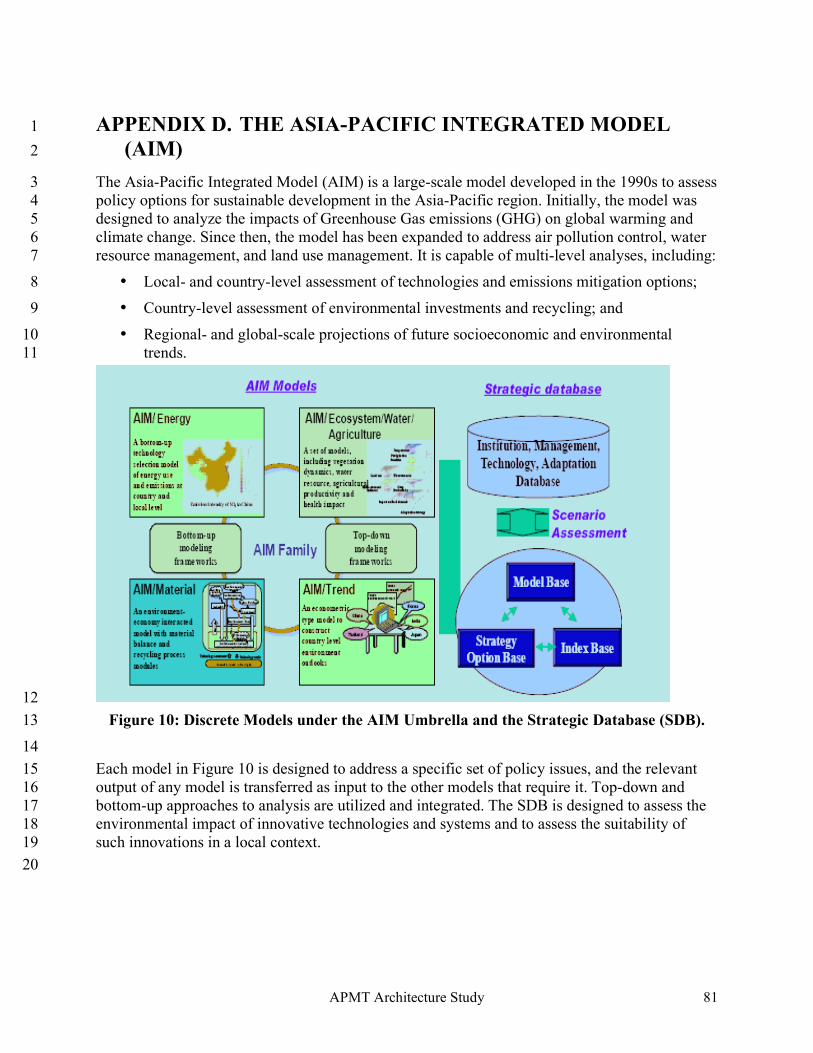
APMT Architecture Study 81
APPENDIX D. THE ASIA-PACIFIC INTEGRATED MODEL 1
(AIM) 2
The Asia-Pacific Integrated Model (AIM) is a large-scale model developed in the 1990s to assess 3 policy options for sustainable development in the Asia-Pacific region. Initially, the model was 4 designed to analyze the impacts of Greenhouse Gas emissions (GHG) on global warming and 5 climate change. Since then, the model has been expanded to address air pollution control, water 6 resource management, and land use management. It is capable of multi-level analyses, including: 7
• Local- and country-level assessment of technologies and emissions mitigation options; 8
• Country-level assessment of environmental investments and recycling; and 9
• Regional- and global-scale projections of future socioeconomic and environmental 10 trends. 11
12
Figure 10: Discrete Models under the AIM Umbrella and the Strategic Database (SDB). 13
14
Each model in Figure 10 is designed to address a specific set of policy issues, and the relevant 15 output of any model is transferred as input to the other models that require it. Top-down and 16 bottom-up approaches to analysis are utilized and integrated. The SDB is designed to assess the 17 environmental impact of innovative technologies and systems and to assess the suitability of 18 such innovations in a local context. 19
20
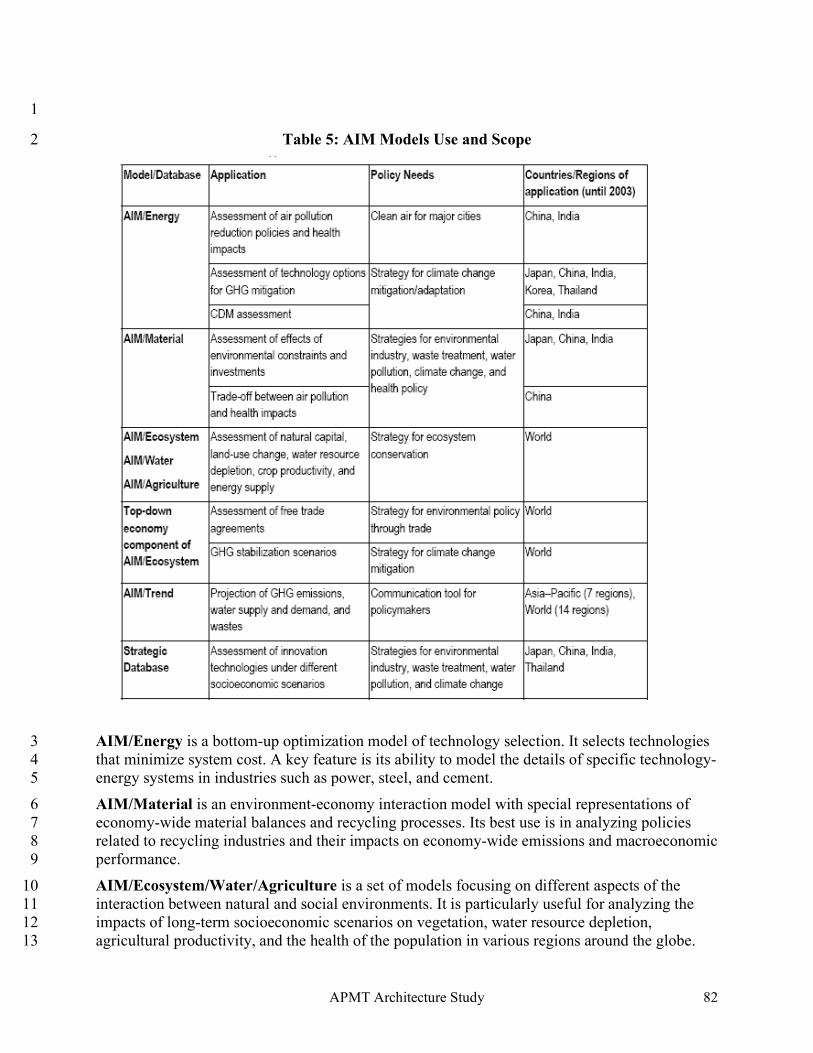
APMT Architecture Study 82
1
Table 5: AIM Models Use and Scope 2
AIM/Energy is a bottom-up optimization model of technology selection. It selects technologies 3 that minimize system cost. A key feature is its ability to model the details of specific technology-4 energy systems in industries such as power, steel, and cement. 5
AIM/Material is an environment-economy interaction model with special representations of 6 economy-wide material balances and recycling processes. Its best use is in analyzing policies 7 related to recycling industries and their impacts on economy-wide emissions and macroeconomic 8 performance. 9
AIM/Ecosystem/Water/Agriculture is a set of models focusing on different aspects of the 10 interaction between natural and social environments. It is particularly useful for analyzing the 11 impacts of long-term socioeconomic scenarios on vegetation, water resource depletion, 12 agricultural productivity, and the health of the population in various regions around the globe. 13
APMT Architecture Study 83
AIM/Ecosystem is explicitly linked to a top-down model representing the long-term, general-1 equilibrium global economy. 2
AIM/Trend is an economic model for projecting environmental trends in different countries. 3 Indices of economy, energy, and environment calculated by AIM/Trend are used for other AIM 4 models. 5
The Strategic Database is designed to analyze strategies for innovative technologies and social 6 systems required for a shift toward environmentally sound industries and lifestyles. 7
This model description was taken from the June 2004 Integrated Environmental Assessment 8 Technical Summary of the Asia-Pacific Environmental Innovation Strategy Project. The 9 summary is available on-line at www.ecosia.org/APEIS/iea/pdf/TS_IEA.pdf . 10
11
12
APMT Architecture Study 84
REFERENCES 1
2
Bhadra, D. et al., 2005. Future Air Traffic Timetable Estimator, Journal of Aircraft, Vol. 42, No. 3 2. 4
Department of Energy (DOE), 2003. The National Energy Modeling System: An Overview 5 2003, Energy Information Administration, Office of Integrated Analysis and Forecasting, 6 Washington, DC. 7
Galloway, T. L., 2001. Aircraft Manufacturing and Airline Operating Cost Model. 8
Galorath, 2005. SEER Tools Overview URL http://www.galorath.com/tools_overview.html 9 [accessed July 15th, 2005] 10
Garcia, E., Marx, W., Mavris, D. N., 1999. ALCCA User Notes, Aerospace Systems Design 11 Laboratory, Atlanta, GA. 12
Gillen, D.W., W.G. Morrison and C. Stewart, 2003. Air travel demand elasticities: concepts, 13 issues and management, Department of Finance, Government of Canada. 14
Hancox, R. and S. Lowe, 2000. Aviation Emissions and Evaluation Reduction Options (AERO - 15 Air Transport Demand and Traffic Model (ADEM). 16
International Civil Aviation Organization Committee on Aviation Environmental Protection 17 (ICAO CAEP), 2004a. Forecasting and Economic Support Group (FESG) Meeting, Comparative 18 Study of AERO-MS and SCSM, CAEP/6-IP/28, Montreal, February 2004. 19
International Civil Aviation Organization, Committee on Aviation Environmental Protection, 20 (ICAO-CAEP), 2004b. CAEP/6-IP/28 Appendix A, Report of the FESG/CAEP/6 Traffic and 21 Fleet Forecast (Forecasting Sub-Group of FESG) Montreal, February 2004. 22
International Society of Parametric Analysis and Society of Cost Estimating and Analysis 23 (ISPA/SCEA), 2003. Joint Industry/Government Estimating Community Parametric Estimating 24 Handbook (3 Edition) Spring 2003 URL http://www.ispa-25 cost.org/PEIWeb/Third_edition/newbook.htm [accessed July 15th, 2005] 26
Joint Planning and Development Office (JPDO), 2004. Next Generation Air Transportation 27 System Integrated Plan, http://www.jpdo.aero/site_content/ [accessed May, 2005] 28
Lee, J. J., Lukachko, S. P., Waitz, I. A., and Schafer, A., 2001. “Historical and Future Trends in 29 Aircraft Performance, Cost and Emissions,” Annual Review of Energy and the Environment, 30 Volume 26. 31
Markish, J. Valuation Techniques for Commercial Aircraft Program Design, 2002. Master of 32 Science in Aeronautics and Astronautics Thesis, Department of Aeronautics and Astronautics. 33
APMT Architecture Study 85
National Aeronautics and Space Administration (NASA), 2004. NASA Cost Estimating 1 Handbook 2004 URL www.ceh.nasa.gov [accessed July 15th, 2005] 2
National Aeronautics and Space Administration (NASA), 2005. NASA Cost Estimating Website 3 2005 NASA cost Analysis Symposium New Orleans, Louisiana April 12, 2005 URL 4 http://www1.jsc.nasa.gov/bu2/conferences/NCAS2005/index.htm [accessed July 15th, 2005] 5
Partnership for Air Transportation Noise and Emissions Reduction (PARTNER), 2005. 6 Requirements Document for the Aviation Environmental Portfolio Management Tool (APMT) 7 Available upon request from FAA-AEE. 8
Price Systems L.L.C., 2005. Price-H Product Overview URL 9 http://www.pricesystems.com/productservice/priceh.html [accessed July 15th, 2005] 10
Office of Management and Budget (OMB), 2004. OMB Circular A-4, 11 http://www.whitehouse.gov/omb/circulars/a004/a-4.html. 12
Summers, R. and A. Heston, 1991. The Penn World Table (Mark 5.0): An Expanded 13 Set of International Comparisons, 1950–1988. Quarterly Journal of Economics, 14 Vol. 106, pp. 327–368. 15
Tecolote Research Inc., 2005. Automated Cost estimating Integrated Tools – Automated Cost 16 Estimator URL http://www.aceit.com/Pages/Products/ProductPage.aspx?id=980b0e77-e694-17 43ed-b468-03a9e54dd4a9 [accessed July 15th, 2005] 18
Transportation Research Board (TRB), 2005. Letter Report, Workshop #3, FAA AEDT and 19 APMT, Transportation Research Board, January 31 – February 2, 2005, Washington, D.C. 20
Wingrove, E. R., et al., 1998. The ASAC Air Carrier Investment Model(Third Generation), 21 NASA/CR-1998-207656. 22