Embed Size (px)
Citation preview
logistics
Article
Archetypes of Supply Chain AnalyticsInitiatives—An Exploratory Study
Tino T. Herden * ID and Steffen Bunzel
Technische Universität Berlin, Straße des 17. Juni 135, 10623 Berlin, Germany* Correspondence: [email protected]
Received: 27 March 2018; Accepted: 2 May 2018; Published: 8 May 2018�����������������
Abstract: While Big Data and Analytics are arguably rising stars of competitive advantage,their application is often presented and investigated as an overall approach. A plethora of methodsand technologies combined with a variety of objectives creates a barrier for managers to decide howto act, while researchers investigating the impact of Analytics oftentimes neglect this complexitywhen generalizing their results. Based on a cluster analysis applied to 46 case studies of SupplyChain Analytics (SCA) we propose 6 archetypes of initiatives in SCA to provide orientation formanagers as means to overcome barriers and build competitive advantage. Further, the derivedarchetypes present a distinction of SCA for researchers seeking to investigate the effects of SCA onorganizational performance.
Keywords: supply chain analytics; business analytics; cluster analysis
1. Introduction
Even before data got their mainstream reputation of being the “new oil” of the 21st centurypredestined to shape the digital economy [1], the potential competitive advantages through dataanalytics had already been recognized [2]. To remain with this analogy, data analytics represents therefinery process turning raw data into competitive strength. Analytics in itself is not a leading-edgeinvention, but increased attention was recently triggered by developments in information technology(IT) providing new access to data, organizations’ need for better and faster decision making and recentbig data and machine learning tools enabling new levels of insight for decision makers [3]. The fieldof Logistics and Supply Chain Management (LSCM), has been identified as one early adopter anda long-term user of Analytics [4]. LSCM has been employing operations research approaches fordecades und uses purpose-specific analytics tools for very particular problems. As it is concerned witheffectively integrating suppliers, manufacturers, warehouses, and stores, such that merchandise willbe produced and distributed to the customer with a satisfying service level and with minimal costs inthe right manner concerning time, location and quantity [5], the necessity for analytical approaches toachieve these efficiency goals is inevitable. A recent industry report underlines the long-term dataaffinity of the LSCM sector from a practical point of view and the potential of logistics operationsgenerating the amounts of data needed to create value by using Analytics [6]. However, the reportemphasizes untapped potential in improving operational efficiency, customer experience or creatingnew business models in the sector. The fit of LSCM and Analytics is favorable since the satisfaction ofcustomer needs and requirements is a leading theme in LSCM ([7] p. 12) and the meaningful insightprovided by Analytics is used to ensure rules and workflows strengthening satisfaction of needs andrequirements [8].
Scholars and practitioners alike have provided evidence that advantages to performance can beachieved from the domain specific use of Analytics, which was termed “Supply Chain Analytics” [9,10].In research, several authors have investigated the effects of Supply Chain Analytics. Information
Logistics 2018, 2, 10; doi:10.3390/logistics2020010 www.mdpi.com/journal/logistics
Logistics 2018, 2, 10 2 of 20
system supported Analytics capabilities have been indicated to improve LSCM performance [11] andAnalytics tends to have a positive impact on LSCM performance with high dependency on the fit ofAnalytics investment and LSCM process maturity [12]. The positive effect of Analytics on LSCM wasfurther suggested as context contingent, especially on planning processes [13]. Schoenherr andSpeier-Pero [14] provide a wide variety of perceived benefits including improved supply chainefficiency and decreased supply chain costs. Furthermore, several scholars call for more research onthe topic [15,16].
On the practitioners’ side, industry reports have shown high expectations towards Analyticsin LSCM, especially for reducing inventory, risk and improving batch sizes. Among others,better customer service, higher efficiency and faster reaction to supply chain issues based oninvestments in Analytics have been reported [17]. Furthermore, the development of morecustomer-oriented value chains with lower logistics costs due to the rise of data and Analytics has beensuggested [18]. However, investments are somewhat reluctant [19] and industry reports show thatonly a few firms achieve excellent performance in Analytics concerning LSCM [20]. The majority offirms is lagging or struggling with Analytics in LSCM [21] with managers reporting missing experienceand lack of knowledge of how to apply Analytics [22].
In the studies summarized above, Analytics is customarily considered as one overall conceptwhile making conclusions on it or deriving potential value and utility although single examples withindividual issues and diverse analytical techniques are considered. Especially single examples areused to highlight Analytics providing benefits [11] or savings [21] thereby projecting the exemplarybenefits to Analytics as a general concept or overall approach. What remains unknown are thedifferent outcomes of different approaches in relation to their intentions and execution. Analytics isusually not subdivided further although it presents a wide field with different objectives, orientations,and perspectives without a unified definition [9]. In our view, it is too wide of a field to assume that allreported effects can equally be applied on different Supply Chain Analytics initiatives, all initiativeshaving the same potential of providing value for an organization or all barriers appearing couldbe overcome in a single manner. The sole attempt to subdivide Supply Chain Analytics in extantresearch can be found in the framework for Analytics applications in LSCM [23], which focuses onoff-the-shelf IT Systems and therefore ignores important aspects of Analytics as well as initiativeswhich are not system-specific. To derive more sophisticated and reliable research conclusions onthe effects of Analytics on LSCM, a distinction of Supply Chain Analytics approaches is needed.We propose a distinction of how organizations apply Supply Chain Analytics, by using clusteringon 46 case studies on Supply Chain Analytics initiatives considering intended problem to be solved,execution, techniques, and the resulting Analytics solution. Thus, this research investigates patterns inthe activities of organizations applying Analytics to business problems in LSCM and explores theirendeavors and motivation to form archetypes of initiatives with exclusive characteristics. The outcomeof the initiatives as well as alignment of outcome and intention is out of scope for research. RegardingMacInnis Framework of conceptual contributions, the goal of this study is differentiation [24]. Thus,we will indicate how the identified archetypes are different, why this differentiation matters, and howthey can be used further. The study is based on publications about manufacturing firms, retailersand logistics service providers applying Analytics in LSCM. The research questions therefore states:How can Supply Chain Analytics initiatives be distinguished?
The obtained archetypes can provide guidance to managers for their individual issues, and pointsof references of other organizations’ previous activities, and thus, reduces barriers to adopt SupplyChain Analytics in their own organization. The archetypes represent types that are designed to bemost different from each other to support learning of managers and students about Supply ChainAnalytics. However, the combination of characteristics of different archetypes in the creation phaseof a new initiative in an organization is not relegated but rather encouraged with an individual andspecific goal and approach to be designed by the executing manager. For researchers, the archetypesform a framework to investigate the different effects of varying approaches.
Logistics 2018, 2, 10 3 of 20
The remainder of the article is structured as follows: Section 2 provides a theoretical backgroundwith the objective to explain the characteristics chosen to form the archetypes. Section 3 presentsthe methodology on how archetypes are formed using cluster analysis. Section 4 explains thesuggested archetypes and discusses their impact. Section 5 concludes the article and Section 6 providesfinal remarks.
2. Theoretical Background
In this section, we will summarize Analytics, Supply Chain Analytics, and characteristics ofSupply Chain Analytics initiatives.
2.1. Analytics
Due to its novelty and evolving nature, a wide variety of definitions of Analytics exists.Holsapple et al. ([9], p. 134) reviewed many of them to develop a collective definition statingthat Analytics is “concerned with evidence-based problem recognition and solving that happenwithin the context of business situations”. This definition highlights two specific aspects of Analytics.The first aspect, problem recognition, indicates the experimental part of Analytics to achieve a goalwhich is uncertain and unclear in the beginning requiring further exploration [25], and thus identifyingwhat the actual problem is. The second aspect, problem solving, indicates that the value of Analyticsis solely provided if a model or application is deployed and used [25]. This aspect of Analytics isemphasized prominently in the literature, often specified as making decisions and taking actions(e.g., [2,8,26,27]). Both aspects establish a clear distinction from data aggregation initiatives such asdashboards and reports.
Davenport and Harris [2] presented the benefits of applying Analytics to improve internalprocesses or an organization’s competitive position. They illustrated that achieving success withAnalytics is not based on deploying software but rather on three categories of factors: organizational,human, and technological capabilities. Organizational capabilities consider analytical objectives andprocesses, human capabilities consider skills, sponsorship and culture, and technological capabilitiesconsider data availability and Analytics architecture. While the models and software are often in thefocus of research in Analytics due to apparent presentation of insight into the specific opportunitiesof Analytics, scholars highlight all three stated capabilities as critical to develop and successfully usemodels and software [8,28].
The models and software used in Analytics are commonly distinguished as being descriptive,predictive, or prescriptive (e.g., [9,23,29]). The meaning of descriptive analytics is twofold. On theone hand, it presents the summary of data to report and monitor [23]. On the other hand, it describesroot cause analysis used to gain insights about the underlying phenomenon or process [30,31].Predictive analytics estimates unknown values based on known examples. Prescriptive analyticsdetermines and, in some cases, subsequently automates actions or decisions to achieve an objectivegiven current and projected data, requirements and constraints.
Due to recent technological advances, Analytics gained additional interest as “Big Data Analytics”,referring to Analytics performed with Big Data, which has been reported to have a positive impacton firm performance [32]. Big Data originates in data management issues with technology in theearly 2000s due to high volume, velocity, or variety of data [33], which formed the original three“V’s” of Big Data. Big Data is momentarily under frequent academic investigation including anincrease of “V’s” (e.g., [32,34,35]) considering several issues with Big Data beyond the aspects ofdata management and without the need for advanced technologies such as distributed storage andprocessing, such as Variability, Veracity, Visualization or Value. However, three “V’s” is a leadingtheme [14–16,26,28,30,36].
Logistics 2018, 2, 10 4 of 20
2.2. Supply Chain Analytics
Like Analytics, no unified definition of Supply Chain Analytics (SCA) exists, while rarely one isproposed. Souza ([10], p. 595) describes it as “focus[ing] on the use of information and analytical toolsto make better decisions regarding material flows in the supply chain”. Waller and Fawcett ([15], p. 79)propose a definition while describing the field as (L)SCM data science: “( . . . ) is the applicationof quantitative and qualitative methods from a variety of disciplines in combination with (L)SCMtheory to solve relevant (L)SCM problems and predict outcomes, taking into account data qualityand availability issues.” Incorporating aspects of both descriptions and the definition of Analytics [9],we propose to define SCA as follows: SCA is concerned with evidence-based problem recognition andsolving within the context of logistics and supply chain management situations.
Consequentially, SCA is neither a single and clear step-by-step approach to solve supply chainproblems nor limited to certain tasks and processes in LSCM. Souza [10] systemizes and distinguishesseveral techniques by the type of Analytics and the SCOR processes affected. The origin of thelist of techniques is not explained and it is not exhaustive. Furthermore, another attempt onsystemization results for an investigation on in-memory technology used in LSCM by groupingin-memory software applications for LSCM and designing a framework for analytical applications [23].By considering the type of Analytics applied, whether the concept is data driven or model driven andmethodological requirements, off-the-shelf software applications with analytical capabilities used forLSCM functionalities were grouped into monitor-and-navigate, sense-and-respond, predict-and-act,and plan-and-optimize. However, this categorization ignores objectives, organizational aspects,and human aspects. Finally, examples of potential applications of Analytics in LSCM were summarizedfrom the perspectives of the user and the tasks [15]. In summary, scholars have stretched a widerange of applications of SCA with various use cases for different functionalities and users, providingevidence that SCA is too complex to evaluate its impact as a general concept.
The generalization has further impact on managers by creating barriers, which we want to addresswith this study. Thus, this research focuses on barriers related to a missing understanding of howto apply SCA on individual problems of an organization and substantiate relevant SCA initiatives.Sanders [28] provides an extensive overview on barriers of Analytics in the context of LSCM andpresents several barriers of which the following are related to the interest of this research. First,managers, especially in leadership positions, may not see the value provided by Analytics resultingin missing vision, understanding of the full capacity and how to change the organization to applyAnalytics successfully. Second, so called analysis paralysis hinders organizations from applyingAnalytics because they cannot handle the overwhelming opportunities, the speed of technologicalchange what results in the inability to define a starting point. Organizations may thus try to randomlyanalyze data for some eventual causation, some business units may optimize their sub processeswith little global effect or organizations try to measure everything at once without understandingwhat to focus on. Third, instead of experiencing a lack of data, many organizations drown in data.Besides technological issues to handle these amounts of data, organizations do not know how toleverage the existing data capability and how to base decisions on it.
2.3. Dismantling Supply Chain Analytics Initiatives
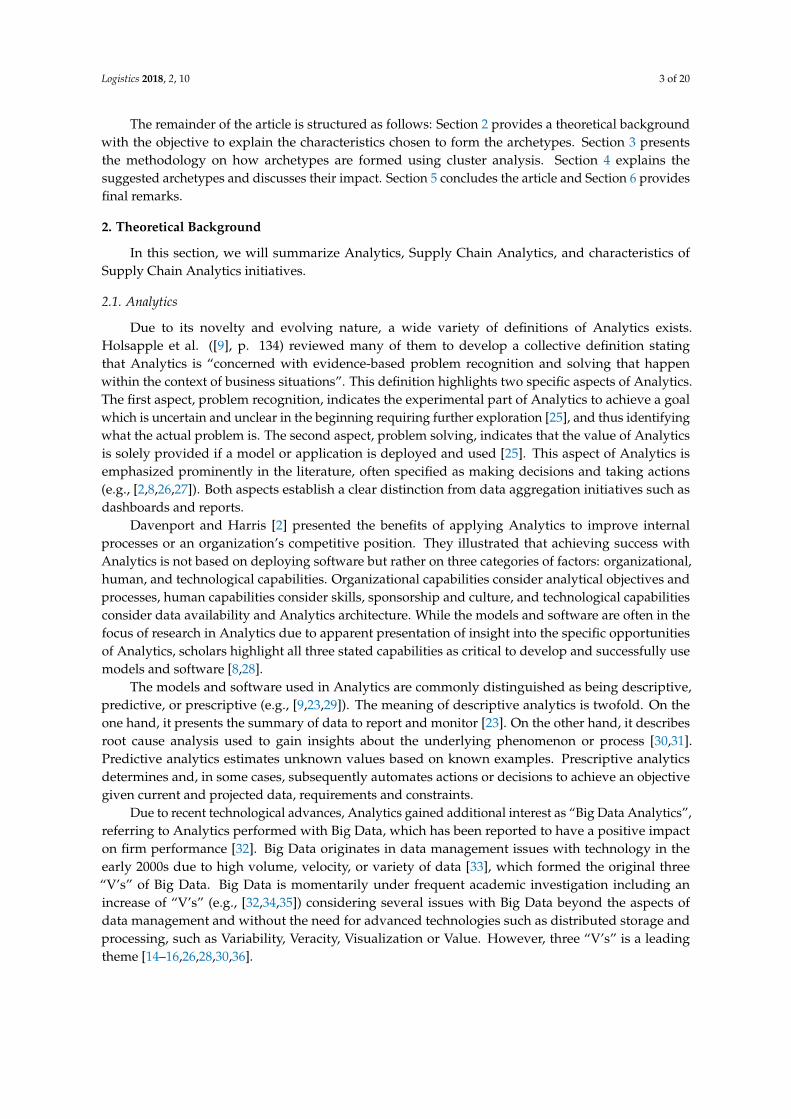
This subsection describes the characteristics used to analyze SCA initiatives to form archetypes.We identified 34 characteristics in an extensive review of Analytics literature which are presented insix categories. The characteristics and categories are presented in Figure 1. Drawing on Chae et al.(2014) [13], we consider SCA initiatives as (one time) projects aiming to achieve supply chain objectivesusing evidence-based problem solving and recognition with a focus on inducing process redesign,tool development or long-term process changes such as automation or continuing decision support.
Logistics 2018, 2, 10 5 of 20
Logistics 2018, 2, x FOR PEER REVIEW 5 of 19
Figure 1. Characteristics of a Supply Chain Analytics initiative.
First, the reasoning behind any initiative should be a shortcoming in a supply chain objective (SCO). Either because there is a deficiency in comparison to the theoretic potential or because higher performance is aspired. In the literature, several frameworks of performance dimensions indicating supply chain objectives are proposed [37–40] without one being unanimously accepted. Several operational metrics reappear in most frameworks we investigated, but the categorization differs tremendously. The following objectives have been elaborated based on a review of these frameworks: cost (SCO1), quality (SCO2), time (SCO3), flexibility (SCO4), sustainability (SCO5), innovativeness (SCO6), customer relationship (SCO7) and supplier reliability (SCO8).
Second, we return to the concept of core capabilities of an analytics competitor: organization, humans, and technology. The organizational aspects can be represented by the analytics objective (AO) of an analytics initiative. In accordance with Manyinka et al. [41] and Holsapple et al. [9] we identified six analytics objectives. Based on evidence-based approaches these include the creation of transparency by democratizing data (AO1), the identification of root causes by experimentation (AO2), the evaluation of business performance and environment (e.g., efficiency or risk assessment) (AO3), the segmentation of populations (including products and services) (AO4), the support and replacement of human decision making (AO5), and the development and innovation of new sources of revenues (e.g., business models, products or services) (AO6). In a given initiative, the fulfilment of one objective can be necessary to pursue a consecutive objective. For example, a transparent business process may be necessary for further analytics approaches leading to supported decision making.
Third, going forward with analytics capabilities, the human involvement (HUM) in a specific initiative can be incorporated by distinguishing the business functions bringing expertise into the initiative. Considering Davenport and Harris [2], Bose [8] and Dietrich et al. [42] we identified several specific roles in analytics initiatives (e.g., several roles from providing access to data to the data management as well as business function from user to sponsor of the initiative) which can both be internal to the organization or externally contracted. We aggregated the roles leading to three groups and six roles: internal analytics expert (HUM1), external analytics expert (HUM2), internal IT expert (HUM3), external IT expert (HUM4), internal business process expert (HUM5), external business process expert (HUM6). As we have seen in our analysis, external and internal expertise is not
Supply Chain Objective(SCO1) Cost(SCO2) Quality(SCO3) Time(SCO4) Flexibility(SCO5) Sustainability(SCO6) Innovativeness(SCO7) Customer relationship(SCO8) Supplier reliability & risk
Analytics Objective(AO1) Transparency(AO2) Root cause identification(AO3) Evaluation of performance and
environment(AO4) Segmentation(AO5) Support of human decision-making(AO6) New source of revenue
Human involvement (HUM1) Internal Analytics experts(HUM2) External Analytics experts(HUM3) Internal IT experts(HUM4) External IT experts(HUM5) Internal process experts(HUM6) External process experts
Technology(TEC1) Spreadsheet software(TEC2) Statistical software(TEC3) Specific algorithms(TEC4) Purpose-built data storage(TEC5) Non-purpose-built data storage(TEC6) Virtualization
Type of Analytics(TA1) Descriptive Analytics(TA2) Predictive Analytics(TA3) Prescriptive Analytics
Data Management(DAT1) High Velocity(DAT2) High Volume(DAT3) High Variety(DAT4) Internal data(DAT5) External data
Supp
ly C
hain
Ana
lytic
s in
itiat
ive
Figure 1. Characteristics of a Supply Chain Analytics initiative.
First, the reasoning behind any initiative should be a shortcoming in a supply chainobjective (SCO). Either because there is a deficiency in comparison to the theoretic potential or becausehigher performance is aspired. In the literature, several frameworks of performance dimensionsindicating supply chain objectives are proposed [37–40] without one being unanimously accepted.Several operational metrics reappear in most frameworks we investigated, but the categorizationdiffers tremendously. The following objectives have been elaborated based on a review of theseframeworks: cost (SCO1), quality (SCO2), time (SCO3), flexibility (SCO4), sustainability (SCO5),innovativeness (SCO6), customer relationship (SCO7) and supplier reliability (SCO8).
Second, we return to the concept of core capabilities of an analytics competitor: organization,humans, and technology. The organizational aspects can be represented by the analytics objective(AO) of an analytics initiative. In accordance with Manyinka et al. [41] and Holsapple et al. [9] weidentified six analytics objectives. Based on evidence-based approaches these include the creation oftransparency by democratizing data (AO1), the identification of root causes by experimentation (AO2),the evaluation of business performance and environment (e.g., efficiency or risk assessment) (AO3),the segmentation of populations (including products and services) (AO4), the support and replacementof human decision making (AO5), and the development and innovation of new sources of revenues(e.g., business models, products or services) (AO6). In a given initiative, the fulfilment of one objectivecan be necessary to pursue a consecutive objective. For example, a transparent business process maybe necessary for further analytics approaches leading to supported decision making.
Third, going forward with analytics capabilities, the human involvement (HUM) in a specificinitiative can be incorporated by distinguishing the business functions bringing expertise intothe initiative. Considering Davenport and Harris [2], Bose [8] and Dietrich et al. [42] we identifiedseveral specific roles in analytics initiatives (e.g., several roles from providing access to data to thedata management as well as business function from user to sponsor of the initiative) which canboth be internal to the organization or externally contracted. We aggregated the roles leading tothree groups and six roles: internal analytics expert (HUM1), external analytics expert (HUM2),internal IT expert (HUM3), external IT expert (HUM4), internal business process expert (HUM5),external business process expert (HUM6). As we have seen in our analysis, external and internal
Logistics 2018, 2, 10 6 of 20
expertise is not mutually exclusive. Depending on the complexity of the initiative, organizationscombine available expertise in various forms to achieve success.
Fourth, for the technological (TEC) aspects and final capabilities the infrastructure can be a majorbarrier [28]. However, Davenport and Harris [2] direct the focus on tools and analytics architecture.They identify small and short initiatives done with spreadsheet software (TEC1) which can be appliedby analytical amateurs. Analytical professionals however will either use statistical software (TEC2)for experimental purpose or define and refine specific analytical algorithms (TEC3) building new andoften purpose-specific tools. We distinguish the last two, since this algorithm might be bought from athird-party vendor. On the other hand, Davenport and Harris [2] discuss the importance of data storageand access. However, since their initial work, the field has seen significant developments. Opposed tostatistical software models gathering data from existing systems or sending it to a third-party to executethe analytics methods, the classical mode is a newly purpose-built data storage (TEC4). Recently,the concept of a non-purpose-built data store to gather data from (TEC5) is emerging following theidea of creating a single storage for analytical purposes to be defined later. This concept is often called“Data Lake” [43]. Finally, the concept of virtualization, as prominently known due to cloud computing,allows access to analytical methods and results disconnected from the actual data infrastructure (TEC6),e.g., with mobile devices [44].
Fifth, data management (DAT) for analytical purposes can face serious challenges demandingsupplementary effort [33]. As explained above, the big data concept represents serious datamanagement challenges, which we have thus incorporated into the evaluation. This includes ahigh velocity of data (DAT1) being analyzed or collected, a high volume of data (DAT2) to be includedin Analytics and a variety of data sources, data structures and data semantics (DAT3). Further,besides internal data (DAT4), managers are supposed to be creative about the inclusion of externaldata (DAT5) sources [27].
Sixth, reconsidering the works of Hahn and Packowski [23], and Holsapple et al. [9], the type ofanalytics (TA) can be descriptive (TA1), predictive (TA2), prescriptive (TA3) or several of them at oncedue to chaining or combination.
As mentioned in the introduction, the initiative’s outcome has been neglected in theanalysis process. The outcome, which is presented in a percentage or absolute value for savingsor improvements in a monetary value, time or quantity is highly dependent on the individual case,organization, and industry. Thus, it was not considered meaningful for the derivation of archetypes.Additionally, this research aims to recognize what organizations aspire, the intention and theconsequential execution in a qualitative manner. Quantitative outcomes do not fit this aim. We furtheromitted firm size and organizational form, since our interest is in the initiatives presented bysingle projects, which can be a relative small size compared to the size of the organization dueto the intention to solve a small problem.
No characteristic described above is mutually exclusive and some will correlate since the presenceof one characteristic may likely demand the presence of another.
3. Methodology
To identify SCA initiative archetypes, we used the machine learning method of clustering.Clustering is a descriptive or explorative data analysis technique which relies on interpretationby the analyst based on insight into the original data [45]. This fits MacInnis [24] requirement to useanalytical reasoning for facilitating the aspired differentiation. Below, we present the data collection,analysis, and evaluation process.
3.1. Data Collection
Since this research considers case studies from organizations, research databases did notprovide a sufficient source. Based on the insight we gained from the publications presentedabove we used key words and synonyms of Analytics (“Data Science”, “Business Intelligence”,
Logistics 2018, 2, 10 7 of 20
“Big Data” or “Data Mining”) as well as Analytics Objective (see Section 2.3) in combination withLSCM (“transport*”, “operation management”, “deliver*”, “value chain”, “warehous*”, “supplier”,“resource planning”, “inventory”, “material flow”, “product handling”, “distribut*”, “shipping”) toconduct an extensive search via the google search engine (with customized search results deactivated).Besides case studies from organizations, we identified several third-party websites, software andsolution vendors and organizations applying Analytics, as well as news websites, expert websites,and blogs which we further used for snowball sampling. Finally, we approached organizations forcases. In total, we identified a shortlist of 49 Initiatives with promising information richness to evaluatetheir characteristics.
3.2. Data Analysis
To identify archetypes, we looked at previous research similar to our intent. (L)SCM archetypesaimed at providing managers with understanding of organizational adaptation and performanceevaluation have been identified by non-hierarchical clustering on supply chain IT and organizationalstructure variables [46]. The variables were collected via a survey including variables such as B2Be-commerce supply chain integration, ERP applications, operational centralization as well as marketand financial performance. Supply chain integration archetypes were investigated to understandthe relationship between integration and performance and to provide parsimonious descriptionsuseful for discussion, research, and pedagogy as well as to reveal insight into the underlyingstructure [47]. Survey-based collection of variables of customer integration, supplier integration,internal integration, business performance and operational performance and the data analysis withhierarchical and subsequent non-hierarchical clustering determined the archetypes. The authorsbriefly describe five archetypes with three balanced integration archetypes and two customer-leaningintegration archetypes in different nuances. LSCM job type archetypes were deviated from collectedjob descriptions from a major employment website to provide suggestions on how training andprofessional development should occur [48]. Text analysis was used to mechanically code thejob descriptions and hierarchical cluster analysis using Ward’s method was applied to identifyeight archetypes. Concluding, clustering has proven as research method in LSCM to identify archetypeswith the method adapted to the individual dataset. Thus, focusing on clustering as the method for ourresearch is supported by previous LSCM research.
We used the 34 characteristics of SCA initiatives discussed above as binary measures tosystematically describe the found initiatives. Two researchers coded the cases independently. The caseswere coded from the perspective of the analytics result’s final user and with the supply chain objectivefocused on the value creation process. If a case provided inconclusive evidence for a variable,the information was sought from the organization or the case was rejected. Thus, three of theshortlisted case studies were rejected. Both researchers discussed the coding regularly to alignthe interpretation of the variables. After coding, each difference was discussed and resolved byconsensuses. The researchers calculated Cohen’s Kappa as 0.65 [49], indicating a substantial agreementon the scale of Landis and Koch [50].
As the collected data is binary, common methods to determine dissimilarities between two objectssuch as computing the Euclidean or Manhattan distances cannot be employed. To deal with this typeof the data, the approach proposed by Kaufman and Rousseeuw [45] building on an adapted versionof the similarity coefficient defined by Gower [51] was used to calculate the dissimilarity matrix.All variables were treated as asymmetric binary as they did not represent the presence or absenceof a characteristic but the presence and non-presence due to missing evidence for presence [52],thus leading to adaptions of the distance measurement. We used the statistical software ‘R’ to performthe clustering and its evaluation.
We decided for hierarchical clustering due to the advantage of visually inspecting theagglomerations via a dendrogram. We tested UPGMA, Ward’s method, complete linkage and WPGMAand evaluated the dendrograms by outlier influence due to late agglomerations of single observations.
Logistics 2018, 2, 10 8 of 20
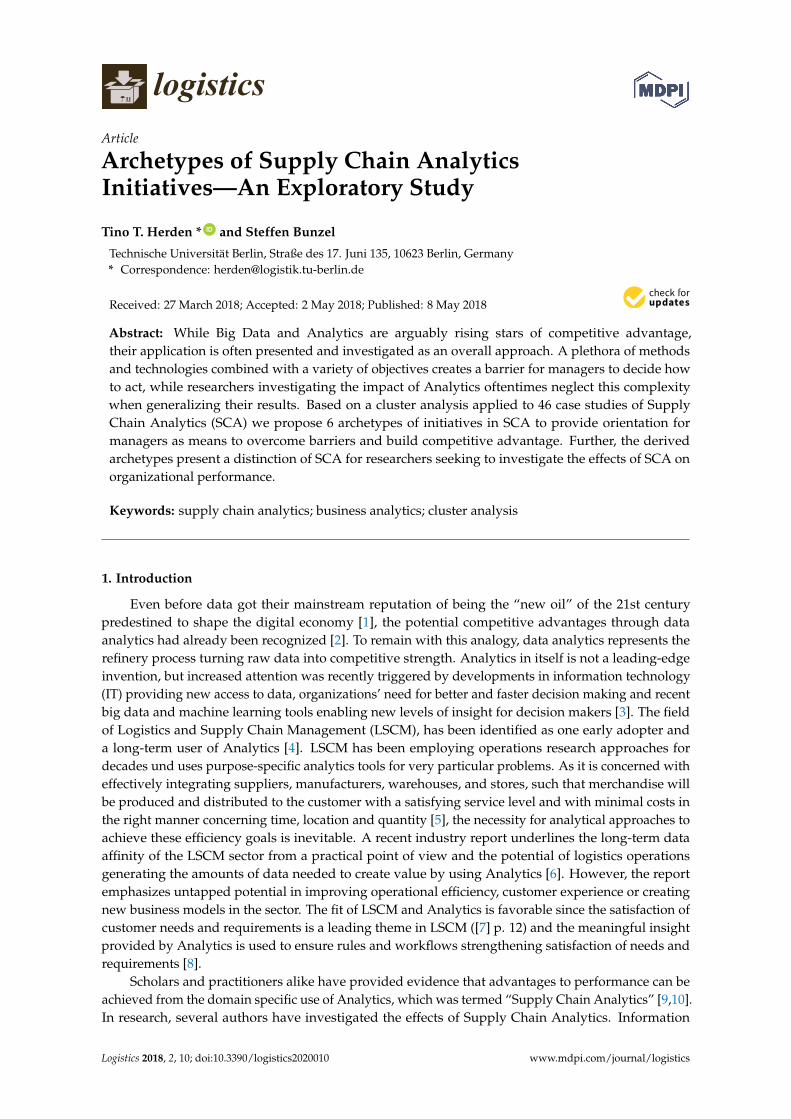
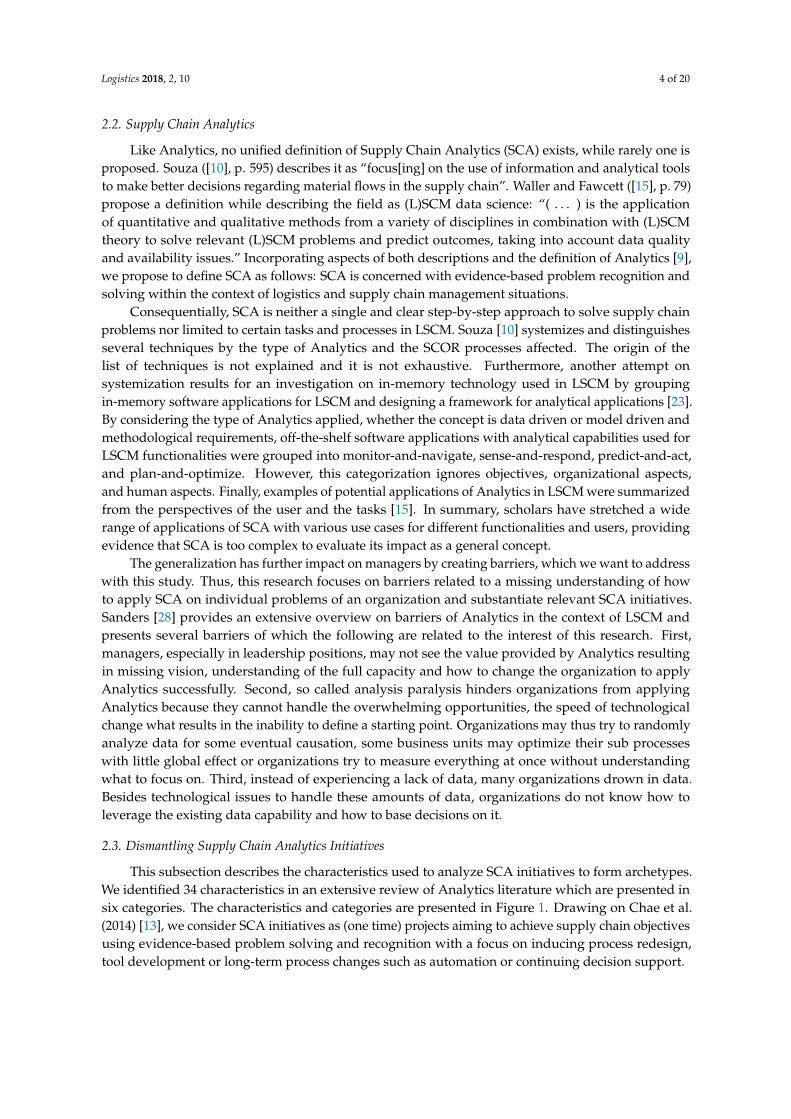
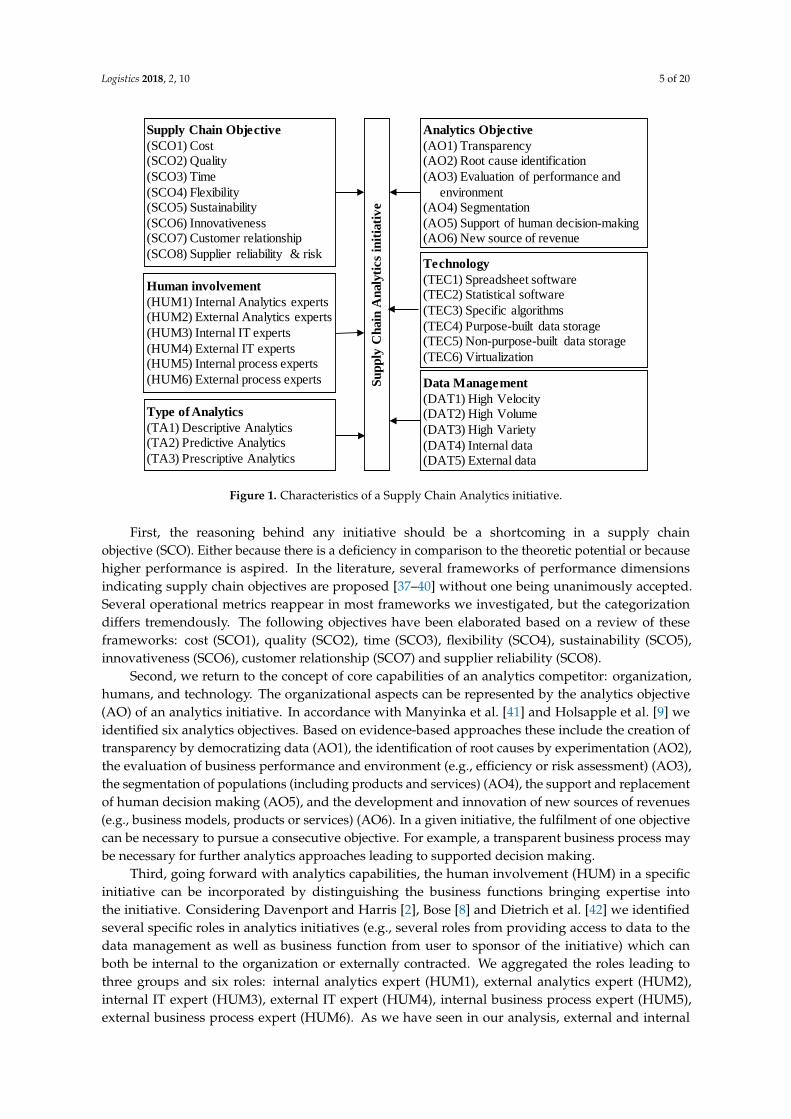
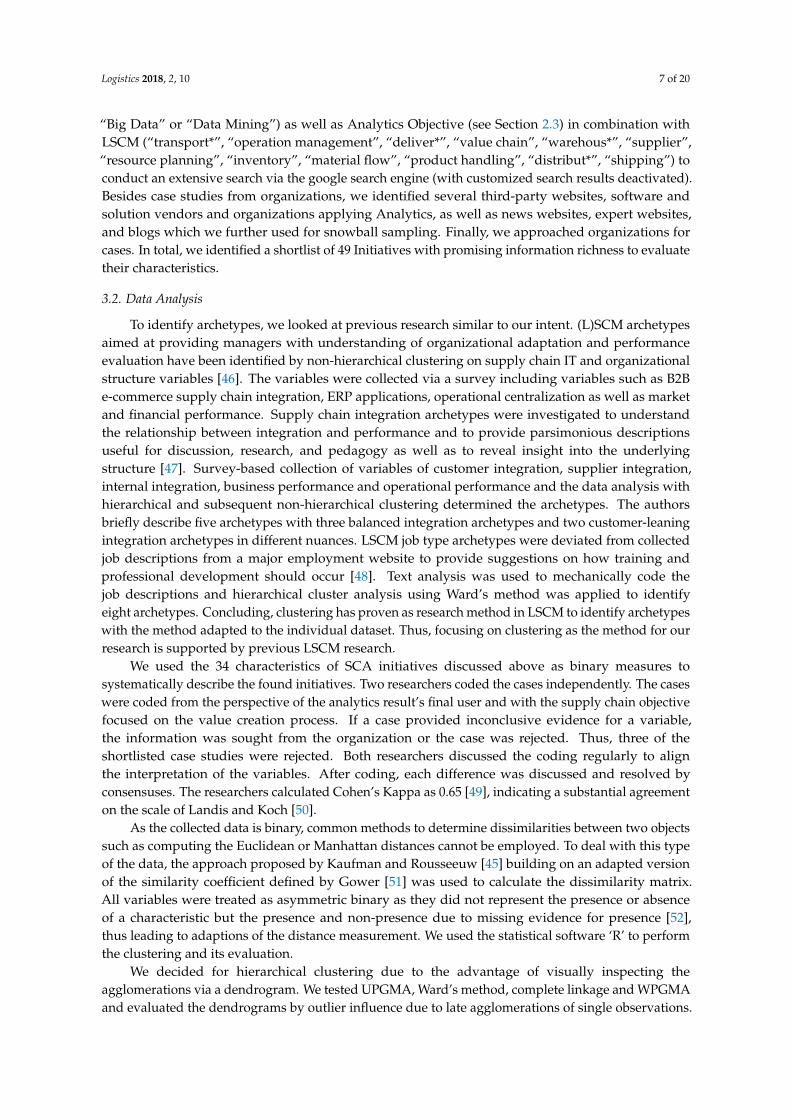
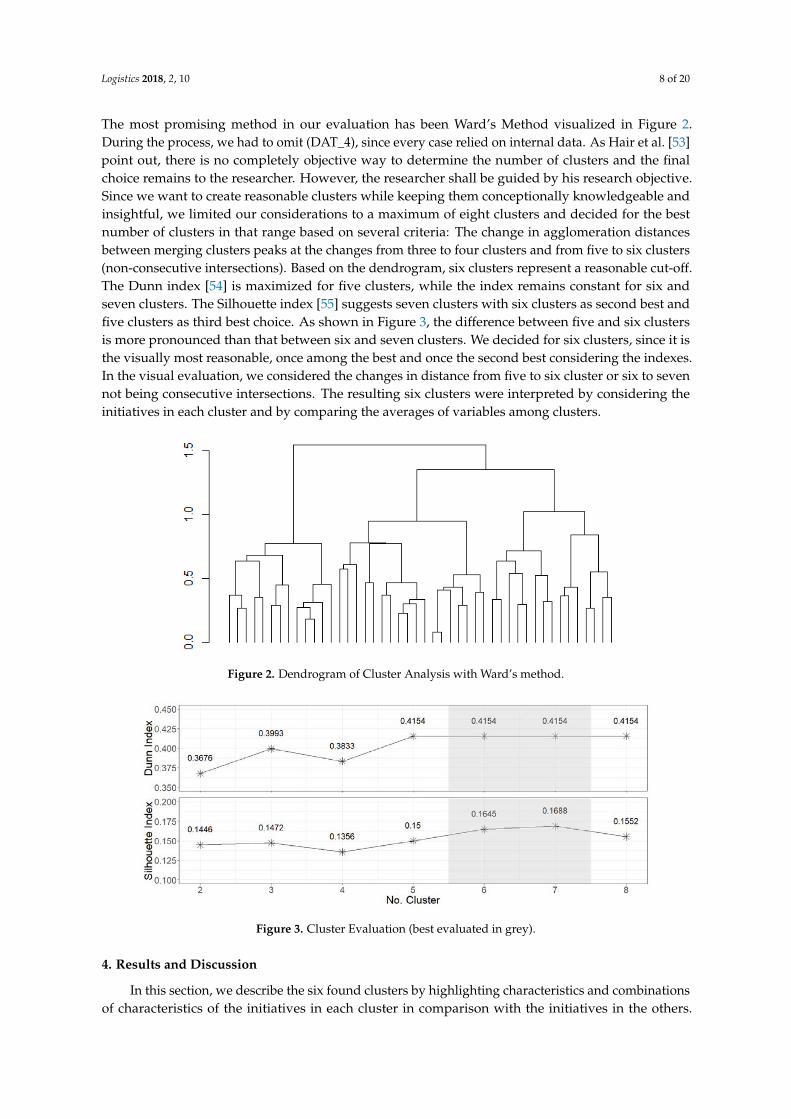
The most promising method in our evaluation has been Ward’s Method visualized in Figure 2.During the process, we had to omit (DAT_4), since every case relied on internal data. As Hair et al. [53]point out, there is no completely objective way to determine the number of clusters and the finalchoice remains to the researcher. However, the researcher shall be guided by his research objective.Since we want to create reasonable clusters while keeping them conceptionally knowledgeable andinsightful, we limited our considerations to a maximum of eight clusters and decided for the bestnumber of clusters in that range based on several criteria: The change in agglomeration distancesbetween merging clusters peaks at the changes from three to four clusters and from five to six clusters(non-consecutive intersections). Based on the dendrogram, six clusters represent a reasonable cut-off.The Dunn index [54] is maximized for five clusters, while the index remains constant for six andseven clusters. The Silhouette index [55] suggests seven clusters with six clusters as second best andfive clusters as third best choice. As shown in Figure 3, the difference between five and six clustersis more pronounced than that between six and seven clusters. We decided for six clusters, since it isthe visually most reasonable, once among the best and once the second best considering the indexes.In the visual evaluation, we considered the changes in distance from five to six cluster or six to sevennot being consecutive intersections. The resulting six clusters were interpreted by considering theinitiatives in each cluster and by comparing the averages of variables among clusters.
Logistics 2018, 2, x FOR PEER REVIEW 8 of 19
objective. Since we want to create reasonable clusters while keeping them conceptionally knowledgeable and insightful, we limited our considerations to a maximum of eight clusters and decided for the best number of clusters in that range based on several criteria: The change in agglomeration distances between merging clusters peaks at the changes from three to four clusters and from five to six clusters (non-consecutive intersections). Based on the dendrogram, six clusters represent a reasonable cut-off. The Dunn index [54] is maximized for five clusters, while the index remains constant for six and seven clusters. The Silhouette index [55] suggests seven clusters with six clusters as second best and five clusters as third best choice. As shown in Figure 3, the difference between five and six clusters is more pronounced than that between six and seven clusters. We decided for six clusters, since it is the visually most reasonable, once among the best and once the second best considering the indexes. In the visual evaluation, we considered the changes in distance from five to six cluster or six to seven not being consecutive intersections. The resulting six clusters were interpreted by considering the initiatives in each cluster and by comparing the averages of variables among clusters.
Figure 2. Dendrogram of Cluster Analysis with Ward’s method.
Figure 3. Cluster Evaluation (best evaluated in grey).
4. Results and Discussion
In this section, we describe the six found clusters by highlighting characteristics and combinations of characteristics of the initiatives in each cluster in comparison with the initiatives in the others. The findings therefore present the researchers’ interpretation. All initiatives within a cluster were then analyzed together to extract commonalities. Clusters have been named to underline their major traits. The results are visualized in Figure 4 with key points for every characteristics category in the order presented in Section 2.3.
Figure 2. Dendrogram of Cluster Analysis with Ward’s method.
Logistics 2018, 2, x FOR PEER REVIEW 8 of 19
objective. Since we want to create reasonable clusters while keeping them conceptionally knowledgeable and insightful, we limited our considerations to a maximum of eight clusters and decided for the best number of clusters in that range based on several criteria: The change in agglomeration distances between merging clusters peaks at the changes from three to four clusters and from five to six clusters (non-consecutive intersections). Based on the dendrogram, six clusters represent a reasonable cut-off. The Dunn index [54] is maximized for five clusters, while the index remains constant for six and seven clusters. The Silhouette index [55] suggests seven clusters with six clusters as second best and five clusters as third best choice. As shown in Figure 3, the difference between five and six clusters is more pronounced than that between six and seven clusters. We decided for six clusters, since it is the visually most reasonable, once among the best and once the second best considering the indexes. In the visual evaluation, we considered the changes in distance from five to six cluster or six to seven not being consecutive intersections. The resulting six clusters were interpreted by considering the initiatives in each cluster and by comparing the averages of variables among clusters.
Figure 2. Dendrogram of Cluster Analysis with Ward’s method.
Figure 3. Cluster Evaluation (best evaluated in grey).
4. Results and Discussion
In this section, we describe the six found clusters by highlighting characteristics and combinations of characteristics of the initiatives in each cluster in comparison with the initiatives in the others. The findings therefore present the researchers’ interpretation. All initiatives within a cluster were then analyzed together to extract commonalities. Clusters have been named to underline their major traits. The results are visualized in Figure 4 with key points for every characteristics category in the order presented in Section 2.3.
Figure 3. Cluster Evaluation (best evaluated in grey).
4. Results and Discussion
In this section, we describe the six found clusters by highlighting characteristics and combinationsof characteristics of the initiatives in each cluster in comparison with the initiatives in the others.
Logistics 2018, 2, 10 9 of 20
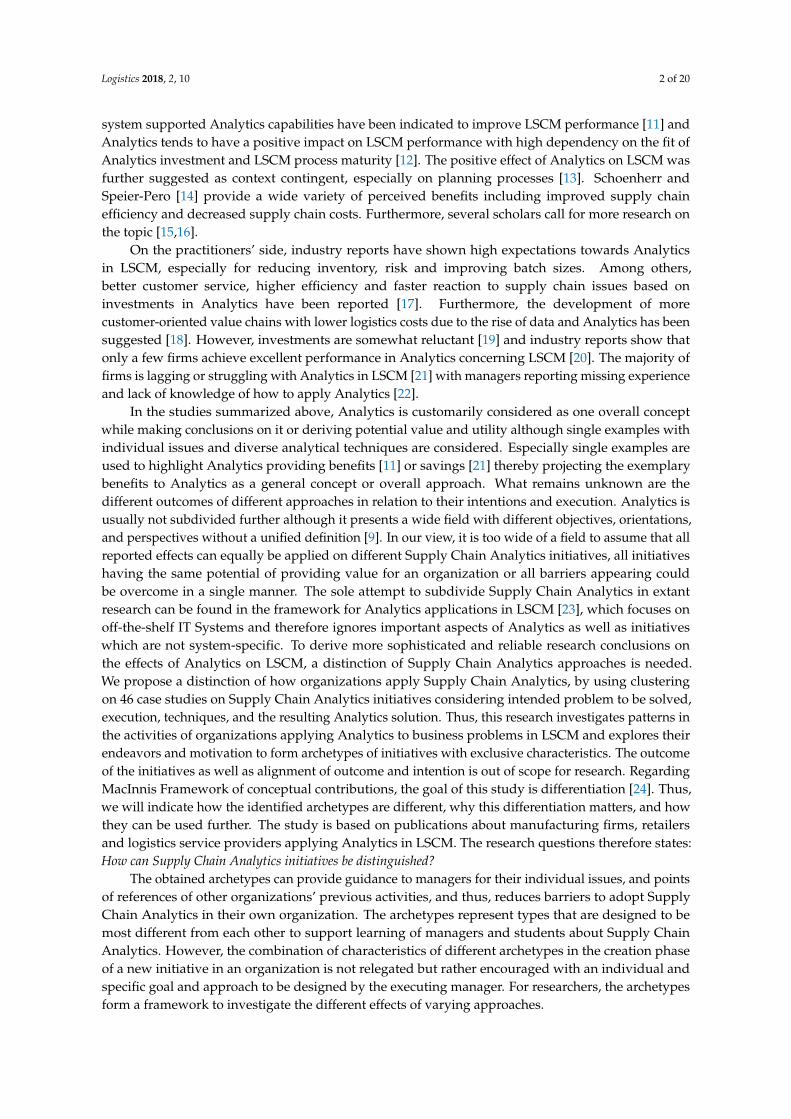
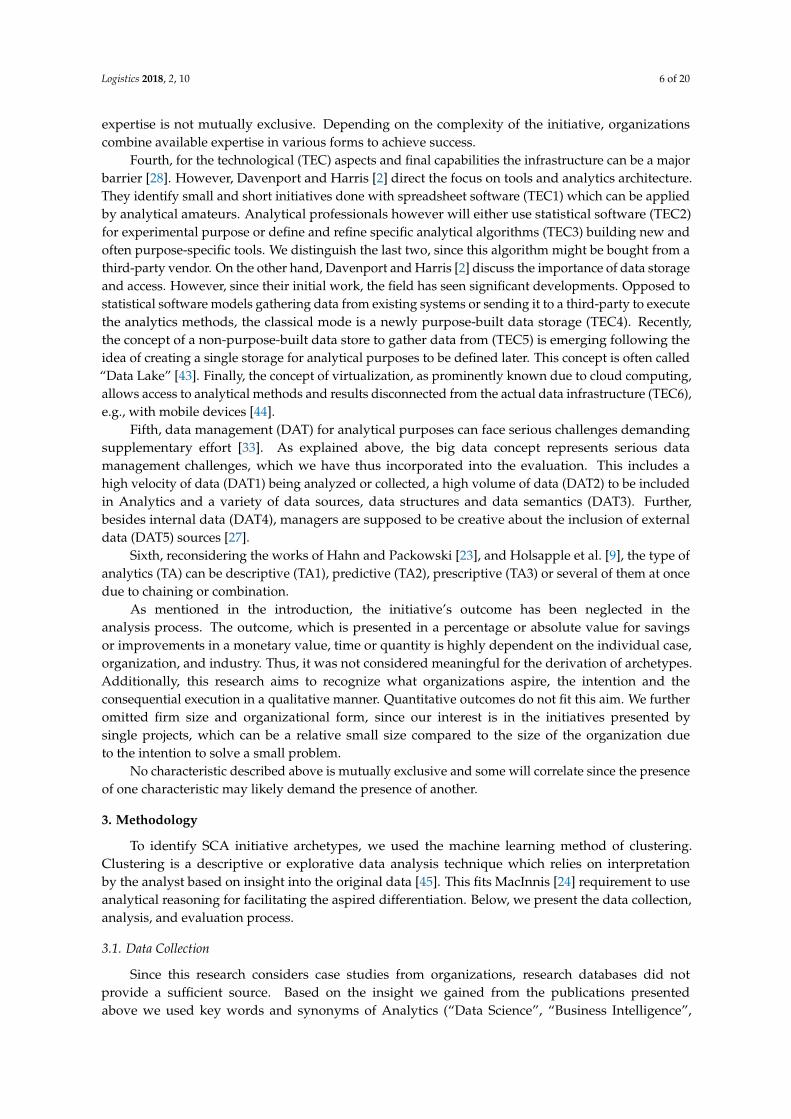
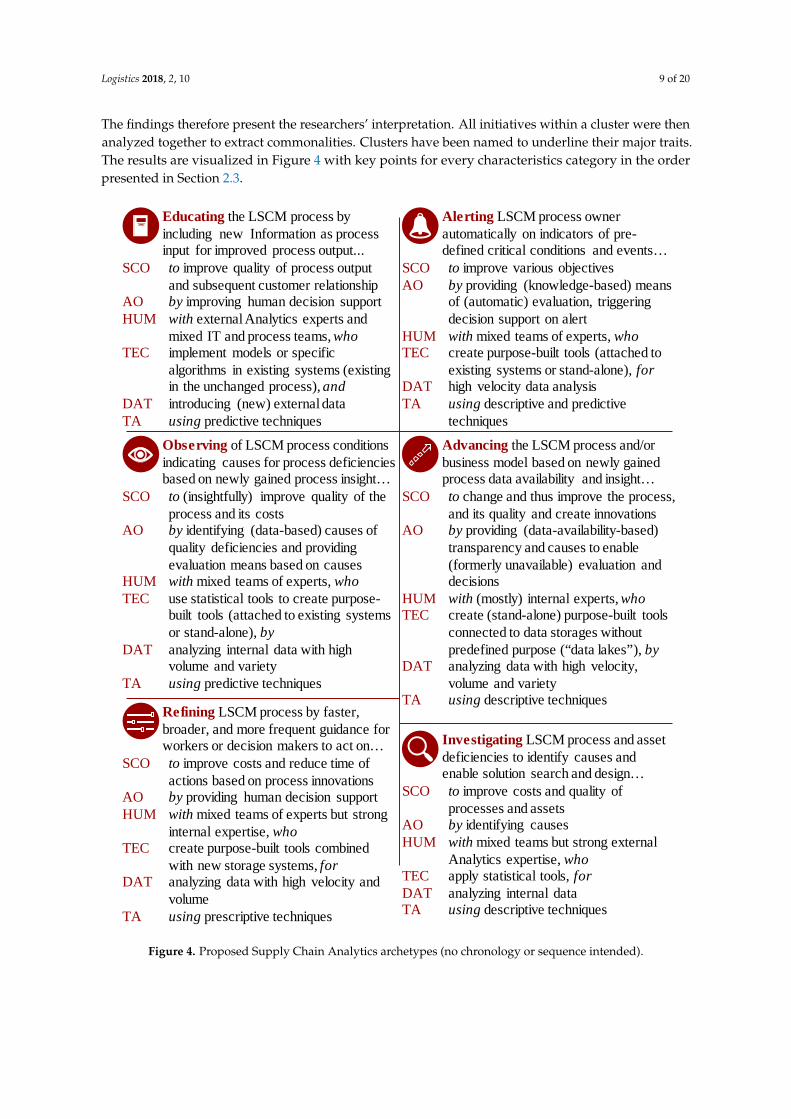
The findings therefore present the researchers’ interpretation. All initiatives within a cluster were thenanalyzed together to extract commonalities. Clusters have been named to underline their major traits.The results are visualized in Figure 4 with key points for every characteristics category in the orderpresented in Section 2.3.Logistics 2018, 2, x FOR PEER REVIEW 9 of 19
Figure 4. Proposed Supply Chain Analytics archetypes (no chronology or sequence intended).
4.1. Cluster 1—Educating
The initiatives in the Educating cluster focus on gathering data (sources) new to the organization and process, that are used as more advanced input in the decision-making of the LSCM process to improve output but will not lead to process redesign. This cluster contains mainly forecasting initiatives with the specific goal of providing the right amount of goods without storing excess inventory or having stock-outs such that the consumer of goods is served best (e.g., the use of data on weather, income, historical sales, or regional marketing campaigns to determine inventory allocation to individual stores). Thus, the objective is to improve process quality and customer relationship. The tools used in these initiatives are dominantly predictive and aim to produce more
Educating the LSCM process by including new Information as process input for improved process output...
SCO to improve quality of process output and subsequent customer relationship
AO by improving human decision supportHUM with external Analytics experts and
mixed IT and process teams, whoTEC implement models or specific
algorithms in existing systems (existingin the unchanged process), and
DAT introducing (new) external dataTA using predictive techniques
SCO to (insightfully) improve quality of the process and its costs
AO by identifying (data-based) causes of quality deficiencies and providing evaluation means based on causes
HUM with mixed teams of experts, whoTEC use statistical tools to create purpose-
built tools (attached to existing systems or stand-alone), by
DAT analyzing internal data with high volume and variety
TA using predictive techniques
Observing of LSCM process conditions indicating causes for process deficiencies based on newly gained process insight…
SCO to improve various objectivesAO by providing (knowledge-based) means
of (automatic) evaluation, triggering decision support on alert
HUM with mixed teams of experts, whoTEC create purpose-built tools (attached to
existing systems or stand-alone), forDAT high velocity data analysisTA using descriptive and predictive
techniques
Alerting LSCM process owner automatically on indicators of pre-defined critical conditions and events…
SCO to change and thus improve the process, and its quality and create innovations
AO by providing (data-availability-based) transparency and causes to enable (formerly unavailable) evaluation and decisions
HUM with (mostly) internal experts, whoTEC create (stand-alone) purpose-built tools
connected to data storages without predefined purpose (“data lakes”), by
DAT analyzing data with high velocity, volume and variety
TA using descriptive techniques
Advancing the LSCM process and/or business model based on newly gained process data availability and insight…
SCO to improve costs and reduce time of actions based on process innovations
AO by providing human decision support HUM with mixed teams of experts but strong
internal expertise, whoTEC create purpose-built tools combined
with new storage systems, forDAT analyzing data with high velocity and
volumeTA using prescriptive techniques
Refining LSCM process by faster, broader, and more frequent guidance for workers or decision makers to act on…
SCO to improve costs and quality of processes and assets
AO by identifying causesHUM with mixed teams but strong external
Analytics expertise, whoTEC apply statistical tools, forDAT analyzing internal dataTA using descriptive techniques
Investigating LSCM process and asset deficiencies to identify causes and enable solution search and design…
Figure 4. Proposed Supply Chain Analytics archetypes (no chronology or sequence intended).
Logistics 2018, 2, 10 10 of 20
4.1. Cluster 1—Educating
The initiatives in the Educating cluster focus on gathering data (sources) new to the organizationand process, that are used as more advanced input in the decision-making of the LSCM processto improve output but will not lead to process redesign. This cluster contains mainly forecastinginitiatives with the specific goal of providing the right amount of goods without storing excessinventory or having stock-outs such that the consumer of goods is served best (e.g., the use of dataon weather, income, historical sales, or regional marketing campaigns to determine inventory allocationto individual stores). Thus, the objective is to improve process quality and customer relationship.The tools used in these initiatives are dominantly predictive and aim to produce more precise inputsfor decision-making in consecutive processes of inventory allocation. In some initiatives, no evidenceon how the consecutive processes are further affected by the tool can be found. The report on oneinitiative specifically states that this is intended, since employees shall use the output of the model—theprediction—and not question it. The focal organization usually buys a custom-built or customizedadvanced tool or system extension developed by external Analytics experts, which includes externaldata sources new to the forecasting organization and combines it with internal data from existingsystems to integrate it with these systems.
4.2. Cluster 2—Observing
The initiatives in the Observing cluster concentrate heavily on predicting LSCM processdeficiencies in the short-term or medium-term future with a newly developed tool observing andmonitoring the processes gain reaction time to either prevent the deficiencies or enable counteraction.The prediction is based on process conditions indicating those definitely identified in the initiative.Thus, observing indicates watching with knowing what to pay attention to. The supply chain objectivesare mixed but tend to focus on cost reduction and quality improvement. The process is sought to beimproved by observing and avoiding identified causes of quality deficiencies but not essentially bychanging or redesigning the process. The initiatives in Cluster 2 describe a variety of data experimentsto improve process accuracy and quality (e.g., identifying production quality indicators that must bemonitored, estimation of product weight based on package weights to sequentially use package weightas quality indicator for correct items, identify influencing factors on punctuality of arrival to adjustplans when factors are present). In a distinct proportion of initiatives, the maintenance process ofan asset, machine, or vehicle was under investigation. The actors in the analytics team are mixed frominternal and external experts for Analytics and IT. Process experts are usually in house. The softwareused includes spreadsheets—the cluster contains the only initiative the authors could identify usingspreadsheet software (in combination with statistical software)—and statistical software but nospecifically designed algorithm. The techniques used are primarily predictive and analytically aimedat anticipating the behavior and evaluating the performance of a process as well as understandingthe causes of the process behavior. Thus, they usually exploit patterns in the data opposed to processknowledge as in Alerting initiatives. Data is either stored in purpose-built data storages or gatheredfrom existing systems. In addition, cloud computing was used in some initiatives to provide access tothe automatically evaluated processes to facilitate monitoring. External data is barely used, but internaldata comes in high volumes and variety to create sophisticated process insight tools.
4.3. Cluster 3—Alerting
The initiatives in Cluster 3 use similar approaches as the initiatives of Cluster 2. However,the product of the initiative diverges with Cluster 3 initiatives aiming to produce a support systemfor process owners. These are supposed to call for attention or alert in certain, especially critical,process conditions or events, which are mostly predefined rather than identified. Critical refers tonegative process effects or possible loss of revenue. The on-demand attention contributes to meetvarious supply chain objectives including cost reduction, quality improvement, flexibility increase
Logistics 2018, 2, 10 11 of 20
or customer relationship improvement. The LSCM process is usually untouched, as opposed toAdvancing or Refining initiatives, while the monitoring task of the process is reduced from activechecking to passively getting alerted on actions required (e.g., by providing alerts when deliveryvehicles do not progress on route as has been estimated which demands modification of routes,informing receivers or parallel deliveries with faster delivery time). To achieve this, the initiativesrepeatedly describe teams of internal process experts teaming up with mixed experts in analyticsand IT. The need for external assistance in these initiatives may be attributed to the desired output,which is to develop a dedicated software tool in all initiatives in Cluster 3. These tools performmonitoring tasks of a specific process and recommend actions for improvements (e.g., to lowerenergy consumption, to increase flexibility, to reduce cost, to improve utilization of capacity) aswell as request needed actions (e.g., change routes, change active supplier, maintain machines,to adjust prices). Thus, high velocity of data analysis is in focus. The organizations in some casesused the tool to offer new services to their customers. The tools usually need their own purpose-builtdata storage with virtualization technologies commonly used for improved access. Further, they arelikely to include external data sources necessary for risk assessments of suppliers, sources of delayson routes or condition evaluation supported by additional manufacturer provided data. As opposedto Observing initiatives, these initiatives are commonly driven by process knowledge of criticalconditions and therefore focus on finding data-driven ways to automate what process owners wereactively monitoring before. The initiatives use and combine descriptive and predictive techniques tosummarize data for monitoring and extrapolating future conditions.
4.4. Cluster 4—Advancing
The initiatives in Cluster 4 focus on advancing a process, or even the organization by developingnew business models. Thus, as opposed to Observing initiatives, which optimize reacting on processconditions potentially leading to process quality deprivation, or to Alerting initiatives, in whichknown conditions require actions, these initiatives usually introduce process changes in the formof adjusted process steps that were identified based on process data made available to create thistransparency—the large scale data availability is often seen as major progress and benefit with resultingtool focused process execution. This cluster unites initiatives of organizations with a certain maturityin Analytics. These usually bring internal expertise into the initiative from all relevant areas and onlyoccasionally require external expertise. In particular, the initiatives aim to achieve data availabilityand transparency and subsequently understand the focal process (e.g., by equipping assets witha variety with sensors and mobile devices, collecting data, and analyzing data from similar assetstogether to determine the life cycle process of a machine and its components or routines of transportvehicles performing deliveries and consequentially creating a new form of predictive maintenancecontract with customers). In this context, “understanding” not only refers to the continuous evaluationof processes, but also to the use of descriptive techniques for causal analysis to identify processparameter settings and combinations causing losses in process quality, and to provide a decisionsupport to counteract these losses. The initiatives integrate data with high velocity, high volume,and high variety. To achieve this, purpose-built software tools are developed. The results of the analysislead to tools for process monitoring combined with decision support systems. These initiatives furtheremphasize the collection of data without predefined purpose, with prospective use of these centralizeddata in future analyses. The tools and select data are regularly made available to customers to create acompetitive advantage for their own products.
4.5. Cluster 5—Refining
The initiatives in Cluster 5 aim to squeeze the last bit of untapped efficiency out of a system byrefining processes with assisting or rather guidance functions for human operatives to reduce costsand save time. Additionally, these initiatives have a strong focus on creating an innovative advantageover competition. To achieve this, prescriptive techniques are used to determine the best course of
Logistics 2018, 2, 10 12 of 20
action—redesigning the process with manifold interactions with the system to guide decision-makingby human operatives. This includes the transfer of routing algorithms to pickers and the stops of theircarts in distribution centers, augmenting delivery vehicle drivers with routing algorithms dynamicallyusing real-time traffic conditions to re-optimize while the vehicle is already on the road or extendingmanufacturing processes with real-time quality evaluation to change the production sequence. Thus,as opposed to the archetypes above, the focus diverges from understanding and monitoring a processto continuously adjust (or refine) it. To achieve the aspired goal, a high volume of high velocity datamust be analyzed by purpose-built tools. The highly customized tools as well as the systems developedto execute these tools are developed in-house with a combination of internal and external expertise.
4.6. Cluster 6—Investigating
The initiatives in cluster 6 are united by the investigation of causes of deficiencies or rather majorprocess flaws. Thus, the objective of these initiatives is to increase process quality and reduce costs byidentifying and mitigating the root causes of process flaws or finding proxies to enable monitoringthem (e.g., identify shelf replenishment flaws by monitoring check-out patterns in super markets toidentify patterns of lost sales or identifying critical sensor signals presenting factors causing qualityissues in production processes). The important aspect to distinguish this cluster from the others is theconsequences taken when a root cause is found. Handling the root causes in the initiatives could not bedone by automating decision making or more sophisticated monitoring. Rather, the cause of processreliability or deficiency must be handled by changes in new product development, major processredesign or changes in materials demanding creativity and engineering design. These initiatives usuallycombine external Analytics with mixed external and internal IT and processes expertise. Identifyingcausalities is supposed to start a solution search instead of automating evaluation or continuousdecision support, as compared to Observing, and Alerting or Refining initiatives. The results of theinitiatives are based on statistical software with a focus on internally available data. Purpose-built datastorage systems are created.
4.7. Discussion on Archetypes
The clusters presented above present archetypical initiatives of Analytics in LSCM.The identification and interpretation of core characteristics of clusters was conducted to highlightthe uniqueness of each archetype and present archetype diversity in intended problem to be solved,execution, techniques, and product. Single initiatives forming the clusters and therefore determiningthe archetypes differ in some characteristics from the archetype. Thus, new initiatives may be createdwith differences in single features but with a clearer understanding of archetypical feature combination.In addition, while there is some (expected) overlap of clusters, we consider it as new insight that e.g.,the same Analytical objective may be used to pursue different Supply Chain objectives.
Considering the identified archetypes, as well as the characteristics forming the clusters,we observed that the type of Analytics did not dominate. While the Refining archetype consistssolely of optimization initiatives, optimization techniques could be found in the Educating andAdvising archetypes as well. Predictive techniques can be found in all archetypes, including theRefining archetype, since techniques were usually combined in more sophisticated Analytics initiatives.This holds true for descriptive initiatives as well. While the type of Analytics has been ourgreatest concern, we additionally conducted an analysis for dominating characteristics by evaluatingall characteristics across all archetypes in search for characteristics present in all initiatives formingan archetype but not present in any other archetype. However, we could not find any characteristicfulfilling this condition of dominance. To extend our analysis of critical characteristics, we consideredwhether the supermajority (two-thirds) of initiatives possessing a certain characteristic are given inany archetype. This condition was defined as weak dominance for this research. This condition wasfulfilled by the features SCO8, TEC1 and TEC5. However, these features have two, one, and threeobserved initiatives possessing the characteristic, respectively. Therefore, we did not consider
Logistics 2018, 2, 10 13 of 20
these features as critical. Concluding, we are confident in our results not being dominated by onesingle characteristic.
When presenting these results to scholars, a major point of controversy has been, whether thearchetypes present levels of Analytics maturity of an organization which we reject after carefulconsideration due to the following aspects: First, considering the given data, one initiative does notreflect the whole organization but a business unit executing the initiative. This is consistent withresearch indicating Analytics should follow process maturity [12] or rather additional AnalyticsMaturity should fit process maturity [11] which is therefore not necessarily leveled across theorganization. Second, organizations could execute initiatives of lower maturity since it may stillprovide benefits and initiatives of higher maturity using external support. Thus, an initiative isnot a distinct confirmation of an organizations capabilities. Third, in the initiatives considered,two organizations have been observed twice and one organization three times. The initiatives thusspread across archetypes with the seemingly more mature initiatives either in the same year or earlier.Fourth, research has pointed out, that the objective of an Analytics initiative is often set without theconsideration of the complexity of the Analytics required [25]. While the objective guides the initiative,the necessary Analytics maturity may be determined during the execution and not before and thus notinfluence the initiative. However, we acknowledge that the level of internal expertise involved mayindicate the business criticality.
Concerning an initiative perspective, this actually opposes maturity models setting standardsfor organization-wide implementation for highest maturity [56] or considering strategic initiatives forhighest maturity [16]. These levels of maturity address the analytics culture of the organization [2]which may influence the spread of initiatives but not dictate the choice of initiatives.
Finally, we learned that, to achieve value with SCA, the solution does not have to be anorganization-wide expensive third-party tool. Small models build with R or SPSS and visualized withTableau can provide significant value already.
4.8. Discussion on Overcoming Barriers with Archetypes
This research aspires to provide means to overcome barriers of applying Analytics to LSCMrelated to a missing understanding. Considering Sanders [28], we chose and summarized severalbarriers relevant for this research in Section 2.2.
Lack of leadership is indicated to be caused by lack of vision, lack of understanding of thecapability, and the lack of understanding how to lead change. The latter, also described as creating adata-oriented culture [57] or data-driven culture [58], is considered a key competency for managers totransform organizations to sophisticated Analytics capabilities and beyond the scope of this research.The lack of vision is addressed by the core concepts of each archetype since they are supposed to guidevision by providing points of reference to individualize, adapt and combine. The lack to understandthe capabilities required to apply Analytics is addressed by the characteristics of Analytics initiativesemphasizing structure of and resources needed for executing an initiative. However, it has beensuggested that the existence of these capabilities in an organization does not guarantee the ability tobring it to full use [9].
The barriers of lacking objectives are addressed by the generic objectives presented by the twoobjective characteristics categories, and by the specific objectives provided in the archetype descriptions.This highlights to managers the necessity of defining an objective as compared to the “poking” forcorrelation as described by the notion of analysis paralysis. Defining an objective which Analyticsshould answer is a valuable starting point [59]. The archetypes further emphasize that Analyticsinitiatives should not bedriven by the latest and most innovative technology but by technology fittingthe purpose of the identified objectives.
Further, as evident from the discussion above, with an orientation on objective-driven SCA withsubsequent choice of data, managers should not drown in data. The archetypes further present theopportunity of relying on external guidance for choosing the necessary data. In addition, it is indicated
Logistics 2018, 2, 10 14 of 20
that using non-Big Data can still achieve benefits. This is further underlined by process modelsfor Analytics initiatives recommending data collection to be a later step in the project (e.g., [31,57]).Even while drowning in data, having the right data to successfully execute the Analytics initiative isnot guaranteed.
5. Conclusions
In our research, we investigated how SCA initiatives can be distinguished. Literature suggestsreluctance of LSCM to invest in Analytics initiatives caused among other reasons by managers missingideas in how to approach SCA. With our research, we address this shortage by providing a distinctionof initiatives providing knowledge to managers about typical approaches to use SCA to gain businessvalue. Based on the patterns emerging form a cluster analysis of 46 SCA initiatives we propose sixarchetypes that show considerable differences in how organizations deploy SCA. In the analysis,the problem to be solved, execution, techniques, and resulting Analytics solution of the initiativehave been considered. In detail, we examined characteristics necessary to execute an SCA initiativeand therefore display areas that must be considered by managers designing new initiatives. Thecharacteristics are aggregated into the following groups:
• Supply chain objective that shall be addressed which represents the problem or deficiency in theLSCM process;
• Analytics objective, which is addressing how data and Analytics are supposed to support, effect,or change the LSCM process;
• Human expertise in areas relevant to the initiative as Analytics, IT and the LSCM process (andhow it is sourced);
• Applied software and hardware for analytical tasks and deployment of developed solutionsand tools;
• Data sources and characteristics;• Applicated types of Analytics (and subsequently analytical methods).
Regarding the groups of characteristics above, our findings support considerable differences ininitiative archetypes. The patterns identified allow us to answer the research question: SCA initiativescan be distinguished in the six clusters which are described regarding the characteristics in Section 4 aswell as LSCM process centric as follows:
1. Educating: The LSCM process remains as existing but will be enhanced with new data (sources)information as process input to improve decisions to be made during the process resulting inenhanced LSCM process output quality and customer orientation. This typically emerges asan improved tool used in the process such as a new forecasting model in a product allocationprocess or new forecast model for a risk evaluation process.
2. Observing: The LSCM process is extensively investigated for conditions that indicate processdeficiencies or issues in the short-term or medium-term future with a resulting tool to monitorthe process based on the newly gained insight. The knowledge about the conditions improvesprocess quality and costs due to earlier reaction. Examples include detection of engine vibrationpatterns enabling maintenance planning of vehicles such that a repair shop is the final stopof a route on a suitable point in time instead of random breakdown far away from accessto maintenance, or detection of weather patterns resulting in traffic and road conditionsdemanding changing of routes. However, identified conditions are indications and leave roomfor human decision making.
3. Alerting: LSCM process owners are provided with alerts on critical conditions and eventsthat immediately demand reactions. The conditions are usually known by process ownerswithout the need of analytical identification and certain in their negative impact on the processdemanding actions. Alerting initiatives’ central task is making the necessary data available to
Logistics 2018, 2, 10 15 of 20
automate the alert as opposed to repeated human check-up actions. Examples include alerts onclosed roads for vehicle routing or automated recommendations of price changes and acceptanceof shipments for cargo airlines in close to departure time-windows. Here again, the LSCM processis typically supported but not altered.
4. Advancing: The LSCM processes and business models will be advanced by enabling changes dueto insight made available with intense data collection and analysis. Large scale data collectionis central to the initiative, using sensors and mobile devices to create data-availability-basedtransparency and evaluation of LSCM process steps. The insight is used to improve processquality by changing process steps under incorporation of the insight and creating analyticsdriven innovations replacing process steps as well as making insight available to interested thirdparties as business model innovation. Examples are machine profiles allowing determination ofaccurate predictive maintenance processes which can be sold by the machine manufacturerto the machine user, or driver profiles to create new monitoring steps to reduce idle time.These initiatives differ from observing and alerting by extensiveness of data collection andanalysis typically demanding big data technologies, and range of the resulting tool, which changesthe process to become tool and thus data focused as opposed to a minor process support.
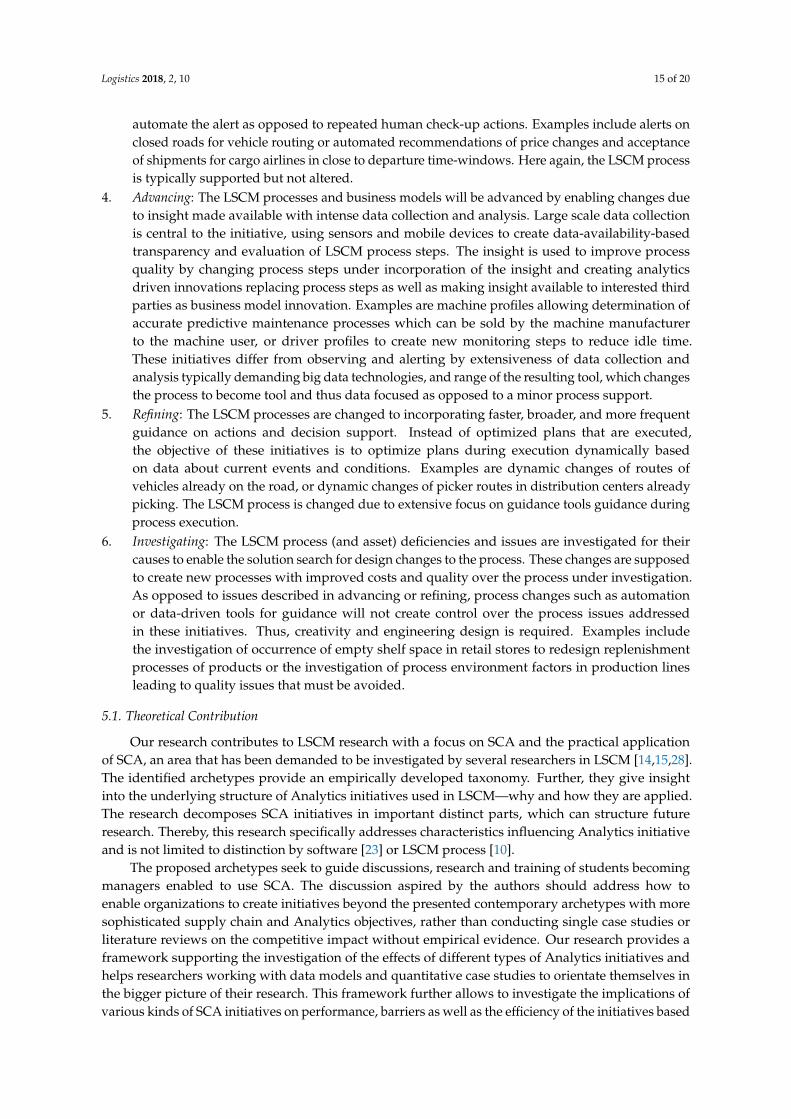
5. Refining: The LSCM processes are changed to incorporating faster, broader, and more frequentguidance on actions and decision support. Instead of optimized plans that are executed,the objective of these initiatives is to optimize plans during execution dynamically basedon data about current events and conditions. Examples are dynamic changes of routes ofvehicles already on the road, or dynamic changes of picker routes in distribution centers alreadypicking. The LSCM process is changed due to extensive focus on guidance tools guidance duringprocess execution.
6. Investigating: The LSCM process (and asset) deficiencies and issues are investigated for theircauses to enable the solution search for design changes to the process. These changes are supposedto create new processes with improved costs and quality over the process under investigation.As opposed to issues described in advancing or refining, process changes such as automationor data-driven tools for guidance will not create control over the process issues addressedin these initiatives. Thus, creativity and engineering design is required. Examples includethe investigation of occurrence of empty shelf space in retail stores to redesign replenishmentprocesses of products or the investigation of process environment factors in production linesleading to quality issues that must be avoided.
5.1. Theoretical Contribution
Our research contributes to LSCM research with a focus on SCA and the practical applicationof SCA, an area that has been demanded to be investigated by several researchers in LSCM [14,15,28].The identified archetypes provide an empirically developed taxonomy. Further, they give insightinto the underlying structure of Analytics initiatives used in LSCM—why and how they are applied.The research decomposes SCA initiatives in important distinct parts, which can structure futureresearch. Thereby, this research specifically addresses characteristics influencing Analytics initiativeand is not limited to distinction by software [23] or LSCM process [10].
The proposed archetypes seek to guide discussions, research and training of students becomingmanagers enabled to use SCA. The discussion aspired by the authors should address how toenable organizations to create initiatives beyond the presented contemporary archetypes with moresophisticated supply chain and Analytics objectives, rather than conducting single case studies orliterature reviews on the competitive impact without empirical evidence. Our research provides aframework supporting the investigation of the effects of different types of Analytics initiatives andhelps researchers working with data models and quantitative case studies to orientate themselves inthe bigger picture of their research. This framework further allows to investigate the implications ofvarious kinds of SCA initiatives on performance, barriers as well as the efficiency of the initiatives based
Logistics 2018, 2, 10 16 of 20
on the archetype of the initiative. Finally, this research gives a two-dimensional picture to introducestudents to this field and ease the process of understanding important factors and possibilities by theproposed first dimension of archetypes to understand what companies do and the second dimensionof characteristics of SCA initiatives to understand what aspects to consider when constructing aninitiative. Thus, it enables researchers and students to introduce their LSCM knowledge into Analyticsinitiatives and provide considerable value that is required for successful initiatives [14,15].
This research further addresses the gap between theory and organizational activities highlightedby several scholars, especially in management science [60,61]. Our archetypes map the activities oforganizations and provide templates for organizations and scholars in the field to understand whatdrives organizations to their activities.
5.2. Managerial Contribution
This research copes with the managerial barriers related to missing insight into the applicationof SCA. By describing archetypes of this application, we give managers directions for future SCAinitiatives based on their initial business situation, available means, and objectives. Presenting theresults to experts in Analytics, the archetypes were well received with the remark that managers maylack creativity of how to address business problems with Analytics which could be supported with theresults of this research. In this regard, managers may combine archetypical approaches to create newinitiatives or explore initiatives with supply chain or analytical objectives rarely observed.
Considering the barriers discussed in Section 4.8, our research presents how the application ofSCA creates value for an organization and how decisions are made based on SCA. Managers shouldbe enabled to decide which of the overwhelming opportunities provided by SCA to take and which topostpone or reject with the primary objective of providing value to the organization. Naturally, thisrequires the creativity to design new initiatives.
The research further provides a framework for managers to understand the key components tobuild an SCA initiative. First and foremost, an initiative must address existing problems—meaningany disparity between objective state and actual state—for the LSCM Part as well as they require ananalytical objective to address the LSCM problem. Further characteristics display fields that must bedeveloped and improved over time to design more complex initiatives, even in the same archetype.For the Human category, that includes building skills supporting the execution of initiative as hardskills in Analytics as well as communication skills to transfer thoughts, ideas, and experience betweenthe different experts. In the technology category, this include investments in easier data exchange,faster analysis, and calculation as well as more-powerful analytical tools. In the data category,this includes broader data collection and higher standards for data quality.
Our research further develops a vocabulary to communicate managers’ objectives and visionwhile highlighting small but crucial differences. The archetypes are imagined as a menu ofoptions a manager may use to choose specific or combined items. We intend the archetypesto guide his initiative design process, as opposed to having an infinity of options that quicklybecomes overwhelming. Therefore, besides providing directions, the archetypes also serve asvalidation of the fit of characteristics of the initiative and thus, its practicality. This enables managersto pinpoint what they aspire and communicate it directly and properly.
The other way around, the archetypes can be stimulation for two additional types of managerskeen to use Analytics in LSCM. First, Managers that achieved some routine in initiatives of a specificarchetype may get stuck in that archetype and repeat it for every new use case which eventuallyleads to decreasing marginal value from that kind of initiative. Second, the managers are supposed to“make more from their data”—a type that is not very rare from our personal experience. Both typesof managers could, using the archetypes, identify promising problems to address and subsequentlysearch for interested users or rather “problem owners”. The first type obviously benefits over thesecond from knowing eventual problem owners from her previous projects she could address againwith another beneficial initiative.
Logistics 2018, 2, 10 17 of 20
6. Final Remarks
6.1. Limitations
Due to the various sources of the initiatives considered, their descriptions are provided in variouslevels of detail regarding the characteristics used to evaluate them. With 46 cases, the amount ofconsidered cases is low. Additionally, the observed cases only represent successes since these are morelikely to be published in any form. Unsuccessful cases to use Analytics in LSCM could not be identified.Further, the cases have been collected in a procedure which is hard to recreate. This is due to the lackof a public database for such case studies, especially considering the amount of studies needed toconduct a meaningful cluster analysis. Since databases for research (e.g., Scopus, Web of Science orEBSCO) did not yield relevant results, we were reliant on an open search platform. The search wassuspended when a reasonable amount of time (16 h/2 workdays) for searching cases did not yield anynew results. However, the possibilities to collect the data for this research were rather limited.
Furthermore, considering the data analysis, the decision about the number of clusters and thusthe number and structure of the identified archetypes depends on several vague factors and cannot bemade objectively. The clusters are created based on the researchers’ interpretations and judgement.We presented the results to researchers in LSCM and experts in Analytics, which assessed the clustersas reasonable.
6.2. Future Research
This study takes a step towards understanding the inner structure of a growing field of research,which should not be investigated as a single entity to generalize use, effects, and benefits anymore.Thus, future research may investigate the effects of SCA initiatives distinguished by archetype tocreate more sophisticated insight. The archetypes may also be correlated to Analytics maturity orthe growth-share matrix to identify easy-to-start archetypical initiatives for organizations with lowmaturity and identify factors of successful initiatives with the potential to create competitive advantage.Additionally, since we consider this research to be contemporary, we encourage to repeat this researchin five to ten years.
Author Contributions: T.T.H. and S.B. conceived and designed the research approach; T.T.H. and S.B. performedthe data collection; T.T.H. analyzed the data, S.B. commented and took part in interpreting the results; T.T.H.wrote the paper, S.B. commented on text and figures.
Funding: No funds have been received from a third party.
Conflicts of Interest: The authors declare no conflict of interest.
References
1. Keen, A. Battle Lines Drawn as Data Becomes Oil of Digital Age. CNN. 2012. Available online: http://edition.cnn.com/2012/01/25/opinion/keen-technology-data/ (accessed on 6 May 2018).
2. Davenport, T.H.; Harris, J.G. Competing on Analytics: The New Science of Winning; Harvard Business SchoolPress: Boston, MA, USA, 2007.
3. Cao, G.; Duan, Y.; Li, G. Linking Business Analytics to Decision Making Effectiveness: A Path ModelAnalysis. IEEE Trans. Eng. Manag. 2015, 62, 384–395. [CrossRef]
4. Davenport, T.H. Realizing the Potential of Retail Analytics Plenty of Food for Those with the Appetite; Babson Park:Wellesley, MA, USA, 2009.
5. Simchi-Levi, D.; Simchi-Levi, E.; Kaminsky, P. Designing and Managing the Supply Chain: Concepts, Strategies,and Cases; McGraw-Hill: New York, NY, USA, 2003.
6. Jeske, M.; Grüner, M.; WeiB, F. Big Data in Logistics; DHL Customer Solutions & Innovation: Troisdorf,Germany, 2013.
7. Christopher, M. Logistics & Supply Chain Management; Financial Times Prentice Hall: Harlow, UK, 2011.8. Bose, R. Advanced analytics: Opportunities and challenges. Ind. Manag. Data Syst. 2009, 109, 155–172.
[CrossRef]
Logistics 2018, 2, 10 18 of 20
9. Holsapple, C.; Lee-Post, A.; Pakath, R. A unified foundation for business analytics. Decis. Support Syst. 2014,64, 130–141. [CrossRef]
10. Souza, G.C. Supply chain analytics. Bus. Horiz. 2014, 57, 595–605. [CrossRef]11. Trkman, P.; McCormack, K.; de Oliveira, M.P.V.; Ladeira, M.B. The impact of business analytics on supply
chain performance. Decis. Support Syst. 2010, 49, 318–327. [CrossRef]12. De Oliveira, M.P.V.; McCormack, K.; Trkman, P. Business analytics in supply chains—The contingent effect
of business process maturity. Expert Syst. Appl. 2012, 39, 5488–5498. [CrossRef]13. Chae, B.; Olson, D.; Sheu, C. The impact of supply chain analytics on operational performance: A
resource-based view. Int. J. Prod. Res. 2014, 52, 4695–4710. [CrossRef]14. Schoenherr, T.; Speier-Pero, C. Data Science, Predictive Analytics, and Big Data in Supply Chain Management:
Current State and Future Potential. J. Bus. Logist. 2015, 36, 120–132. [CrossRef]15. Waller, M.A.; Fawcett, S.E. Data Science, Predictive Analytics, and Big Data: A Revolution That Will
Transform Supply Chain Design and Management. J. Bus. Logist. 2013, 34, 77–84. [CrossRef]16. Wang, G.; Gunasekaran, A.; Ngai, E.W.T.; Papadopoulos, T. Big data analytics in logistics and supply chain
management: Certain investigations for research and applications. Int. J. Prod. Econ. 2016, 176, 98–110.[CrossRef]
17. Pearson, M.; Gjendem, F.H.; Kaltenbach, P.; Schatteman, O.; Hanifan, G. Big Data Analytics in Supply Chain:Hype or Here to Stay? Accenture: Munich, Germany, 2014.
18. Opher, A.; Onda, A.; Chou, A.; Sounderrajan, K. The Rise of the Data Economy: Driving Value through Internetof Things Data Monetization; IBM Corporation: Somers, NY, USA, 2016.
19. Schmidt, B.; Rutkowsky, S.; Petersen, I.; Kloetzke, F.; Wallenburg, M.; Einmahl, L. Digital Supply Chains:Increasingly Critical for Competitive Edge; ATKearney: Düsseldorf, Germany, 2015.
20. Marchese, K.; Dollar, B. Supply Chain Talent of the Future. 2015. Available online: https://www2.deloitte.com/us/en/pages/operations/articles/supply-chain-talent-of-the-future-survey.html (accessed on3 May 2018).
21. Thieullent, A.-L.; Colas, M.; Buvat, J.; Kvj, S.; Bisht, A. Going Big: Why Companies Need to Focuson Operational Analytics. Paris, 2016. Available online: https://www.capgemini.com/wp-content/uploads/2017/07/going_big-_why_companies_need_to_focus_on_operational_analytics.pdf (accessed on3 May 2018).
22. Ransbotham, S.; Kiron, D.; Prentice, P.K. Beyond the hype: The hard work behind analytics success. MIT SloanManag. Rev. 2016, 57, 1–6.
23. Hahn, G.J.; Packowski, J. A perspective on applications of in-memory analytics in supply chain management.Decis. Support Syst. 2015, 76, 45–52. [CrossRef]
24. MacInnis, D.J. A Framework for Conceptual Contributions in Marketing. J. Mark. 2011, 75, 136–154.[CrossRef]
25. Viaene, S.; Van den Bunder, A. The secrets to managing business analytics projects. MIT Sloan Manag. Rev.2011, 53, 65–69.
26. Chen, H.; Chiang, R.H.; Storey, V.C. Business intelligence and analytics: from big data to big impact. MIS Q.2012, 36, 1165–1188. [CrossRef]
27. Barton, D.; Court, D. Making advanced analytics work for you. Harv. Bus. Rev. 2012, 90, 78–83. [CrossRef][PubMed]
28. Sanders, N.R. Big Data Driven Supply Chain Management: A Framework for Implementing Analytics and TurningInformation into Intelligence; Pearson Education, Inc.: Upper Saddle River, NJ, USA, 2014.
29. Das, S. Computational Business Analytics; CRC Press: Boca Raton, FL, USA, 2014.30. Spiess, J.; Joens, Y.T.; Dragnea, R.; Spencer, P. Using Big Data to Improve Customer Experience and Business
Performance. Bell Labs Tech. J. 2014, 18, 3–17. [CrossRef]31. Provost, F.; Fawcett, T. Data Science for Business; O’Reilly Media: Sebastopol, CA, USA, 2013.32. Akter, S.; Wamba, S.F.; Gunasekaran, A.; Dubey, R.; Childe, S.J. How to improve firm performance using big
data analytics capability and business strategy alignment? Int. J. Prod. Econ. 2016, 182, 113–131. [CrossRef]33. Laney, D. 3D Data Management: Controlling Data Volume, Velocity, and Variety, 2001. Available online: https:
//www.bibsonomy.org/bibtex/263868097d6e1998de3d88fcbb7670ca6/sb3000 (accessed on 8 May 2018).34. Sivarajah, U.; Kamal, M.M.; Irani, Z.; Weerakkody, V. Critical analysis of Big Data challenges and analytical
methods. J. Bus. Res. 2017, 70, 263–286. [CrossRef]
Logistics 2018, 2, 10 19 of 20
35. Fosso Wamba, S.; Akter, S.; Edwards, A.; Chopin, G.; Gnanzou, D. How “big data” can make big impact:Findings from a systematic review and a longitudinal case study. Int. J. Prod. Econ. 2015, 165, 234–246.[CrossRef]
36. Dutta, D.; Bose, I. Managing a big data project: The case of Ramco cements limited. Int. J. Prod. Econ. 2015,165, 293–306. [CrossRef]
37. Bowersox, D.J.; Closs, D.J.; Cooper, M.B. Supply Chain Logistics Management; McGraw-Hill/Irwin: New York,NY, USA, 2007.
38. Chan, F.T.S. Performance Measurement in a Supply Chain. Int. J. Adv. Manuf. Technol. 2003, 21, 534–548.[CrossRef]
39. Gunasekaran, A.; Patel, C.; McGaughey, R.E. A framework for supply chain performance measurement.Int. J. Prod. Econ. 2004, 87, 333–347. [CrossRef]
40. Ambe, I.M. Key Indicators For Optimising Supply Chain Performance: The Case Of Light VehicleManufacturers In South Africa. J. Appl. Bus. Res. 2013, 30, 277–290. [CrossRef]
41. Manyika, J.; Chui, M.; Brown, B.; Bughin, J.; Dobbs, R.; Roxburgh, C.; Byers, A.H. Big Data: Thenext Frontier for Innovation, Competition, and Productivity. McKinsey Glob. Inst. 2011. Availableonline: https://www.mckinsey.com/business-functions/digital-mckinsey/our-insights/big-data-the-next-frontier-for-innovation (accessed on 8 May 2018).
42. Dietrich, D.; Heller, B.; Yang, B. Data Science & Big Data Analytics: Discovering, Analyzing, Visualizing andPresenting Data; John Wiley & Sons: Indianapolis, IN, USA, 2015.
43. Fang, H. Managing data lakes in big data era: What’s a data lake and why has it became popular in datamanagement ecosystem. In Proceedings of the 2015 IEEE International Conference on Cyber Technology inAutomation, Control, and Intelligent Systems (CYBER), Senyang, China, 8–12 June 2015.
44. Kambatla, K.; Kollias, G.; Kumar, V.; Grama, A. Trends in big data analytics. J. Parallel Distrib. Comput. 2014,74, 2561–2573. [CrossRef]
45. Kaufman, L.; Rousseeuw, P.J. Finding Groups in Data: An Introduction to Cluster Analysis; John Wiley & Sons:Hoboken, NJ, USA, 2005.
46. Buttermann, G.; Germain, R.; Iyer, K.N.S. Contingency theory “fit” as gestalt: An application to supply chainmanagement. Transp. Res. Part E Logist. Transp. Rev. 2008, 44, 955–969. [CrossRef]
47. Flynn, B.B.; Huo, B.; Zhao, X. The impact of supply chain integration on performance: A contingency andconfiguration approach. J. Oper. Manag. 2010, 28, 58–71. [CrossRef]
48. Rossetti, C.L.; Dooley, K.J. Job types in the supply chain management profession. J. Supply Chain Manag.2010, 46, 40–56. [CrossRef]
49. Cohen, J. A Coefficient of Agreement for Nominal Scales. Educ. Psychol. Meas. 1960, 20, 37–46. [CrossRef]50. Landis, J.R.; Koch, G.G. The Measurement of Observer Agreement for Categorical Data. Biometrics 1977, 33,
159–174. [CrossRef] [PubMed]51. Gower, J.C. A General Coefficient of Similarity and Some of Its Properties. Biometrics 1971, 27, 857–871.
[CrossRef]52. Faith, D.P. Asymmetric binary similarity measures. Oecologia 1983, 57, 287–290. [CrossRef] [PubMed]53. Hair, J.F.; Black, W.C.; Babin, B.J.; Anderson, R.E. Multivariate Data Analysis; Pearson Prentice Hall: Upper
Saddle River, NJ, USA, 2010.54. Dunn, J.C. A Fuzzy Relative of the ISODATA Process and Its Use in Detecting Compact Well-Separated
Clusters. J. Cybern. 1973, 3, 32–57. [CrossRef]55. Rousseeuw, P.J. Silhouettes: A graphical aid to the interpretation and validation of cluster analysis. J. Comput.
Appl. Math. 1987, 20, 53–65. [CrossRef]56. Wu, L.; Yue, X.; Jin, A.; Yen, D.C. Smart supply chain management: a review and implications for future
research. Int. J. Logist. Manag. 2016, 27, 395–417. [CrossRef]57. Kiron, D.; Shockley, R.; Kruschwitz, N.; Finch, G.; Haydock, M. Analytics: The Widening Divide. MIT Sloan
Manag. Rev. 2012, 53, 1–22.58. McAfee, A.; Brynjolfsson, E. Big data: the management revolution. Harv. Bus. Rev. 2012, 90, 60–68. [PubMed]59. Lavalle, S.; Lesser, E.; Shockley, R.; Hopkins, M.S.; Kruschwitz, N. Big Data, Analytics and the Path From
Insights to Value. MIT Sloan Manag. Rev. 2011, 52, 21–32.

Logistics 2018, 2, 10 20 of 20
60. Suddaby, R. Challenges for Institutional Theory. J. Manag. Inq. 2010, 19, 14–20. [CrossRef]61. Banks, G.C.; Pollack, J.M.; Bochantin, J.E.; Kirkman, B.L.; Whelpley, C.E.; O’Boyle, E.H. Management’s
science-practice gap: A grand challenge for all stakeholders. Acad. Manag. J. 2016, 59, 2205–2231. [CrossRef]
© 2018 by the authors. Licensee MDPI, Basel, Switzerland. This article is an open accessarticle distributed under the terms and conditions of the Creative Commons Attribution(CC BY) license (http://creativecommons.org/licenses/by/4.0/).