Embed Size (px)
Citation preview
Research & Analytics Modeling Initiatives:
Using REMI TranSight Model
OUTLINE
• Purpose
• Introduction to REMI PI+ and TranSight
• Model Uses for ARC – Linking models
– General concepts
– Model applications
• Model Demonstration
ARC OBJECTIVES• Purpose
– Produce local long-range demographic, employment and economic forecasts for the 20-county ARC region
• Intent– Dedicated to informing public and private policy decisions
– Focused on research based analysis
– Orient stakeholders and decision makers on socio-economic and transportation impacts to our Region
• Goal– Continue to lead in regional economic forecasting and policy
analysis
– Provide economic development impact plans and assess travel demand changes to the region’s transportation network
INNOVATIVE APPROACH• Collaborating and create linkages for model application
and compatibility
• New methods for rebranding and financing our transportation system
• Bold decisions demand creative, sophisticated and robust tools capable of supporting these processes
• ARC engagement in performing scenario planning and economic analysis to consult, measure and capture specific impacts to our Region– Economic impact analysis to assist and inform benefits to
investment endeavors
• Business relocation and major developments in the Region– Assess projects of regional impact
MODEL DATA DEVELOPMENT OBJECTIVES• Conduct potential project prioritization plans
– Assist in developing a project list
• Perform sensitivity tests of the model and projects– Determine the model’s effectiveness for further consideration
– Measure the reasonableness of economic activity and transportation efficiencies of qualified projects
• Develop an economic impact study and analysis report on LPA projects; economic developments; projects selected for the TIP and RTP; and various regional market studies– Final documentation of findings and benefits of local and
regional impact studies
• Produce small area control totals; SE data for TDM and regional long-range forecasts
• Produce data for inter-departmental work programs and external ARC counterparts

REMI MODELS
• The next generation Policy Insight® model
• Comprehensive tool for evaluating the total economic effects of changes to transportation systems
• Comprehensive modeling estimating economic and demographic effects• Up to 169 industry sectors across 3,089 U.S. counties including 6,000+ fully adjustable policy variables updated yearly
• Integrates travel demand data, data on emissions, safety valuation factors, etc, and 3 additional transportation-related cost matrices with PI+

DISTINGUISHING MODEL FEATURES
• Incorporates transparent and
robust economic linkages built on
proven methods and theory
• Each model is custom built to match regional client specificity
• Measures economic impacts and
responsive demographic and
economic changes over time
• Model incorporates four unique quantitative methodologies
Integrated Dynamic
StructuralCustomized
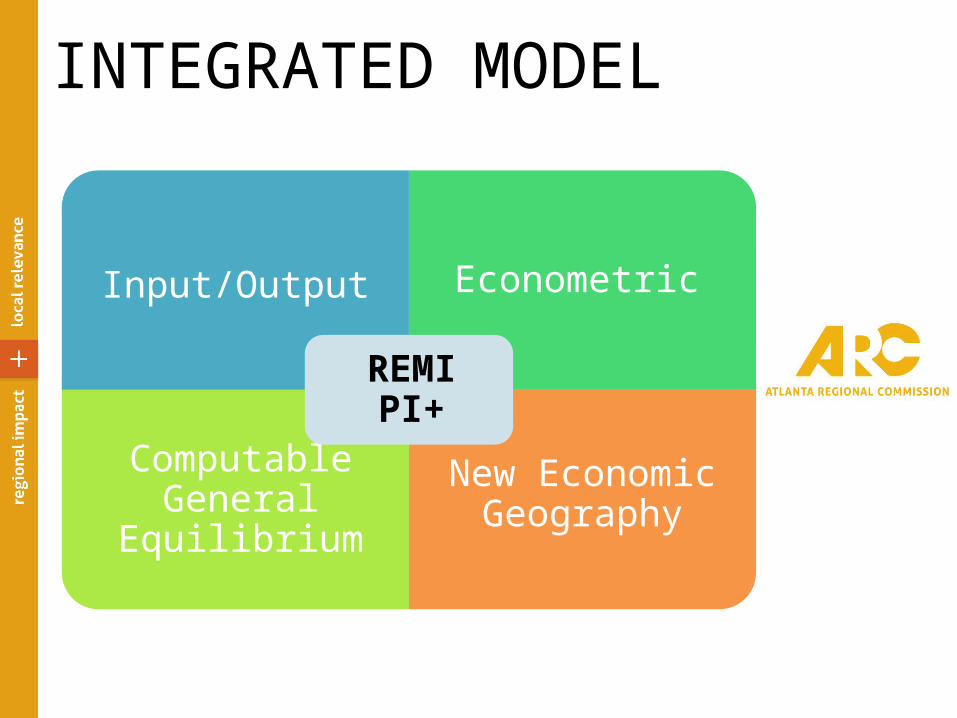
INTEGRATED MODEL
Input/Output Econometric
Computable General Equilibrium
New Economic Geography
REMI PI+
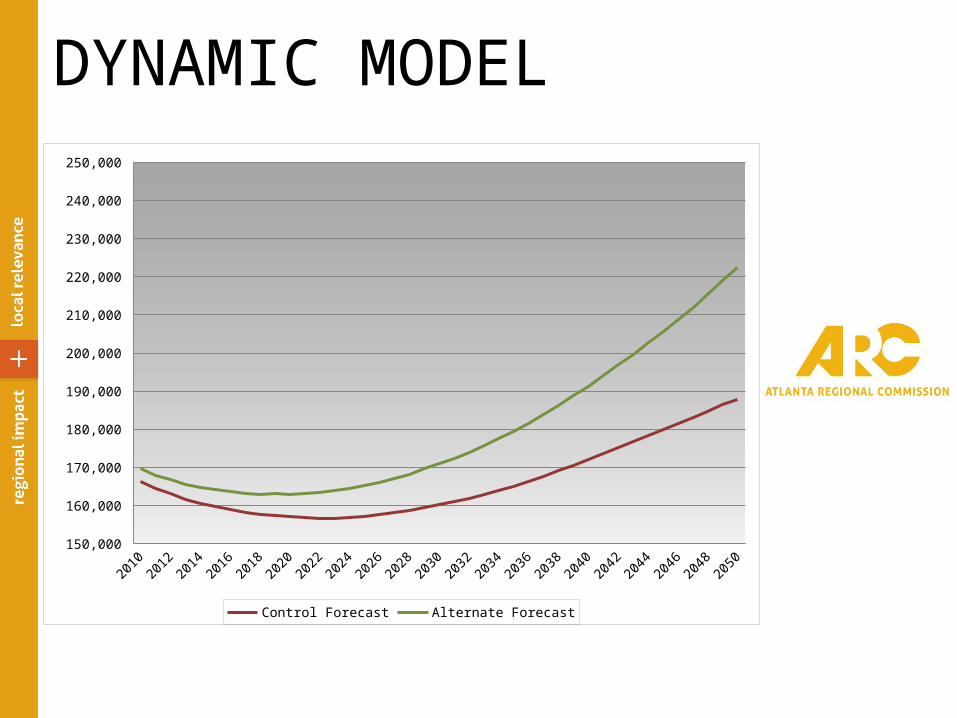
DYNAMIC MODEL
20102012
20142016
20182020
20222024
20262028
20302032
20342036
20382040
20422044
20462048
2050 150,000
160,000
170,000
180,000
190,000
200,000
210,000
220,000
230,000
240,000
250,000
Control Forecast Alternate Forecast
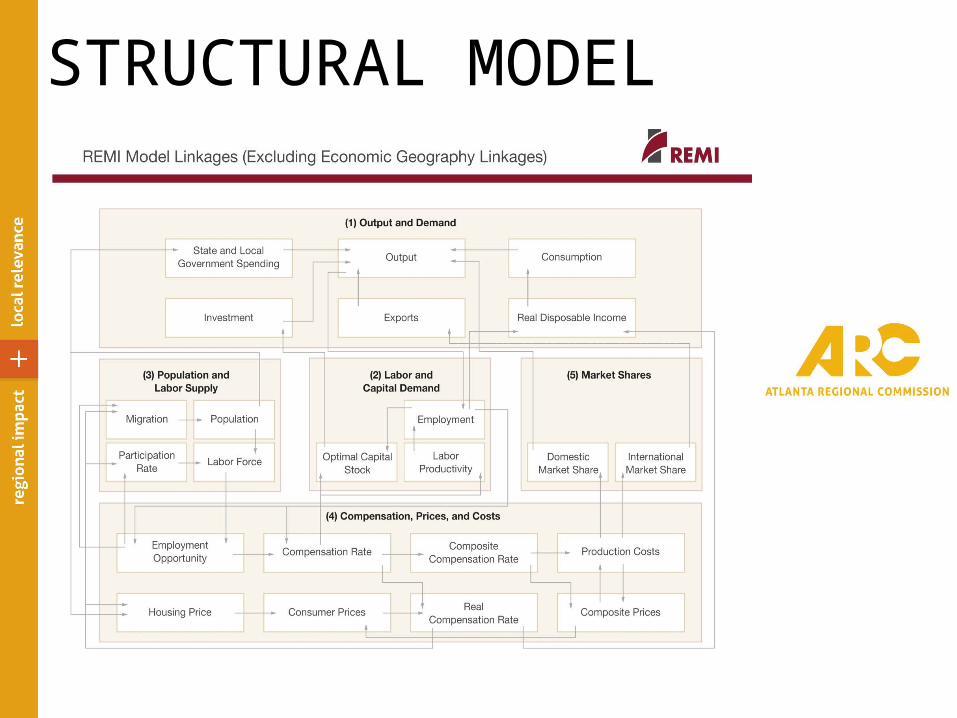
STRUCTURAL MODEL
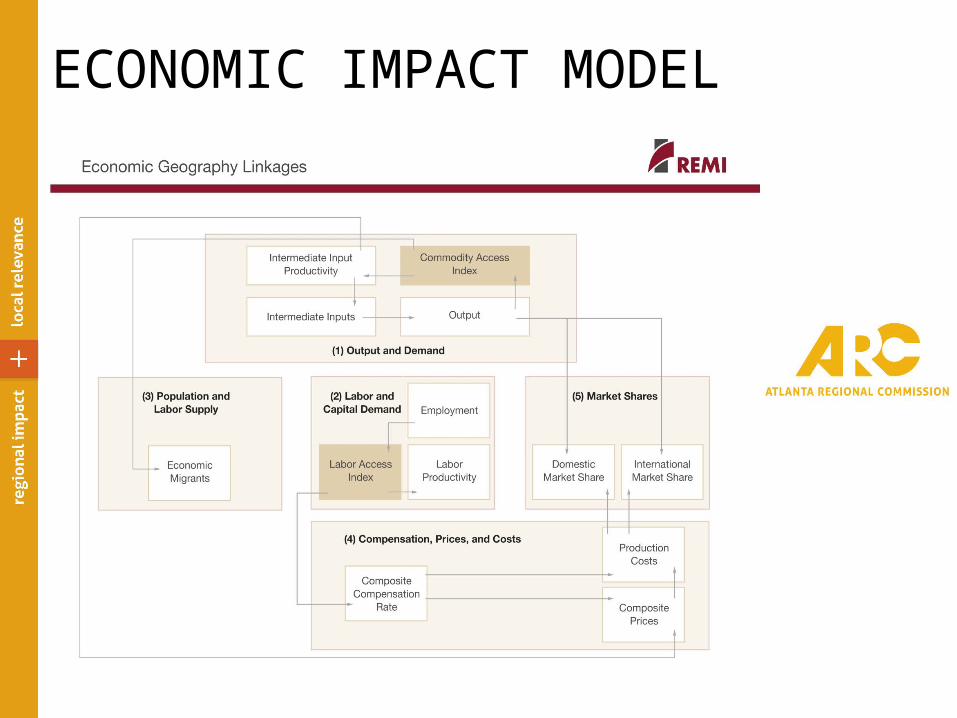
ECONOMIC IMPACT MODEL
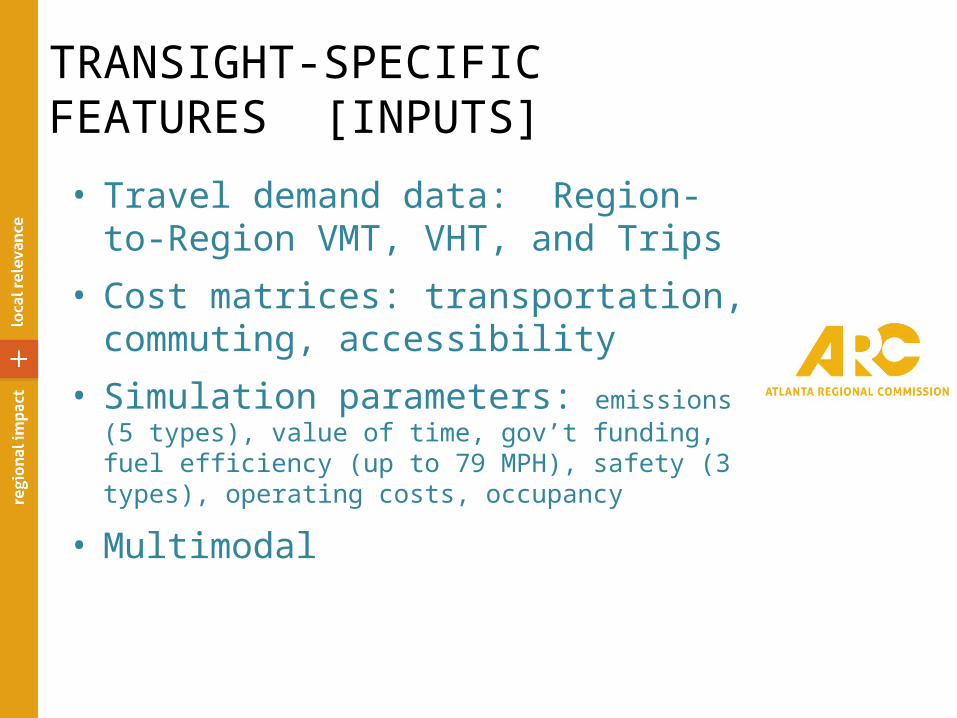
TRANSIGHT-SPECIFIC FEATURES [INPUTS]• Travel demand data: Region-to-Region
VMT, VHT, and Trips
• Cost matrices: transportation, commuting, accessibility
• Simulation parameters: emissions (5 types), value of time, gov’t funding, fuel efficiency (up to 79 MPH), safety (3 types), operating costs, occupancy
• Multimodal
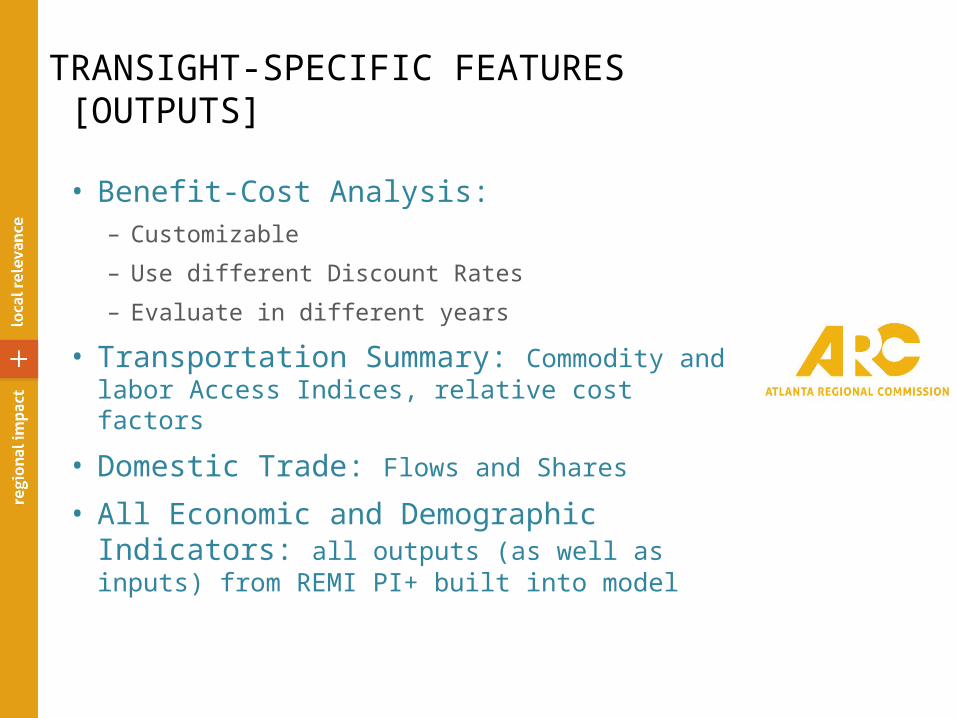
TRANSIGHT-SPECIFIC FEATURES [OUTPUTS]
• Benefit-Cost Analysis:– Customizable
– Use different Discount Rates
– Evaluate in different years
• Transportation Summary: Commodity and labor Access Indices, relative cost factors
• Domestic Trade: Flows and Shares
• All Economic and Demographic Indicators: all outputs (as well as inputs) from REMI PI+ built into model
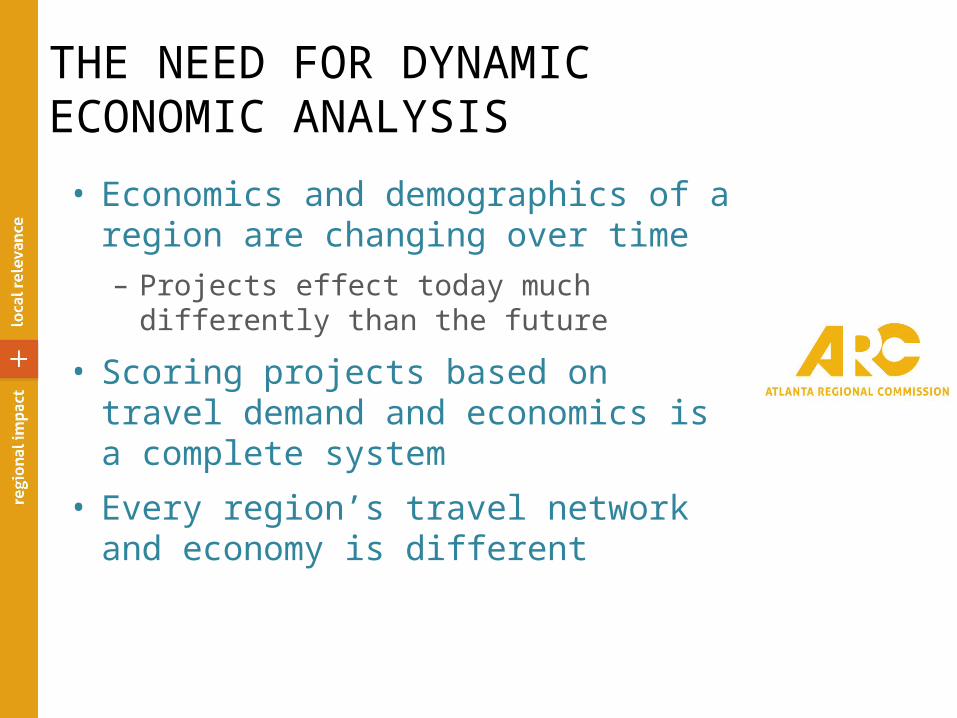
THE NEED FOR DYNAMIC ECONOMIC ANALYSIS• Economics and demographics of a region
are changing over time– Projects effect today much differently than
the future
• Scoring projects based on travel demand and economics is a complete system
• Every region’s travel network and economy is different
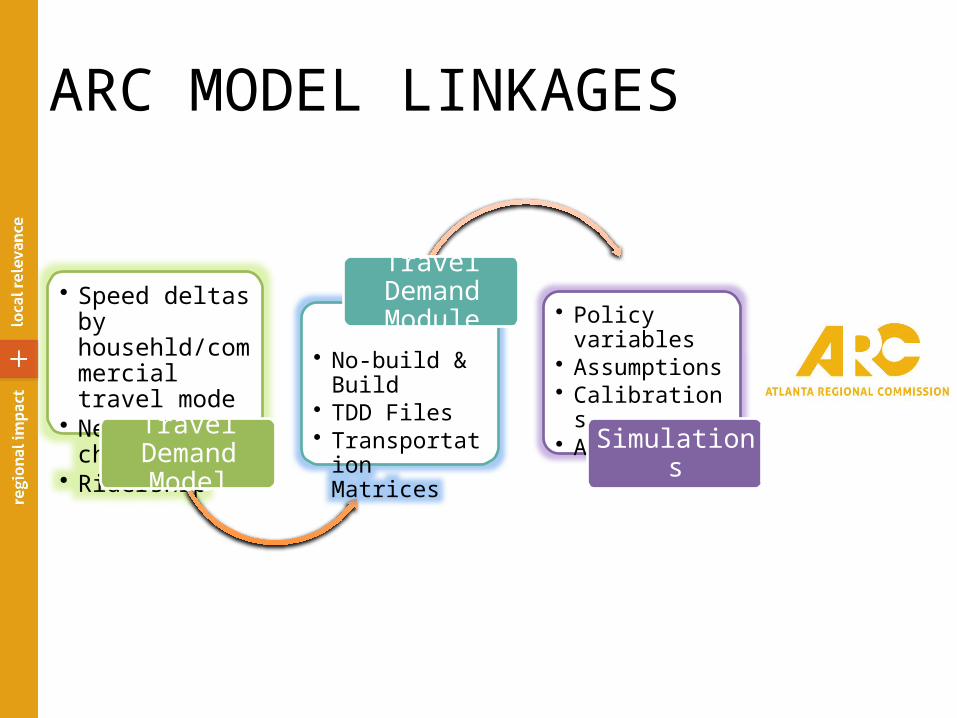
ARC MODEL LINKAGES
• Speed deltas by househld/commercial travel mode
• Network changes• Ridership
Travel Demand Model
• No-build & Build• TDD Files• Transportation
Matrices
Travel Demand Module • Policy variables
• Assumptions• Calibrations• Analysis
Simulations
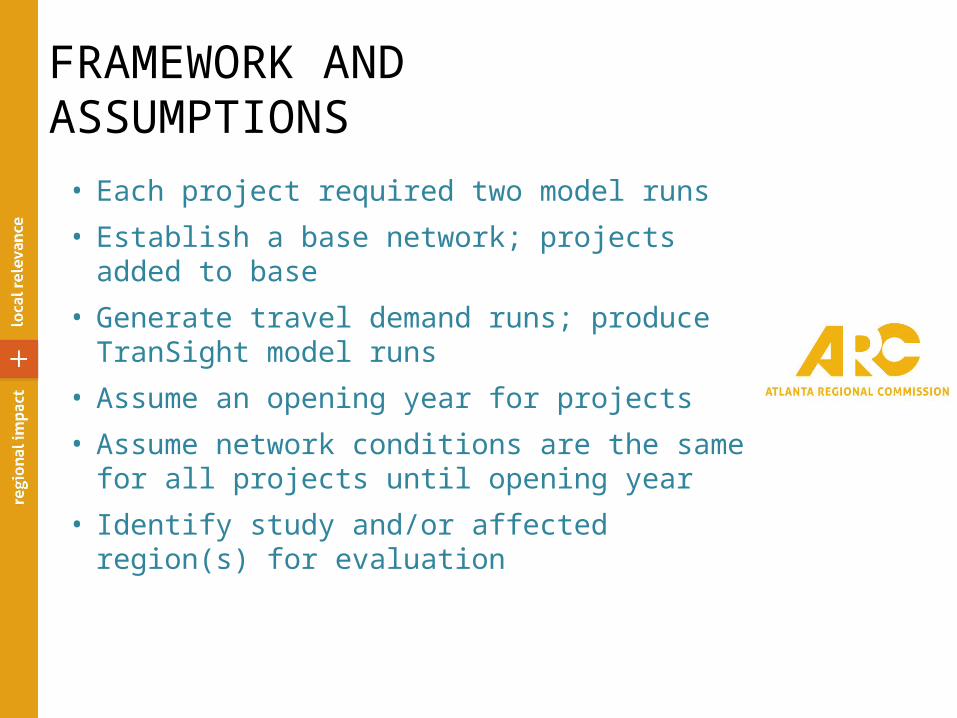
FRAMEWORK AND ASSUMPTIONS
• Each project required two model runs
• Establish a base network; projects added to base
• Generate travel demand runs; produce TranSight model runs
• Assume an opening year for projects
• Assume network conditions are the same for all projects until opening year
• Identify study and/or affected region(s) for evaluation
PRIORITIZATION PROCESS
• Provide multi-regional and county-level comparative analysis of project results against a baseline or no-build travel scenario
• Intent is to show transportation and economic investment influences at a regional and sub-regional level
• Estimate project’s value by each affected county and on the Region
SENSITIVITY ANALYSIS PROCESS• Three projects submitted according to its
plan, objective and impact on the region
• Illustrate project’s economic changes from baseline and influences locally
• Quantify inter-regional and region benefits
• Standardize policy variables used for evaluating county level economic activity and mass transit investment
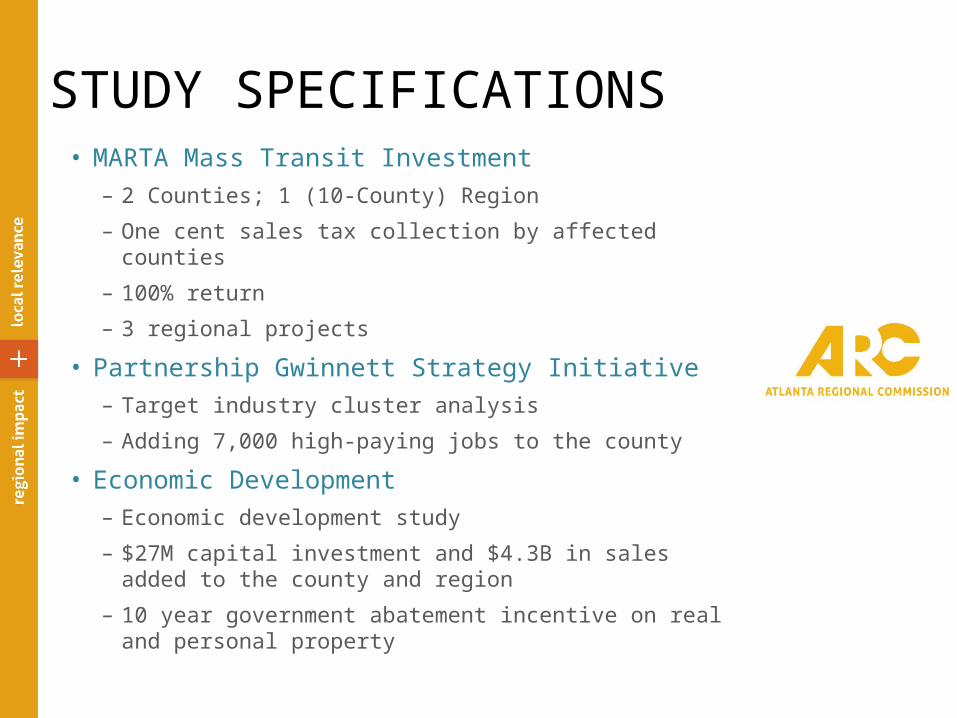
STUDY SPECIFICATIONS• MARTA Mass Transit Investment
– 2 Counties; 1 (10-County) Region
– One cent sales tax collection by affected counties
– 100% return
– 3 regional projects
• Partnership Gwinnett Strategy Initiative– Target industry cluster analysis
– Adding 7,000 high-paying jobs to the county
• Economic Development– Economic development study
– $27M capital investment and $4.3B in sales added to the county and region
– 10 year government abatement incentive on real and personal property
[Model Demonstration]
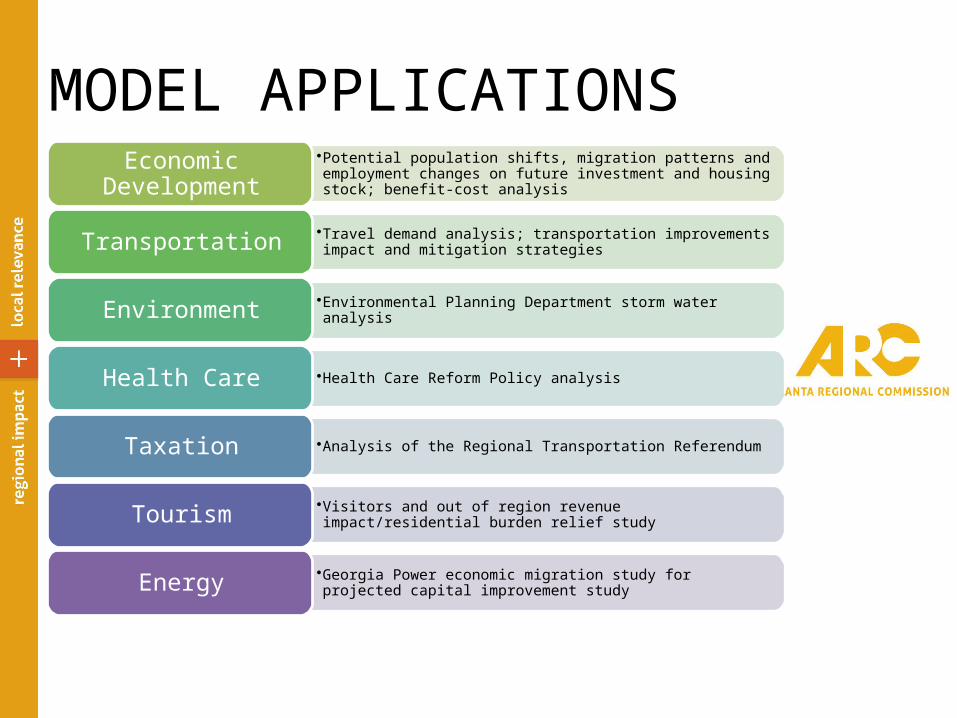
MODEL APPLICATIONS•Potential population shifts, migration patterns and employment changes on future investment and housing stock; benefit-cost analysisEconomic Development
•Travel demand analysis; transportation improvements impact and mitigation strategiesTransportation
•Environmental Planning Department storm water analysisEnvironment
•Health Care Reform Policy analysisHealth Care
•Analysis of the Regional Transportation ReferendumTaxation
•Visitors and out of region revenue impact/residential burden relief studyTourism
•Georgia Power economic migration study for projected capital improvement studyEnergy
CONTACT & RESOURCE INFO
Colby [email protected] Planner, Research Division404.463.3322 office
Atlanta Regional Commissionwww.atlantaregional.com