Embed Size (px)
Citation preview
Archaeological Field Survey and Prospection: Interp retation and
Analysis.
An introduction to the session
Willem Beex
BEEX, The Netherlands
For Bert Voorrips, Susan Holstrom and Hans Kamermans. Abstract: This paper will address several issues of archeological field survey. The first part will discuss the
theoretical background of this research method. In the second part an example, the Agro Pontino Survey
Project, will be used to focus on the practical background.
Keywords: Archaeological Field Survey, Argo Pontino, Factors influencing Field Survey.
Part I: Theoretical issues
Why Field Survey?
Excavations are probably perceived as the most typical form of archaeological research. But in our present-
day situation the location of these excavations is often a result of planned new construction work. We call
these rescue excavations. And although there will be a scientific reason for each one of them, at least in the
frame-work of modern archaeological management, these locations are not representing a systematic way of
gathering sites. For this reason any good old-fashioned field survey, in this paper regarded as “walking the
fields”, might still be a great help.
The Three Aims of Field Survey
In general there are three main reasons why to conduct a field survey. And of course most surveys will have
some overlap regarding these aims. But it is wise to reflect on these three aims, as they determine the way
surveys have been conducted, and how techniques evolved.
The first aim for a field survey, and the oldest one, was to choose the best possible location for an
excavation. This is called “Locate the best site”. The problem is of course, that this is a very dangerous
enterprise from a scientific point of view. As any selection it will often be regarded afterwards to be
representative for a society, and in this case without any possibility of analysis.
The second aim, and the most common one nowadays, is to create a map for archaeological management.
In an ideal situation, this map will provide the correct information on what to protect, what to excavate, and
what areas are “save” to develop. The catch is however, that there is no ideal situation. In fact, if there would
be an ideal situation (and map), this would imply that the archaeologist would know everything about this
area, so no further field research is necessary. (Just think about this philosophical statement…)
Finally a survey is conducted to gain new scientific information about a region or a society. Once again the
major problem is the question of representativeness; for instance in selecting an appropriate area.
International Conference on Cultural Heritage and New Technologies | Vienna | 2014
2
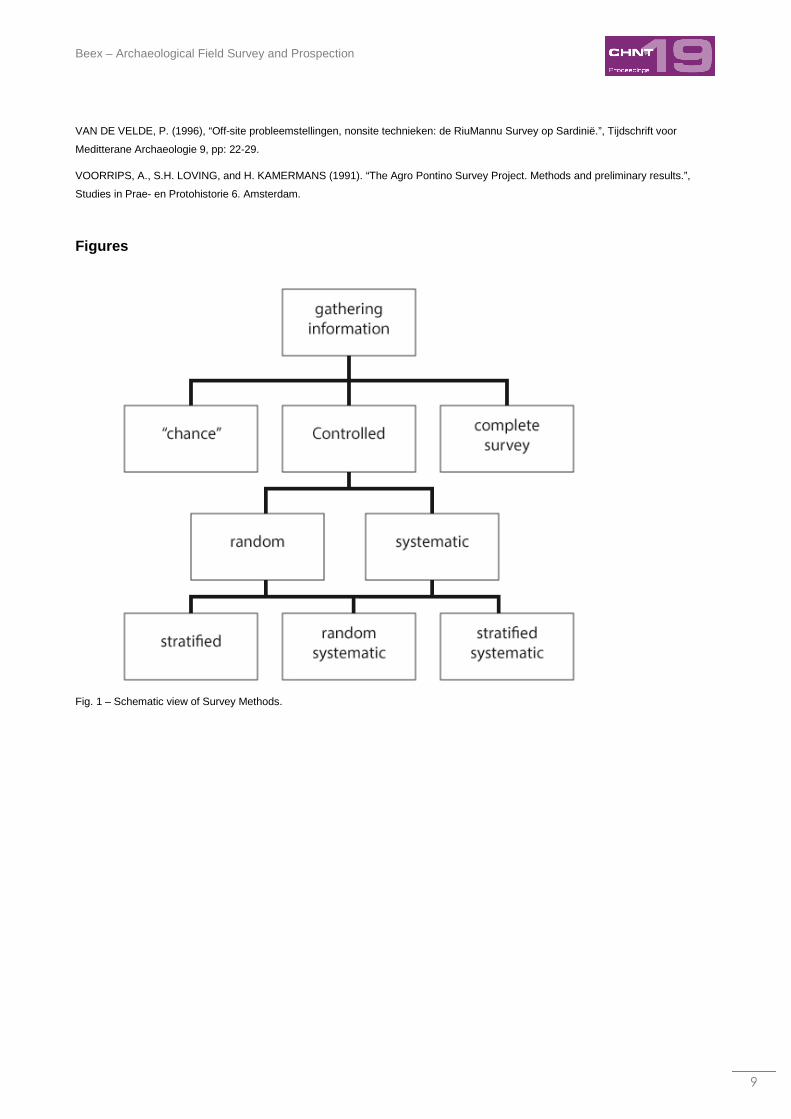
All this shows that any survey is in fact a sample. And as such, it has to be a representative sample in order
to allow for any real scientific conclusions (Fig.1.).
Three Ways of Conducting Field Survey
As far as can be determined at this stage, there are also three ways of conducting a field survey. It started all
with a very intuitive way of gathering finds. For this paper it will be called “Cookie Jar-Survey”, as it is picking
up the (most) beautiful artifacts of a site. This way of surveying is (or was) often used to get a nice collection.
Or in a more scientific way, to determine the age and function of a site. This is more an addition to an
excavation. Not a method to gain information of (part of) a landscape.
A completely different approach is what has been called a “Complete-Survey”. With of course the aim to
collect everything of a certain area. But although this aim is very noble indeed, the end-result doesn’t take
into account facts like erosion, or “fresh” deposition of soil. Therefor this method may sound like the ideal
way of conducting a survey, but in reality this will never be possible.
Of course this name and definition should not be mistaken (or used) for a survey with the aim to inspect as
much of an area as possible. And there are certain advantages of this way of conducting a survey (see
below).
The final method is the “Systematic Survey”. And this is a broad definition. In this paper it will be used for any
survey that allows for spatial analysis of the examined area. The survey will achieve a probabilistic sampling.
This can be a “Simple Random Sampling”; for instance based on random co-ordinates, or on randomly
chosen fields or units of an area. However, in the reality of archaeological science, the simple random
sampling is very rare.
The reason is of course that many archaeologists already have some advanced knowledge of certain
variables; for instance different types of soil, and areas with erosion or recent new deposits. And these
variables are biasing the survey. The solution is to subdivide an area into strata. After which each stratum
will be randomly sampled. This method is called “Stratified Sampling”.
Statements on “Complete Survey” vs. “Systematic Sur vey”
Although most archaeologists use a systematic survey nowadays, there are still a lot of supporters for the
complete survey. This support is mostly based on the following arguments:
- Rare or low-frequency archaeological phenomena will only be noticed during a complete survey.
- A systematic survey will give an incomplete view of the geographical relationships between sites.
- Location variables are only (or far better) specified with a complete survey.
- Stratifying research is not necessary for a complete survey. This will also avoid problems in comparing
results.
- The scale of research units can be changed more easily within a complete survey.
- The results of a complete survey are richer and more varied.
But these arguments are mostly in-correct:
- Finding rare phenomena is related to the density of the observation, not to the total area of the observation.
Beex – Archaeological Field Survey and Prospection
3
- Geographical relationships between sites will indeed be better observed in a more complete view of the
research area. But this can also be done by increasing the sample; or by systematically surveying as much
as possible in an area.
- Location variables can be seen as well with a correct sample-size. And in such a situation they can also be
statistically valued.
- Comparison always uses an interpretation of facts. And stratification is just a method for interpretation.
- The scale of the research is related to the density of observational grid. This grid is in depended from the
survey-method.
- The size and quality of the dataset is the result of the intensity and the selectivity of the fieldwork, no the
method of survey.
Site Survey, Off-Site Survey and Non-Site Survey?
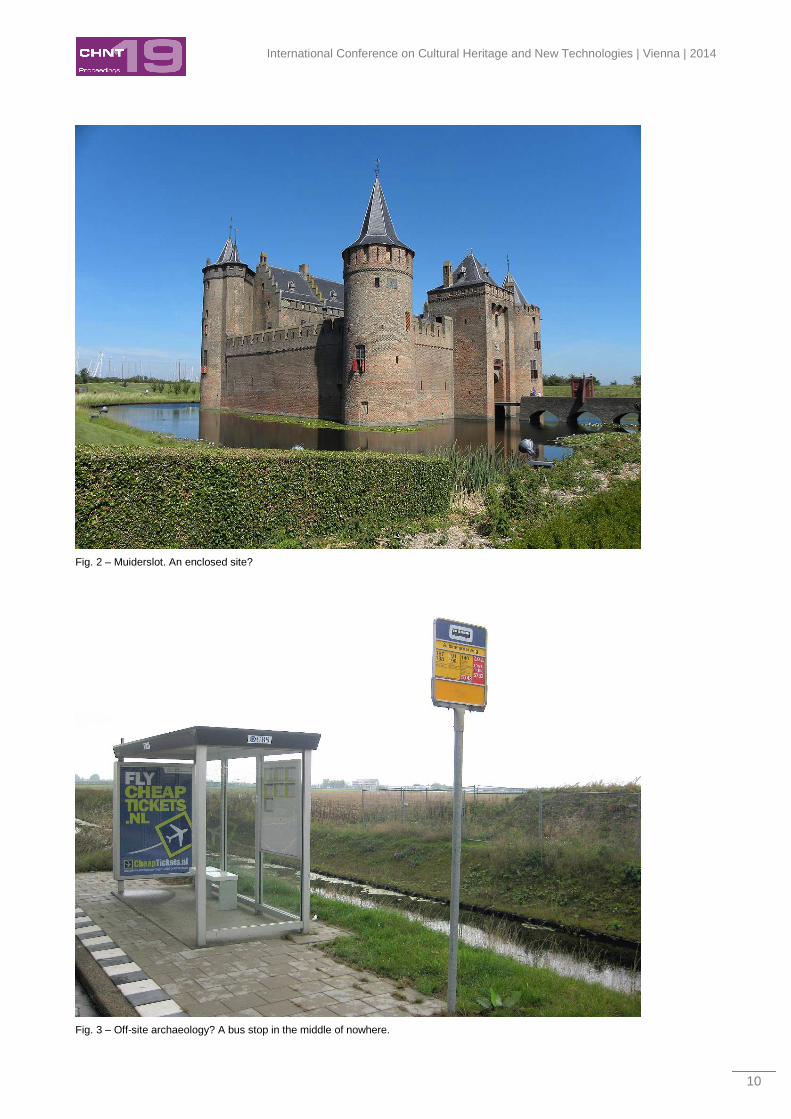
One aspect of an archaeological field survey with a lot of discussion has to do with the continuity of the
archaeological dataset. In urban archaeology, and especially urban archaeology dealing with fortified
settlements, there is a tendency to divide the pattern of the archaeological dataset into sites and off-site
areas. And of course there will be a sharp drop-off in density of artefacts outside a walled settlement.
However, this idea implies that the archaeological dataset is discontinued. And this is most certainly not the
case! Despite dramatic differences in density in certain situations, perhaps only a real physical barrier (the
ocean for a pre-sailing society; parts of the Himalaya and the Alps) will block part of this dataset at a certain
edge (Fig.2).
Furthermore this idea is often the result of a way of thinking; for instance in focusing on the importance of the
city in relation to the peasant environment. But this way of thinking doesn’t take into account all kind of other
phenomena like terraces, roads, quarries, storages, certain arts and crafts, etc. So in order to avoid this
discontinuity, a “non-site”-approach is the best way to look at a survey (Fig.3).
What the survey will show with this approach, and in quality and quantity of course depending on the density
of the grid, are clusters of artefacts with different intensities; perhaps coming from a one-time stop of a
traveler, or from the remains of a large cemetery.
Part II: Practical issues from the Agro Pontino Sur vey 1979-1989
The Agro Pontino
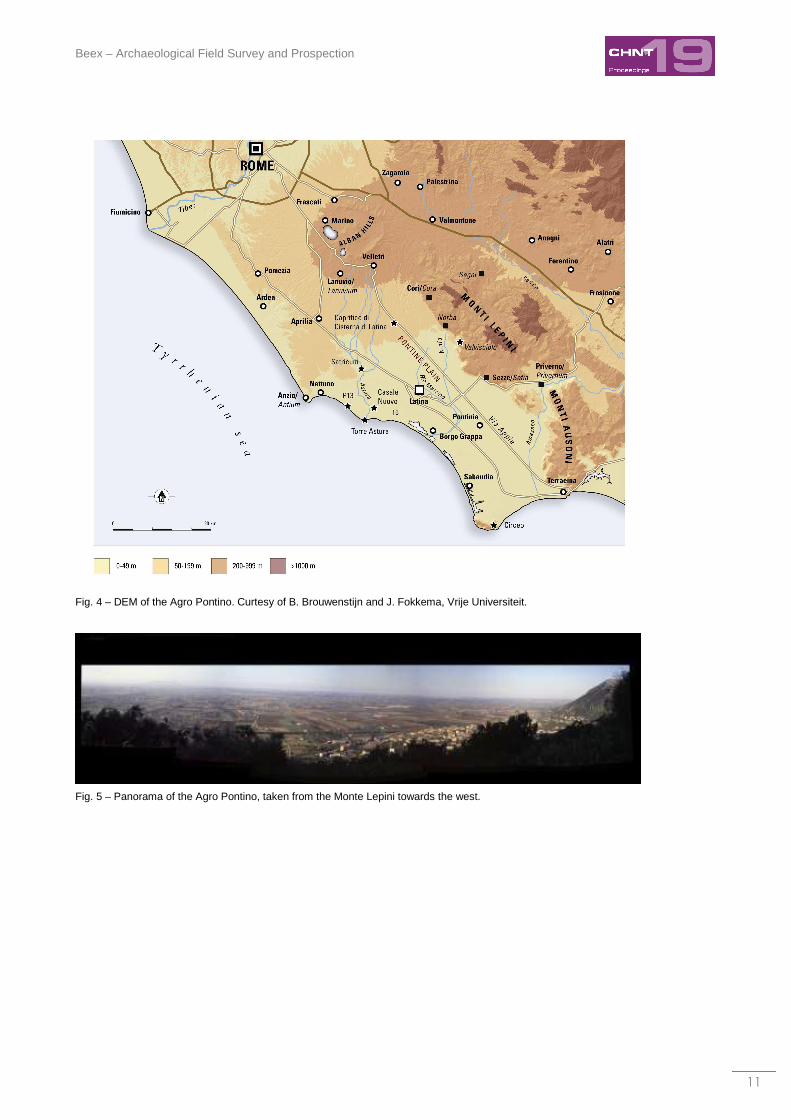
The Agro Pontino is roughly a rectangular area 50 kilometers south-east of Rome in the region of Lazio, and
about 45 kilometers long by 20 kilometers wide. The area is defined by the city of Anzio/Nettuno in the north-
west. The town of Cisterna di Latina represents the north-east corner. Terracina is situated in the south-west
and the Monte Circeo marks the south-east. On the eastern side it is bordered by the Lepini Mountains,
while the Tyrrhenian Sea forms it’s southern and western border. And generally the river Astura is
considered to be the northern boundary (Fig.4).
In 312 BC the well-known Via Appia was constructed at the inland side of the region. But during historical
times the area was infamous for the marshlands and diseases (malaria). A situation that continued well into
the twentieth century, until the land-reclamation of the 1920’s and 30’s during the Fascist Era made the area
International Conference on Cultural Heritage and New Technologies | Vienna | 2014
4
inhabitable and very suitable for agriculture. Although the true inhabitants of the region claim, that it was the
use of DDT after WWII that finally got rid of all problems.
Most modern cities and villages, except along the Appia or on the edge of the region, date from this period.
This makes it a very special part of Italy, with colonists and their immediate decedents from mainly the
northern part of the country. They got their “piece of the world” like veteran soldiers in Ancient Roman Times,
as promised by Mussolini and his government.
Archaeology and History of the Agro Pontino
During the land-reclamation of the past century it became clear that the area was already frequently visited
by Neanderthals. It must have been a very interesting region for them, with a large plain (certainly as the
seashore was much farther extended as nowadays), old dune-ridges and caves in the nearby mountains and
in the Monte Circeo (Fig.5).
After the Paleolithic Period not much is known of the Mesolithic, the Neolithic, or the Bronze Age. (Most
information comes from this project and the follow-up by both Dutch and Italian surveys and excavations.)
But during the Iron Age several sites existed. Like Satricum close to the river Astura.
In Roman Times the eastern part, and not really hampered by the marshlands, became very well cultivated.
Along the Via Appia, yet only between this road and the mountains many “villae” were build. And some of
them have been really impressive, with huge storage rooms still visible (and in use by modern farmers) at the
time the author visited the region.
At the end of the Roman Era the situation deteriorated however. The climate apparently became much
wetter, and the Via Appia also acted as a kind of obstruction for the natural flow of water towards the sea.
This also increased the number of mosquitos carrying malaria, making the Agro Pontino a very unhealthy
place to stay.
For centuries this was the fate of the region, with only marginal activity and a very small population until
several attempts were made to cultivate the area. This started during the Renaissance, but none of these
attempts succeeded however. Most organizers lacked the means to carry out such a project in the end, while
the few locals and surrounding communities, with the help of other Italian States, sabotaged these plans for
different reasons.
It took an unified Italy with a firm (brutal?) organization to finally succeed. This was called the “Bonifica” and
started in 1929 and was officially finished in 1939. Littoria was founded as a new city and declared to be the
official capital of the new province, while the main drainage of the lands was accomplishes by creating the
“Canale Mussolini”. After WWII both names were swiftly altered into Latina for the capital and the province,
and into “Canale delle Acque Alte” for the canal. But during the days in the 1980’s while the author
participated in these surveys, you didn’t came far using those new names…
History of the project
The Agro Pontino Survey was originally carried out by the Institute for Pre- and Proto-history (IPP) of the
University of Amsterdam, The Netherlands. And after the transfer of Hans Kamermans to the Institute for
Prehistory at the State University of Leiden, his new department also participated in the project. In 1979 and
Beex – Archaeological Field Survey and Prospection
5
1982 two preliminary campaigns were held, in order to check the conditions for the fieldwork in this region. In
1989 a final campaign was organized to gather some additional information. In this paper however, the focus
is on the three campaigns of 1984, 1986 and 1988. These three seasons formed the basis of the project and
were the three sources of information with an equal sampling strategy, on which the scientific conclusions
could be drawn.
This survey should not be mistaken for later research carried out by the State University of Groningen, and
several Italian projects. These projects are the worthy successors of the campaigns mentioned in this paper,
and therefore they have their own scientific basis.
The project was carried out by Dr. A. Voorrips, Dr. S.H. Loving-Holstrom and Dr. H. Kamermans. Dr. A.
Verhoeven should also be mentioned, as he is the author of the article examining the visibility factors
affecting artifact recovery; a part of the research very important for this paper. Many other co-workers, too
many to mention here, also joined the project during all those years.
The reasons for the project
The region of the Agro Pontino was brought under the attention of the IPP by Dr. J. Sevink from the
Laboratory for Physical Geography and Soil Science of the University of Amsterdam. He and his team were
doing soil surveys in the area, while encountering many archaeological finds.
After a first inspection in 1979, it also became clear that the special history of the region provided an
excellent research area. Most of the surface in the area had been stable since Roman Times, while the
impact of the modern land reclamation of the 1920’s and 1930’s was still very limited. (A huge contrast with
recent more recent expansions…)
The aims of the project
In total four aims were formulated. To quote Dr. Voorips:
1. To gain an overall idea of the development through time of the settlements patterns in the Agro
Pontino;
2. To link the changes in patterning in socio-economical studies;
3. To control for environmental changes by means of palynological studies;
4. To collect data in such a way that they could be used as a basis for more detailed studies of
specific time periods and/or problems.
Soils in the Agro Pontino
In summary there are six main soil types in the region. There is a coastal beach ridge with lagoons. There
are deposits of aeolian sands. More inland there are lagoonal clays, followed by a peat area and ending in
the colluvium form the mountains. These mountains also result in a small area with travertines in the north-
east (Fig.6).
International Conference on Cultural Heritage and New Technologies | Vienna | 2014
6
Survey Sampling Design
The basis for the field-walking was a so-called systematic, unaligned transect sample. The reason for this
were the vegetational zones, that could be used a strata. The area was then divided into five blocks, and in
each block a transect was randomly chosen. (For a full detailed description of the statistical techniques
behind this method, see Voorrips 1991.) In total 727 fields were surveyed, making the sample large enough
for most statistical analysis.
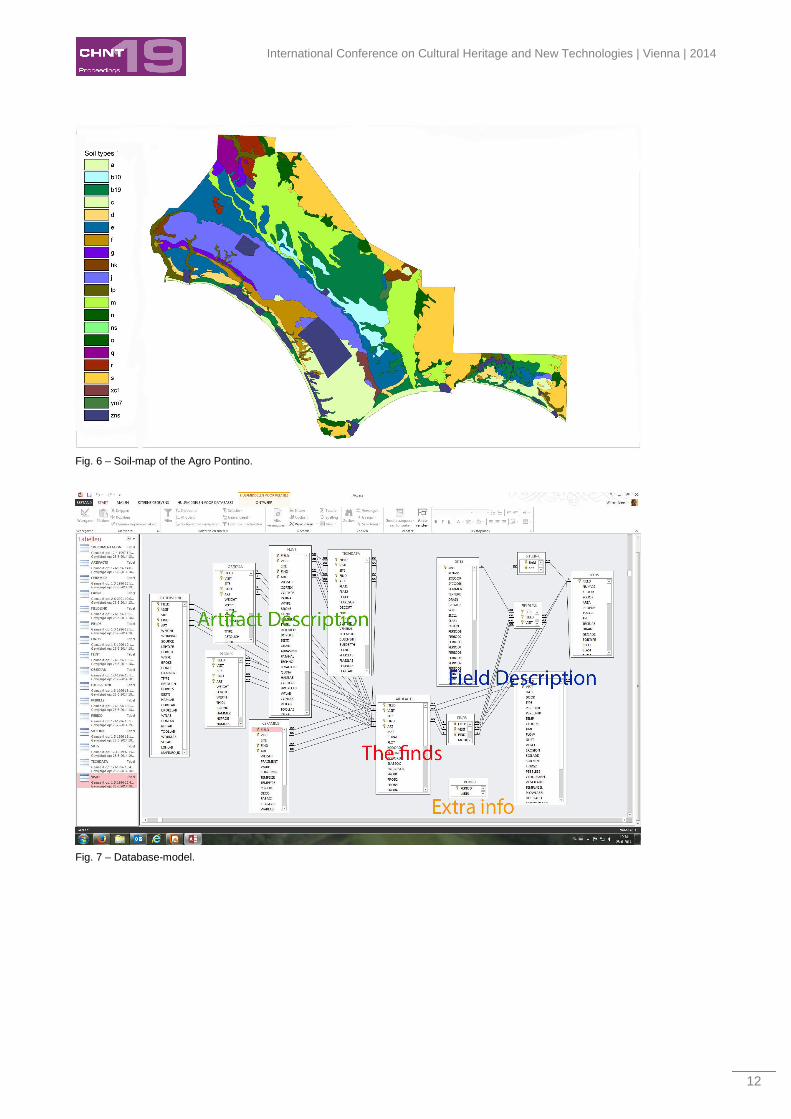
The technical backbone of the project: the database and geographical information system
Although the Agro Pontino Survey Project was developed between 1979 and 1982, during its first real
sampling survey season in 1984, a well-designed computer-database was created from the beginning.
Standardized forms were used in the field, and digitized in the field-lab.
In 1984 an Apple IIe computer with one 5,25 inch floppy-disk was at the survey-house for this task. The
information of these floppies were transferred to the main-frame of the University of Amsterdam, once back
in the Netherlands. In 1986 and 1988, thanks to the rapid development of personal computers, a “portable”
PC could be brought to the field-lab, including a full local version of the database. Only for practical reasons
at the time, the software used was dBase III (plus). This overcame the use of the old main-frame, both as a
means for storage and analysis. And during the 1990’s this database was updated to new SQL-software,
working with Windows (Fig 7).
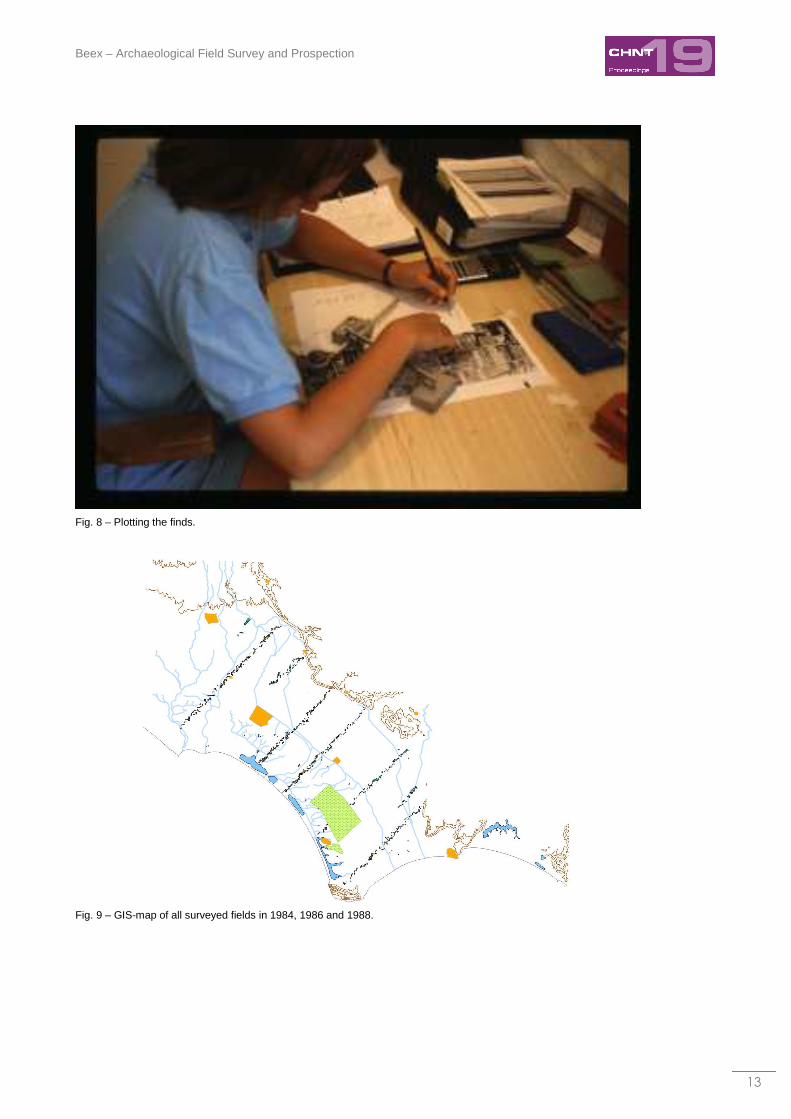
All topological information, more specifically the field-mapping, was done in the field by plotting them on
1:5000 aerial photographs or on 1:1000 millimeter drawings. The location of each field was also correctly
outlined on copies of the topological maps of the region (Fig.8).
Although all this information was analogue in origin, it was relatively easy to transfer all text, points, and
regions into a GIS-application during the 1990’s. This was done at the same time of the update of the
database and resulted in a fully operational digital environment, including all correct spatial information.
All the digital information was published in full on an official CD produced in 2004, concluding this Agro
Pontino Archaeological Survey. But for this paper both the database, as well as the GIS-maps, were updated
to new versions of the software as used in 2014. Being Microsoft Access and MapInfo, and still only used for
practical reasons. This ensured faster analysis and better integration with modern systems (Fig.9).
The fact that both the original textual and the graphical information survived without any loss of data, and still
can be queried thirty years later, is surely one of the greatest achievements of this project. And as such this
project has to be an example for most archaeological projects. It could not have been done without the
brilliant design of the database by Bert Voorrips in those early days. Yet even so, most of the information
would still have useless nowadays without the continues effort of Susan Holstrom. And last but not least any
modern scholar has to thank H. Kamermans, who not only got his PhD for (part) of the analysis of the Agro
Pontino, but who realized the update of the database and the digitizing of all graphical sources.
Without their longtime personal commitment to this project, this paper could not have been written!
Beex – Archaeological Field Survey and Prospection
7
Factors influencing this specific archaeological fi eld survey: old results
In 1991 Arno Verhoeven published his famous article in the first overall publication of the project (see
Voorrips ed, 1991). His contribution: “Visibility factors affecting artifact recovery in the Agro Pontino Survey”,
was able to take all information from an already updated database and faster computers into account;
allowing for many swift computations.
Interesting in his paper is the fact that he can show that the visibility factors in The Agro Pontino only had a
limited result on the overall outcome of the survey. This has surely to do with the diversity of fields in the
area, and the fact that there were multiple campaigns over different periods of the year.
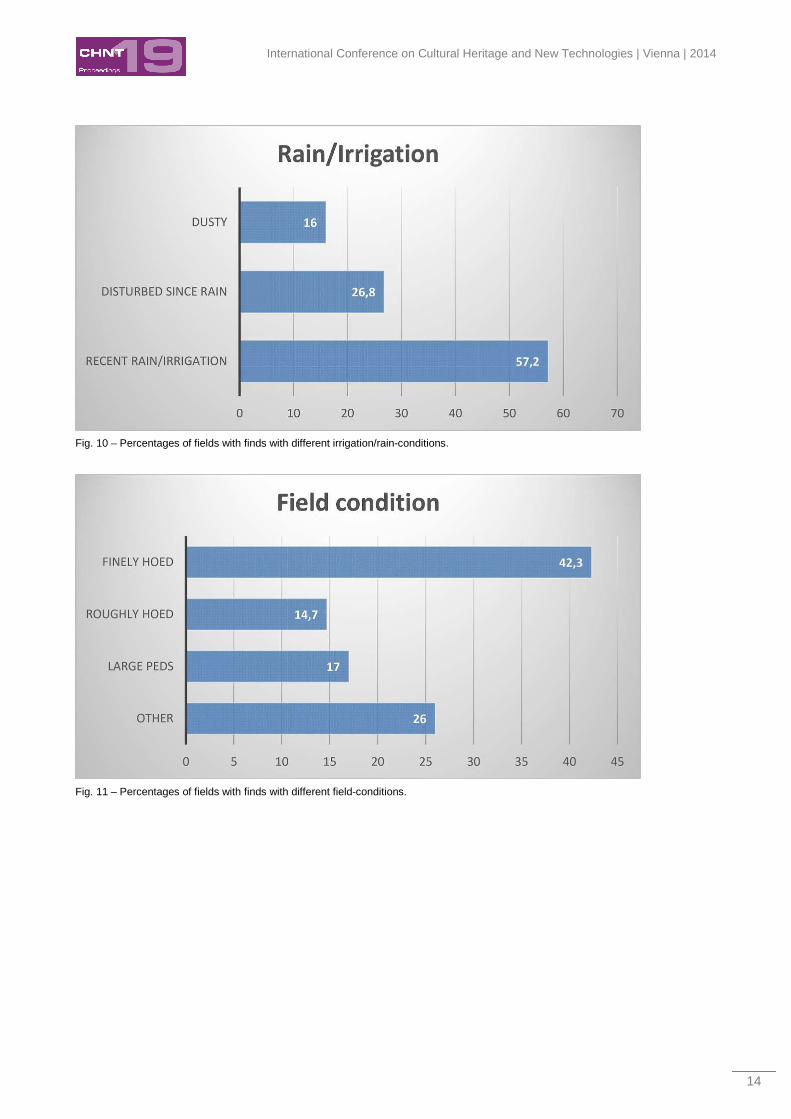
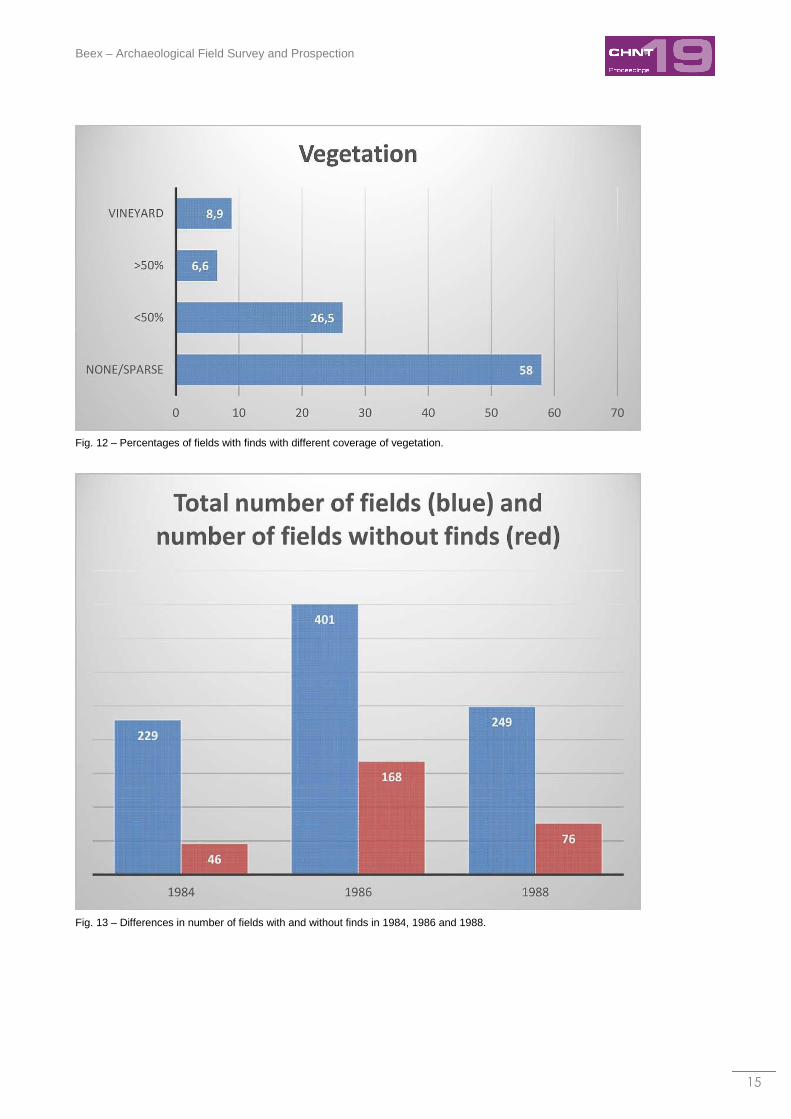
Of course if we look individually at the factors he investigated, there are many significant differences. Rain
and irrigation do play an important role, as is shown (Fig.10). The same applies for the field condition
(Fig.11), as well as for the coverage with vegetation of a field (Fig.12). So why do these differences not
reflect into the overall picture?
The very simple answer is, as shown already in this early research by Verhoeven, that all these differences
are averaged (“smoothened out”) by the total amount of fields. The few dusty patches, the few overgrown
areas, they cannot influence the general trends in the picture. But only if the “sample” is large enough!
Factors influencing this specific archaeological fi eld survey: new results
In 2014 it was of course possible to use all data with a fully integrated GIS-system and perhaps even more
important, with a computer capable of processing all data in a matter of seconds. As opposed to 1990, 1993,
or even in 2000, while even analyzing all graphical information. This allowed the author to seek for new and
unknown factors that influenced the survey.
The major new goal was to introduce the spatial element into the equation, as well as the time of the day,
and the seasons of the year. But unfortunately it did show that a real time-stamp for any visit was the only
item never to be fully recorded during all those years. It truly is a heritage of the past. And it may well be the
worst omission of this project (and therefore in the database) that is really regrettable for this paper.
With only a rough division into “early morning”, “late morning” and “early afternoon”, this factor could not be
investigated in depth. Of course the fact that it wasn’t recorded more extensively also had to do with the way
the field-work had to be carried out. For practical reasons during our stay, many logistical tasks were
reserved for either the early morning, or the early afternoon, reducing much of the actual field-work to the
period between nine o’clock and noon.
Despite this set-back, two interesting new factors were found, that had to be explained. First of all there were
significant more fields with finds absent in the 1986 season: about 29%, in contrast to 16% in 1984, and 23%
in 1988 (Fig.13). And this example clearly shows the importance of spatial knowledge of the survey-area.
Without this spatial knowledge the difference might easily have been explained with the number of junior
students in the 1986 team. On a closer look however, many of the fields surveyed in 1986 were in the former
Holocene marshlands and away from the coastal ridges with Paleolithic sites. This also explains the 23% in
1988.
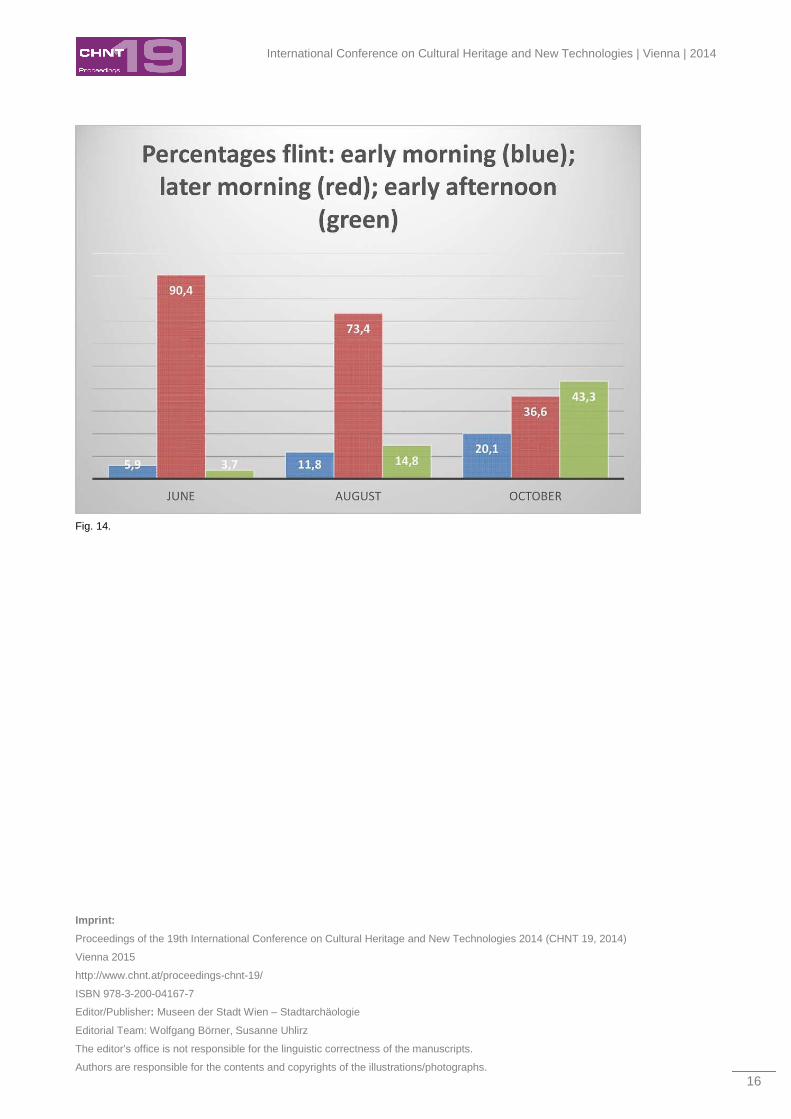
The second factor is the somewhat strange distribution of percentages of fields with flints during the three
seasons. Here help for a correct interpretation came from many amateur-archaeologists known to the author,
who always claim that flint artifacts are more easily found during and around the winter-months. For the
International Conference on Cultural Heritage and New Technologies | Vienna | 2014
8
simple reason that flints are shiny, a bit like glass. So they will reflect the sunshine, and draw attention to
them. And at the same time sherds, and other non-reflective artifacts, are less visible because of the high
contrast of the sun in those months.
This is certainly a possibility in this case. As there are still more days with sunshine in October in this region
in Italy, as there are rainy days.
Factors influencing archaeological field survey: an alysis and conclusion
In the example of the Agro Pontino the most important result is perhaps “the averaging of all visibility
factors”. This could be done because of the three campaigns; and in coming back to the same area during
different seasons. Once an area has been visited enough by enough people during different times of the
year, all the detected “spikes” regarding visibility will be “smoothened”.
So there is no question that rain/irrigation, the condition of the field, and the period of year, etc., will have a
significant influence on the survey of a particular field. All these factors do play an important role if
archaeologists want to use the result of a survey for a single and small area. It is advised to use auguring as
additional means in those cases.
But all results will be “averaged”, if a survey is carried out with several teams during multiple campaigns,
during multiple seasons, and is used a way to give an “Understanding of the Landscape”.
Overall Conclusion
A systematic survey can and will provide essential local and regional information for archaeological
management, archaeological analysis and determination of the existence of archeological sites. But is has to
be conducted in a systematic way, taking in account differences in visibility of artifacts, both with an
environmental and a human origin.
However, it can never be used for just one small area or a field in particular, for that matter of fact.
Any interpretation of the results is only allowed with a thorough historical and environmental knowledge of
the research area. Otherwise significant statistical differences may be interpreted in a very wrong way.
Basic Literature BINTLIFF, J.J. & A.M. SNODGRASS (1995). “Off-site pottery distributions: a regional and interregional perspective.”, Current
Antrhopology 29, pp. 506-513.
FISH, S.K. & S.A. KOWALESKI (1990), “The archaeology of regions- a case for full-coverage survey.”, Washington, DC: Smithsonian
Instiutution.
HAGGET, P. (1965), “Locational analysis in human geography.”, London.
HOLSTROM, S., A. VOORRIPS, H. KAMERMANS (2004). “The Agro Pontino Archaeological Survey.”, Arcaheological Studies Leiden
University 11, Leiden.
KAMERMANS, H. (1993). “Archeologie en landevaluatie in de Agro Pontino (Lazio, Italië).”, Ph.D. disseration, University of
Amsterdam.
MUELLER, J.W. (1975). “Sampling in Archaeology.”, Tucson, University of Arizona Press.
Beex – Archaeological Field Survey and Prospection
9
VAN DE VELDE, P. (1996), “Off-site probleemstellingen, nonsite technieken: de RiuMannu Survey op Sardinië.”, Tijdschrift voor
Meditterane Archaeologie 9, pp: 22-29.
VOORRIPS, A., S.H. LOVING, and H. KAMERMANS (1991). “The Agro Pontino Survey Project. Methods and preliminary results.”,
Studies in Prae- en Protohistorie 6. Amsterdam.
Figures
Fig. 1 – Schematic view of Survey Methods.
International Conference on Cultural Heritage and New Technologies | Vienna | 2014
10
Fig. 2 – Muiderslot. An enclosed site?
Fig. 3 – Off-site archaeology? A bus stop in the middle of nowhere.
Beex – Archaeological Field Survey and Prospection
11
Fig. 4 – DEM of the Agro Pontino. Curtesy of B. Brouwenstijn and J. Fokkema, Vrije Universiteit.
Fig. 5 – Panorama of the Agro Pontino, taken from the Monte Lepini towards the west.
International Conference on Cultural Heritage and New Technologies | Vienna | 2014
12
Fig. 6 – Soil-map of the Agro Pontino.
Fig. 7 – Database-model.
Beex – Archaeological Field Survey and Prospection
13
Fig. 8 – Plotting the finds.
Fig. 9 – GIS-map of all surveyed fields in 1984, 1986 and 1988.
International Conference on Cultural Heritage and New Technologies | Vienna | 2014
14
Fig. 10 – Percentages of fields with finds with different irrigation/rain-conditions.
Fig. 11 – Percentages of fields with finds with different field-conditions.
Beex – Archaeological Field Survey and Prospection
15
Fig. 12 – Percentages of fields with finds with different coverage of vegetation.
Fig. 13 – Differences in number of fields with and without finds in 1984, 1986 and 1988.
International Conference on Cultural Heritage and New Technologies | Vienna | 2014
16
Fig. 14.
Imprint:
Proceedings of the 19th International Conference on Cultural Heritage and New Technologies 2014 (CHNT 19, 2014)
Vienna 2015
http://www.chnt.at/proceedings-chnt-19/
ISBN 978-3-200-04167-7
Editor/Publisher: Museen der Stadt Wien – Stadtarchäologie
Editorial Team: Wolfgang Börner, Susanne Uhlirz
The editor’s office is not responsible for the linguistic correctness of the manuscripts.
Authors are responsible for the contents and copyrights of the illustrations/photographs.