Embed Size (px)
Citation preview
ARC National Key Centre for the Geochemical Evolution and Metallogeny of Continents
GEMOC Research Highlights
2004
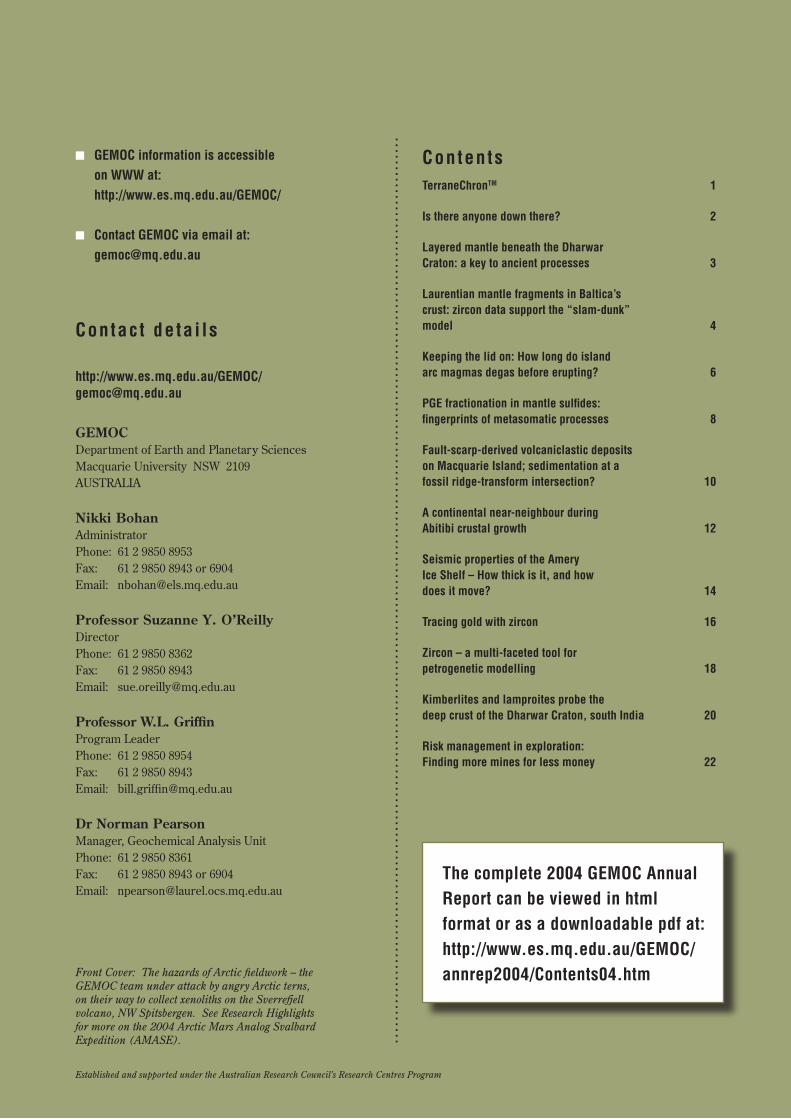
n GEMOCinformationisaccessible onWWWat: http://www.es.mq.edu.au/GEMOC/ n ContactGEMOCviaemailat: [email protected]
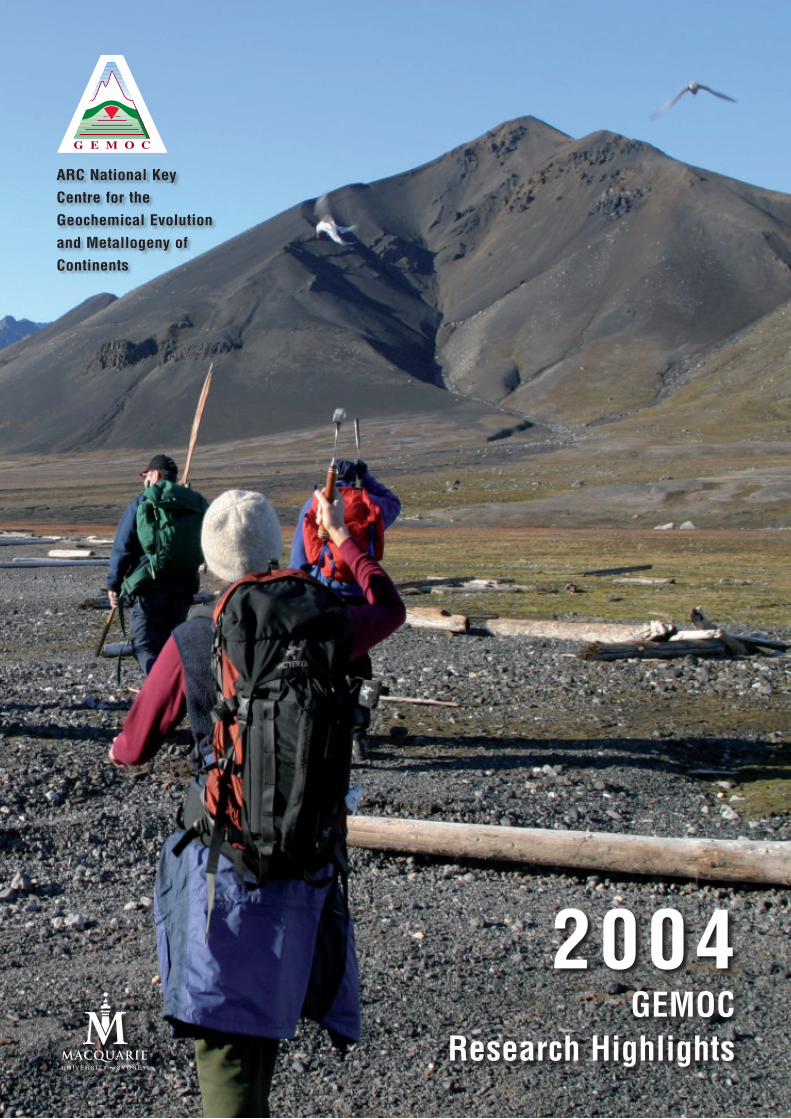
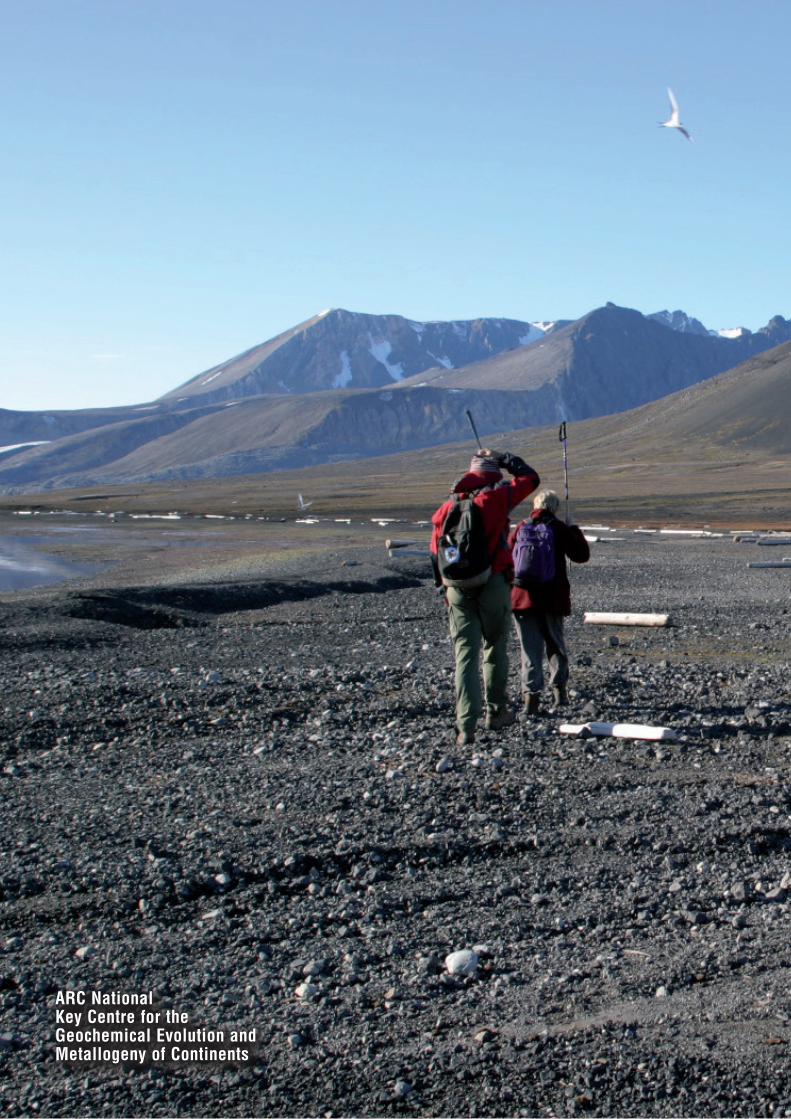
Front Cover: The hazards of Arctic fieldwork -- the GEMOC team under attack by angry Arctic terns, on their way to collect xenoliths on the Sverrefjell volcano, NW Spitsbergen. See Research Highlights for more on the 2004 Arctic Mars Analog Svalbard Expedition (AMASE).
ContentsTerraneChronTM 1
Isthereanyonedownthere? 2
LayeredmantlebeneaththeDharwarCraton:akeytoancientprocesses 3
LaurentianmantlefragmentsinBaltica’scrust:zircondatasupportthe“slam-dunk” model 4
Keepingthelidon:Howlongdoislandarcmagmasdegasbeforeerupting? 6
PGEfractionationinmantlesulfides:fingerprintsofmetasomaticprocesses 8
Fault-scarp-derivedvolcaniclasticdeposits onMacquarieIsland;sedimentationatafossilridge-transformintersection? 10
Acontinentalnear-neighbourduringAbitibicrustalgrowth 12
SeismicpropertiesoftheAmery IceShelf–Howthickisit,andhowdoesitmove? 14
Tracinggoldwithzircon 16
Zircon–amulti-facetedtoolfor petrogeneticmodelling 18
KimberlitesandlamproitesprobethedeepcrustoftheDharwarCraton,southIndia 20
Riskmanagementinexploration:Findingmoreminesforlessmoney 22
Established and supported under the Australian Research Council’s Research Centres Program
Contac t de ta i ls
http://www.es.mq.edu.au/GEMOC/[email protected]
GEMOCDepartment of Earth and Planetary SciencesMacquarie University NSW 2109AUSTRALIA
Nikki BohanAdministratorPhone: 61 2 9850 8953Fax: 61 2 9850 8943 or 6904Email: [email protected]
Professor Suzanne Y. O’ReillyDirectorPhone: 61 2 9850 8362Fax: 61 2 9850 8943Email: [email protected]
Professor W.L. GriffinProgram LeaderPhone: 61 2 9850 8954Fax: 61 2 9850 8943Email: [email protected]
Dr Norman PearsonManager, Geochemical Analysis UnitPhone: 61 2 9850 8361Fax: 61 2 9850 8943 or 6904Email: [email protected]
..............................................................................................................................................................
n Thecomplete2004GEMOCAnnualReportcanbeviewedinhtmlformatorasadownloadablepdfat:http://www.es.mq.edu.au/GEMOC/annrep2004/Contents04.htm
GEMOC 2004 ANNUAL REPORT 1
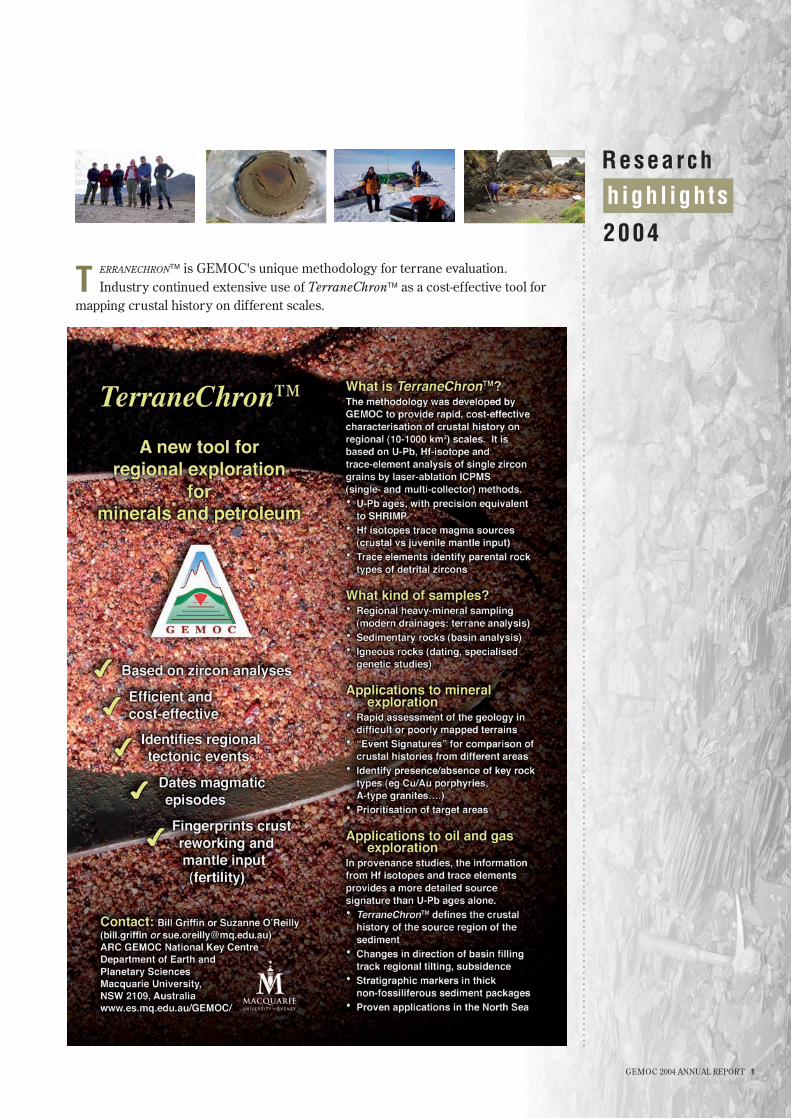
erranechron is GEMOC's unique methodology for terrane evaluation. Industry continued extensive use of TerraneChron as a cost-effective tool for
mapping crustal history on different scales.
Research
2004
highl ights................................................................................................................................................
T
2 GEMOC 2004 ANNUAL REPORT
..................................................
Is there anyone down
there?
rom volcanoes in the Arctic, to meteorites, to Mars and the origins of life on Earth and other planets -- this is a remarkable story about where science can
lead you. In the 1980s Sue O’Reilly, Bill Griffin and a group of students worked on mantle-derived xenoliths in Quaternary basalts from the northern edge of the arctic island of Spitsbergen in the Svalbard archipelago (80°N), focussing on a remarkable glacier-bound volcano called Sverrefjell. Now GEMOC has returned to Sverrefjell as part of the international AMASE (Arctic Mars Analogue Svalbard Expedition)
team, in a program to design and test instrumentation and methods for the detection of life on Mars.
The Sverrefjell peridotite xenoliths, derived from depths of about 50 km, contain minute volumes of gases (mainly CO2) trapped in cavities within their minerals,
and analyses of these gases in 1985 showed the presence of many types of hydrocarbons – an observation that was difficult to understand at the time. Carbonate minerals in the xenoliths, in the fluid inclusions, and in volcanic vents at the surface form tiny round structures, which were
originally interpreted as magmatic and/or hydrothermal in origin. When similar structures were found in Martian meteorites and described as evidence for life, one of the original Svalbard expedition, Hans Amundsen, was sceptical and he showed the Sverrefjell rocks to the meteorite group. They carried out biochemical analyses and found that the structures contained biological signatures; rather than disproving the meteoritic evidence for life on Mars, the Svalbard rocks appeared to support it.
These results have led to the far-reaching hypothesis that volcanic emanations can carry hydrocarbons originally derived from the upper mantle, and that these may form the building blocks and templates for prebiotic molecules. If this is correct, it implies that life might arise on any planet with Earth-like volcanism.
Further analyses showed that many of the old hydrothermal vents in the core of the Sverrefjell volcano, exposed by glaciation, are teeming with microbial life, and biofilms coat minute cracks in the rocks to great depths. The AMASE expeditions (led by Hans Amundsen) arose from the recognition that Sverrefjell also offers an ideal Mars- analog situation where instrumentation designed for space exploration can be tested. It is cold and dry
F
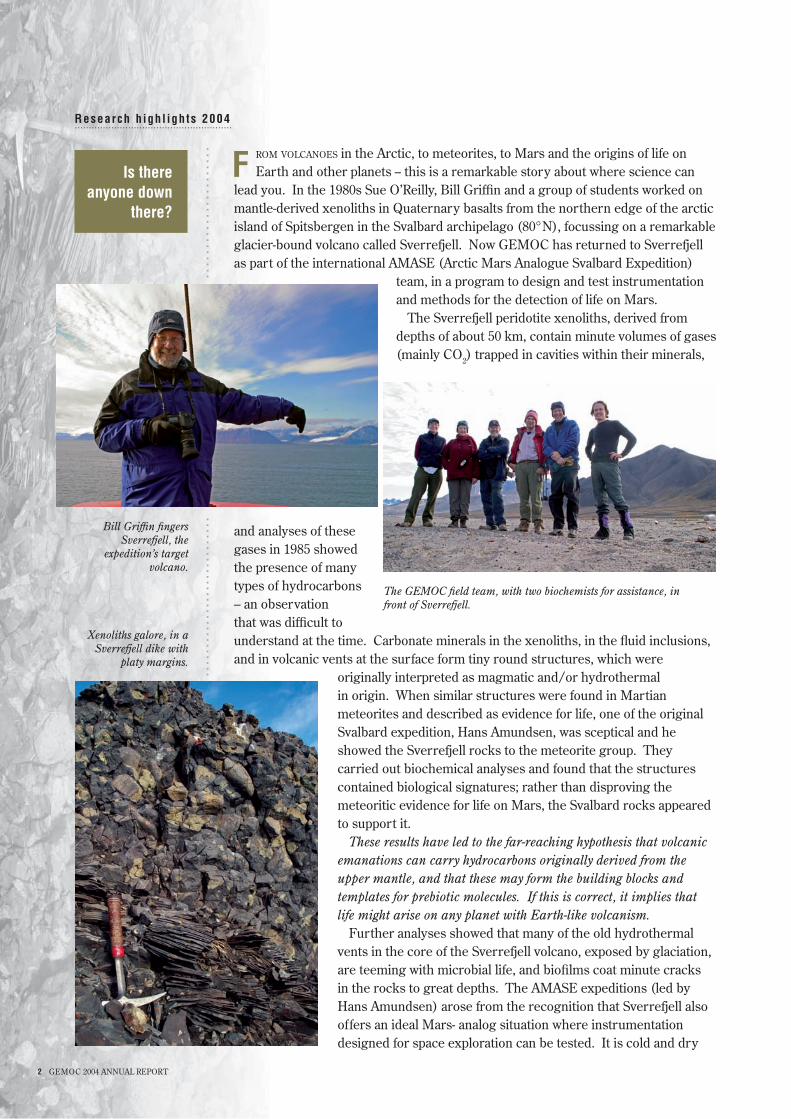
Bill Griffin fingers Sverrefjell, the
expedition’s target volcano.
The GEMOC field team, with two biochemists for assistance, in front of Sverrefjell.
Xenoliths galore, in a Sverrefjell dike with
platy margins.
........................................................Research h ighl ights 2004
GEMOC 2004 ANNUAL REPORT 3
...............................................................................................................
and has both volcanic and sedimentary rocks, and hot springs along the shoreline near the volcano are full of microbes, providing several different environments for testing purposes. An impressive backdrop of red sandstones (the Devonian redbeds) adds to the Mars-like atmosphere.
The 2004 AMASE expedition included scientists (instrument designers, macro- and microbiologists, immunologists and even geologists) from the Smithsonian Institution, Cal Tech, NASA, several European universities and GEMOC; the material collected in 2004 is being studied by Nenad Nikolic, as a GEMOC PhD project. A story on the life-or-not controversy, and the AMASE expedition, appears in the May 2005 issue of the Smithsonian magazine.
Contact: Sue O’Reilly, Bill Griffin, Norman PearsonFunded by: ARC, NASA, Macquarie University
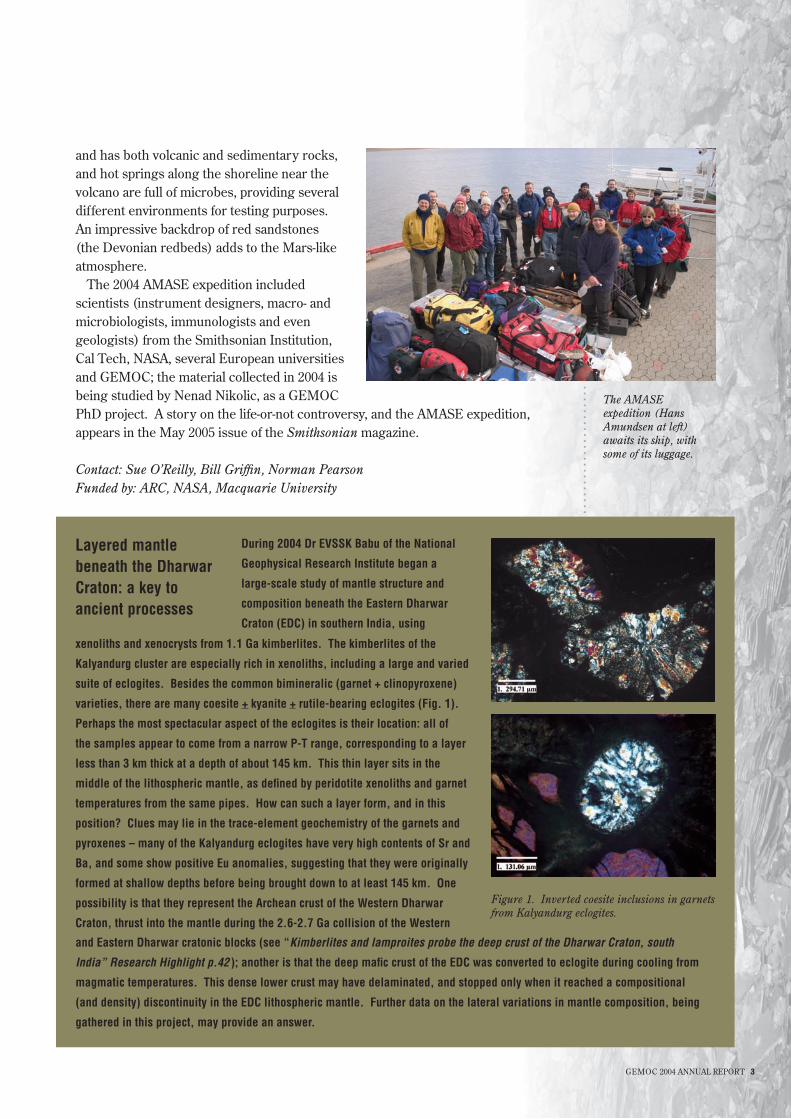
xenoliths and xenocrysts from 1.1 Ga kimberlites. The kimberlites of the
Kalyandurg cluster are especially rich in xenoliths, including a large and varied
suite of eclogites. Besides the common bimineralic (garnet + clinopyroxene)
varieties, there are many coesite + kyanite + rutile-bearing eclogites (Fig. 1).
Perhaps the most spectacular aspect of the eclogites is their location: all of
the samples appear to come from a narrow P-T range, corresponding to a layer
less than 3 km thick at a depth of about 145 km. This thin layer sits in the
middle of the lithospheric mantle, as defined by peridotite xenoliths and garnet
temperatures from the same pipes. How can such a layer form, and in this
position? Clues may lie in the trace-element geochemistry of the garnets and
pyroxenes – many of the Kalyandurg eclogites have very high contents of Sr and
Ba, and some show positive Eu anomalies, suggesting that they were originally
formed at shallow depths before being brought down to at least 145 km. One
possibility is that they represent the Archean crust of the Western Dharwar
Craton, thrust into the mantle during the 2.6-2.7 Ga collision of the Western
Layered mantle beneath the Dharwar Craton: a key to ancient processes
During 2004 Dr EVSSK Babu of the National
Geophysical Research Institute began a
large-scale study of mantle structure and
composition beneath the Eastern Dharwar
Craton (EDC) in southern India, using
Figure 1. Inverted coesite inclusions in garnets from Kalyandurg eclogites.
and Eastern Dharwar cratonic blocks (see “Kimberlites and lamproites probe the deep crust of the Dharwar Craton, south
India” Research Highlight p.42 ); another is that the deep mafic crust of the EDC was converted to eclogite during cooling from
magmatic temperatures. This dense lower crust may have delaminated, and stopped only when it reached a compositional
(and density) discontinuity in the EDC lithospheric mantle. Further data on the lateral variations in mantle composition, being
gathered in this project, may provide an answer.
The AMASE expedition (Hans Amundsen at left) awaits its ship, with some of its luggage.
4 GEMOC 2004 ANNUAL REPORT
antle peridotite bodies enclosed in the Proterozoic gneisses of the Western Gneiss Region (WGR) in Norway have been shown to have an Archean origin
based on Re-Os dating of both whole-rock samples and their sulfides (see Research Highlights 2002, 2003 ). This discrepancy in ages between the peridotites and their host rocks raises fascinating questions about how the peridotites were emplaced into the gneisses. If they were thrust up from below the crust, we would expect there to be some Archean lower crust in the WGR, which has never been reported. An alternative is that the peridotites represent fragments of the Laurentian lithospheric mantle, scraped off into the gneisses as Baltica was thrust under Laurentia to produce the Caledonian high pressure/ultra-high-pressure (HP/UHP) metamorphism for which the WGR is famous.
This conundrum has prompted a geochronological study of the host gneisses and associated rock types to determine if there is any evidence for an Archean history for the crust in this part of the Baltic Shield. We have used GEMOC’s TerraneChron technique (see Research Highlights 2002, 2003 ) which is based on the integrated in situ analysis of zircons for U-Pb ages, Hf-isotopic composition and trace-element compositions. This methodology has been shown to be a highly valuable tool for studies of crustal evolution and can be readily applied to tectonically complex areas such as western Norway.
The WGR can be broadly divided into two principal lithotectonic
units: (1) the HP/UHP metamorphosed Fjordane complex, a mixed assembly of gneiss, supracrustal rocks, anorthosites, augen gneisses and eclogites, exposed to the north and west; and (2) the Jøstedal complex, a more monotonous migmatitic orthogneiss unit to the east. Sample localities were selected from both units, though the Fjordane complex was of particular interest as it is this unit which contains the mantle fragments.
Detrital zircons were collected in stream sediment from several localities throughout the WGR. Preliminary results from analysis of four samples indicate a predominance of Proterozoic ages in the range 1600-1700 Ma. These ages match the period of extensive crustal formation in this area, known as the Gothian Orogeny and it is reasonable to assume that zircons of this age were sourced from rocks formed during this mid-Proterozoic event. There were also a high number of zircons with U-Pb ages in the range 1400-1500 Ma which can be correlated with a phase of intermittent mafic intrusions and possible sporadic granitic magmatism. A smaller number of zircons fall in the range 900-1300 Ma which corresponds with the extensive intrusion of dolerites and granites during the Sveconorwegian (Grenvillian) Orogeny.
The U-Pb ages give no direct evidence for an Archean-aged event in the WGR basement rocks. However, the Hf isotopic compositions of the zircon can be used
Laurentian mantle
fragments in Baltica’s crust:
zircon data support the
“slam-dunk” model
M
....................................................................................................
. . ......................................................Research h ighl ights 2004
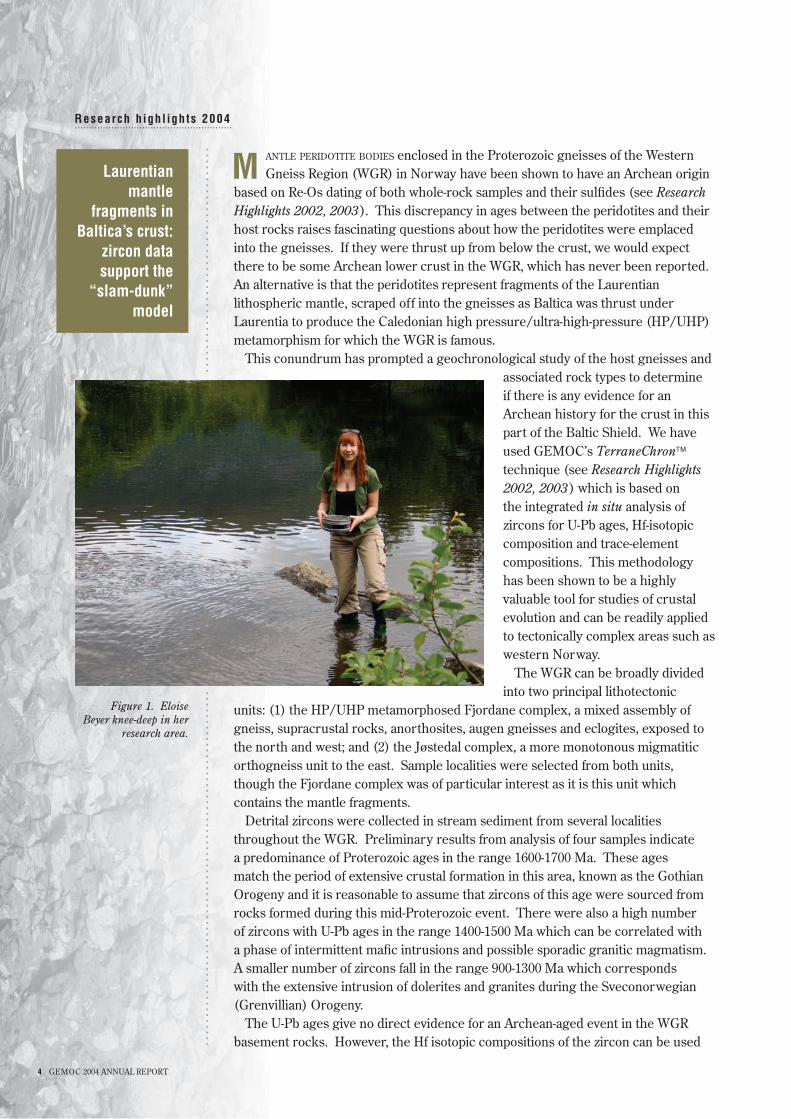
Figure 1. Eloise Beyer knee-deep in her
research area.
GEMOC 2004 ANNUAL REPORT 5
.............................................................................
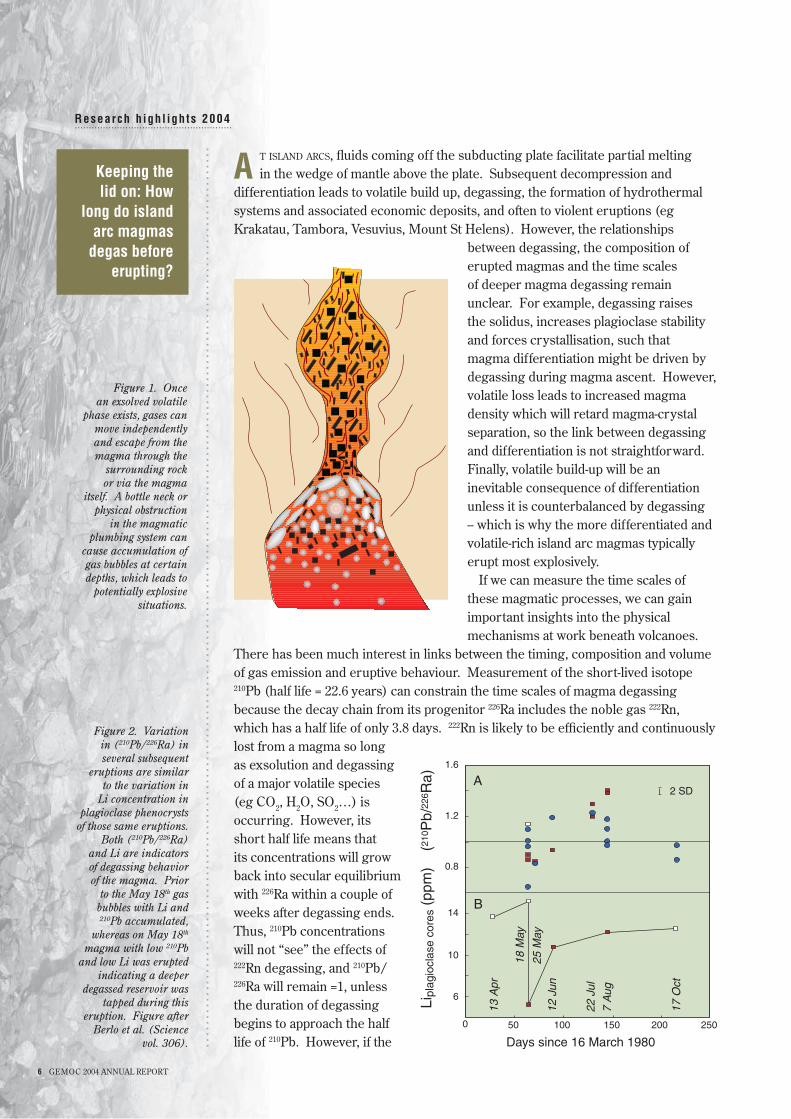
to determine the age of the sources of the magmatic parent rocks of the zircons and hence constrain the age of the deep crust. Hf isotopic data for two samples analysed to date is predominantly very juvenile, indicating that the zircon source has not undergone significant crustal reworking. Crustal model ages for the oldest group of zircons (1600-1700 Ma U-Pb ages) range from 1700-2300 Ma and show no evidence for any Archean input. The zircons with ages less than 1600 Ma have Hf compositions which suggest they were derived from a mixture of younger more juvenile material and older mid-Proterozoic crustal rock.
The lack of evidence for Archean crust in the WGR basement rocks suggests that the crust and the mantle peridotite bodies enclosed within it are not genetically related. With no evidence for an Archean lower crust, the data favour a Laurentian provenance for the peridotites (see Fig. 3). The WGR, already famous for its insights into HP/UHP metamorphism, may also contain hard physical data on the geometry and mechanisms of continental collision and the partial subduction of continental plates.
Contacts: Eloise Beyer, Bill Griffin, Sue O’ReillyFunded by: ARC, Industry
Archeancrust
Archeanmantle
LAURENTIA BALTICA
Proterozoiccrust
Proterozoicmantle
Laurentianmantle
Balticacrust
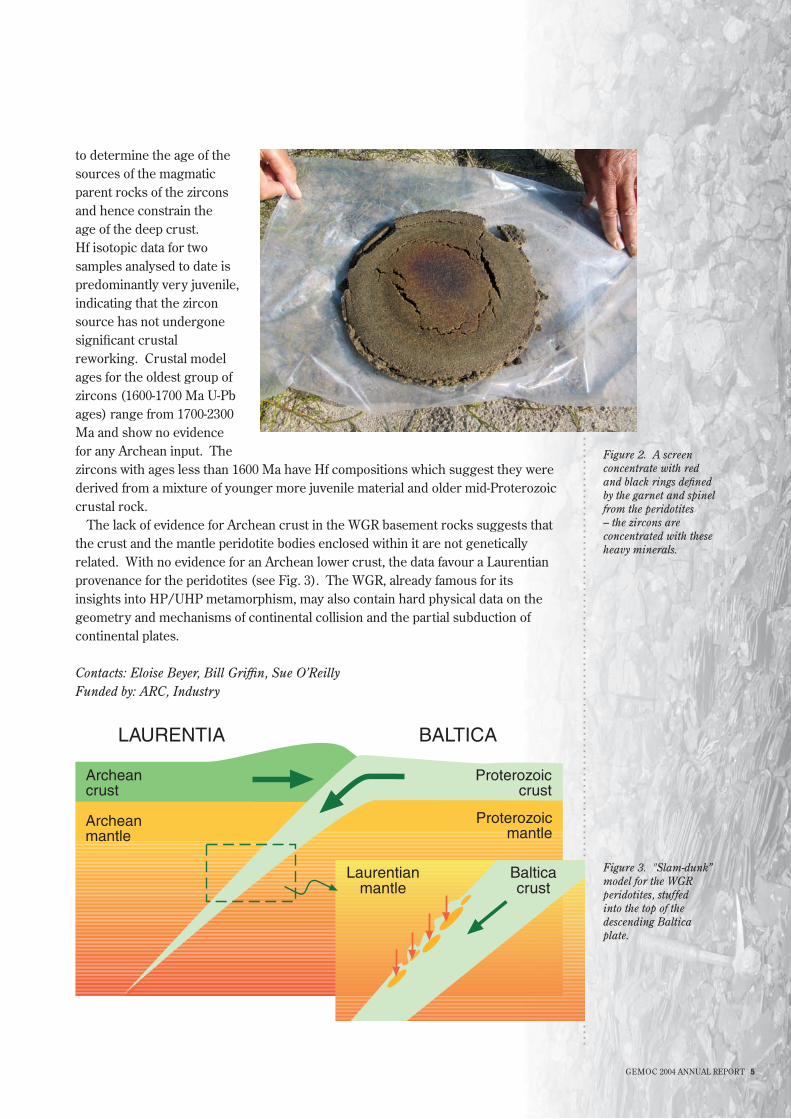
Figure 2. A screen concentrate with red and black rings defined by the garnet and spinel from the peridotites – the zircons are concentrated with these heavy minerals.
Figure 3. "Slam-dunk” model for the WGR peridotites, stuffed into the top of the descending Baltica plate.
6 GEMOC 2004 ANNUAL REPORT
t island arcs, fluids coming off the subducting plate facilitate partial melting in the wedge of mantle above the plate. Subsequent decompression and
differentiation leads to volatile build up, degassing, the formation of hydrothermal systems and associated economic deposits, and often to violent eruptions (eg Krakatau, Tambora, Vesuvius, Mount St Helens). However, the relationships
between degassing, the composition of erupted magmas and the time scales of deeper magma degassing remain unclear. For example, degassing raises the solidus, increases plagioclase stability and forces crystallisation, such that magma differentiation might be driven by degassing during magma ascent. However, volatile loss leads to increased magma density which will retard magma-crystal separation, so the link between degassing and differentiation is not straightforward. Finally, volatile build-up will be an inevitable consequence of differentiation unless it is counterbalanced by degassing -- which is why the more differentiated and volatile-rich island arc magmas typically erupt most explosively.
If we can measure the time scales of these magmatic processes, we can gain important insights into the physical mechanisms at work beneath volcanoes.
There has been much interest in links between the timing, composition and volume of gas emission and eruptive behaviour. Measurement of the short-lived isotope 210Pb (half life = 22.6 years) can constrain the time scales of magma degassing because the decay chain from its progenitor 226Ra includes the noble gas 222Rn, which has a half life of only 3.8 days. 222Rn is likely to be efficiently and continuously lost from a magma so long as exsolution and degassing of a major volatile species (eg CO2, H2O, SO2…) is occurring. However, its short half life means that its concentrations will grow back into secular equilibrium with 226Ra within a couple of weeks after degassing ends. Thus, 210Pb concentrations will not “see” the effects of 222Rn degassing, and 210Pb/226Ra will remain =1, unless the duration of degassing begins to approach the half life of 210Pb. However, if the
Keeping the lid on: How
long do island arc magmas
degas before erupting?
A........................................................Research h ighl ights 2004
.............................................................................................................................................................
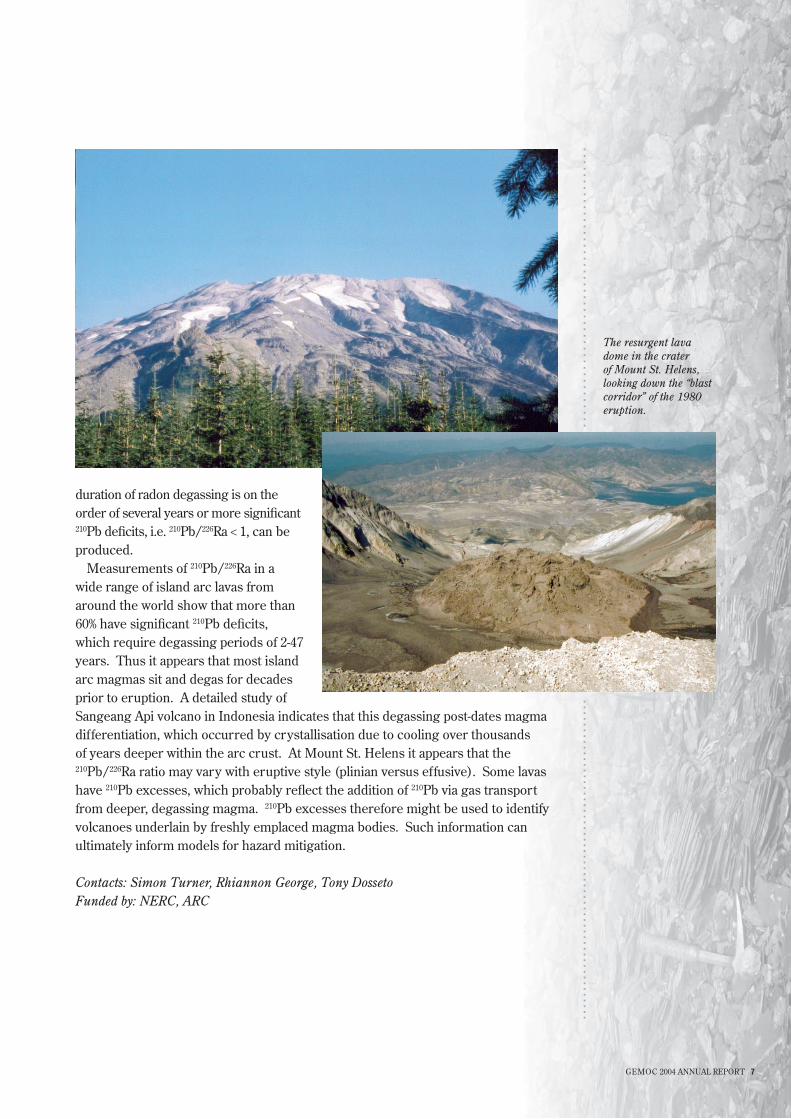
Figure 1. Once an exsolved volatile
phase exists, gases can move independently and escape from the magma through the
surrounding rock or via the magma
itself. A bottle neck or physical obstruction
in the magmatic plumbing system can
cause accumulation of gas bubbles at certain depths, which leads to
potentially explosive situations.
Figure 2. Variation in (210Pb/226Ra) in several subsequent
eruptions are similar to the variation in
Li concentration in plagioclase phenocrysts
of those same eruptions. Both (210Pb/226Ra)
and Li are indicators of degassing behavior of the magma. Prior
to the May 18th gas bubbles with Li and 210Pb accumulated,
whereas on May 18th magma with low 210Pb
and low Li was erupted indicating a deeper
degassed reservoir was tapped during this
eruption. Figure after Berlo et al. (Science
vol. 306).
A
B
Days since 16 March 1980
Lipl
agio
clas
e co
res
(ppm
)
(210
Pb/
226 R
a)
2 SD
250200150100500
6
10
14
0.8
1.2
1.6
17 O
ct
7 A
ug
22 J
ul
12 J
un
13 A
pr
18 M
ay
25 M
ay
GEMOC 2004 ANNUAL REPORT 7
duration of radon degassing is on the order of several years or more significant 210Pb deficits, i.e. 210Pb/226Ra < 1, can be produced.
Measurements of 210Pb/226Ra in a wide range of island arc lavas from around the world show that more than 60% have significant 210Pb deficits, which require degassing periods of 2-47 years. Thus it appears that most island arc magmas sit and degas for decades prior to eruption. A detailed study of Sangeang Api volcano in Indonesia indicates that this degassing post-dates magma differentiation, which occurred by crystallisation due to cooling over thousands of years deeper within the arc crust. At Mount St. Helens it appears that the 210Pb/226Ra ratio may vary with eruptive style (plinian versus effusive). Some lavas have 210Pb excesses, which probably reflect the addition of 210Pb via gas transport from deeper, degassing magma. 210Pb excesses therefore might be used to identify volcanoes underlain by freshly emplaced magma bodies. Such information can ultimately inform models for hazard mitigation.
Contacts: Simon Turner, Rhiannon George, Tony DossetoFunded by: NERC, ARC
....................................................................................................
The resurgent lava dome in the crater of Mount St. Helens, looking down the “blast corridor” of the 1980 eruption.
8 GEMOC 2004 ANNUAL REPORT
nalyses of mantle sulfides have demonstrated the high solubility of the Platinum Group Elements (PGEs) in base metal sulphides (BMS) and show
that the PGE budget of mantle rocks is fully controlled by the BMS. If they are not enclosed inside refractory silicate or oxide phases, sulfides are likely to be mobile in the lithospheric mantle and their absolute and relative abundances of PGEs can be altered by metasomatic processes. Therefore, studies of mantle sulfides may provide critical information on metasomatic processes in the mantle. Abundant primary sulfides occur both as inclusions in silicates and as interstitial grains in spinel lherzolite and pyroxenite xenoliths hosted by Miocene intraplate basalts from the Penghu Islands, Taiwan. Modally metasomatised xenoliths with amphibole can have sulfide abundances up to 1 vol.%, whereas cryptically metasomatised samples, with re-enriched trace-element patterns in clinopyroxenes, have 0.1~0.3 vol.% sulfide, well above the mantle average. These sulfides are mixtures of Fe-rich and Ni-rich monosulfide solid solutions (MSS), pentlandite, millerite and chalcopyrite,
exsolved from high- temperature (>900°C) MSS bulk compositions.
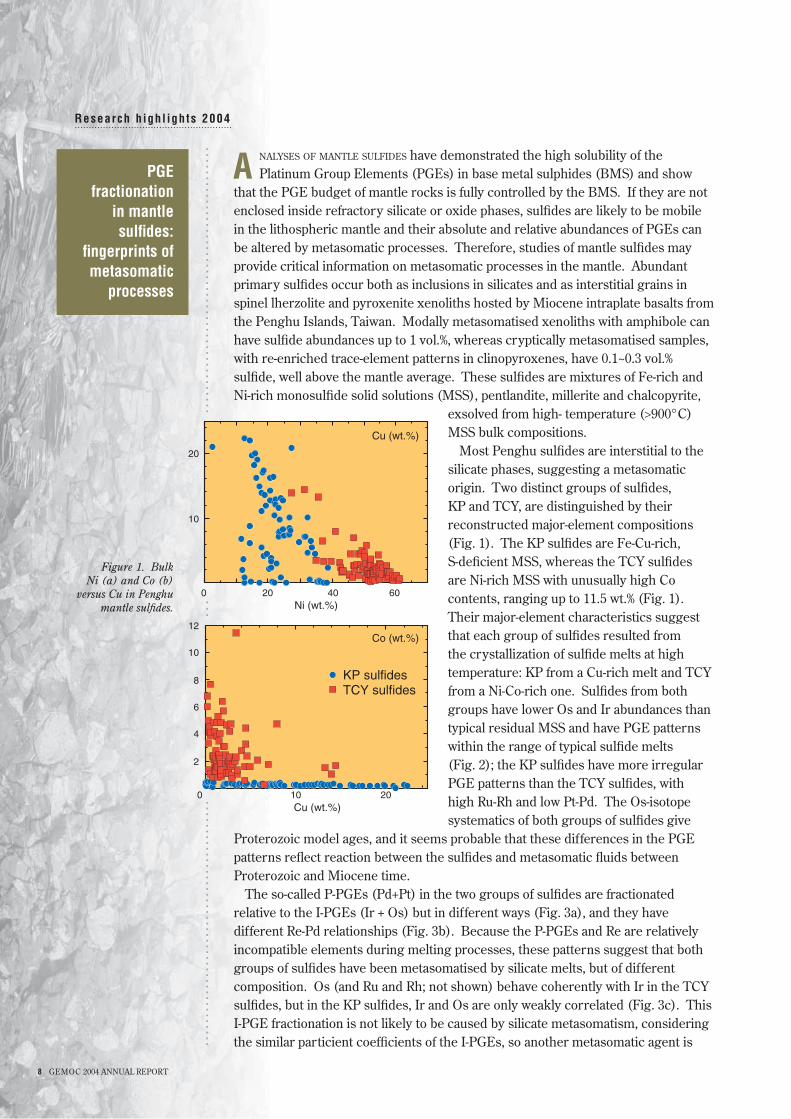
Most Penghu sulfides are interstitial to the silicate phases, suggesting a metasomatic origin. Two distinct groups of sulfides, KP and TCY, are distinguished by their reconstructed major-element compositions (Fig. 1). The KP sulfides are Fe-Cu-rich, S-deficient MSS, whereas the TCY sulfides are Ni-rich MSS with unusually high Co contents, ranging up to 11.5 wt.% (Fig. 1). Their major-element characteristics suggest that each group of sulfides resulted from the crystallization of sulfide melts at high temperature: KP from a Cu-rich melt and TCY from a Ni-Co-rich one. Sulfides from both groups have lower Os and Ir abundances than typical residual MSS and have PGE patterns within the range of typical sulfide melts (Fig. 2); the KP sulfides have more irregular PGE patterns than the TCY sulfides, with high Ru-Rh and low Pt-Pd. The Os-isotope systematics of both groups of sulfides give
Proterozoic model ages, and it seems probable that these differences in the PGE patterns reflect reaction between the sulfides and metasomatic fluids between Proterozoic and Miocene time.
The so-called P-PGEs (Pd+Pt) in the two groups of sulfides are fractionated relative to the I-PGEs (Ir + Os) but in different ways (Fig. 3a), and they have different Re-Pd relationships (Fig. 3b). Because the P-PGEs and Re are relatively incompatible elements during melting processes, these patterns suggest that both groups of sulfides have been metasomatised by silicate melts, but of different composition. Os (and Ru and Rh; not shown) behave coherently with Ir in the TCY sulfides, but in the KP sulfides, Ir and Os are only weakly correlated (Fig. 3c). This I-PGE fractionation is not likely to be caused by silicate metasomatism, considering the similar particient coefficients of the I-PGEs, so another metasomatic agent is
.................................................
...........................................
A........................................................Research h ighl ights 2004
PGE fractionation
in mantle sulfides:
fingerprints of metasomatic
processes
Figure 1. Bulk Ni (a) and Co (b)
versus Cu in Penghu mantle sulfides.
Co (wt.%)
Cu (wt.%)0
2
4
6
8
10
12
0
10
20
Ni (wt.%)
Cu (wt.%)
KP sulfidesTCY sulfides
20 40 60
2010
GEMOC 2004 ANNUAL REPORT �
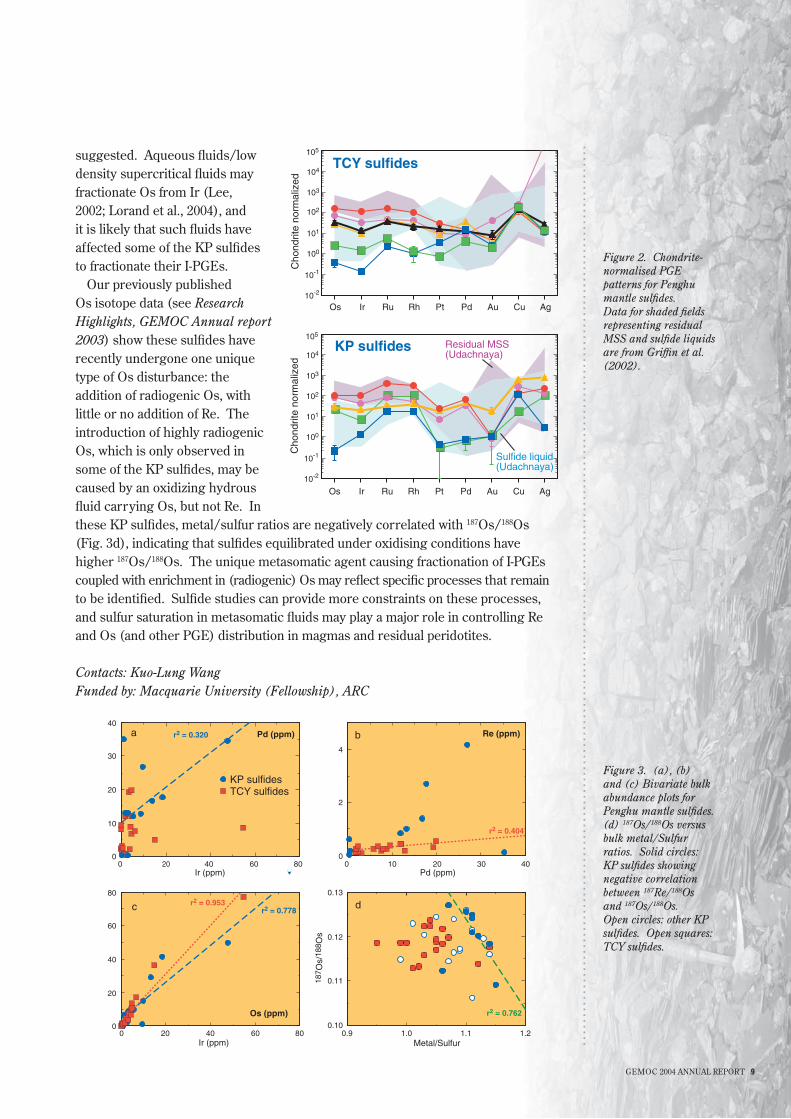
suggested. Aqueous fluids/low density supercritical fluids may fractionate Os from Ir (Lee, 2002; Lorand et al., 2004), and it is likely that such fluids have affected some of the KP sulfides to fractionate their I-PGEs.
Our previously published Os isotope data (see Research Highlights, GEMOC Annual report 2003) show these sulfides have recently undergone one unique type of Os disturbance: the addition of radiogenic Os, with little or no addition of Re. The introduction of highly radiogenic Os, which is only observed in some of the KP sulfides, may be caused by an oxidizing hydrous fluid carrying Os, but not Re. In these KP sulfides, metal/sulfur ratios are negatively correlated with 187Os/188Os (Fig. 3d), indicating that sulfides equilibrated under oxidising conditions have higher 187Os/188Os. The unique metasomatic agent causing fractionation of I-PGEs coupled with enrichment in (radiogenic) Os may reflect specific processes that remain to be identified. Sulfide studies can provide more constraints on these processes, and sulfur saturation in metasomatic fluids may play a major role in controlling Re and Os (and other PGE) distribution in magmas and residual peridotites.
Contacts: Kuo-Lung WangFunded by: Macquarie University (Fellowship), ARC
.............................................................................................................................................................
Figure 2. Chondrite-normalised PGE patterns for Penghu mantle sulfides. Data for shaded fields representing residual MSS and sulfide liquids are from Griffin et al. (2002).
Figure 3. (a), (b) and (c) Bivariate bulk abundance plots for Penghu mantle sulfides. (d) 187Os/188Os versus bulk metal/Sulfur ratios. Solid circles: KP sulfides showing negative correlation between 187Re/188Os and 187Os/188Os. Open circles: other KP sulfides. Open squares: TCY sulfides.
Os Ir Ru Rh Pt Pd Au Cu Ag
Os Ir Ru Rh Pt Pd Au Cu Ag
Cho
ndrit
e no
rmal
ized
10-2
10-1
100
101
102
103
104
105
Cho
ndrit
e no
rmal
ized
10-2
10-1
100
101
102
103
104
105
Residual MSS(Udachnaya)
Sulfide liquid(Udachnaya)
TCY sulfides
KP sulfides
r2 = 0.320 Pd (ppm)
8060402000
10
20
30
40
Ir (ppm)
d
1.21.11.00.90.10
0.11
0.12
0.13
Metal/Sulfur
187 O
s/18
8 Os
4030201000
2
4
r2 = 0.404
Re (ppm)
Pd (ppm)
b
8060402000
20
40
60
80
Os (ppm)
r2 = 0.953
Ir (ppm)
r2 = 0.778c
a
r2 = 0.762
KP sulfidesTCY sulfides
10 GEMOC 2004 ANNUAL REPORT
tudies of oceanic crust are hindered by limited subaerial exposure. Our knowledge of in situ oceanic crust therefore comes from bathymetry and
other geophysical data, dredge samples and in a few areas survey and sampling by submersibles. Moreover, even where rarely exposed on land within ophiolites, oceanic crust has typically been deformed to varying degrees during obduction.
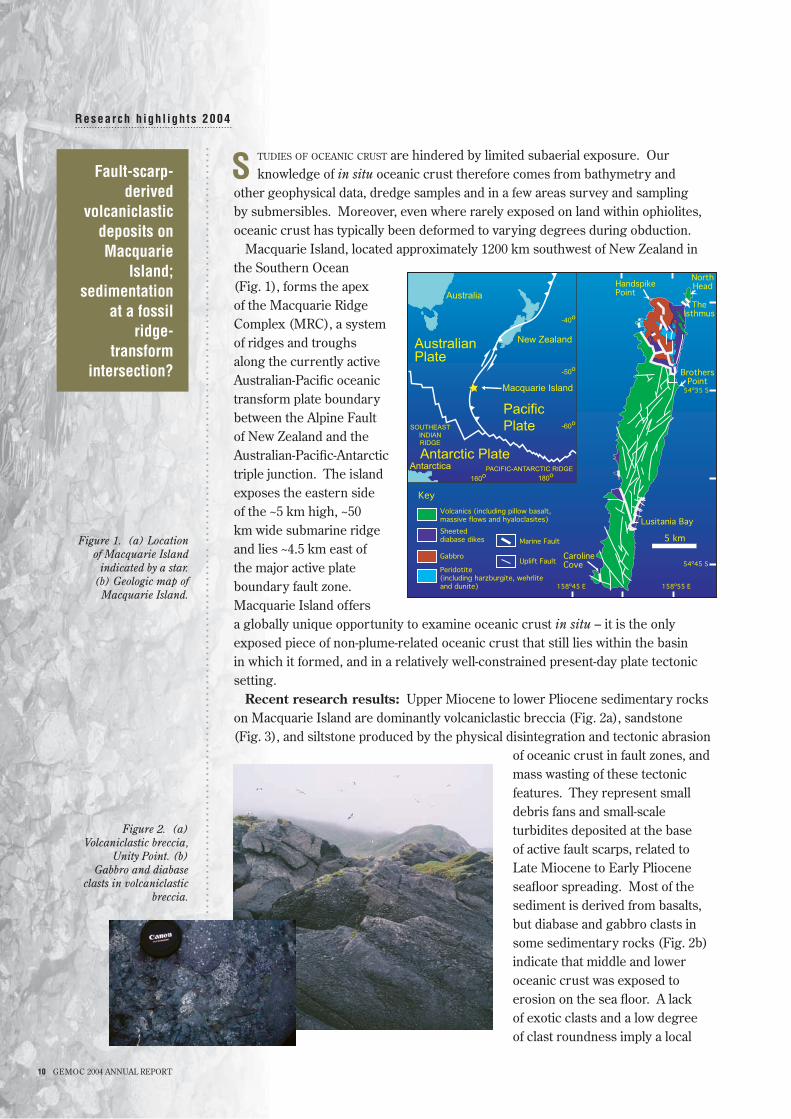
Macquarie Island, located approximately 1200 km southwest of New Zealand in the Southern Ocean (Fig. 1), forms the apex of the Macquarie Ridge Complex (MRC), a system of ridges and troughs along the currently active Australian-Pacific oceanic transform plate boundary between the Alpine Fault of New Zealand and the Australian-Pacific-Antarctic triple junction. The island exposes the eastern side of the ~5 km high, ~50 km wide submarine ridge and lies ~4.5 km east of the major active plate boundary fault zone. Macquarie Island offers a globally unique opportunity to examine oceanic crust in situ – it is the only exposed piece of non-plume-related oceanic crust that still lies within the basin in which it formed, and in a relatively well-constrained present-day plate tectonic setting.
Recent research results: Upper Miocene to lower Pliocene sedimentary rocks on Macquarie Island are dominantly volcaniclastic breccia (Fig. 2a), sandstone (Fig. 3), and siltstone produced by the physical disintegration and tectonic abrasion
of oceanic crust in fault zones, and mass wasting of these tectonic features. They represent small debris fans and small-scale turbidites deposited at the base of active fault scarps, related to Late Miocene to Early Pliocene seafloor spreading. Most of the sediment is derived from basalts, but diabase and gabbro clasts in some sedimentary rocks (Fig. 2b) indicate that middle and lower oceanic crust was exposed to erosion on the sea floor. A lack of exotic clasts and a low degree of clast roundness imply a local
..................................................................... ................................................................
S ........................................................Research h ighl ights 2004
Figure 1. (a) Location of Macquarie Island
indicated by a star. (b) Geologic map of
Macquarie Island.
Figure 2. (a) Volcaniclastic breccia,
Unity Point. (b) Gabbro and diabase
clasts in volcaniclastic breccia.
Fault-scarp-derived
volcaniclastic deposits on Macquarie
Island; sedimentation
at a fossil ridge-
transform intersection?
GEMOC 2004 ANNUAL REPORT 11
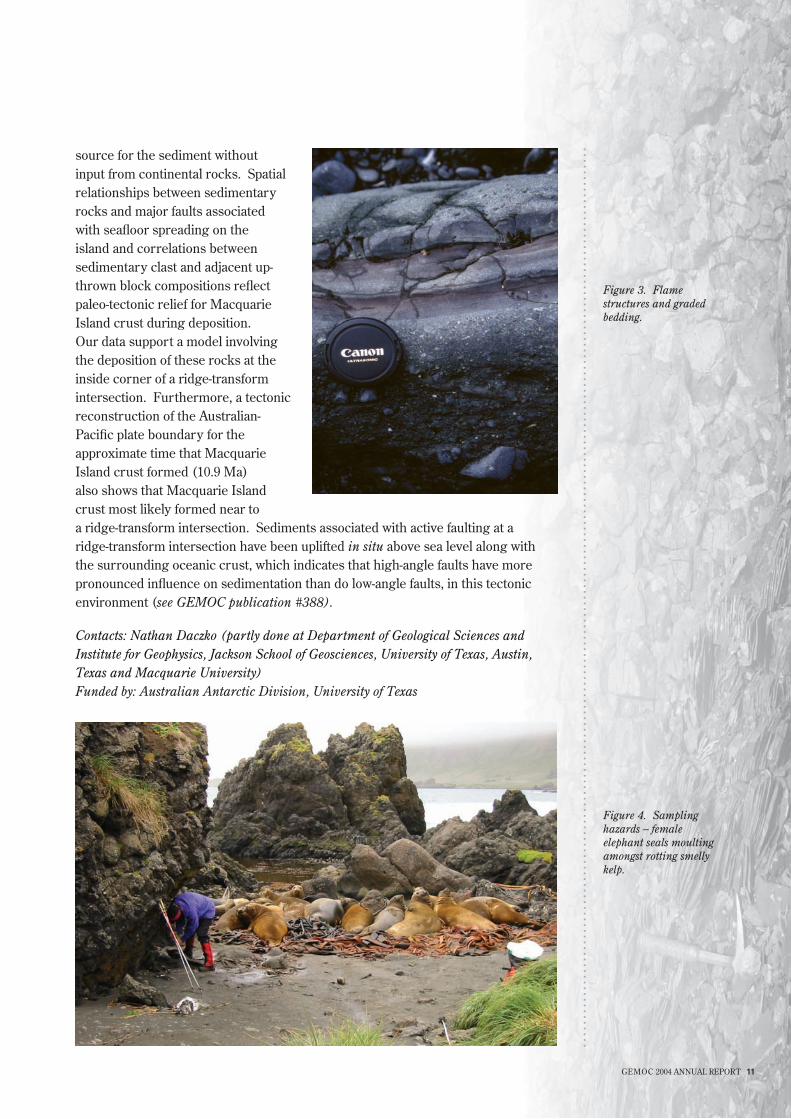
source for the sediment without input from continental rocks. Spatial relationships between sedimentary rocks and major faults associated with seafloor spreading on the island and correlations between sedimentary clast and adjacent up-thrown block compositions reflect paleo-tectonic relief for Macquarie Island crust during deposition. Our data support a model involving the deposition of these rocks at the inside corner of a ridge-transform intersection. Furthermore, a tectonic reconstruction of the Australian-Pacific plate boundary for the approximate time that Macquarie Island crust formed (10.9 Ma) also shows that Macquarie Island crust most likely formed near to a ridge-transform intersection. Sediments associated with active faulting at a ridge-transform intersection have been uplifted in situ above sea level along with the surrounding oceanic crust, which indicates that high-angle faults have more pronounced influence on sedimentation than do low-angle faults, in this tectonic environment (see GEMOC publication #388).
Contacts: Nathan Daczko (partly done at Department of Geological Sciences and Institute for Geophysics, Jackson School of Geosciences, University of Texas, Austin, Texas and Macquarie University)Funded by: Australian Antarctic Division, University of Texas
.............................................................................................................................................................
Figure 4. Sampling hazards – female elephant seals moulting amongst rotting smelly kelp.
Figure 3. Flame structures and graded bedding.
12 GEMOC 2004 ANNUAL REPORT
he abitibi subprovince (part of the Superior craton of the Canadian Shield) is widely regarded as an example of juvenile Archaean crust generated during
volcanic and plutonic activity in an ocean setting, far removed from the influence of older continental crust. However, our recent work along the southwestern margin of this subprovince casts doubt on this hypothesis.
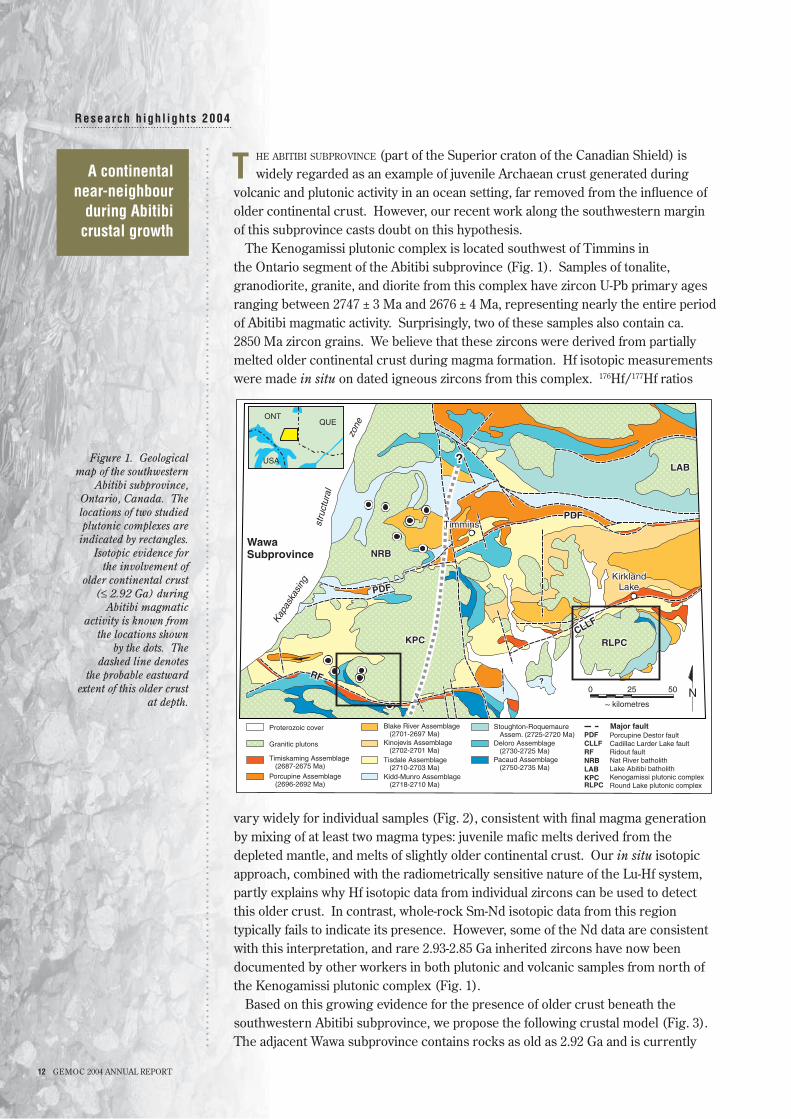
The Kenogamissi plutonic complex is located southwest of Timmins in the Ontario segment of the Abitibi subprovince (Fig. 1). Samples of tonalite, granodiorite, granite, and diorite from this complex have zircon U-Pb primary ages ranging between 2747 ± 3 Ma and 2676 ± 4 Ma, representing nearly the entire period of Abitibi magmatic activity. Surprisingly, two of these samples also contain ca. 2850 Ma zircon grains. We believe that these zircons were derived from partially melted older continental crust during magma formation. Hf isotopic measurements were made in situ on dated igneous zircons from this complex. 176Hf/177Hf ratios
vary widely for individual samples (Fig. 2), consistent with final magma generation by mixing of at least two magma types: juvenile mafic melts derived from the depleted mantle, and melts of slightly older continental crust. Our in situ isotopic approach, combined with the radiometrically sensitive nature of the Lu-Hf system, partly explains why Hf isotopic data from individual zircons can be used to detect this older crust. In contrast, whole-rock Sm-Nd isotopic data from this region typically fails to indicate its presence. However, some of the Nd data are consistent with this interpretation, and rare 2.93-2.85 Ga inherited zircons have now been documented by other workers in both plutonic and volcanic samples from north of the Kenogamissi plutonic complex (Fig. 1).
Based on this growing evidence for the presence of older crust beneath the southwestern Abitibi subprovince, we propose the following crustal model (Fig. 3). The adjacent Wawa subprovince contains rocks as old as 2.92 Ga and is currently
TA continental near-neighbour
during Abitibi crustal growth
........................................................Research h ighl ights 2004
.............................................................................................................................................................
Proterozoic cover
Granitic plutons
Timiskaming Assemblage (2687-2675 Ma)
Porcupine Assemblage (2696-2692 Ma)
Kinojevis Assemblage (2702-2701 Ma)Tisdale Assemblage (2710-2703 Ma)
Blake River Assemblage (2701-2697 Ma)
Kidd-Munro Assemblage (2718-2710 Ma)
PDF Porcupine Destor faultCLLF Cadillac Larder Lake faultRF Ridout fault
Stoughton-Roquemaure Assem. (2725-2720 Ma)Deloro Assemblage (2730-2725 Ma)Pacaud Assemblage (2750-2735 Ma)
Major fault
0 25 50
~ kilometres
RLPC
LAB
KPC
NRB
?
RF
CLLF
N
KPC Kenogamissi plutonic complexRLPC Round Lake plutonic complex
LAB Lake Abitibi batholithNRB Nat River batholith
Kapa
skas
ing
stru
ctur
al
zone
KirklandLake
WawaSubprovince
?
Timmins
QUEONT
USAFigure 1. Geological map of the southwestern
Abitibi subprovince, Ontario, Canada. The locations of two studied plutonic complexes are
indicated by rectangles. Isotopic evidence for
the involvement of older continental crust
(≤ 2.92 Ga) during Abitibi magmatic
activity is known from the locations shown
by the dots. The dashed line denotes
the probable eastward extent of this older crust
at depth.
GEMOC 2004 ANNUAL REPORT 13
....................................................................................................
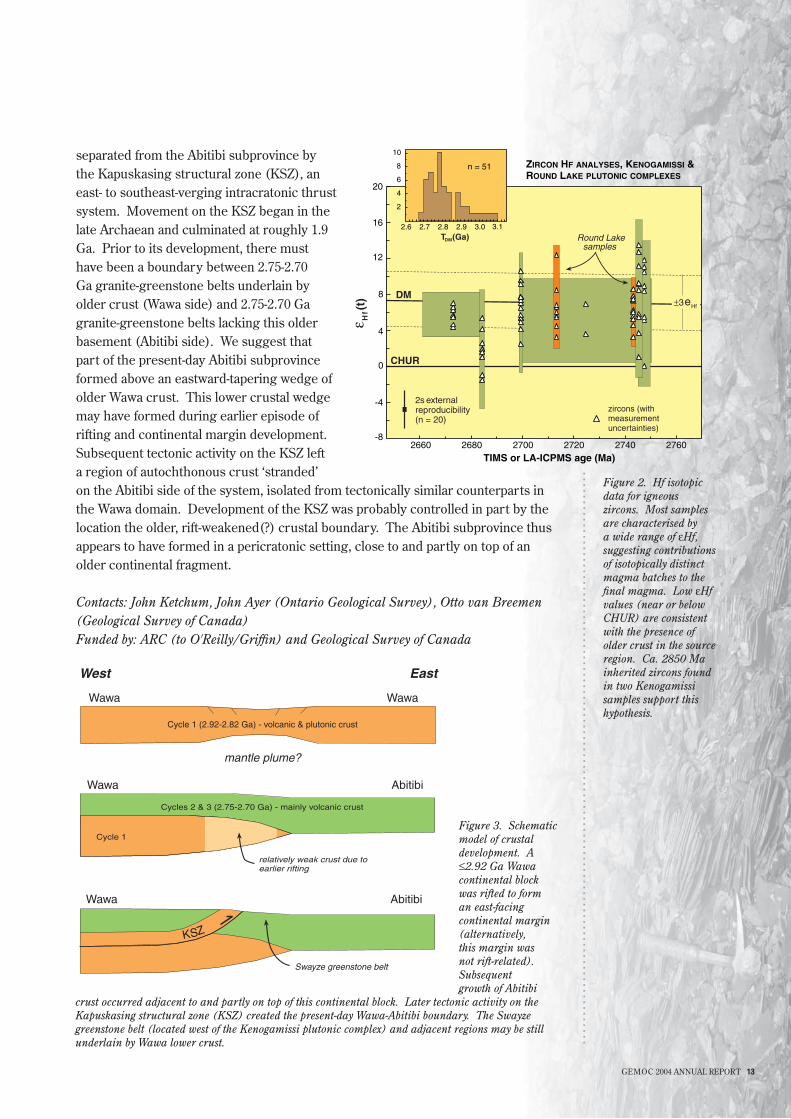
separated from the Abitibi subprovince by the Kapuskasing structural zone (KSZ), an east- to southeast-verging intracratonic thrust system. Movement on the KSZ began in the late Archaean and culminated at roughly 1.9 Ga. Prior to its development, there must have been a boundary between 2.75-2.70 Ga granite-greenstone belts underlain by older crust (Wawa side) and 2.75-2.70 Ga granite-greenstone belts lacking this older basement (Abitibi side). We suggest that part of the present-day Abitibi subprovince formed above an eastward-tapering wedge of older Wawa crust. This lower crustal wedge may have formed during earlier episode of rifting and continental margin development. Subsequent tectonic activity on the KSZ left a region of autochthonous crust ‘stranded’ on the Abitibi side of the system, isolated from tectonically similar counterparts in the Wawa domain. Development of the KSZ was probably controlled in part by the location the older, rift-weakened(?) crustal boundary. The Abitibi subprovince thus appears to have formed in a pericratonic setting, close to and partly on top of an older continental fragment.
Contacts: John Ketchum, John Ayer (Ontario Geological Survey), Otto van Breemen (Geological Survey of Canada)Funded by: ARC (to O'Reilly/Griffin) and Geological Survey of Canada
zircons (withmeasurementuncertainties)
2660 2680 2700 2720 2740 2760-8
-4
0
4
8
12
16
20
TIMS or LA-ICPMS age (Ma)
DM
CHUR
2 externalreproducibility(n = 20)
s
Round Lakesamples
±3eHf
ε Hf(
t)
10
T (Ga)DM
2
4
6
8 n = 51
2.6 2.7 2.8 2.9 3.0 3.1
ZIRCON HF ANALYSES, KENOGAMISSI &ROUND LAKE PLUTONIC COMPLEXES
Wawa
KSZ
WawaWawa
West East
Swayze greenstone belt
Cycle 1 (2.92-2.82 Ga) - volcanic & plutonic crust
Abitibi
mantle plume?
Wawa
relatively weak crust due toearlier rifting
Abitibi
Cycles 2 & 3 (2.75-2.70 Ga) - mainly volcanic crust
Cycle 1
Figure 2. Hf isotopic data for igneous zircons. Most samples are characterised by a wide range of εHf, suggesting contributions of isotopically distinct magma batches to the final magma. Low εHf values (near or below CHUR) are consistent with the presence of older crust in the source region. Ca. 2850 Ma inherited zircons found in two Kenogamissi samples support this hypothesis.
Figure 3. Schematic model of crustal development. A ≤2.92 Ga Wawa continental block was rifted to form an east-facing continental margin (alternatively, this margin was not rift-related). Subsequent growth of Abitibi
crust occurred adjacent to and partly on top of this continental block. Later tectonic activity on the Kapuskasing structural zone (KSZ) created the present-day Wawa-Abitibi boundary. The Swayze greenstone belt (located west of the Kenogamissi plutonic complex) and adjacent regions may be still underlain by Wawa lower crust.
14 GEMOC 2004 ANNUAL REPORT
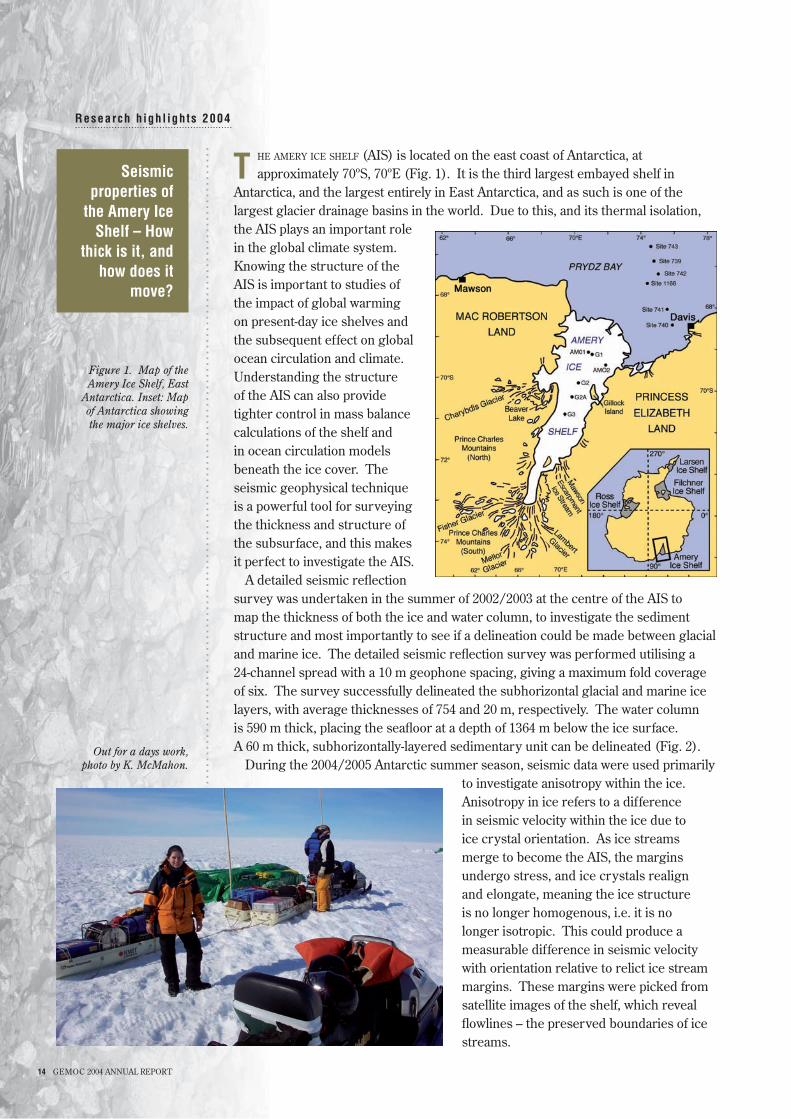
he amery ice shelf (AIS) is located on the east coast of Antarctica, at approximately 70ºS, 70ºE (Fig. 1). It is the third largest embayed shelf in
Antarctica, and the largest entirely in East Antarctica, and as such is one of the largest glacier drainage basins in the world. Due to this, and its thermal isolation, the AIS plays an important role in the global climate system. Knowing the structure of the AIS is important to studies of the impact of global warming on present-day ice shelves and the subsequent effect on global ocean circulation and climate. Understanding the structure of the AIS can also provide tighter control in mass balance calculations of the shelf and in ocean circulation models beneath the ice cover. The seismic geophysical technique is a powerful tool for surveying the thickness and structure of the subsurface, and this makes it perfect to investigate the AIS.
A detailed seismic reflection survey was undertaken in the summer of 2002/2003 at the centre of the AIS to map the thickness of both the ice and water column, to investigate the sediment structure and most importantly to see if a delineation could be made between glacial and marine ice. The detailed seismic reflection survey was performed utilising a 24-channel spread with a 10 m geophone spacing, giving a maximum fold coverage of six. The survey successfully delineated the subhorizontal glacial and marine ice layers, with average thicknesses of 754 and 20 m, respectively. The water column is 590 m thick, placing the seafloor at a depth of 1364 m below the ice surface. A 60 m thick, subhorizontally-layered sedimentary unit can be delineated (Fig. 2).
During the 2004/2005 Antarctic summer season, seismic data were used primarily to investigate anisotropy within the ice. Anisotropy in ice refers to a difference in seismic velocity within the ice due to ice crystal orientation. As ice streams merge to become the AIS, the margins undergo stress, and ice crystals realign and elongate, meaning the ice structure is no longer homogenous, i.e. it is no longer isotropic. This could produce a measurable difference in seismic velocity with orientation relative to relict ice stream margins. These margins were picked from satellite images of the shelf, which reveal flowlines – the preserved boundaries of ice streams.
TSeismic properties of
the Amery Ice Shelf – How
thick is it, and how does it
move?
........................................................Research h ighl ights 2004
..........................................................................................................................................................
Out for a days work,photo by K. McMahon.
Figure 1. Map of the Amery Ice Shelf, East
Antarctica. Inset: Map of Antarctica showing the major ice shelves.
GEMOC 2004 ANNUAL REPORT 15
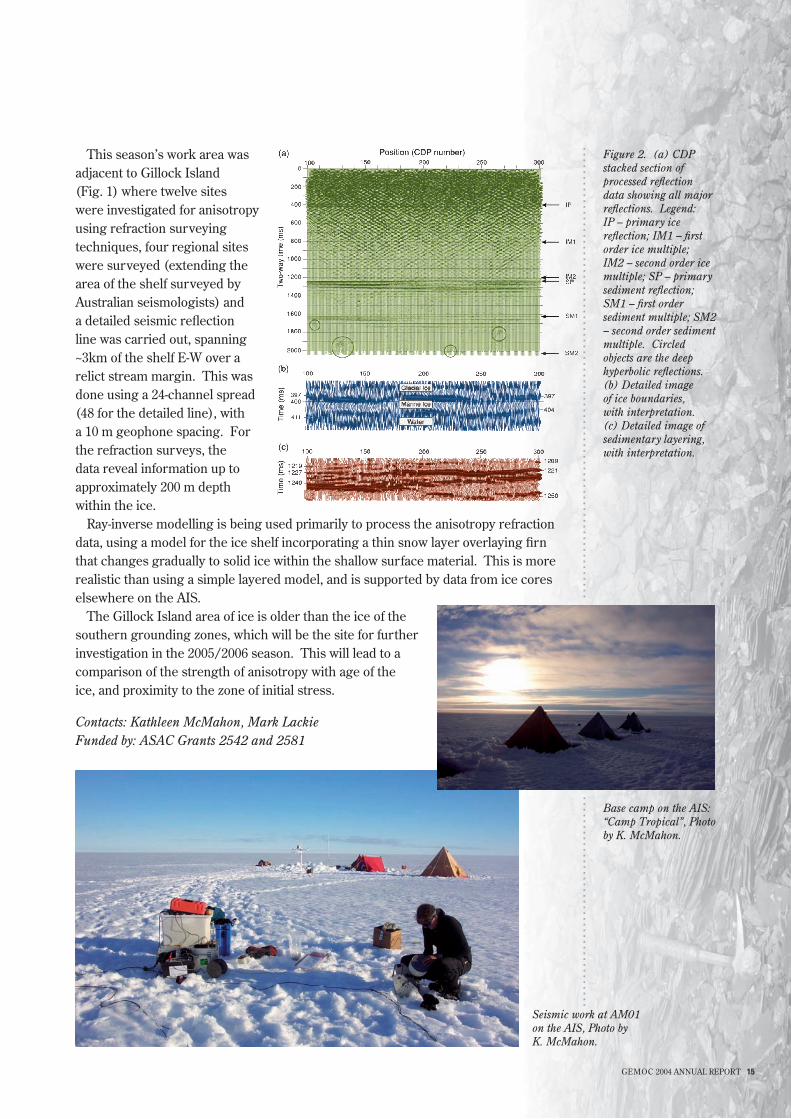
This season’s work area was adjacent to Gillock Island (Fig. 1) where twelve sites were investigated for anisotropy using refraction surveying techniques, four regional sites were surveyed (extending the area of the shelf surveyed by Australian seismologists) and a detailed seismic reflection line was carried out, spanning ~3km of the shelf E-W over a relict stream margin. This was done using a 24-channel spread (48 for the detailed line), with a 10 m geophone spacing. For the refraction surveys, the data reveal information up to approximately 200 m depth within the ice.
Ray-inverse modelling is being used primarily to process the anisotropy refraction data, using a model for the ice shelf incorporating a thin snow layer overlaying firn that changes gradually to solid ice within the shallow surface material. This is more realistic than using a simple layered model, and is supported by data from ice cores elsewhere on the AIS.
The Gillock Island area of ice is older than the ice of the southern grounding zones, which will be the site for further investigation in the 2005/2006 season. This will lead to a comparison of the strength of anisotropy with age of the ice, and proximity to the zone of initial stress.
Contacts: Kathleen McMahon, Mark LackieFunded by: ASAC Grants 2542 and 2581
Figure 2. (a) CDP stacked section of processed reflection data showing all major reflections. Legend: IP – primary ice reflection; IM1 – first order ice multiple; IM2 – second order ice multiple; SP – primary sediment reflection; SM1 – first order sediment multiple; SM2 – second order sediment multiple. Circled objects are the deep hyperbolic reflections. (b) Detailed image of ice boundaries, with interpretation. (c) Detailed image of sedimentary layering, with interpretation.
...................................................................................................................
Seismic work at AM01 on the AIS, Photo by K. McMahon.
Base camp on the AIS: “Camp Tropical”, Photo by K. McMahon.
16 GEMOC 2004 ANNUAL REPORT
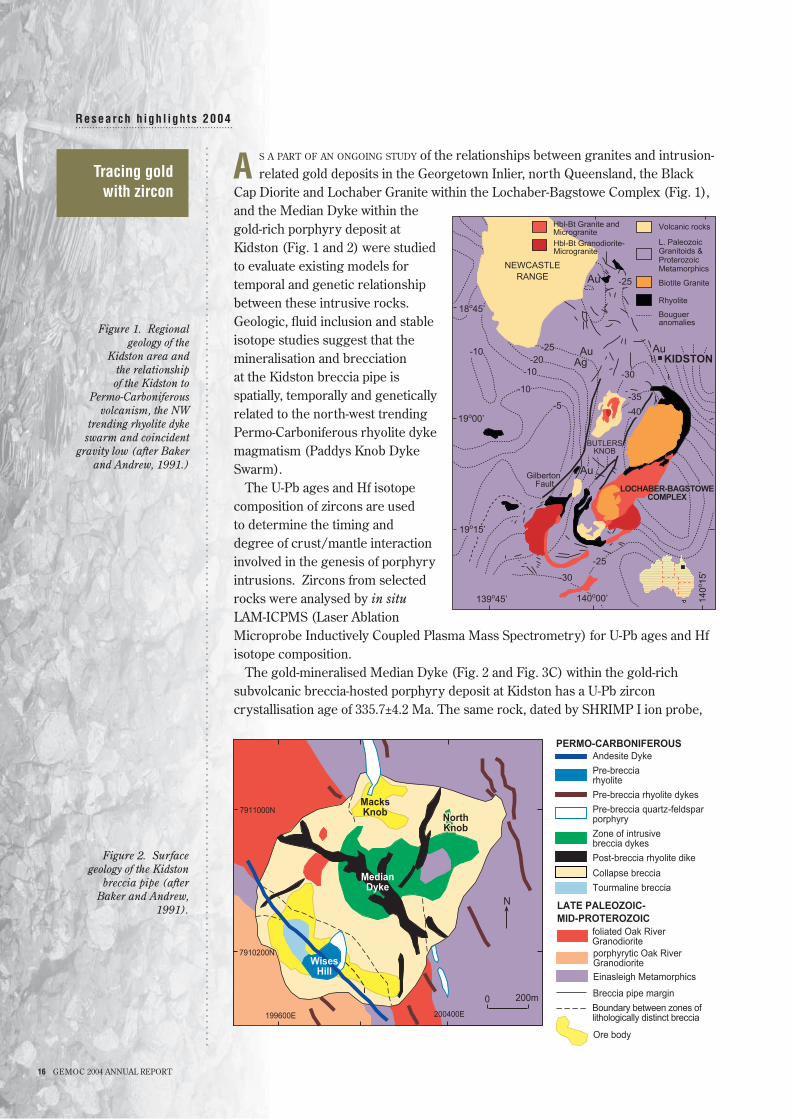
s a part of an ongoing study of the relationships between granites and intrusion-related gold deposits in the Georgetown Inlier, north Queensland, the Black
Cap Diorite and Lochaber Granite within the Lochaber-Bagstowe Complex (Fig. 1), and the Median Dyke within the gold-rich porphyry deposit at Kidston (Fig. 1 and 2) were studied to evaluate existing models for temporal and genetic relationship between these intrusive rocks. Geologic, fluid inclusion and stable isotope studies suggest that the mineralisation and brecciation at the Kidston breccia pipe is spatially, temporally and genetically related to the north-west trending Permo-Carboniferous rhyolite dyke magmatism (Paddys Knob Dyke Swarm).
The U-Pb ages and Hf isotope composition of zircons are used to determine the timing and degree of crust/mantle interaction involved in the genesis of porphyry intrusions. Zircons from selected rocks were analysed by in situ LAM-ICPMS (Laser Ablation Microprobe Inductively Coupled Plasma Mass Spectrometry) for U-Pb ages and Hf isotope composition.
The gold-mineralised Median Dyke (Fig. 2 and Fig. 3C) within the gold-rich subvolcanic breccia-hosted porphyry deposit at Kidston has a U-Pb zircon crystallisation age of 335.7±4.2 Ma. The same rock, dated by SHRIMP I ion probe,
Tracing gold with zircon
A........................................................Research h ighl ights 2004
.............................................................................................................................................................
PERMO-CARBONIFEROUSAndesite Dyke
Post-breccia rhyolite dike
Pre-brecciarhyolite
Pre-breccia rhyolite dykes
Zone of intrusivebreccia dykes
Collapse breccia
Tourmaline breccia
Breccia pipe margin
Boundary between zones oflithologically distinct breccia
foliated Oak RiverGranodioriteporphyrytic Oak RiverGranodiorite
Einasleigh Metamorphics
LATE PALEOZOIC-MID-PROTEROZOIC
200400E
0 200m
199600E
7910200N
7911000N
N
0NWises
Hill
NorthKnob
MacksKnob
Ore body
WisesHill
NorthKnobNorthKnob
MedianDyke
Pre-breccia quartz-feldsparporphyry
KIDSTONAuAu
Ag
-25-20
-10
-10
-10
-5
Au -25
-30
-35
BUTLERSKNOB
LOCHABER-BAGSTOWECOMPLEX
-40
-30
-25
Au
19o00’
18o45’
19o15’
139o45’ 140o00’ 140o 15
’
Volcanic rocks
L. PaleozoicGranitoids &ProterozoicMetamorphics
Bougueranomalies
NEWCASTLERANGE
Gilberton Fault
Biotite Granite
Hbl-Bt Granite andMicrogranite
Rhyolite
Hbl-Bt Granodiorite-Microgranite
Figure 1. Regional geology of the
Kidston area and the relationship of the Kidston to
Permo-Carboniferous volcanism, the NW
trending rhyolite dyke swarm and coincident
gravity low (after Baker and Andrew, 1991.)
Figure 2. Surface geology of the Kidston
breccia pipe (after Baker and Andrew,
1991).
GEMOC 2004 ANNUAL REPORT 17
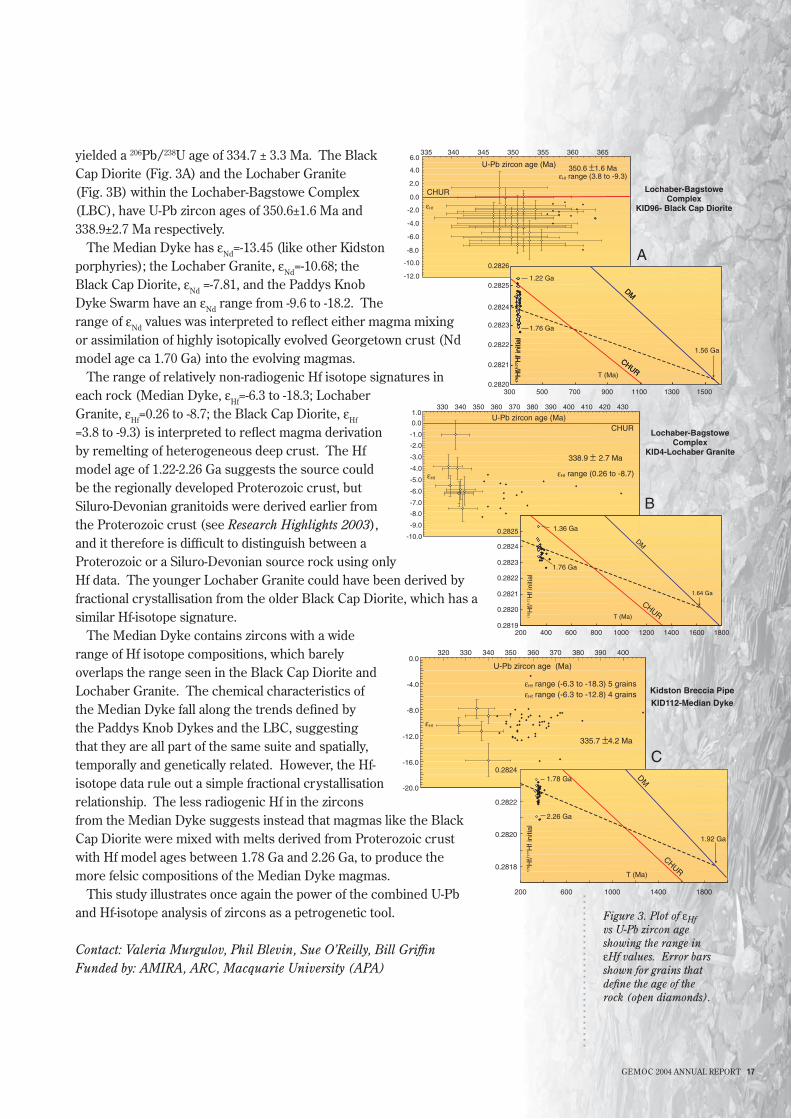
yielded a 206Pb/238U age of 334.7 ± 3.3 Ma. The Black Cap Diorite (Fig. 3A) and the Lochaber Granite (Fig. 3B) within the Lochaber-Bagstowe Complex (LBC), have U-Pb zircon ages of 350.6±1.6 Ma and 338.9±2.7 Ma respectively.
The Median Dyke has εNd=-13.45 (like other Kidston porphyries); the Lochaber Granite, εNd=-10.68; the Black Cap Diorite, εNd =-7.81, and the Paddys Knob Dyke Swarm have an εNd range from -9.6 to -18.2. The range of εNd values was interpreted to reflect either magma mixing or assimilation of highly isotopically evolved Georgetown crust (Nd model age ca 1.70 Ga) into the evolving magmas.
The range of relatively non-radiogenic Hf isotope signatures in each rock (Median Dyke, εHf=-6.3 to -18.3; Lochaber Granite, εHf=0.26 to -8.7; the Black Cap Diorite, εHf =3.8 to -9.3) is interpreted to reflect magma derivation by remelting of heterogeneous deep crust. The Hf model age of 1.22-2.26 Ga suggests the source could be the regionally developed Proterozoic crust, but Siluro-Devonian granitoids were derived earlier from the Proterozoic crust (see Research Highlights 2003), and it therefore is difficult to distinguish between a Proterozoic or a Siluro-Devonian source rock using only Hf data. The younger Lochaber Granite could have been derived by fractional crystallisation from the older Black Cap Diorite, which has a similar Hf-isotope signature.
The Median Dyke contains zircons with a wide range of Hf isotope compositions, which barely overlaps the range seen in the Black Cap Diorite and Lochaber Granite. The chemical characteristics of the Median Dyke fall along the trends defined by the Paddys Knob Dykes and the LBC, suggesting that they are all part of the same suite and spatially, temporally and genetically related. However, the Hf-isotope data rule out a simple fractional crystallisation relationship. The less radiogenic Hf in the zircons from the Median Dyke suggests instead that magmas like the Black Cap Diorite were mixed with melts derived from Proterozoic crust with Hf model ages between 1.78 Ga and 2.26 Ga, to produce the more felsic compositions of the Median Dyke magmas.
This study illustrates once again the power of the combined U-Pb and Hf-isotope analysis of zircons as a petrogenetic tool.
Contact: Valeria Murgulov, Phil Blevin, Sue O’Reilly, Bill GriffinFunded by: AMIRA, ARC, Macquarie University (APA)
...........................
Figure 3. Plot of εHf vs U-Pb zircon age showing the range in εHf values. Error bars shown for grains that define the age of the rock (open diamonds).
176 H
f/177 H
f ini
tial
1.92 Ga
CHUR
DM
0.2818
0.2820
0.2822
0.2824
200 600 1000 1400 1800
T (Ma)
-20.0
-16.0
-12.0
-8.0
-4.0
0.0320 330 340 350 360 370 380 390 400
εHf
U-Pb zircon age (Ma)
Kidston Breccia Pipe
KID112-Median Dyke
εHf range (-6.3 to -18.3) 5 grainsεHf range (-6.3 to -12.8) 4 grains
1.78 Ga
2.26 Ga
335.7 ±4.2 Ma
C
338.9 ± 2.7 Ma
εHf range (0.26 to -8.7)
-10.0
-9.0
-8.0
-7.0
-6.0
-5.0
-4.0
-3.0
-2.0
-1.0
0.0
1.0330 340 350 360 370 380 390 400 410 420 430
εHf
CHUR
0.2819
0.2820
0.2821
0.2822
0.2823
0.2824
0.2825
200 400 600 800 1000 1200 1400 1600 1800
T (Ma)
DM
1.36 Ga17
6 Hf/17
7 Hf i
nitia
l
1.76 Ga
Lochaber-BagstoweComplex
KID4-Lochaber Granite
1.64 Ga
B
U-Pb zircon age (Ma)
CHUR
0.2820
0.2821
0.2822
0.2823
0.2824
0.2825
0.2826
300 500 700 900 1100 1300 1500
T (Ma)
CHUR
DM
176 H
f/177 H
f ini
tial
1.56 GaCHUR
DM
176 H
f/177 H
f ini
tial
-12.0
-10.0
-8.0
-6.0
-4.0
-2.0
0.0
2.0
4.0
6.0335 340 345 350 355 360 365
εHf
U-Pb zircon age (Ma) 350.6 ±1.6 MaεHf range (3.8 to -9.3)
CHUR
1.22 Ga
1.76 Ga
Lochaber-BagstoweComplex
KID96- Black Cap Diorite
A
18 GEMOC 2004 ANNUAL REPORT
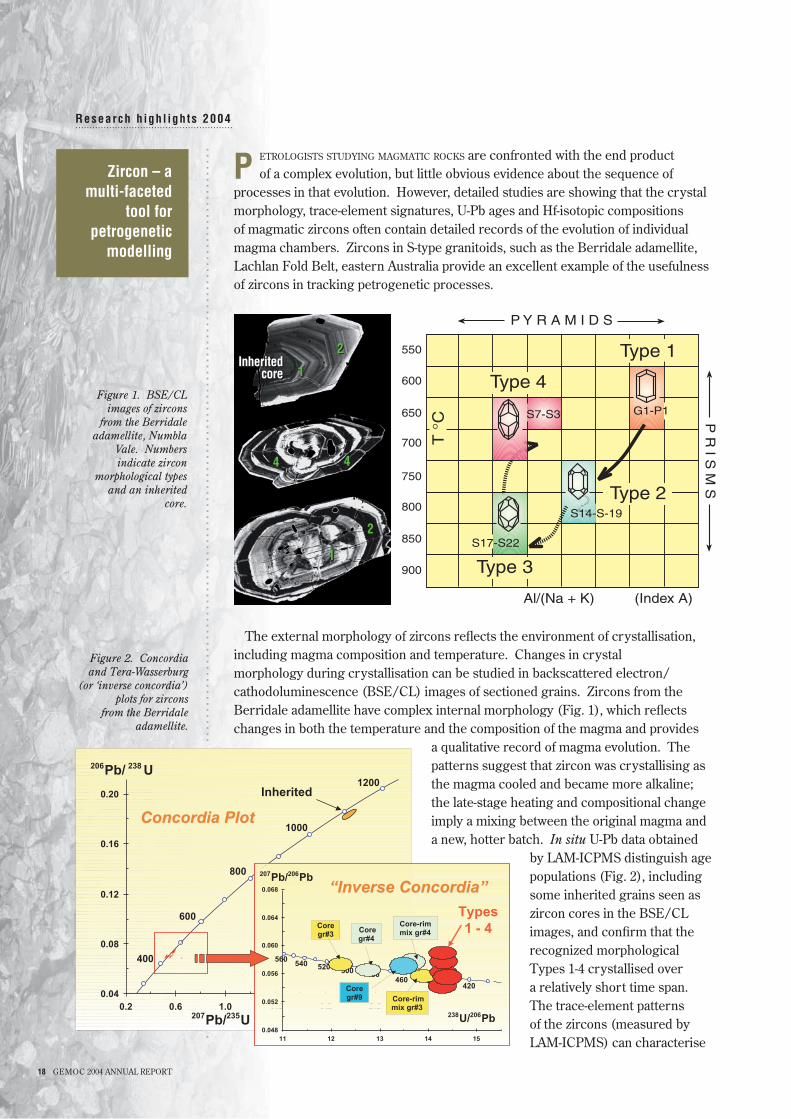
etrologists studying magmatic rocks are confronted with the end product of a complex evolution, but little obvious evidence about the sequence of
processes in that evolution. However, detailed studies are showing that the crystal morphology, trace-element signatures, U-Pb ages and Hf-isotopic compositions of magmatic zircons often contain detailed records of the evolution of individual magma chambers. Zircons in S-type granitoids, such as the Berridale adamellite, Lachlan Fold Belt, eastern Australia provide an excellent example of the usefulness of zircons in tracking petrogenetic processes.
The external morphology of zircons reflects the environment of crystallisation, including magma composition and temperature. Changes in crystal morphology during crystallisation can be studied in backscattered electron/cathodoluminescence (BSE/CL) images of sectioned grains. Zircons from the Berridale adamellite have complex internal morphology (Fig. 1), which reflects changes in both the temperature and the composition of the magma and provides
a qualitative record of magma evolution. The patterns suggest that zircon was crystallising as the magma cooled and became more alkaline; the late-stage heating and compositional change imply a mixing between the original magma and a new, hotter batch. In situ U-Pb data obtained
by LAM-ICPMS distinguish age populations (Fig. 2), including some inherited grains seen as zircon cores in the BSE/CL images, and confirm that the recognized morphological Types 1-4 crystallised over a relatively short time span. The trace-element patterns of the zircons (measured by LAM-ICPMS) can characterise
....................................................................................................
Zircon – a multi-faceted
tool for petrogenetic
modelling
P........................................................Research h ighl ights 2004
Figure 2. Concordia and Tera-Wasserburg
(or ‘inverse concordia’) plots for zircons
from the Berridale adamellite.
Figure 1. BSE/CL images of zircons
from the Berridale adamellite, Numbla
Vale. Numbers indicate zircon
morphological types and an inherited
core.
400
600
800
1000
1200
0.04
0.08
0.12
0.16
0.20
0.2 0.6 1.0 1.4 1.8 2.2207Pb/235U
206Pb/ 238 U
Inherited
420440460
480500520540560
0.048
0.052
0.056
0.060
0.064
0.068
11 12 13 14 15
238U/206Pb
207Pb/206Pb
Coregr#3
Core-rimmix gr#3
Coregr#4
Core-rimmix gr#4
Coregr#9
Types1 - 4
Concordia PlotConcordia Plot
““Inverse ConcordiaInverse Concordia””
P Y R A M I D S
550
600
650
700
750
800
850
900
Al/(Na + K) (Index A)
P R
I S M
S
2
Type 1
Type 2
Type 3
Type 4
G1-P1
S17-S22
S7-S3
S14-S-19
T °
C
1
2
2
1
44
Inheritedcore
Inheritedcore 1
2
2
1
44
GEMOC 2004 ANNUAL REPORT 1�
.............................................................................................................................................................
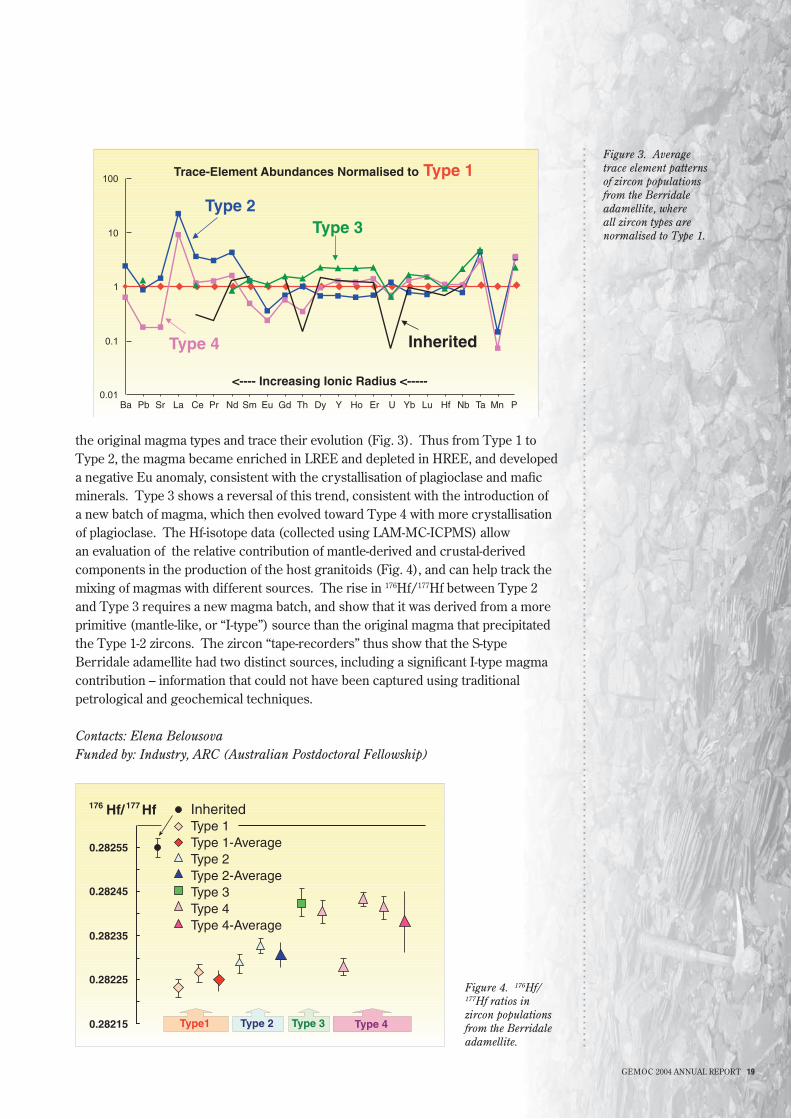
Figure 3. Average trace element patterns of zircon populations from the Berridale adamellite, where all zircon types are normalised to Type 1.
Figure 4. 176Hf/177Hf ratios in zircon populations from the Berridale adamellite.
the original magma types and trace their evolution (Fig. 3). Thus from Type 1 to Type 2, the magma became enriched in LREE and depleted in HREE, and developed a negative Eu anomaly, consistent with the crystallisation of plagioclase and mafic minerals. Type 3 shows a reversal of this trend, consistent with the introduction of a new batch of magma, which then evolved toward Type 4 with more crystallisation of plagioclase. The Hf-isotope data (collected using LAM-MC-ICPMS) allow an evaluation of the relative contribution of mantle-derived and crustal-derived components in the production of the host granitoids (Fig. 4), and can help track the mixing of magmas with different sources. The rise in 176Hf/177Hf between Type 2 and Type 3 requires a new magma batch, and show that it was derived from a more primitive (mantle-like, or “I-type”) source than the original magma that precipitated the Type 1-2 zircons. The zircon “tape-recorders” thus show that the S-type Berridale adamellite had two distinct sources, including a significant I-type magma contribution – information that could not have been captured using traditional petrological and geochemical techniques.
Contacts: Elena BelousovaFunded by: Industry, ARC (Australian Postdoctoral Fellowship)
Trace-Element Abundances Normalised to Type 1
0.01
0.1
1
10
100
Ba Pb Sr La Ce Pr Nd Sm Eu Gd Th Dy Y Ho Er U Yb Lu Hf Nb Ta Mn P
<---- Increasing Ionic Radius <-----
Inherited
Type 2Type 3
Type 4
0.28215
0.28225
0.28235
0.28245
0.28255
176 Hf/177 Hf
Type1 Type 2 Type 4Type 3
InheritedType 1Type 1-AverageType 2Type 2-AverageType 3Type 4Type 4-Average
20 GEMOC 2004 ANNUAL REPORT
enoliths in kimberlites and lamproites provide many of our best samples of the upper mantle, but the eruption of these deep-seated magmas also can
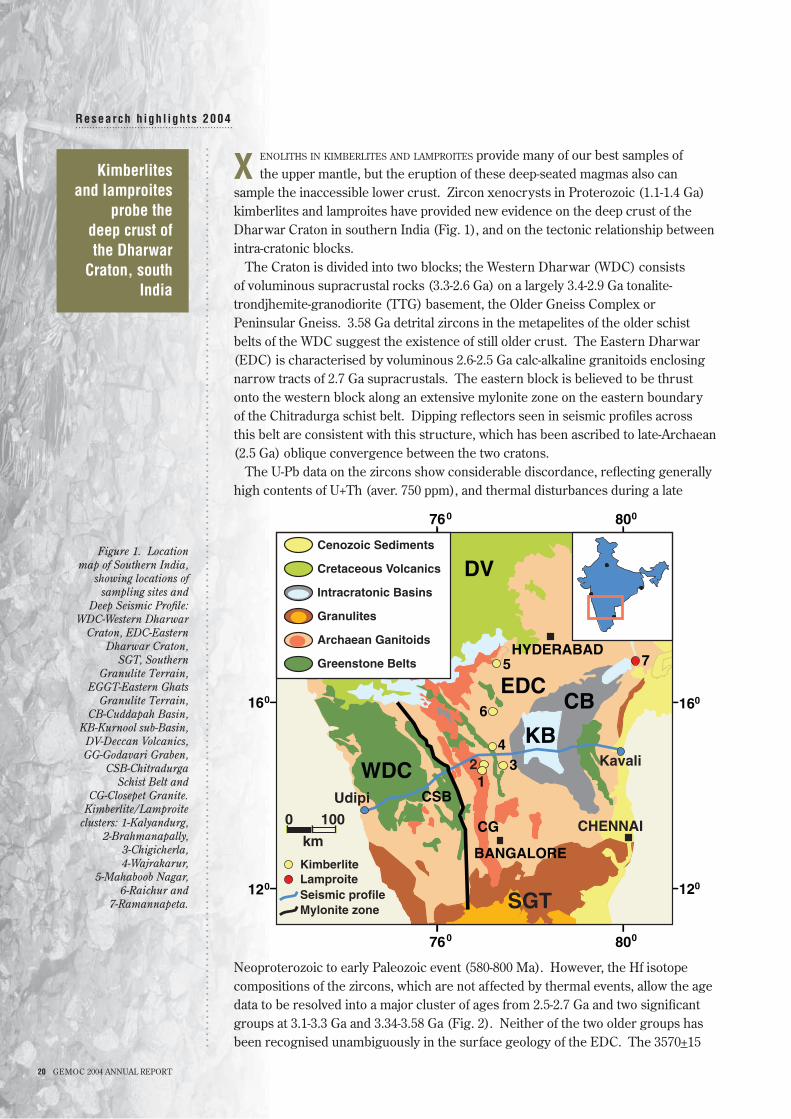
sample the inaccessible lower crust. Zircon xenocrysts in Proterozoic (1.1-1.4 Ga) kimberlites and lamproites have provided new evidence on the deep crust of the Dharwar Craton in southern India (Fig. 1), and on the tectonic relationship between intra-cratonic blocks.
The Craton is divided into two blocks; the Western Dharwar (WDC) consists of voluminous supracrustal rocks (3.3-2.6 Ga) on a largely 3.4-2.9 Ga tonalite-trondjhemite-granodiorite (TTG) basement, the Older Gneiss Complex or Peninsular Gneiss. 3.58 Ga detrital zircons in the metapelites of the older schist belts of the WDC suggest the existence of still older crust. The Eastern Dharwar (EDC) is characterised by voluminous 2.6-2.5 Ga calc-alkaline granitoids enclosing narrow tracts of 2.7 Ga supracrustals. The eastern block is believed to be thrust onto the western block along an extensive mylonite zone on the eastern boundary of the Chitradurga schist belt. Dipping reflectors seen in seismic profiles across this belt are consistent with this structure, which has been ascribed to late-Archaean (2.5 Ga) oblique convergence between the two cratons.
The U-Pb data on the zircons show considerable discordance, reflecting generally high contents of U+Th (aver. 750 ppm), and thermal disturbances during a late
Neoproterozoic to early Paleozoic event (580-800 Ma). However, the Hf isotope compositions of the zircons, which are not affected by thermal events, allow the age data to be resolved into a major cluster of ages from 2.5-2.7 Ga and two significant groups at 3.1-3.3 Ga and 3.34-3.58 Ga (Fig. 2). Neither of the two older groups has been recognised unambiguously in the surface geology of the EDC. The 3570+15
........................................................Research h ighl ights 2004
.............................................................................................................................................................
Kimberlites and lamproites
probe the deep crust of the Dharwar
Craton, south India
X
Figure 1. Location map of Southern India,
showing locations of sampling sites and
Deep Seismic Profile: WDC-Western Dharwar
Craton, EDC-Eastern Dharwar Craton,
SGT, Southern Granulite Terrain,
EGGT-Eastern Ghats Granulite Terrain,
CB-Cuddapah Basin, KB-Kurnool sub-Basin, DV-Deccan Volcanics, GG-Godavari Graben,
CSB-Chitradurga Schist Belt and
CG-Closepet Granite. Kimberlite/Lamproite
clusters: 1-Kalyandurg, 2-Brahmanapally,
3-Chigicherla, 4-Wajrakarur,
5-Mahaboob Nagar, 6-Raichur and
7-Ramannapeta.
Greenstone Belts
Archaean Ganitoids
Granulites
Intracratonic Basins
Cretaceous Volcanics
Cenozoic Sediments
DV
800760
120
16016
12
800760
Lamproite
0
0
HYDERABAD
EDC
WDC
CB
KB3
4
7
6
Udipi
Kavali
CHENNAI
SGT
Kimberlite
Seismic profileMylonite zone
0 100
kmBANGALORE
CG
CSB1
5
EG
GT
2
GEMOC 2004 ANNUAL REPORT 21
.............................................................................................................................................................
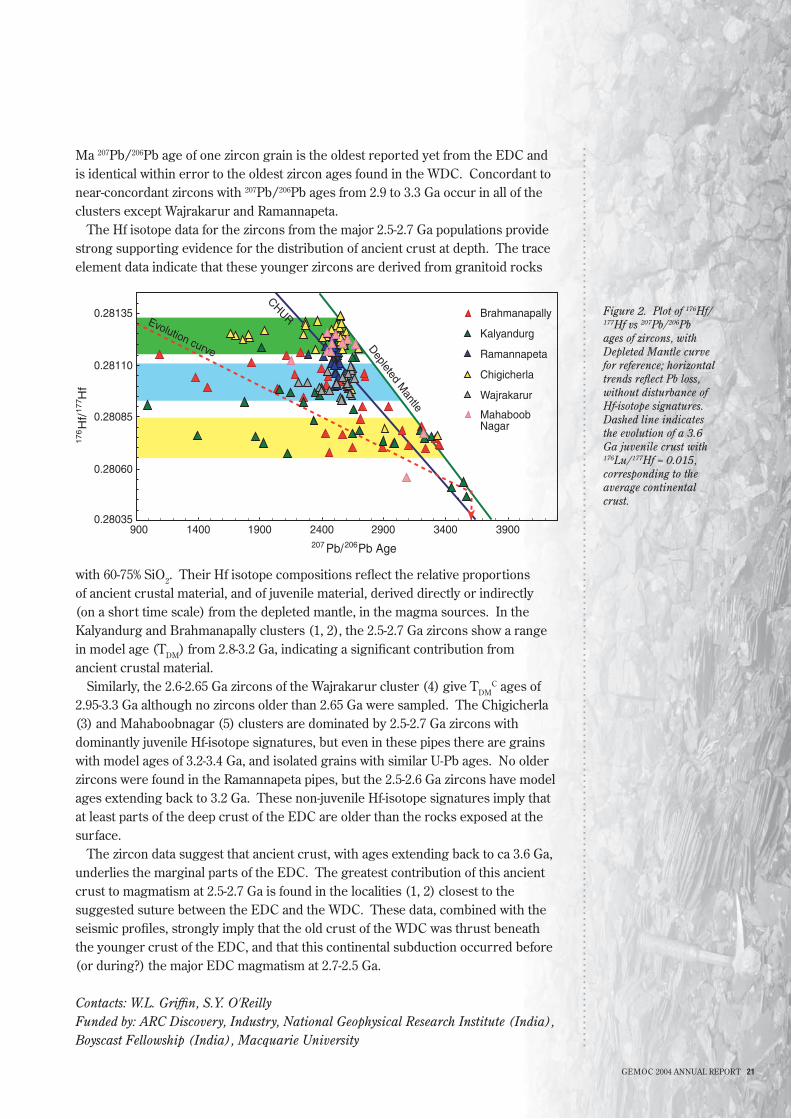
Figure 2. Plot of 176Hf/177Hf vs 207Pb/206Pb ages of zircons, with Depleted Mantle curve for reference; horizontal trends reflect Pb loss, without disturbance of Hf-isotope signatures. Dashed line indicates the evolution of a 3.6 Ga juvenile crust with 176Lu/177Hf = 0.015, corresponding to the average continental crust.
Ma 207Pb/206Pb age of one zircon grain is the oldest reported yet from the EDC and is identical within error to the oldest zircon ages found in the WDC. Concordant to near-concordant zircons with 207Pb/206Pb ages from 2.9 to 3.3 Ga occur in all of the clusters except Wajrakarur and Ramannapeta.
The Hf isotope data for the zircons from the major 2.5-2.7 Ga populations provide strong supporting evidence for the distribution of ancient crust at depth. The trace element data indicate that these younger zircons are derived from granitoid rocks
with 60-75% SiO2. Their Hf isotope compositions reflect the relative proportions of ancient crustal material, and of juvenile material, derived directly or indirectly (on a short time scale) from the depleted mantle, in the magma sources. In the Kalyandurg and Brahmanapally clusters (1, 2), the 2.5-2.7 Ga zircons show a range in model age (TDM) from 2.8-3.2 Ga, indicating a significant contribution from ancient crustal material.
Similarly, the 2.6-2.65 Ga zircons of the Wajrakarur cluster (4) give TDMC ages of
2.95-3.3 Ga although no zircons older than 2.65 Ga were sampled. The Chigicherla (3) and Mahaboobnagar (5) clusters are dominated by 2.5-2.7 Ga zircons with dominantly juvenile Hf-isotope signatures, but even in these pipes there are grains with model ages of 3.2-3.4 Ga, and isolated grains with similar U-Pb ages. No older zircons were found in the Ramannapeta pipes, but the 2.5-2.6 Ga zircons have model ages extending back to 3.2 Ga. These non-juvenile Hf-isotope signatures imply that at least parts of the deep crust of the EDC are older than the rocks exposed at the surface.
The zircon data suggest that ancient crust, with ages extending back to ca 3.6 Ga, underlies the marginal parts of the EDC. The greatest contribution of this ancient crust to magmatism at 2.5-2.7 Ga is found in the localities (1, 2) closest to the suggested suture between the EDC and the WDC. These data, combined with the seismic profiles, strongly imply that the old crust of the WDC was thrust beneath the younger crust of the EDC, and that this continental subduction occurred before (or during?) the major EDC magmatism at 2.7-2.5 Ga.
Contacts: W.L. Griffin, S.Y. O'ReillyFunded by: ARC Discovery, Industry, National Geophysical Research Institute (India), Boyscast Fellowship (India), Macquarie University
207 Pb/206Pb Age
0.28035
0.28060
0.28085
0.28110
0.28135
900 1400 1900 2400 2900 3400 3900
Brahmanapally
Kalyandurg
Ramannapeta
Chigicherla
Wajrakarur
MahaboobNagar
Evolution curve
CHUR
Depleted M
antle
176H
f/177 H
f
22 GEMOC 2004 ANNUAL REPORT
ineral exploration performance, whether measured by discovery rate, average discovery cost, number of world-class deposits discovered, or return on
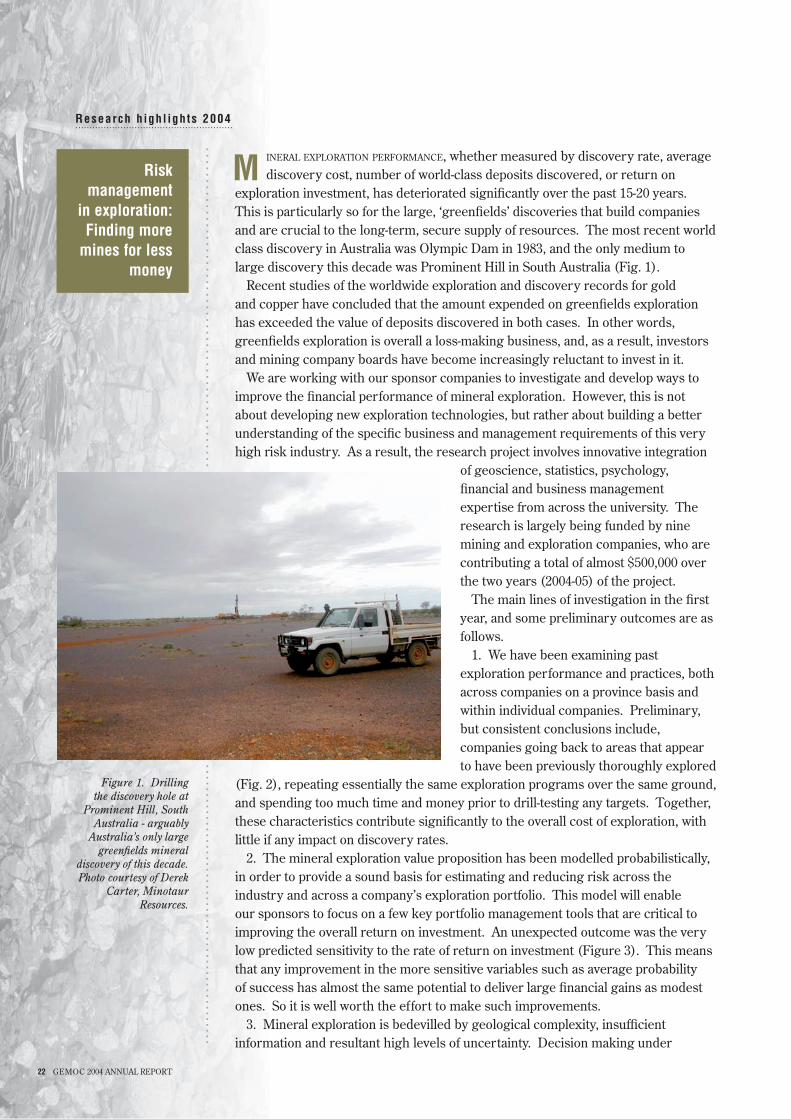
exploration investment, has deteriorated significantly over the past 15-20 years. This is particularly so for the large, ‘greenfields’ discoveries that build companies and are crucial to the long-term, secure supply of resources. The most recent world class discovery in Australia was Olympic Dam in 1983, and the only medium to large discovery this decade was Prominent Hill in South Australia (Fig. 1).
Recent studies of the worldwide exploration and discovery records for gold and copper have concluded that the amount expended on greenfields exploration has exceeded the value of deposits discovered in both cases. In other words, greenfields exploration is overall a loss-making business, and, as a result, investors and mining company boards have become increasingly reluctant to invest in it.
We are working with our sponsor companies to investigate and develop ways to improve the financial performance of mineral exploration. However, this is not about developing new exploration technologies, but rather about building a better understanding of the specific business and management requirements of this very high risk industry. As a result, the research project involves innovative integration
of geoscience, statistics, psychology, financial and business management expertise from across the university. The research is largely being funded by nine mining and exploration companies, who are contributing a total of almost $500,000 over the two years (2004-05) of the project.
The main lines of investigation in the first year, and some preliminary outcomes are as follows.
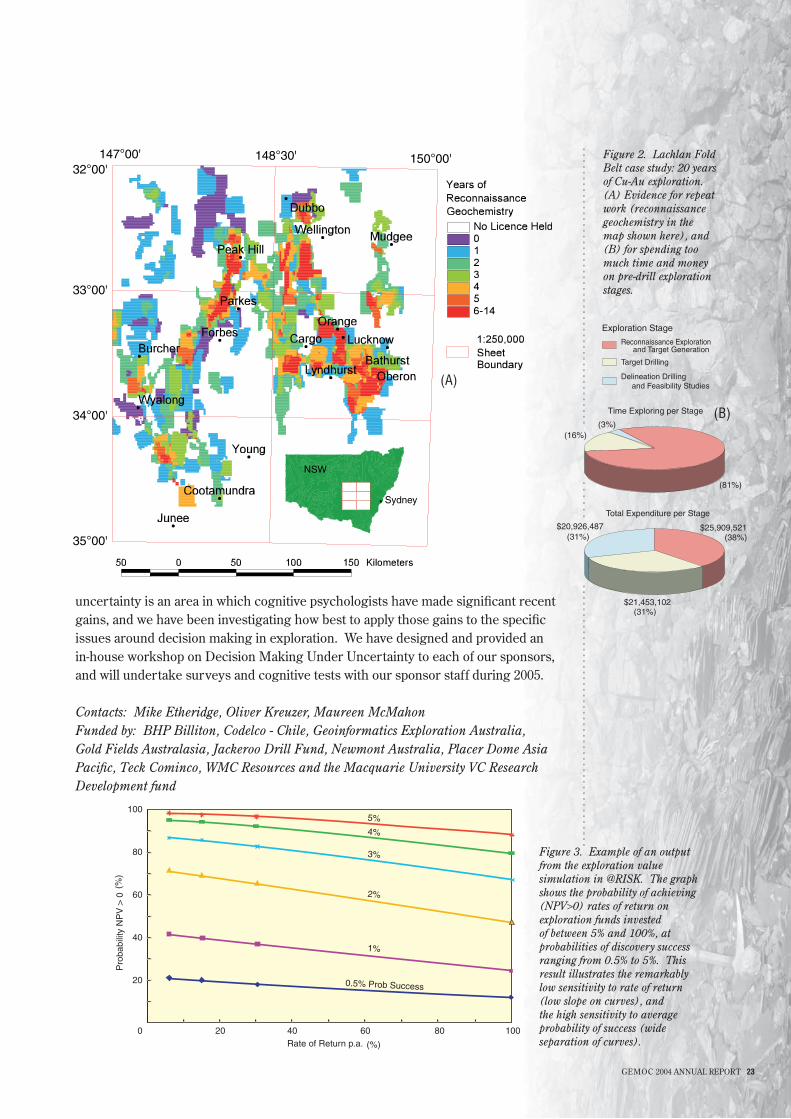
1. We have been examining past exploration performance and practices, both across companies on a province basis and within individual companies. Preliminary, but consistent conclusions include, companies going back to areas that appear to have been previously thoroughly explored
(Fig. 2), repeating essentially the same exploration programs over the same ground, and spending too much time and money prior to drill-testing any targets. Together, these characteristics contribute significantly to the overall cost of exploration, with little if any impact on discovery rates.
2. The mineral exploration value proposition has been modelled probabilistically, in order to provide a sound basis for estimating and reducing risk across the industry and across a company’s exploration portfolio. This model will enable our sponsors to focus on a few key portfolio management tools that are critical to improving the overall return on investment. An unexpected outcome was the very low predicted sensitivity to the rate of return on investment (Figure 3). This means that any improvement in the more sensitive variables such as average probability of success has almost the same potential to deliver large financial gains as modest ones. So it is well worth the effort to make such improvements.
3. Mineral exploration is bedevilled by geological complexity, insufficient information and resultant high levels of uncertainty. Decision making under
........................................................Research h ighl ights 2004
....................................................................................................
Risk management
in exploration: Finding more
mines for less money
M
Figure 1. Drilling the discovery hole at
Prominent Hill, South Australia - arguably
Australia’s only large greenfields mineral
discovery of this decade. Photo courtesy of Derek
Carter, Minotaur Resources.
GEMOC 2004 ANNUAL REPORT 23
uncertainty is an area in which cognitive psychologists have made significant recent gains, and we have been investigating how best to apply those gains to the specific issues around decision making in exploration. We have designed and provided an in-house workshop on Decision Making Under Uncertainty to each of our sponsors, and will undertake surveys and cognitive tests with our sponsor staff during 2005.
Contacts: Mike Etheridge, Oliver Kreuzer, Maureen McMahonFunded by: BHP Billiton, Codelco - Chile, Geoinformatics Exploration Australia, Gold Fields Australasia, Jackeroo Drill Fund, Newmont Australia, Placer Dome Asia Pacific, Teck Cominco, WMC Resources and the Macquarie University VC Research Development fund
Figure 3. Example of an output from the exploration value simulation in @RISK. The graph shows the probability of achieving (NPV>0) rates of return on exploration funds invested of between 5% and 100%, at probabilities of discovery success ranging from 0.5% to 5%. This result illustrates the remarkably low sensitivity to rate of return (low slope on curves), and the high sensitivity to average probability of success (wide separation of curves).
Figure 2. Lachlan Fold Belt case study: 20 years of Cu-Au exploration. (A) Evidence for repeat work (reconnaissance geochemistry in the map shown here), and (B) for spending too much time and money on pre-drill exploration stages.
......................................................
..............................................
Time Exploring per Stage
(3%)
(81%)
(16%)
Total Expenditure per Stage
$21,453,102
$25,909,521$20,926,487(31%) (38%)
(31%)
147°00' 148°30' 150°00' 32°00'
33°00'
34°00'
35°00'
Sydney
NSW
Target Drilling
Delineation Drilling and Feasibility Studies
Reconnaissance Explorationand Target Generation
Exploration Stage
0
20
40
60
80
100
20 40 60 80 100Rate of Return p.a.
Pro
babi
lity
NP
V >
0
(%)
(%)
0.5% Prob Success
1%
2%
3%
4%
5%
(B)
(A)
ARC National Key Centre for the Geochemical Evolution and Metallogeny of Continents