Embed Size (px)
Citation preview
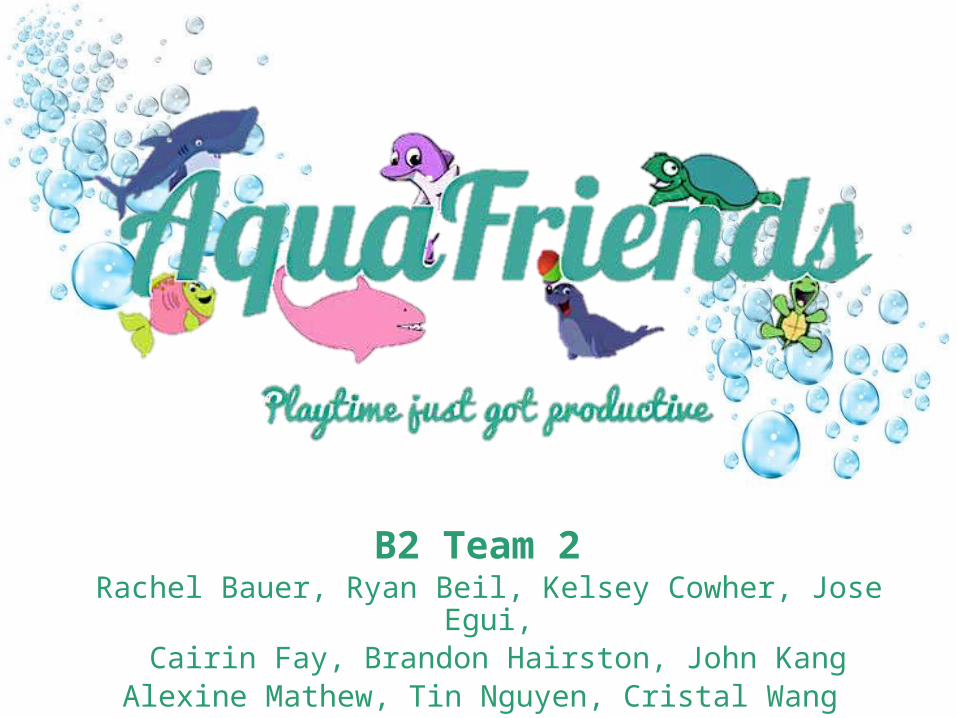
B2 Team 2 Rachel Bauer, Ryan Beil, Kelsey Cowher, Jose Egui,
Cairin Fay, Brandon Hairston, John Kang Alexine Mathew, Tin Nguyen, Cristal Wang
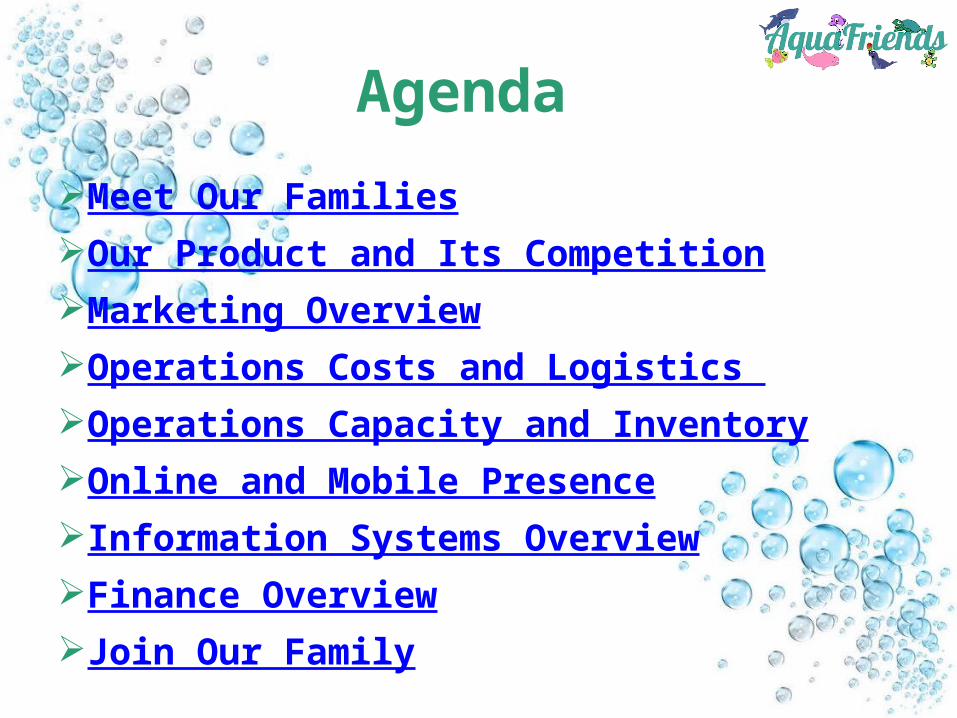
Agenda
Meet Our FamiliesOur Product and Its Competitio
nMarketing OverviewOperations Costs and Logistics Operations Capacity and Invent
oryOnline and Mobile PresenceInformation Systems OverviewFinance OverviewJoin Our Family

Meet the Jones Family
Trouble Motivating Their Kids
To Do Chores
Frequently Use Their Own Pool
Environmentally
Conscious
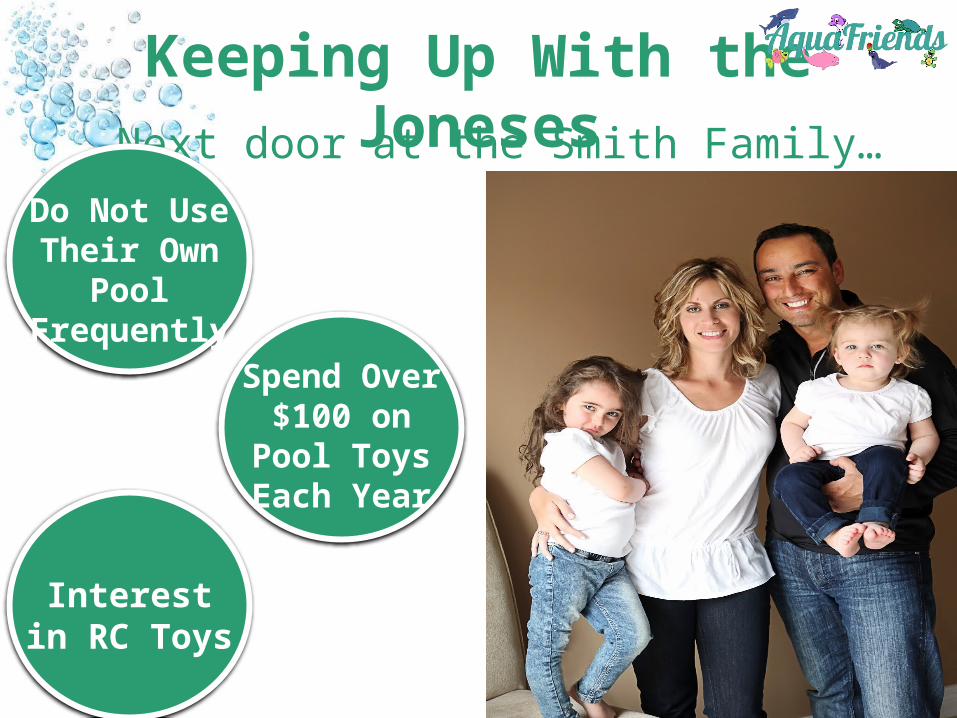
Keeping Up With the JonesesNext door at the Smith Family…
Do Not Use Their Own
Pool Frequently
Spend Over $100 on
Pool Toys Each Year
Interest in RC Toys

The AquaFriend
A remote controlled pool toy in the shape of a shark and floats on the surface of a pool to
collect debris through a removable net attached to its bottom. Our product will be
propelled by a small battery-charged motor.
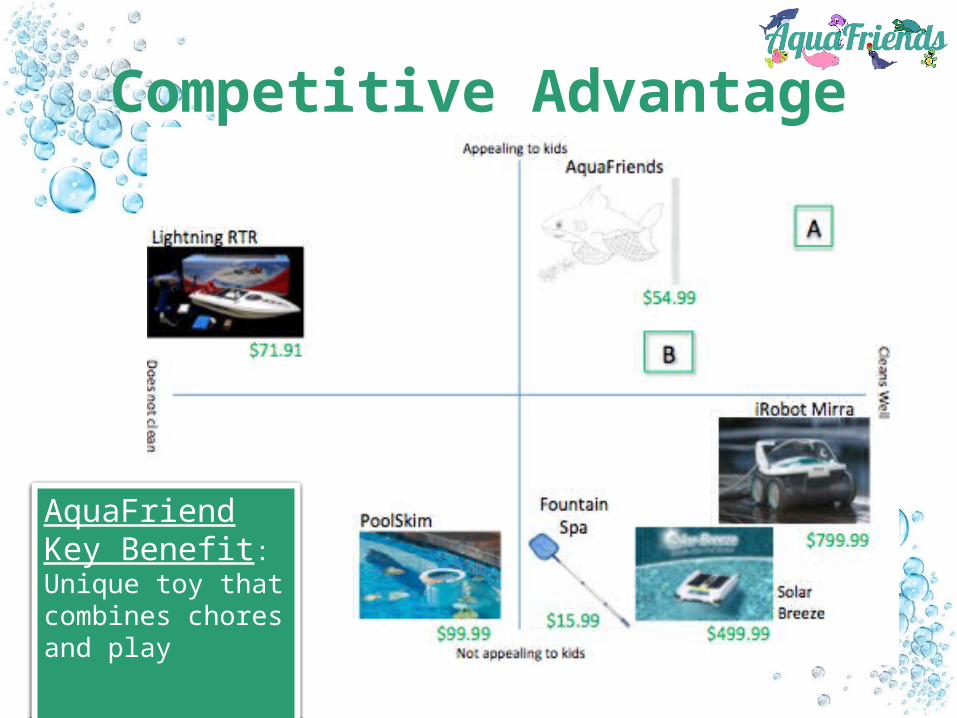
Competitive Advantage
AquaFriend Key Benefit:Unique toy that combines chores and play
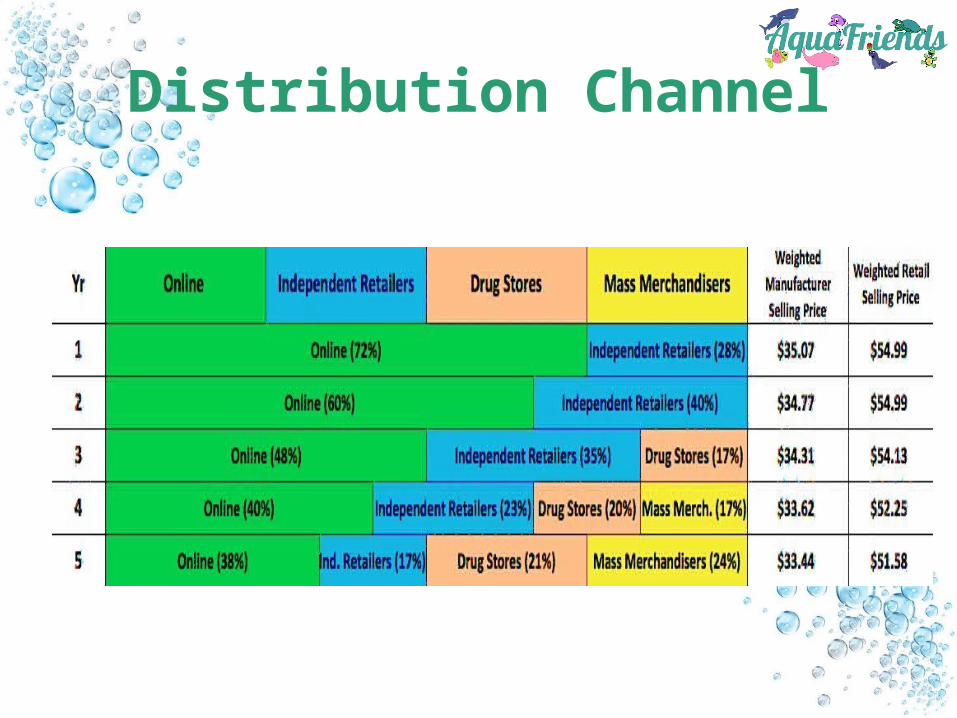
Distribution Channel
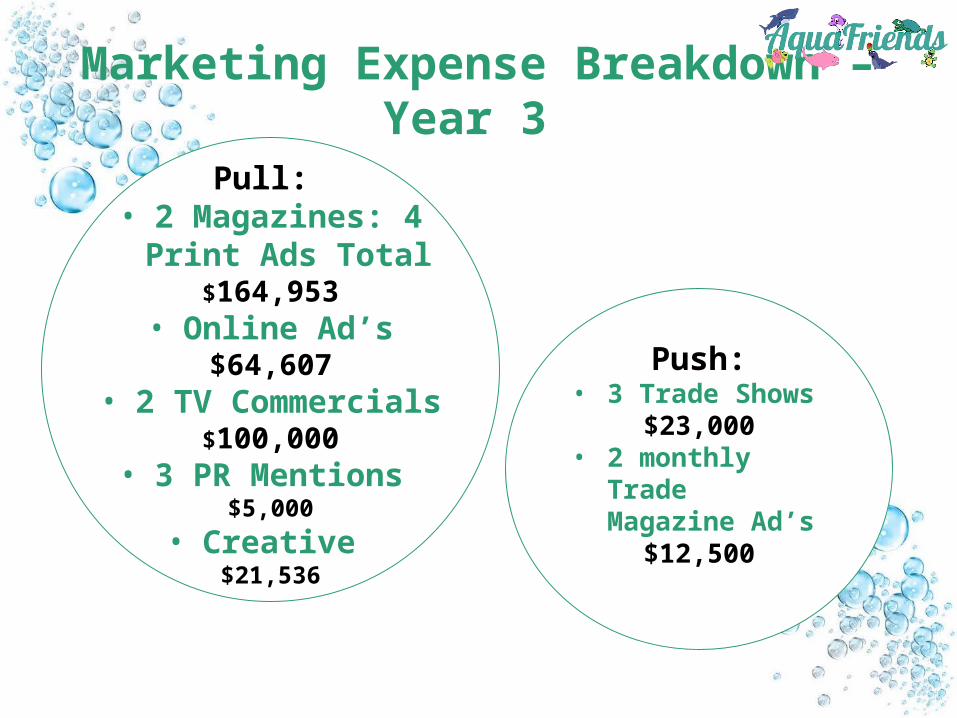
Marketing Expense Breakdown – Year 3
Push:• 3 Trade Shows
$23,000• 2 monthly
Trade Magazine Ad’s
$12,500
Pull: • 2 Magazines: 4
Print Ads Total$164,953
• Online Ad’s$64,607
• 2 TV Commercials$100,000
• 3 PR Mentions $5,000
• Creative $21,536

Logistics
Material suppliers (China)
Shenzhen Port
Long Beach Port
Fresno Facility
1 Day 18 Days
0.5 Days
Shenzhen Jillion
3PL
Shenzhen Jillion
3PL
Shenzhen Jillion
3PL
Final Assembly
of FG

COGS
Year 1
Year 2
Year 3
Year 4
Year 5
$0
$500,000
$1,000,000
$1,500,000
$2,000,000
$2,500,000
$17.00
$17.50
$18.00
$18.50
$19.00
$19.50
$20.00
$20.50
$755,999.48
$1,103,912.94
$1,485,938.19
$1,873,742.30
$2,297,060.74
$19.93
$19.04$18.91
$18.66$18.45
Total Cogs Unit COGS
Tota
l C
OG
S
Un
it C
OG
S
Year 1 Year 2 Year 3 Year 4 Year 5
Total COGS $755,999.48 $1,103,912.94 $1,485,938.19 $1,873,742.3 $2,297,060.74
Unit COGS $19.93 $19.04 $18.91 $18.66 $18.45
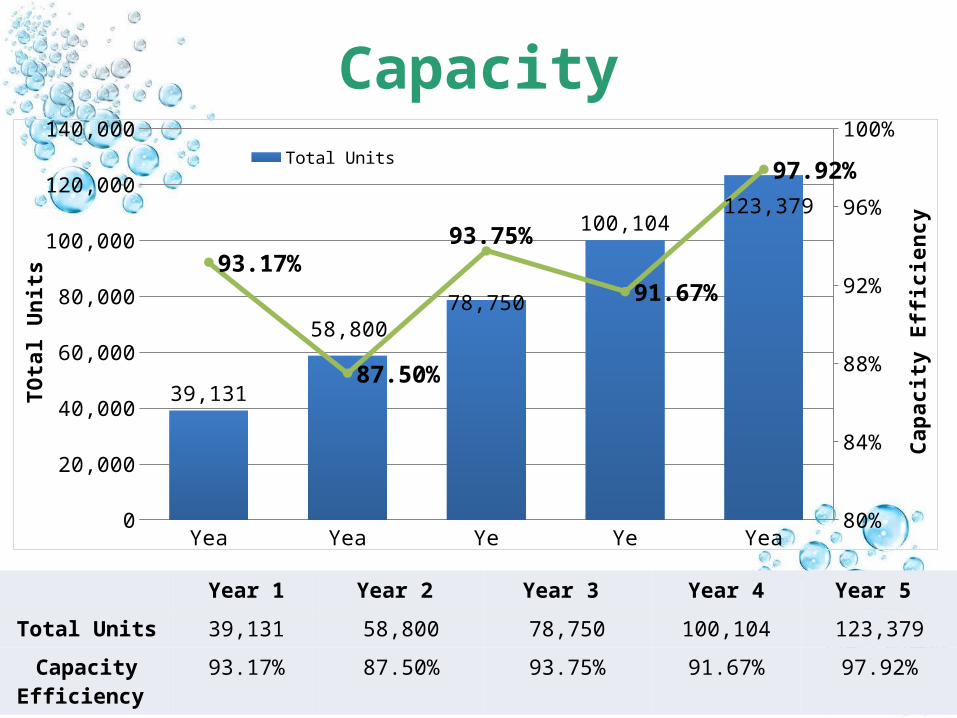
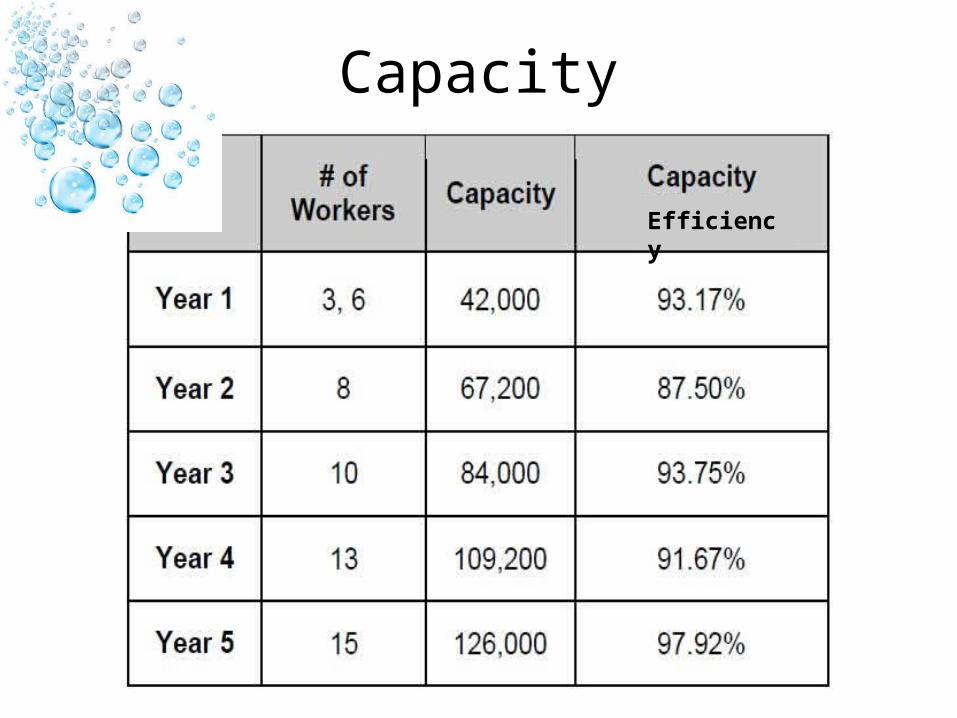
Capacity
Year 1 Year 2 Year 3 Year 4 Year 5 Total Units 39,131 58,800 78,750 100,104 123,379
Capacity Efficiency
93.17% 87.50% 93.75% 91.67% 97.92%
Year 1 Year 2 Year 3 Year 4 Year 5 0
20,000
40,000
60,000
80,000
100,000
120,000
140,000
80%
84%
88%
92%
96%
100%
39,131
58,80078,750
100,104123,379
93.17%
87.50%
93.75%
91.67%
97.92%Total Units
TO
tal U
nit
s
Cap
aci
ty E
ffici
en
cy

Inventory
Year 1 Year 2 Year 3 Year 4 Year 5
Total Inventory $118,904 $155,761 $197,193 $259,606 $289,765
COGS $755,999.48 $1,103,912.94 $1,485,938.19 $1,873,742.3 $2,297,060.74
Inventory Days 48.8 51.5 48.4 50.6 46.0
Year 1 Year 2 Year 3 Year 4 Year 5 $0
$50,000
$100,000
$150,000
$200,000
$250,000
$300,000
$350,000
42
44
46
48
50
52
$118,904
$155,761
$197,193
$259,606
$289,765
48.8
51.5
48.4
50.6
46
Total Inventory
Inventory Days
Tota
l In
ven
tory
Inven
tory
Days
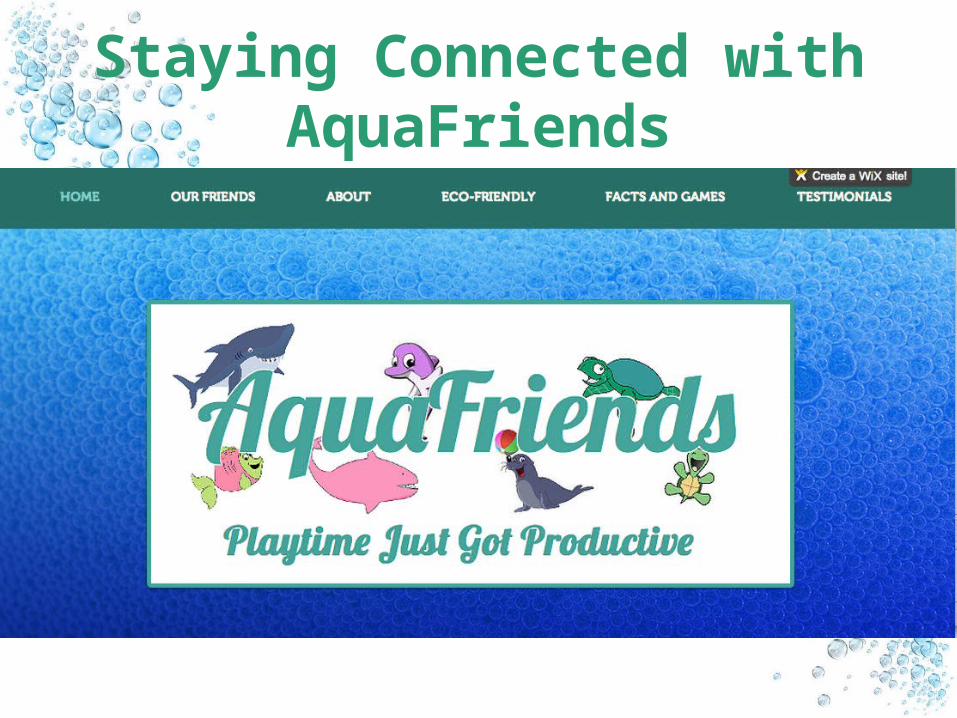
Staying Connected with AquaFriends

Staying Connected with AquaFriends
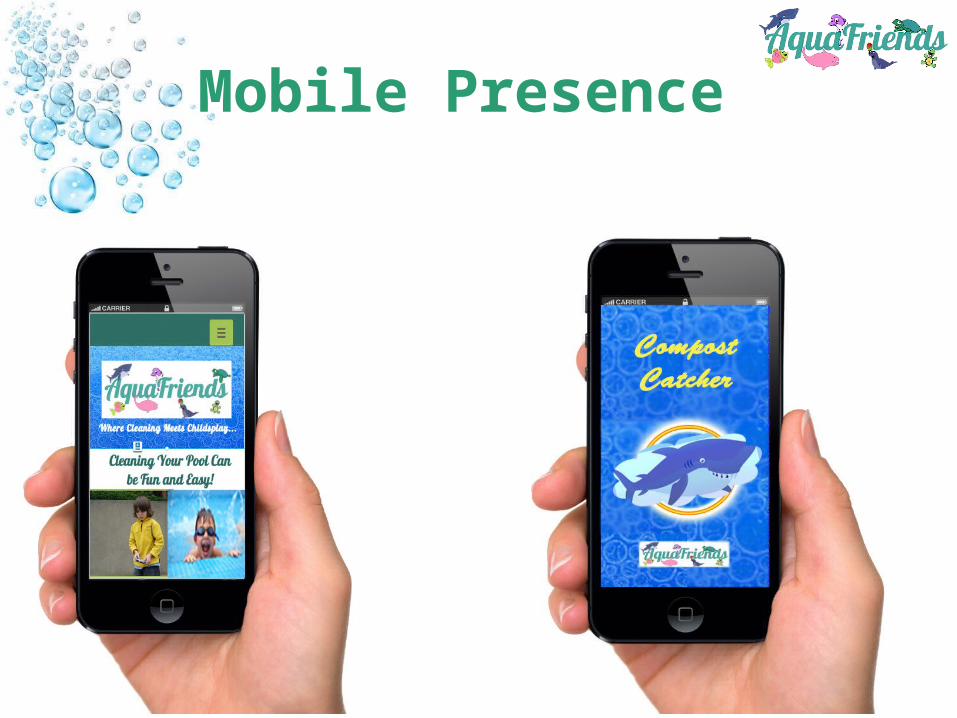
Mobile Presence
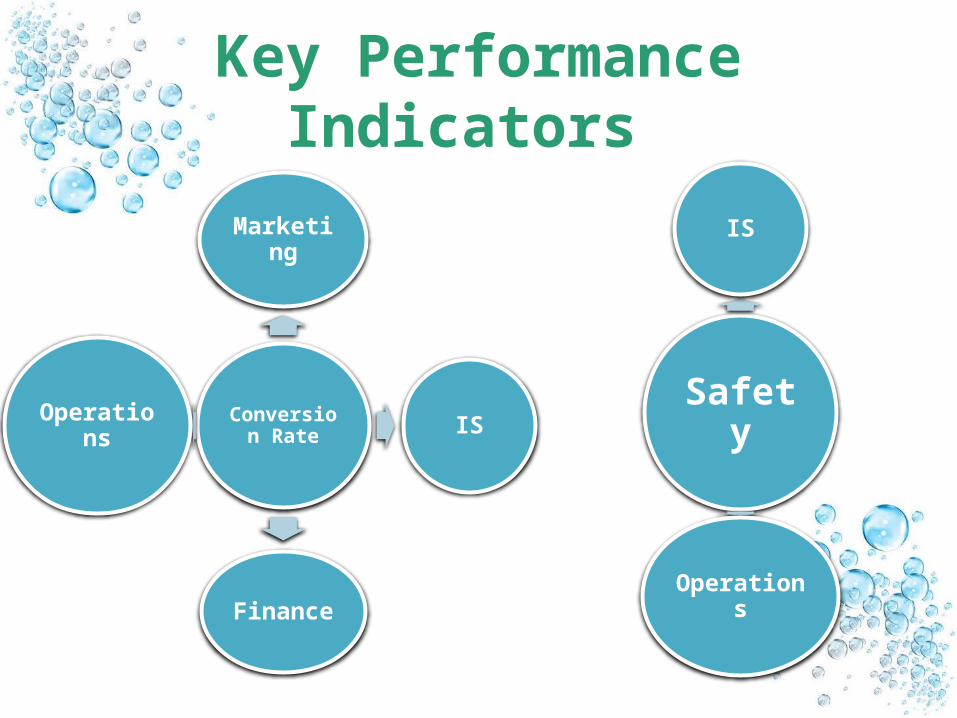
Key Performance Indicators
Conversion Rate
Marketing
IS
Finance
Operations
Safety
IS
Operations
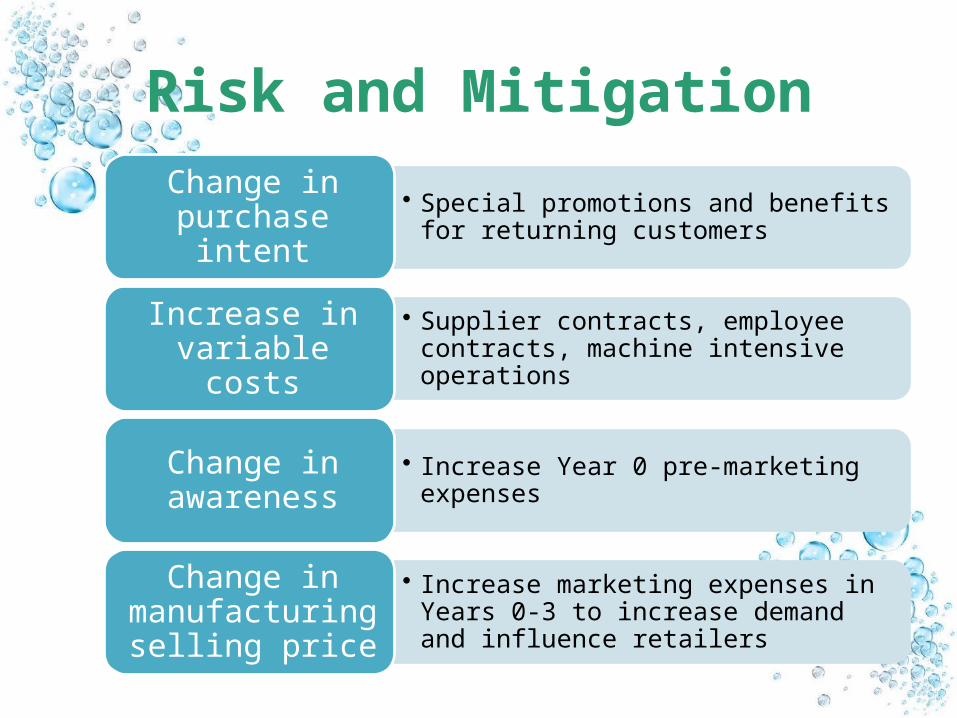
Risk and Mitigation
• Special promotions and benefits for returning customers
Change in purchase intent
• Supplier contracts, employee contracts, machine intensive operations
Increase in variable costs
• Increase Year 0 pre-marketing expenses
Change in awareness
• Increase marketing expenses in Years 0-3 to increase demand and influence retailers
Change in manufacturing selling price
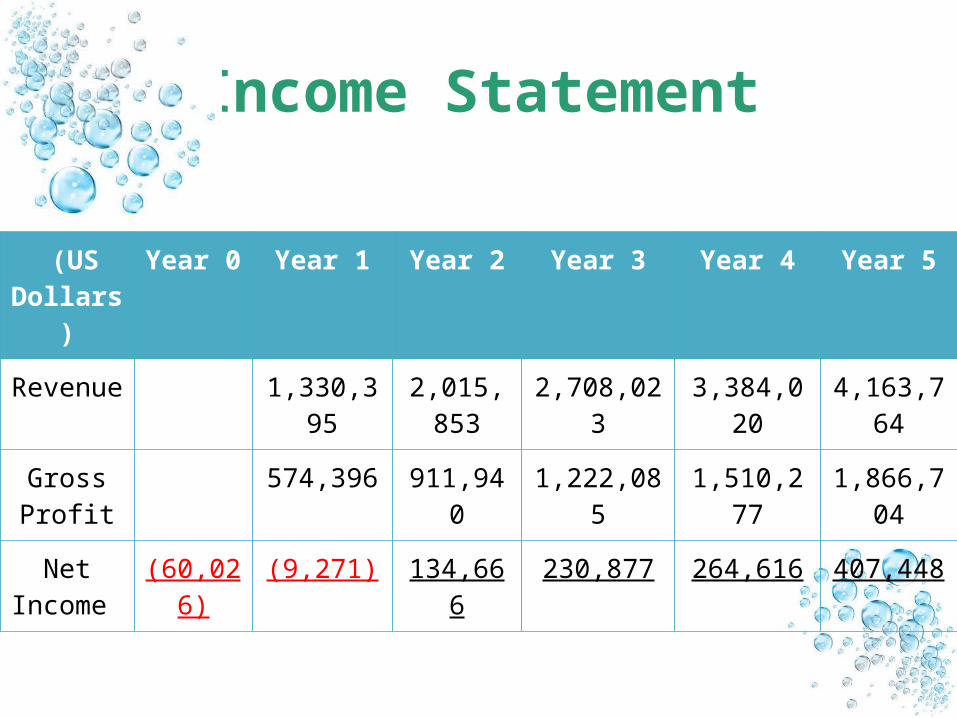
Income Statement
(US Dollars
)
Year 0 Year 1 Year 2 Year 3 Year 4 Year 5
Revenue
1,330,395
2,015,853
2,708,023 3,384,020
4,163,764
Gross Profit
574,396 911,940 1,222,085 1,510,277
1,866,704
Net Income
(60,026)
(9,271) 134,666 230,877 264,616 407,448
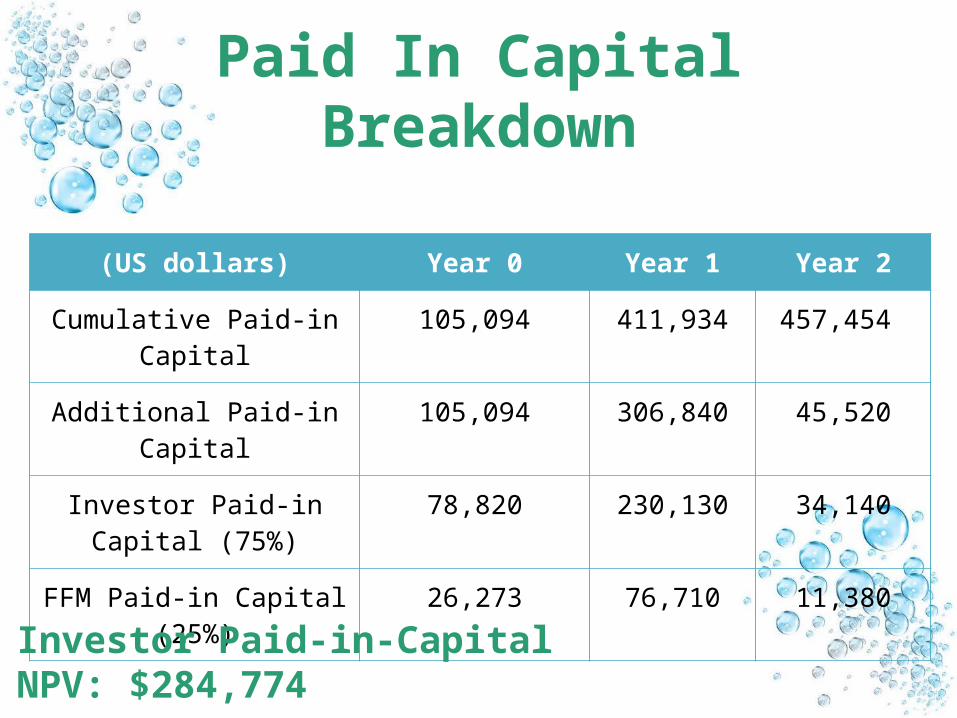
Paid In Capital Breakdown
(US dollars) Year 0 Year 1 Year 2
Cumulative Paid-in Capital
105,094 411,934 457,454
Additional Paid-in Capital
105,094 306,840 45,520
Investor Paid-in Capital (75%)
78,820 230,130 34,140
FFM Paid-in Capital (25%)
26,273 76,710 11,380
Investor Paid-in-Capital NPV: $284,774
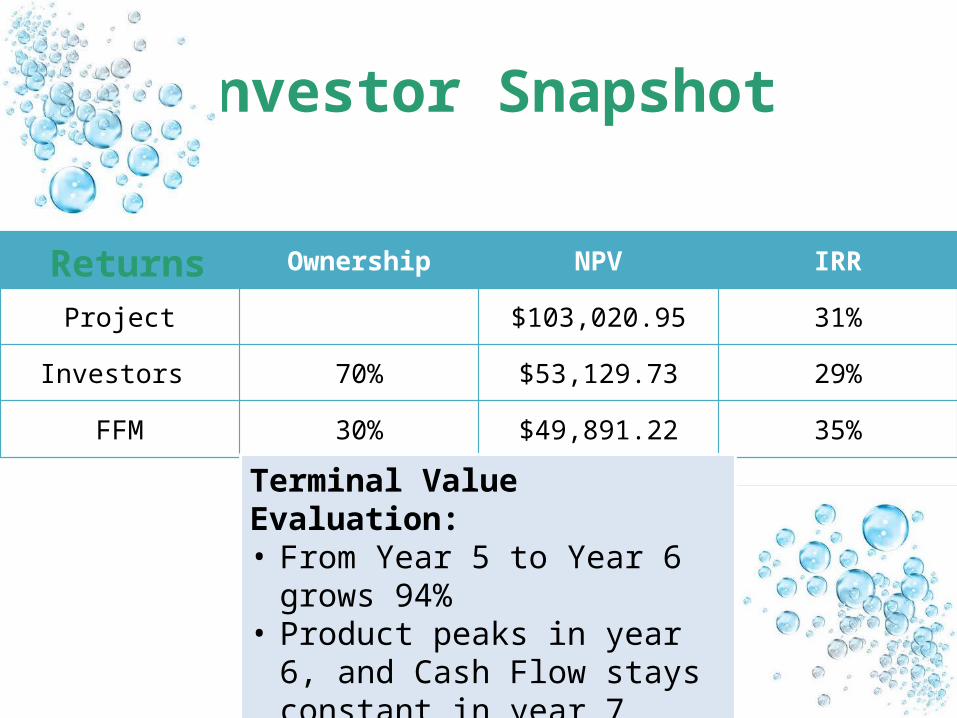
Investor Snapshot
Ownership NPV IRR
Project $103,020.95 31%
Investors 70% $53,129.73 29%
FFM 30% $49,891.22 35%
Returns
Terminal Value Evaluation:• From Year 5 to Year 6 grows
94%• Product peaks in year 6,
and Cash Flow stays constant in year 7
• Declining at a 20% rate perpetuity
Welcome to the Family!
Thank You for Your Time
Back Up Slides
oMarketingoOperations ManagementoInformation SystemoFinance

Marketing Back Up Slides
o Segmentation Treeo Profile of the Retail Enviro
nmento SWOT o Sales Reps vs. Sales Forceo Segment 1 Demand Charto Segment 2 Demand Chart
o Magazineso Adso Base Caseo Optimistic Caseo Pessimistic Case
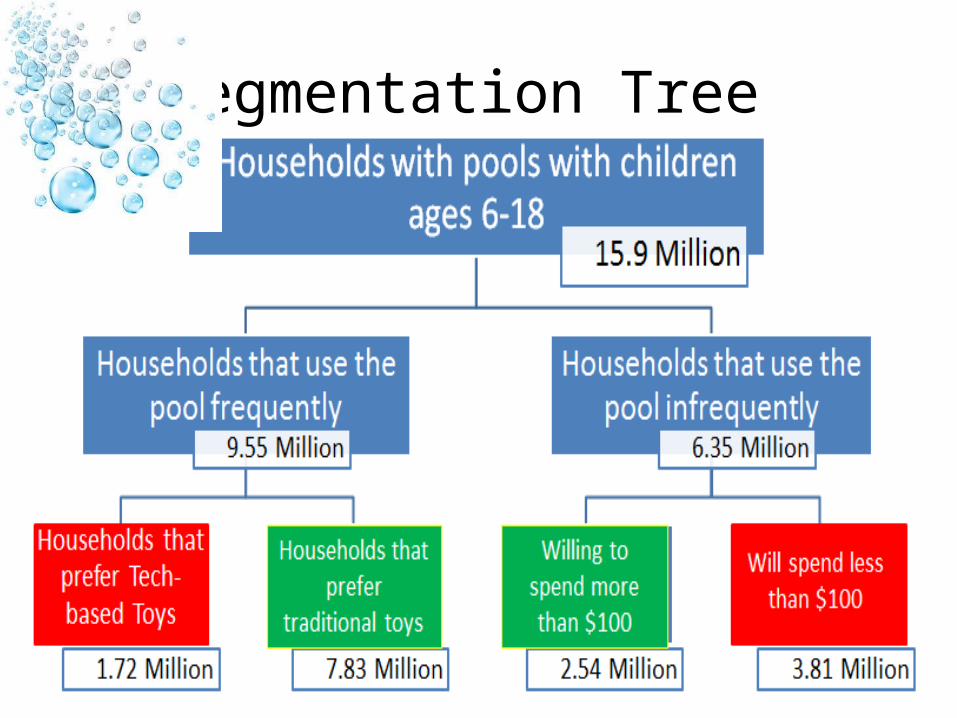
Segmentation Tree
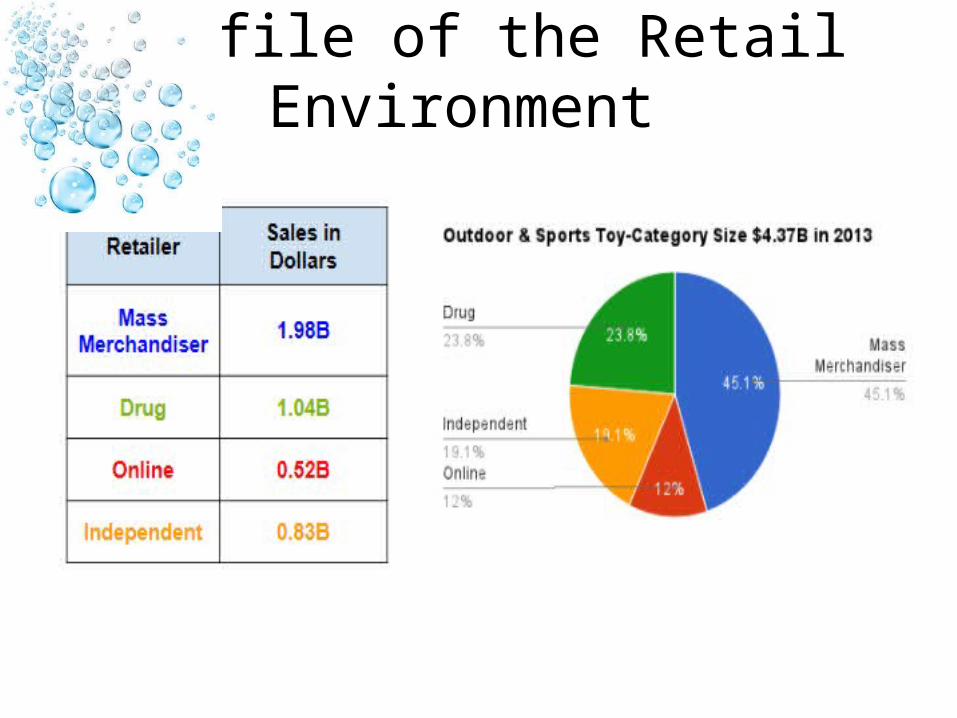
Profile of the Retail Environment

SWOT Analysis
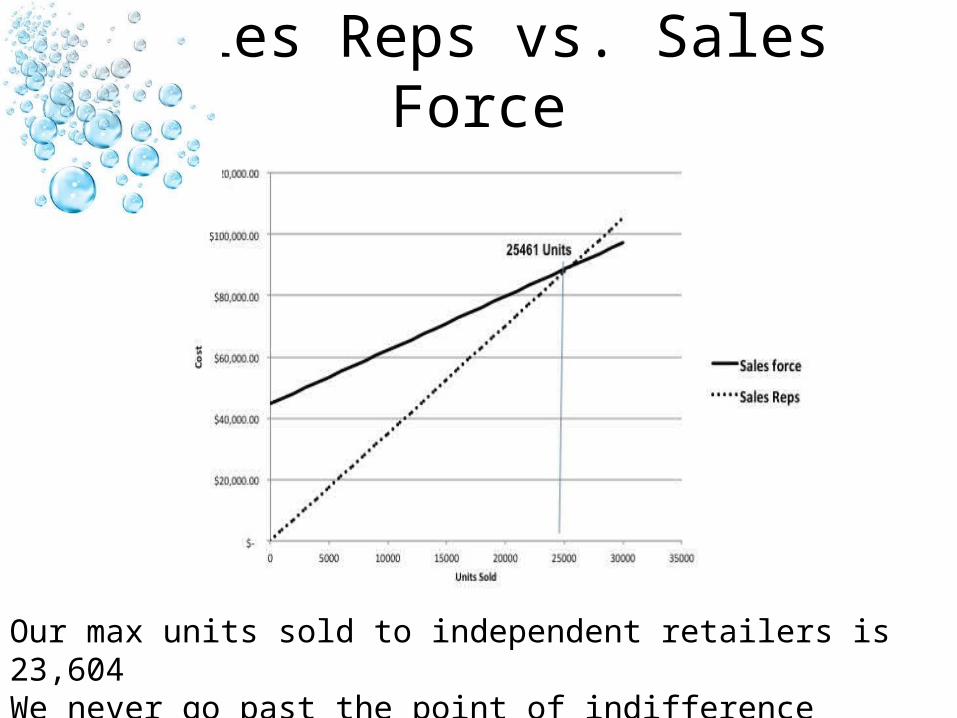
Sales Reps vs. Sales Force
Our max units sold to independent retailers is 23,604We never go past the point of indifference

Great-White Guppies: Demand Chart
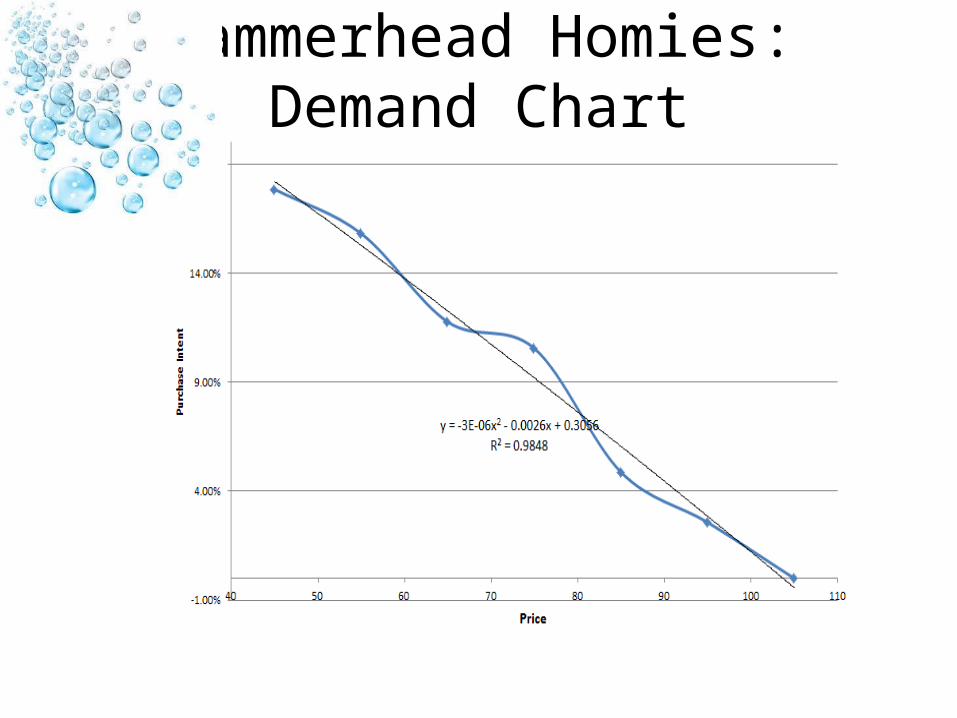
Hammerhead Homies: Demand Chart

Magazine
● Regional● Circulation Size: 2 million ● 65% in our target market● CPM
o Years 1-2: $36.07o Years 3-5: $53.10

Magazine
● National● Circulation Size: 1.1 million ● 70% in our target market● CPM○ Years 1-5: $197.29
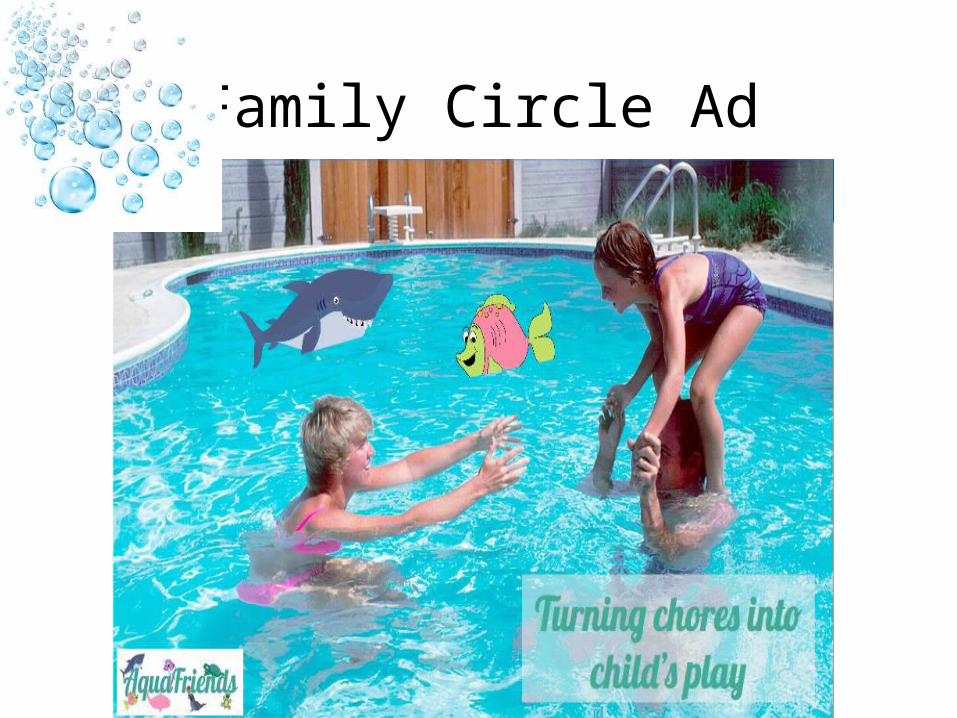
Family Circle Ad

National Geographic Ad

CSR Ad

Guerilla Marketing
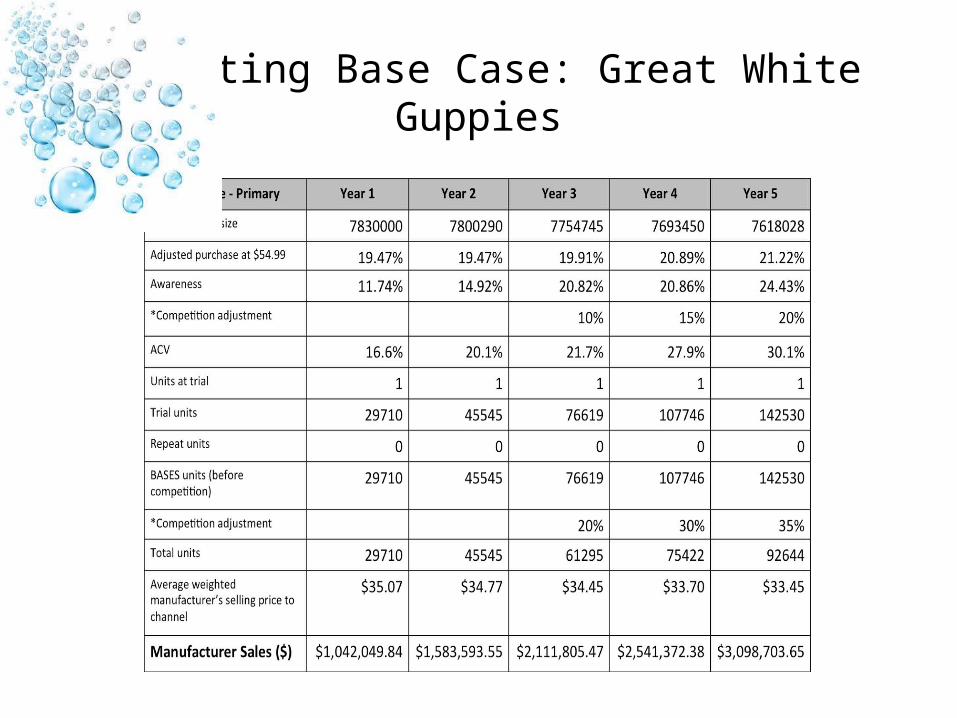
Marketing Base Case: Great White Guppies

Marketing Base Case: Hammerhead Homies
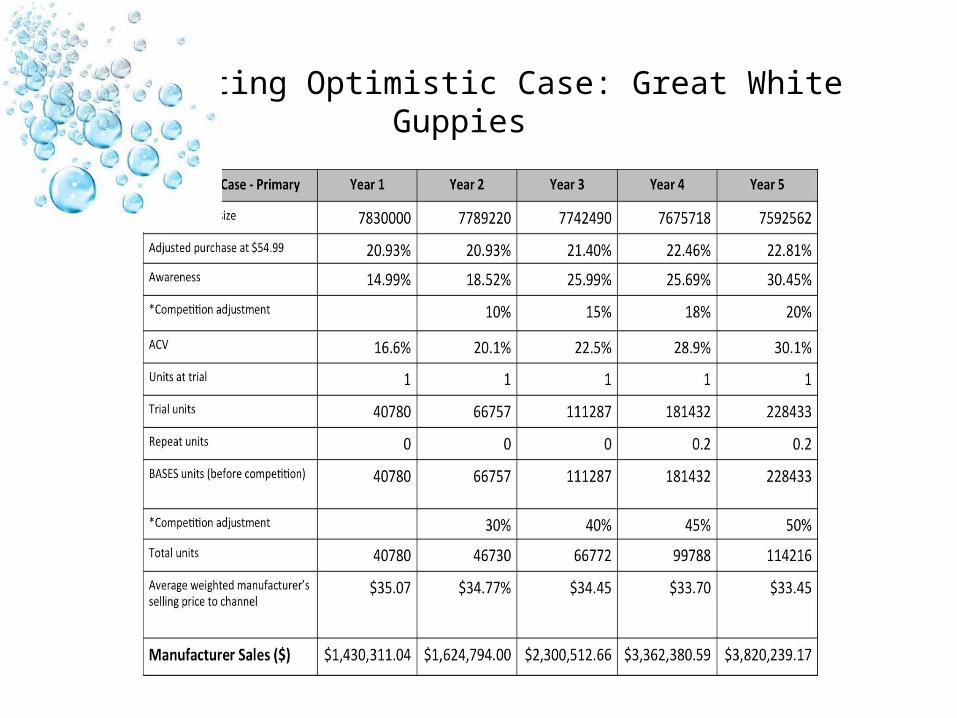
Marketing Optimistic Case: Great White Guppies

Marketing Optimistic Case: Hammerhead Homies
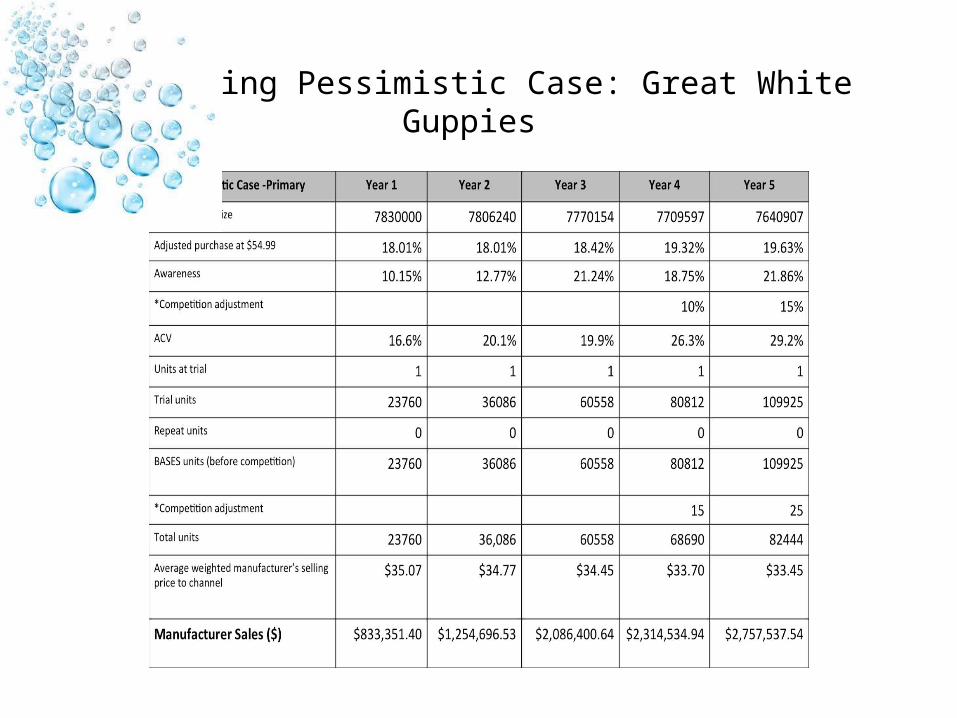
Marketing Pessimistic Case: Great White Guppies
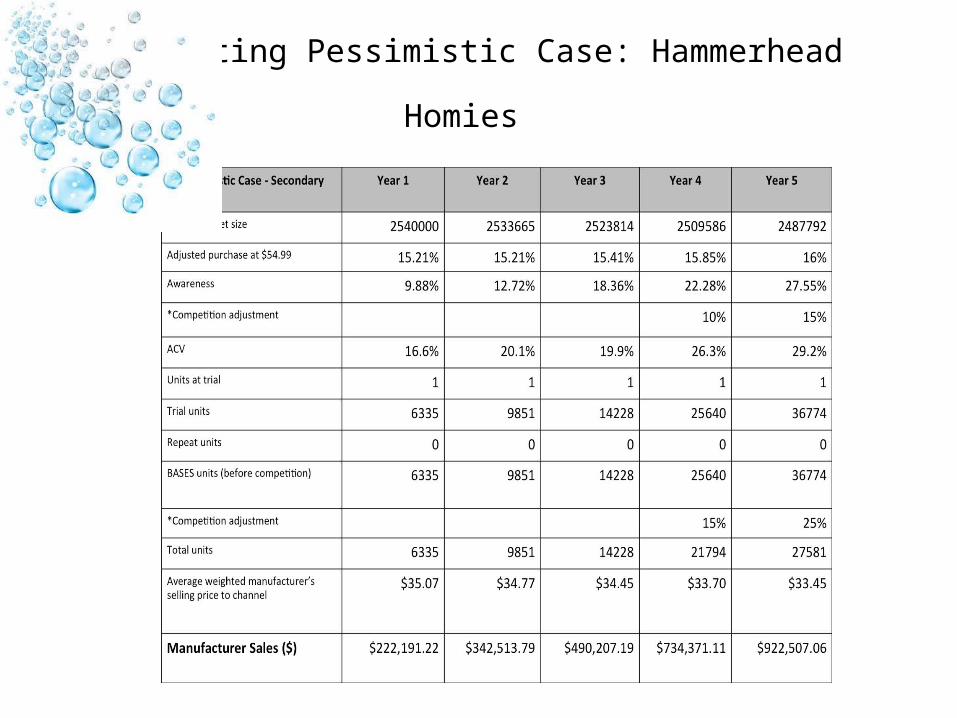
Marketing Pessimistic Case: Hammerhead Homies

Operations Back Up Slides
o House of Qualitieso Original Design vs Final
Designo BOMo Supplier Listo Make or Buy Decisiono Facility Location: Factor
Ratingo Facility Location: Center
of Gravity
o Fresno Facility Informationo Facility Layouto Five Year Aggregate Pl
anningo Process Designo Capacityo Five Year Organization
al Structureo Units Sold Comparison
for 3 Scenarios
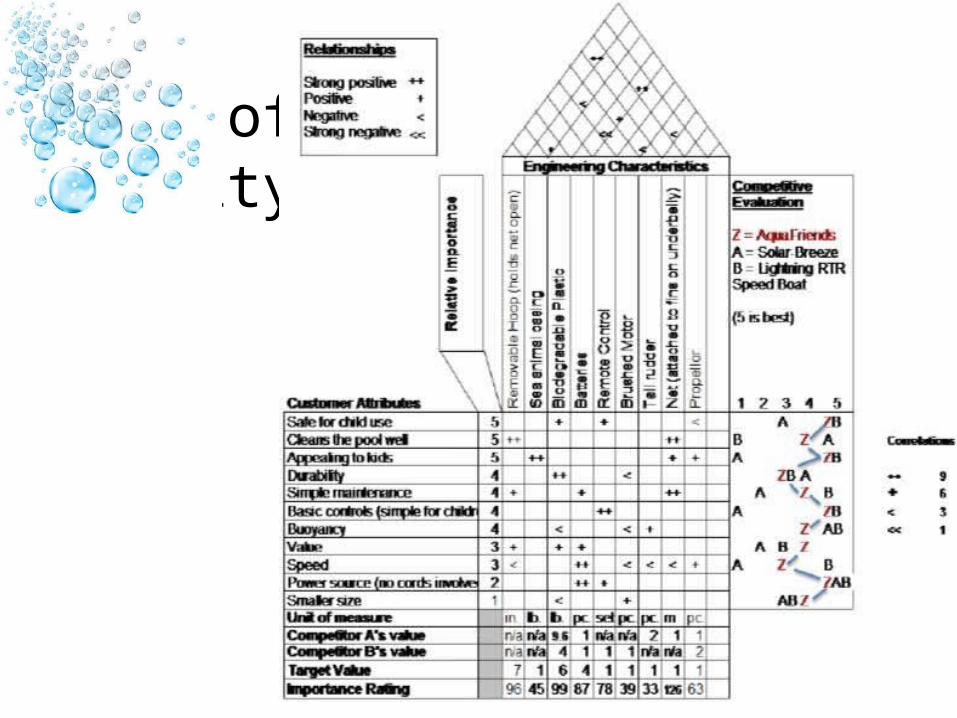
House of Quality

Original Design v. Final Design
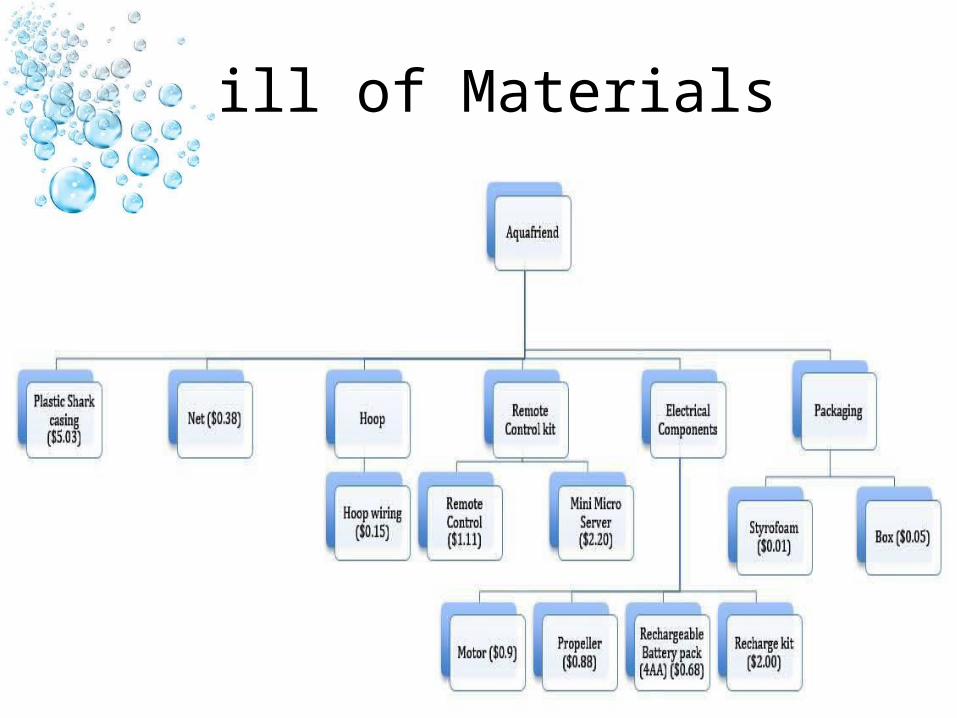
Bill of Materials

Supplier List
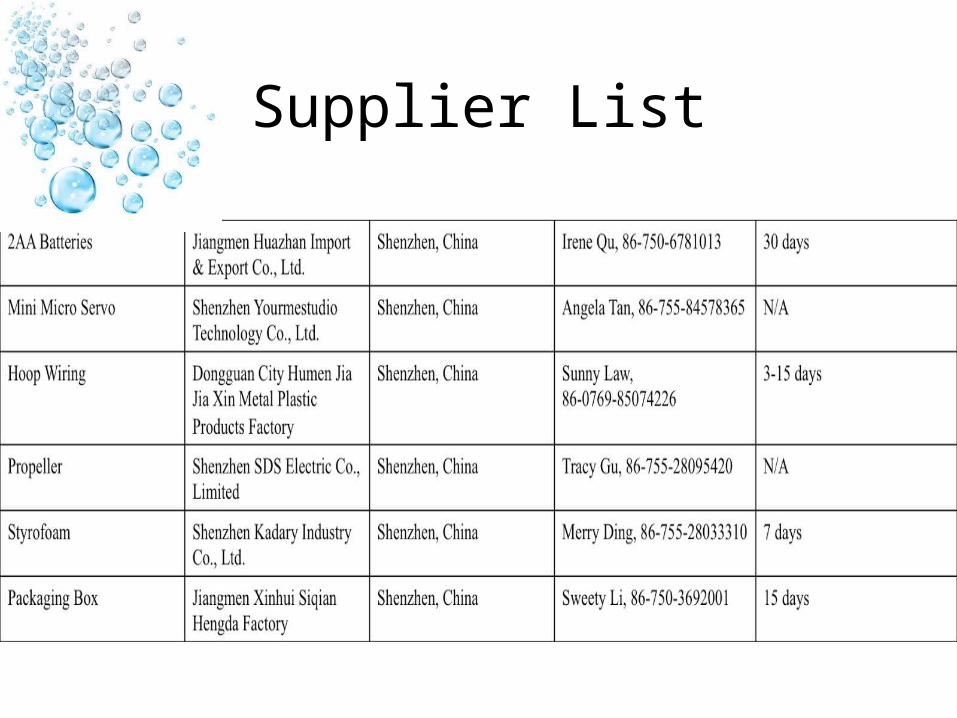
Supplier List
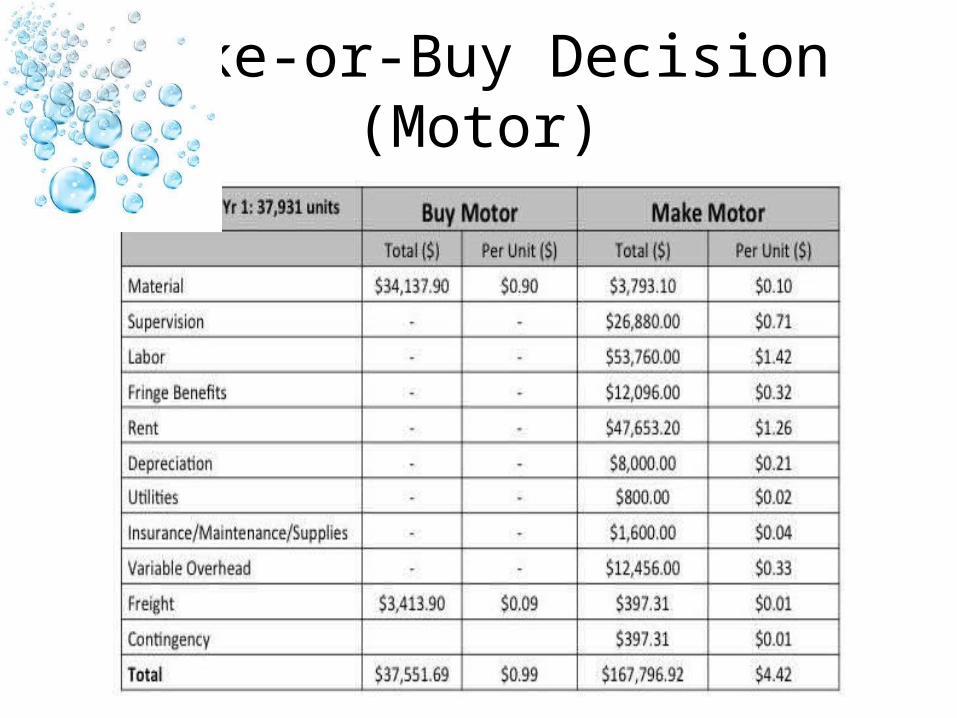
Make-or-Buy Decision (Motor)

Make-or-Buy Decision (Casing)
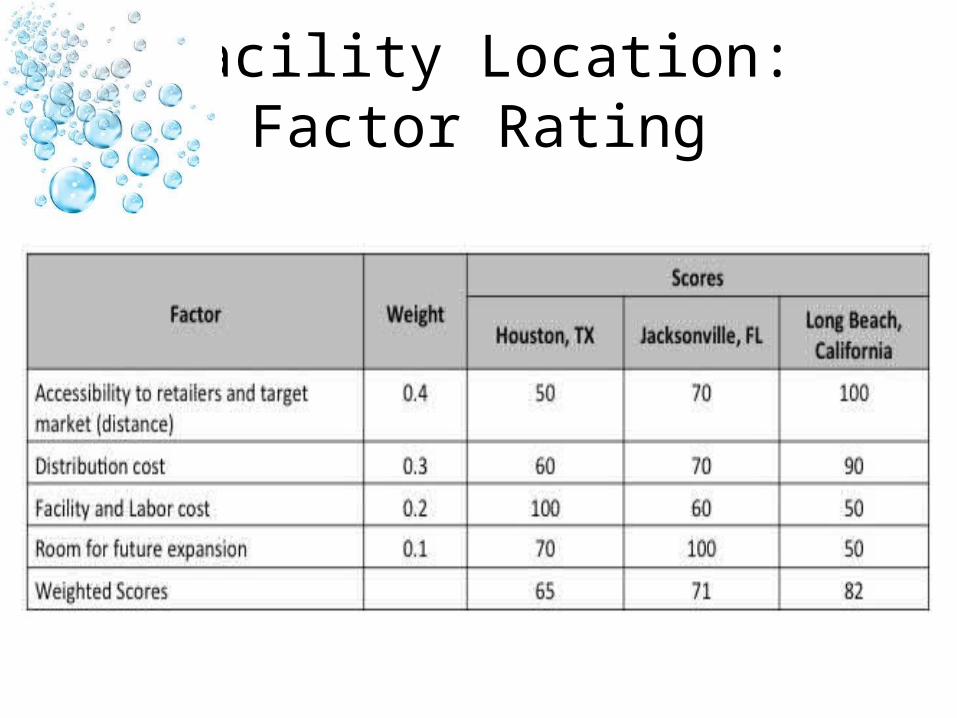
Facility Location: Factor Rating

Average X = 17/5 = 3.4Average Y = 19.5 = 3.9
Facility Location: Center of Gravity
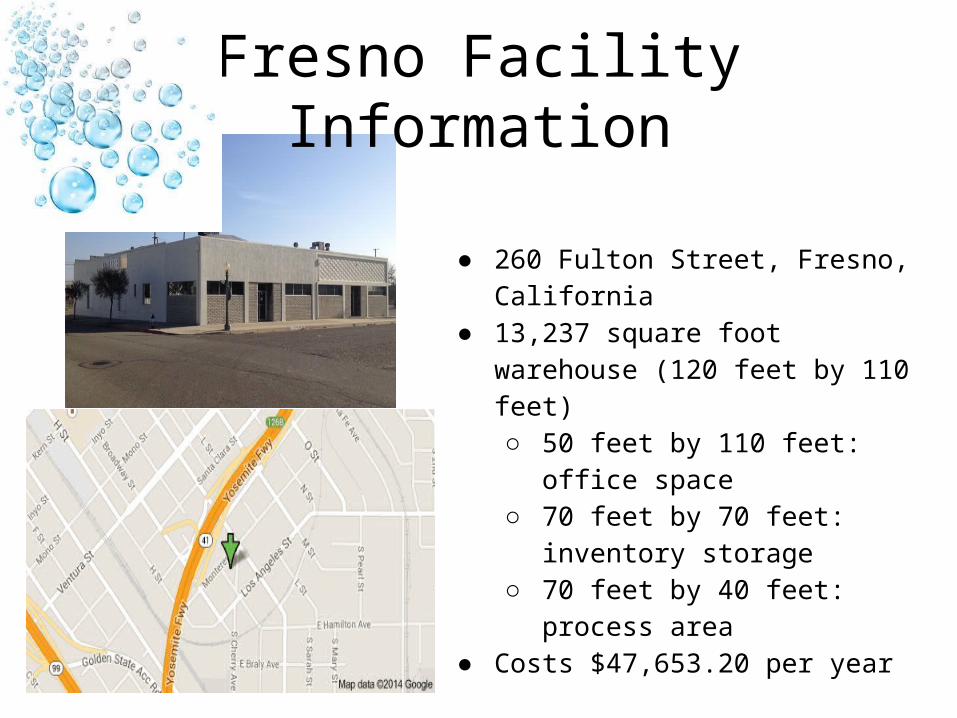
● 260 Fulton Street, Fresno, California● 13,237 square foot warehouse (120 feet
by 110 feet)○ 50 feet by 110 feet: office space○ 70 feet by 70 feet: inventory
storage○ 70 feet by 40 feet: process area
● Costs $47,653.20 per year
Fresno Facility Information
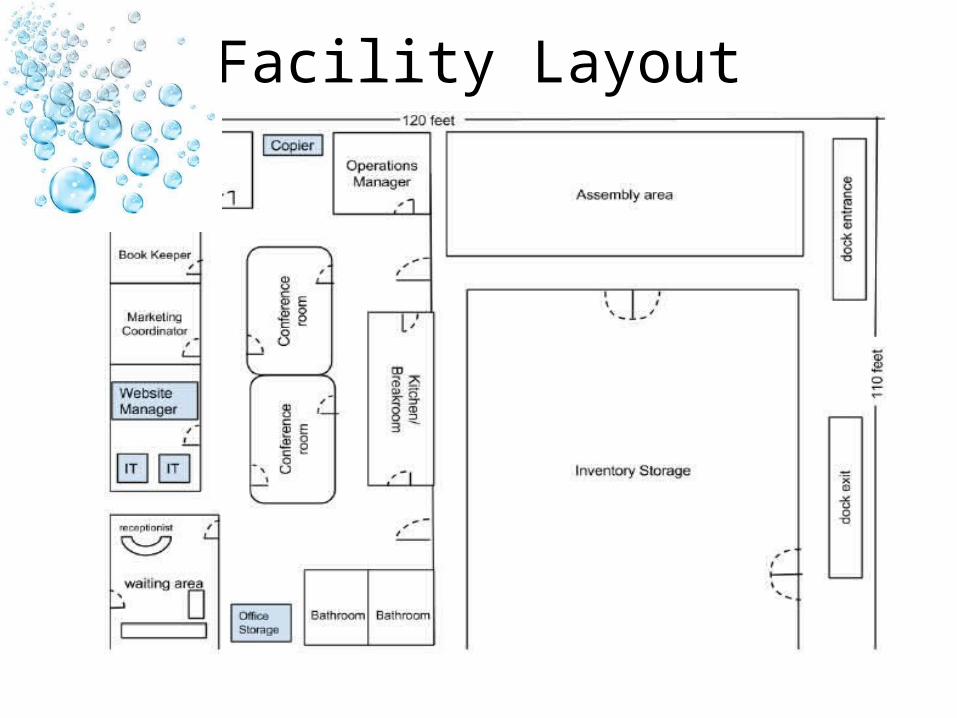
Facility Layout

Aggregate Planning Year 1

Aggregate Planning Year 2

Aggregate Planning Year 3
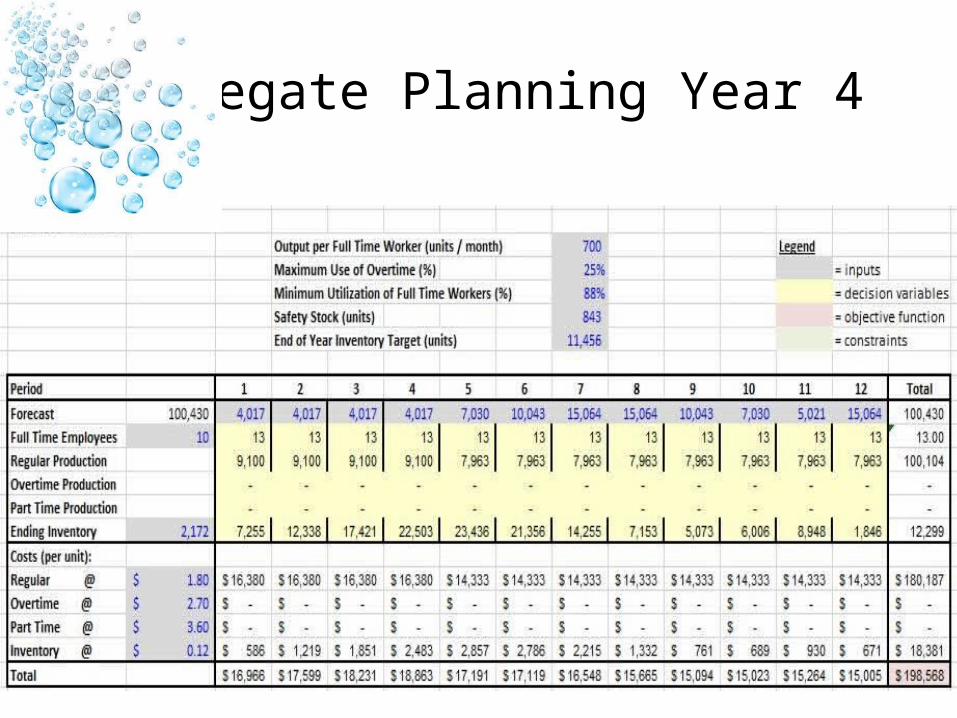
Aggregate Planning Year 4
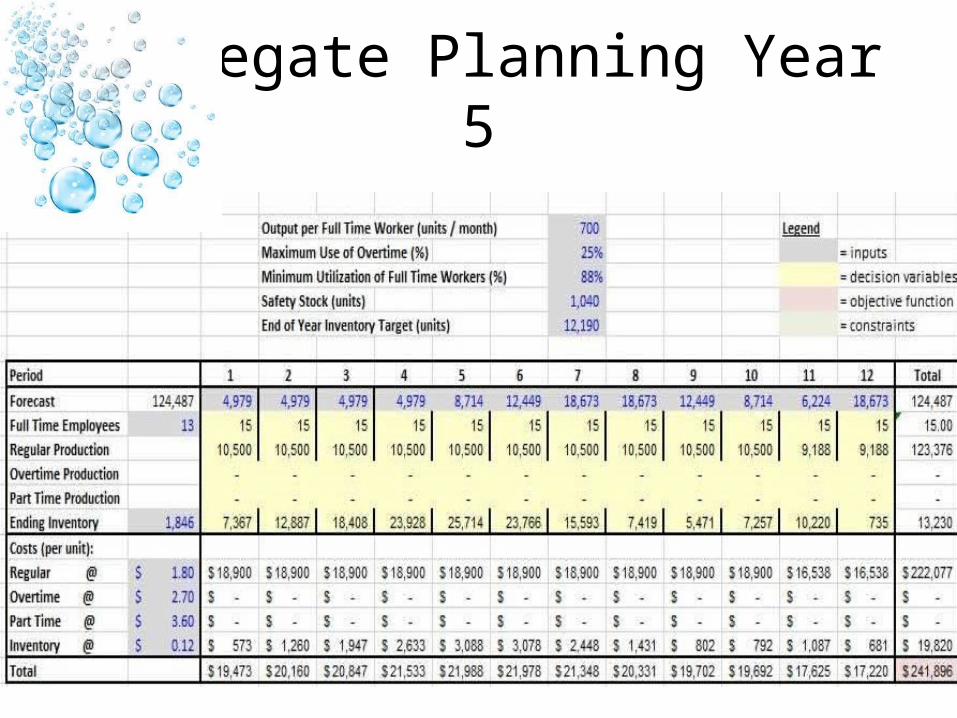
Aggregate Planning Year 5

Process Design
Efficiency
Capacity
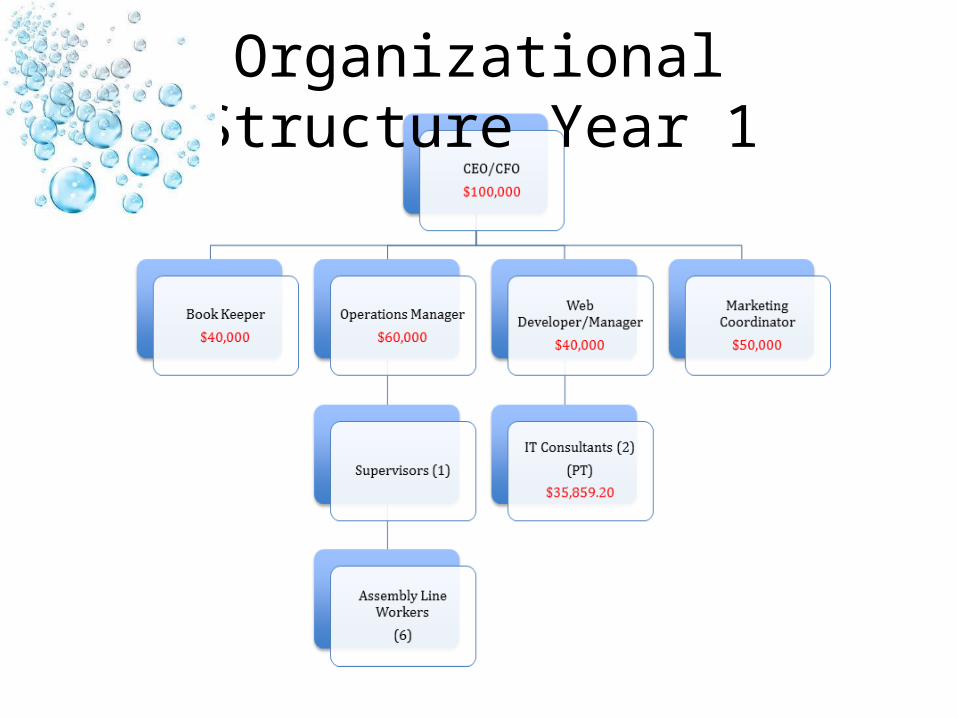
Organizational Structure Year 1

Organizational Structure Year 2
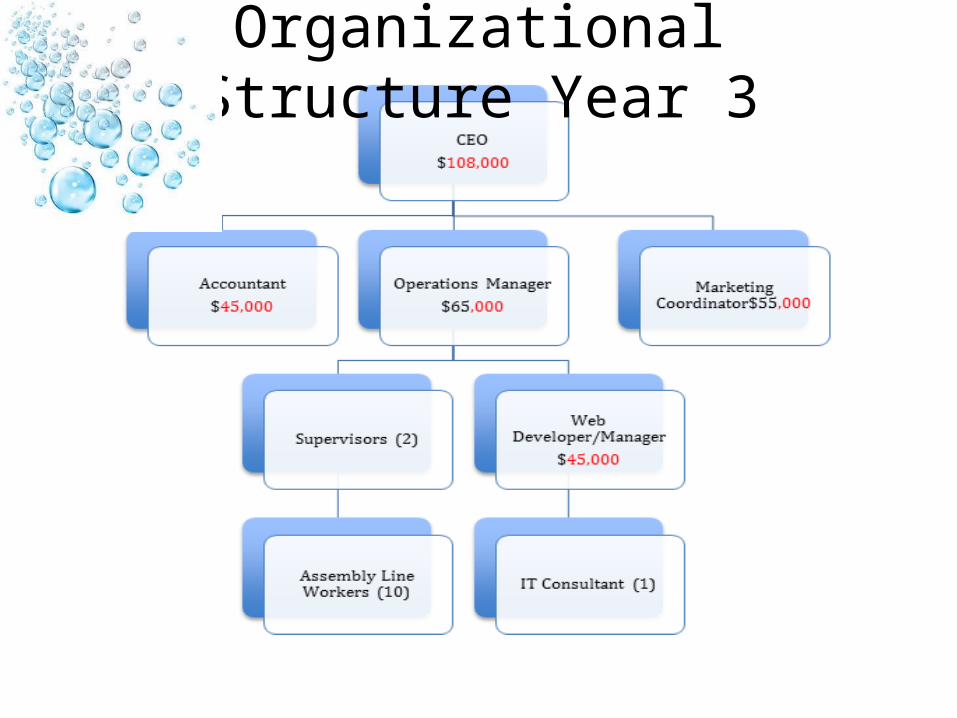
Organizational Structure Year 3
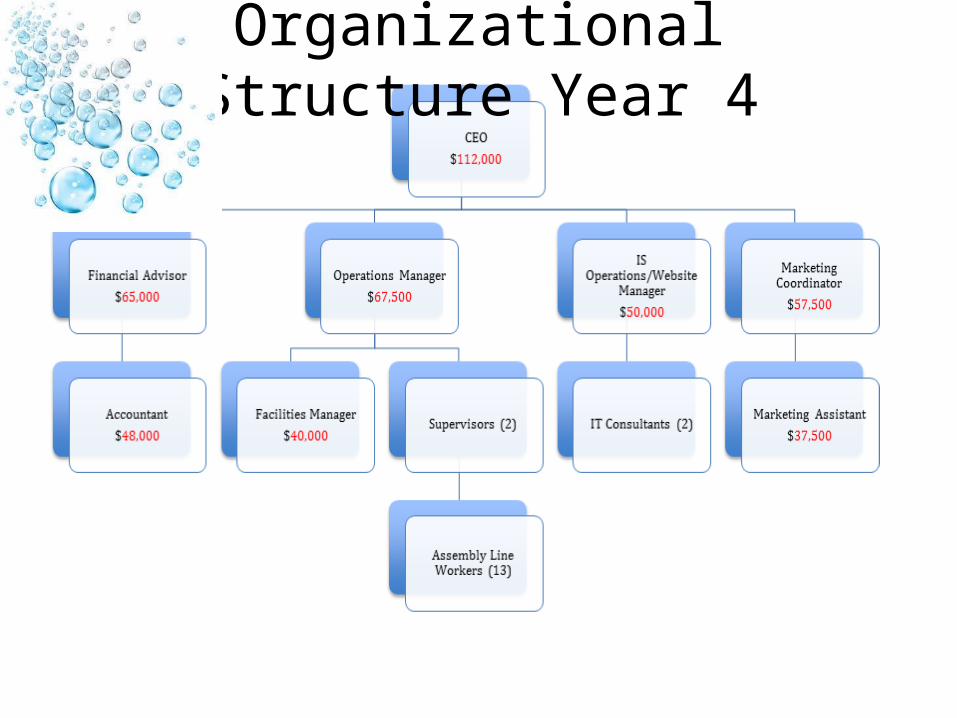
Organizational Structure Year 4
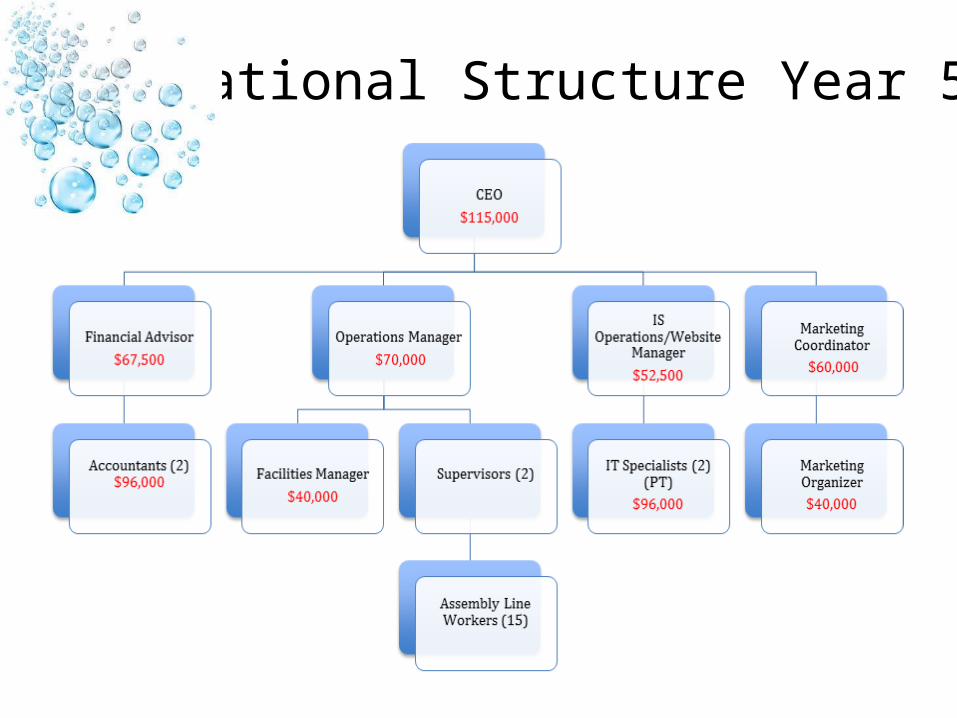
Organizational Structure Year 5
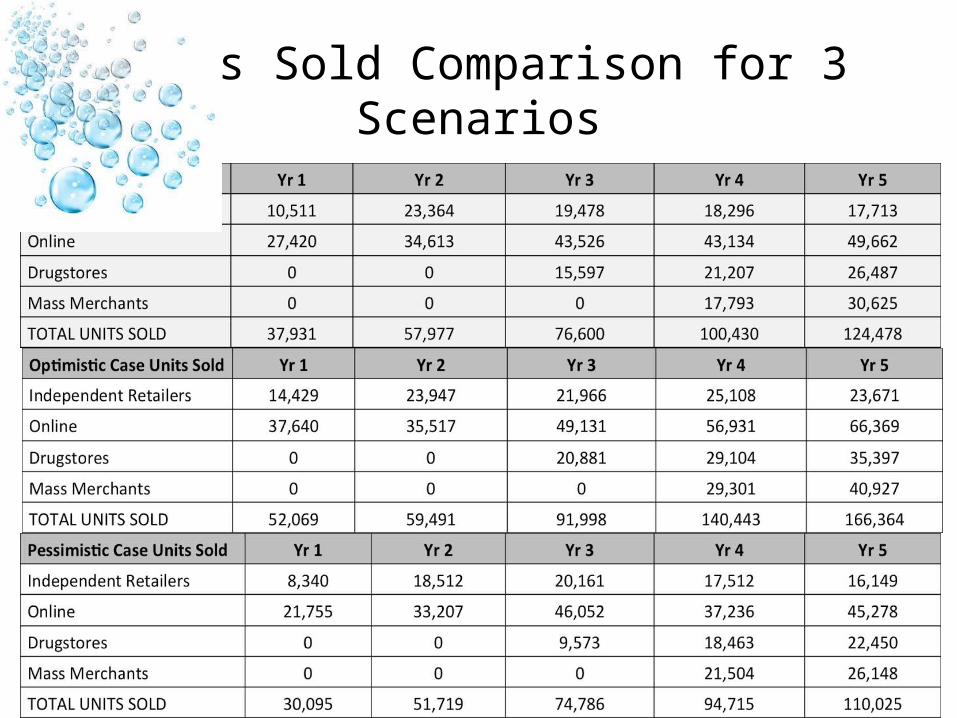
Units Sold Comparison for 3 Scenarios

IS Back Up Slides
o Year 1-5 Investments

Category Cost
Hardware $2,332
Applications $2,135.1
Data Management and Storage $12,000
IT Security $453
Networking & Telecommunications $7,284.87
Website Development $66,570
Consulting $17,930
Total $108,704.97
Year 1 Investment

Category Cost
Operating System $0
IT Security $453.26
Data Management and Storage $12,000
Networking & Telecommunications $1,359.66
Website Development $40,010
Consulting $17,929.6
Total $71,752.52
Year 2 Investment

Category Cost
Hardware $3,169
Applications $1,167.6
Data Management and Storage $12,000
IT Security $453.26
Networking & Telecommunications $2,102.9
Website Development $50,010
Consulting $17,929.3
Total $86,832.36
Year 3 Investment

Category Cost
Data Management and Storage $12,000
IT Security $453.26
Networking & Telecommunications $1,359.66
Website Development $50,010
Consulting $35,859.2
Total $99,682.12
Year 4 Investment

Category Cost
Data Management and Storage $12,000
IT Security $453.26
Networking & Telecommunications $1,359.66
Website Development $60,010
Consulting $35,859.2
Total $109,682.12
Year 5 Investment
Finance Back Up Slides
o Income Statemento Cash Flow Projection o COGS and SG&A Compa
rableo Balance Sheet Ratioso Breakeven Analysiso Sensitivity Analysiso Project Weighted NPVo Investor Weighted NPV
o Scenario Analysiso Pessimistic Analysiso Optimistic Analysiso Product Life Cycle & Ter
minal Value
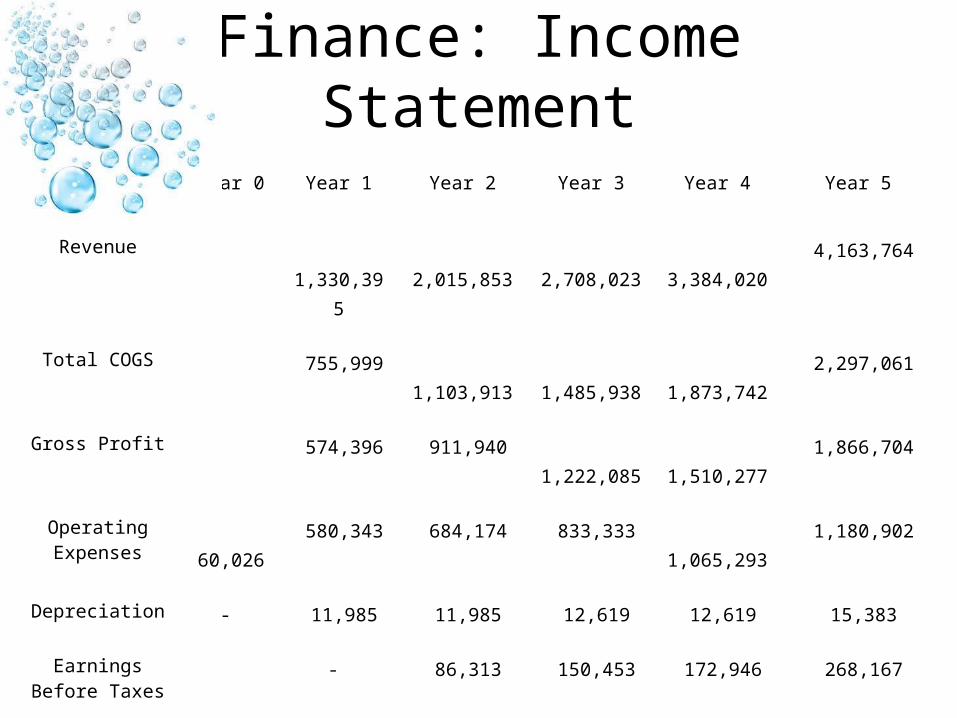
Finance: Income StatementYear 0 Year 1 Year 2 Year 3 Year 4 Year 5
Revenue 1,330,395 2,015,853 2,708,023 3,384,020 4,163,764
Total COGS 755,999 1,103,913 1,485,938 1,873,742 2,297,061
Gross Profit 574,396 911,940 1,222,085 1,510,277 1,866,704
Operating Expenses 60,026 580,343 684,174 833,333 1,065,293 1,180,902
Depreciation - 11,985 11,985 12,619 12,619 15,383
Earnings Before Taxes
- 86,313 150,453 172,946 268,167
Taxes - 86,313 150,453 172,946 268,167
Net Income (60,026) (17,933) 129,469 225,680 259,419 402,251

Finance: Cash Flow Projection Table
Year 0 Year 1 Year 2 Year 3 Year 4 Year 5
Cash Flow
-$105,094
-$350,152
-$42,055
$31,963
$84,927
$205,944
Growth
- -2.33% 0.88% 1.76% 1.66% 1.42%
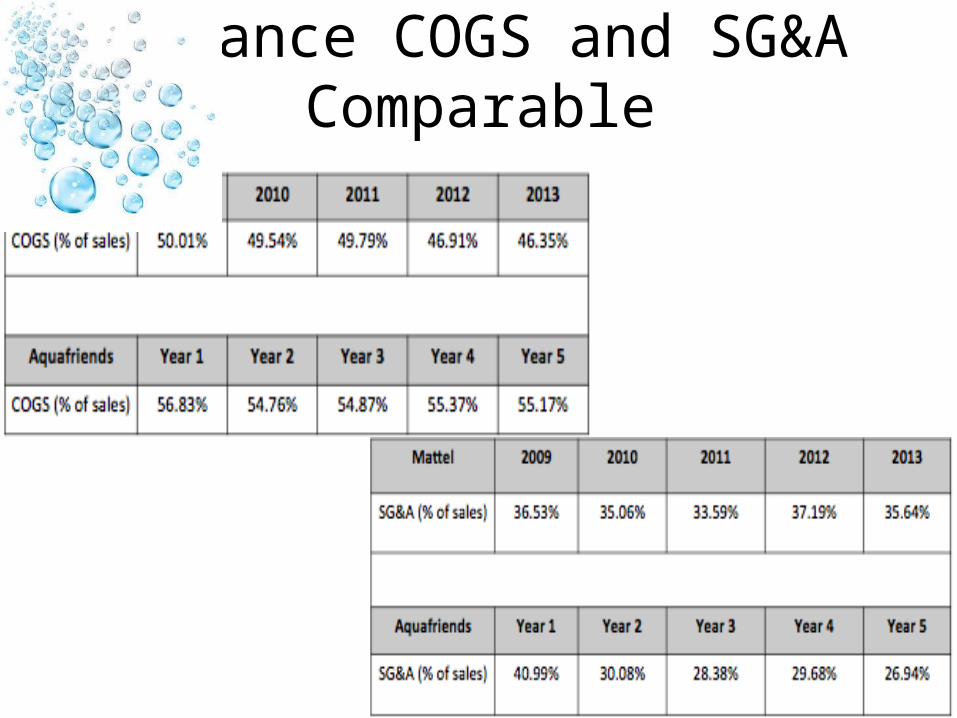
Finance COGS and SG&A Comparable
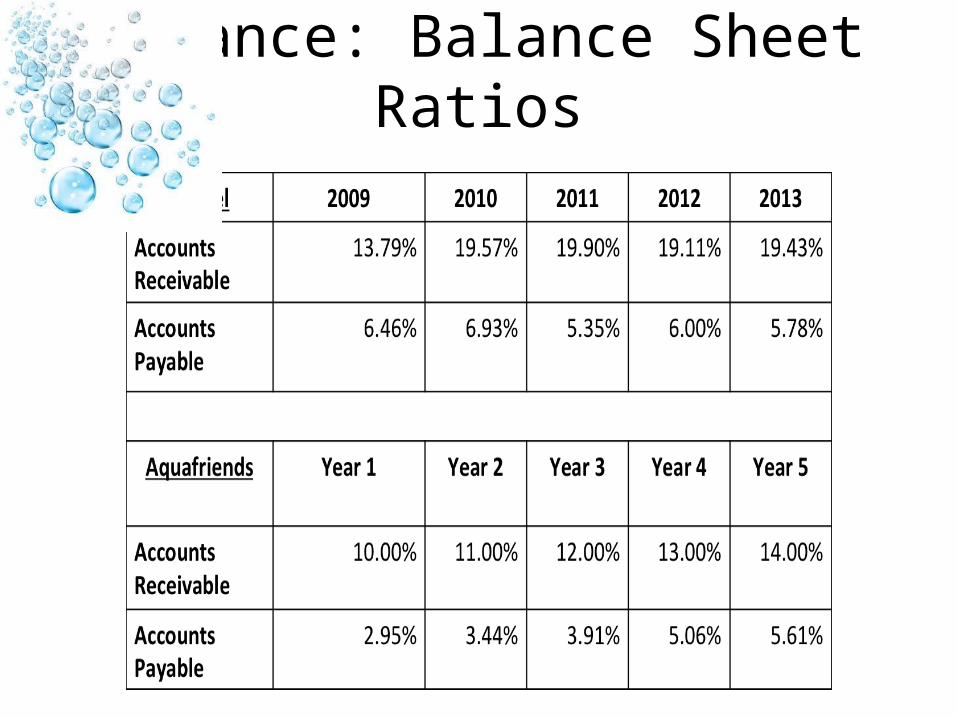
Finance: Balance Sheet Ratios
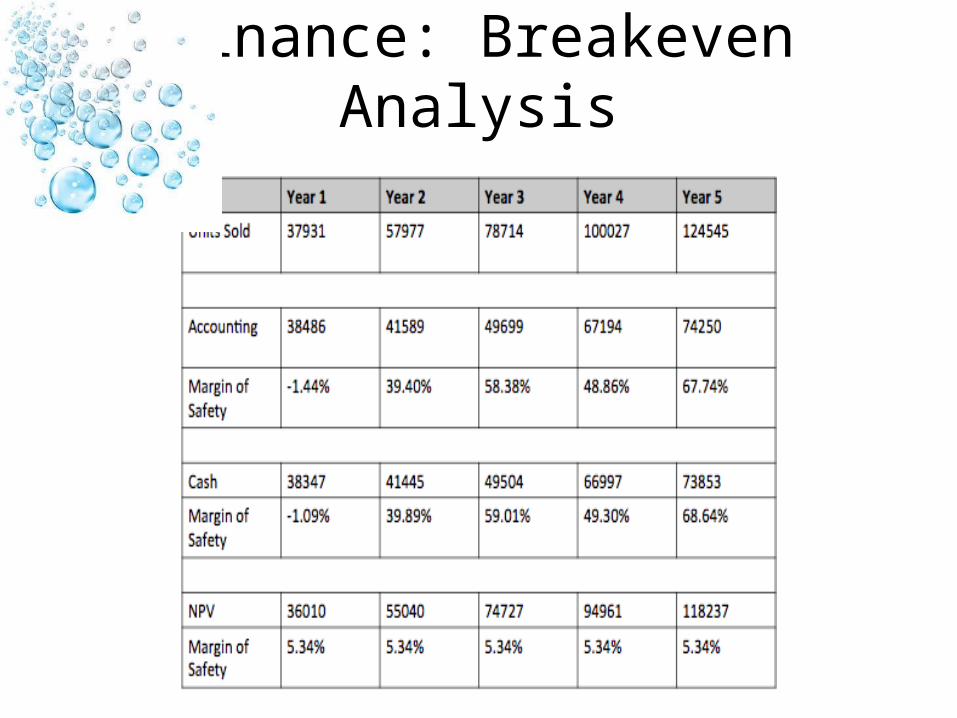
Finance: Breakeven Analysis

Finance: Sensitivity Analysis
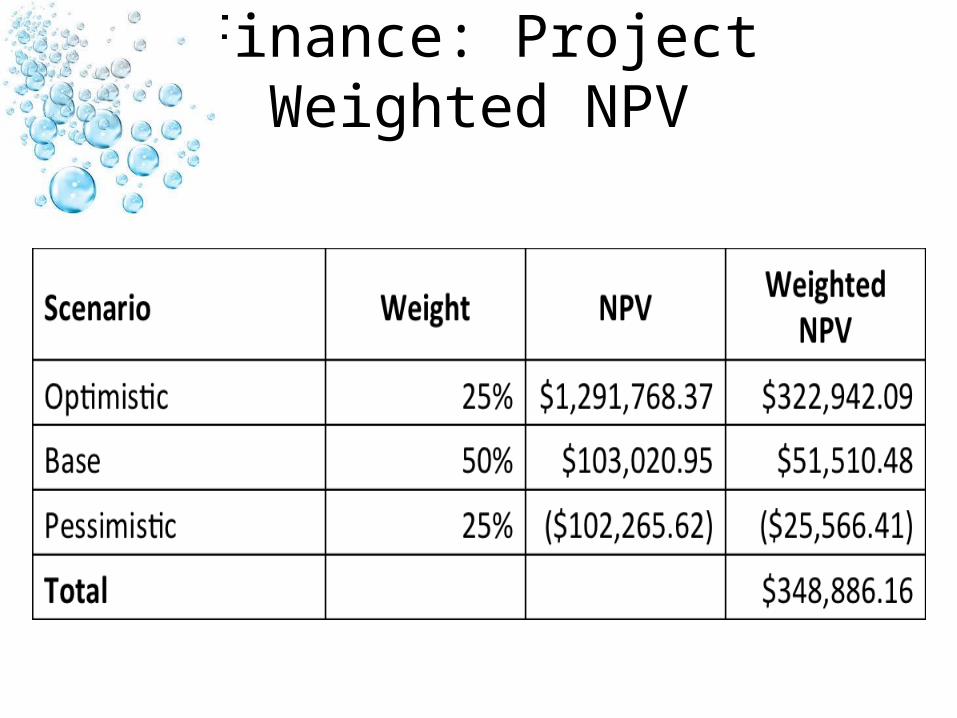
Finance: Project Weighted NPV
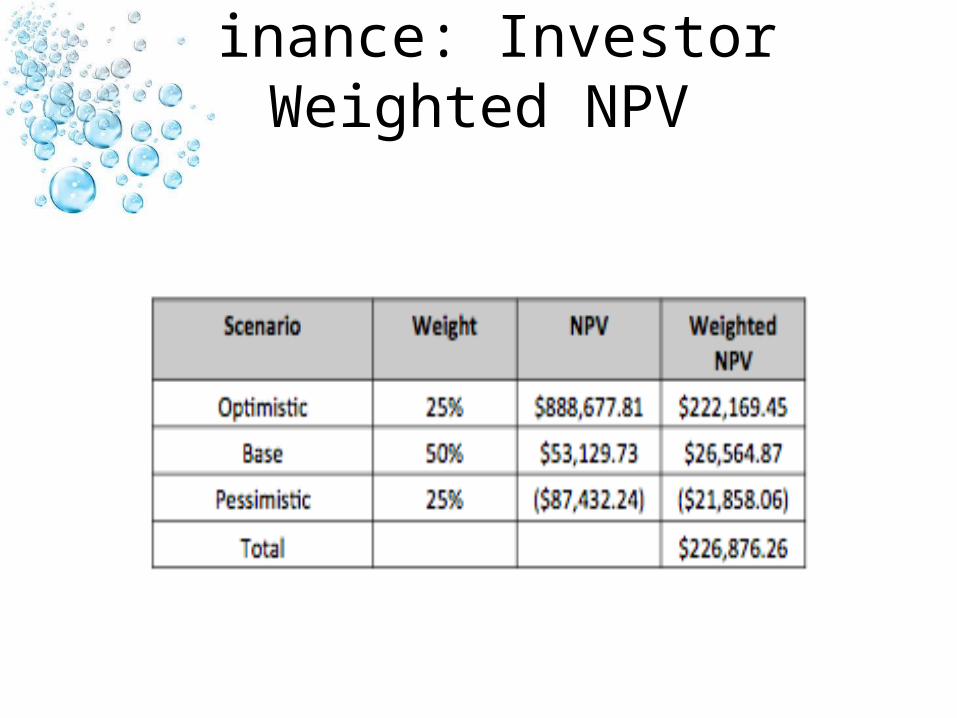
Finance: Investor Weighted NPV
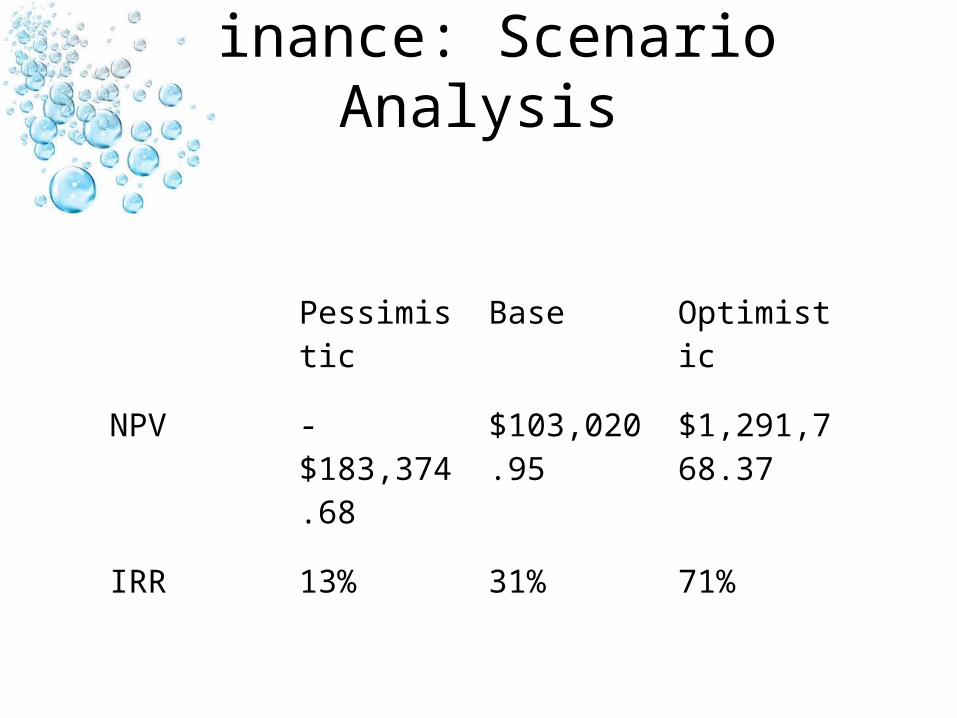
Finance: Scenario Analysis
Pessimistic Base Optimistic
NPV -$183,374.68
$103,020.95 $1,291,768.37
IRR 13% 31% 71%

Finance: Scenario Analysis Pessimistic
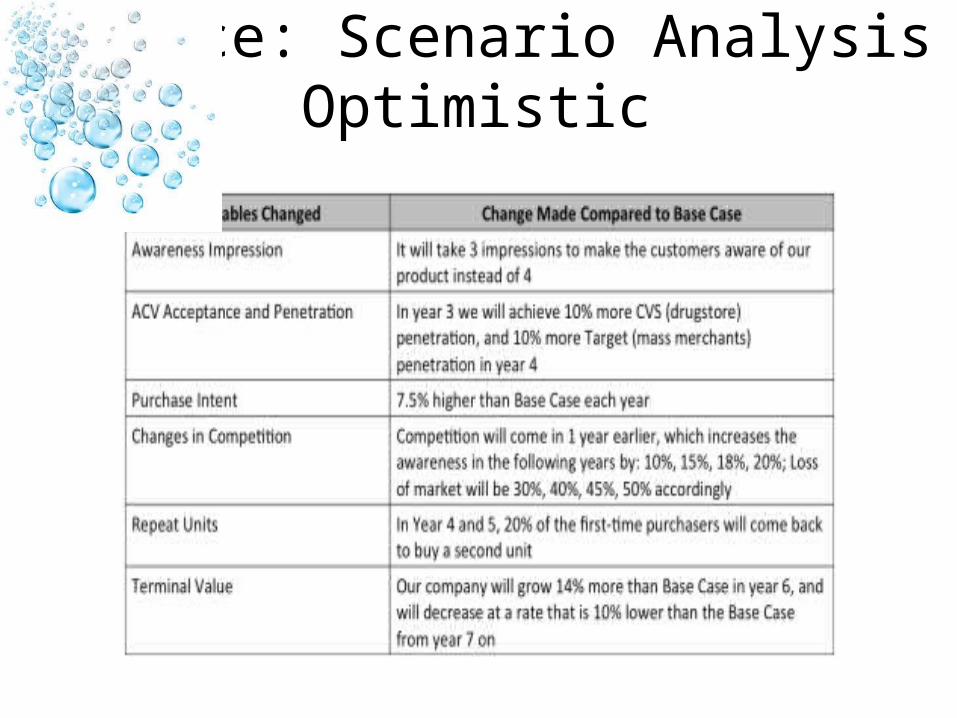
Finance: Scenario Analysis Optimistic
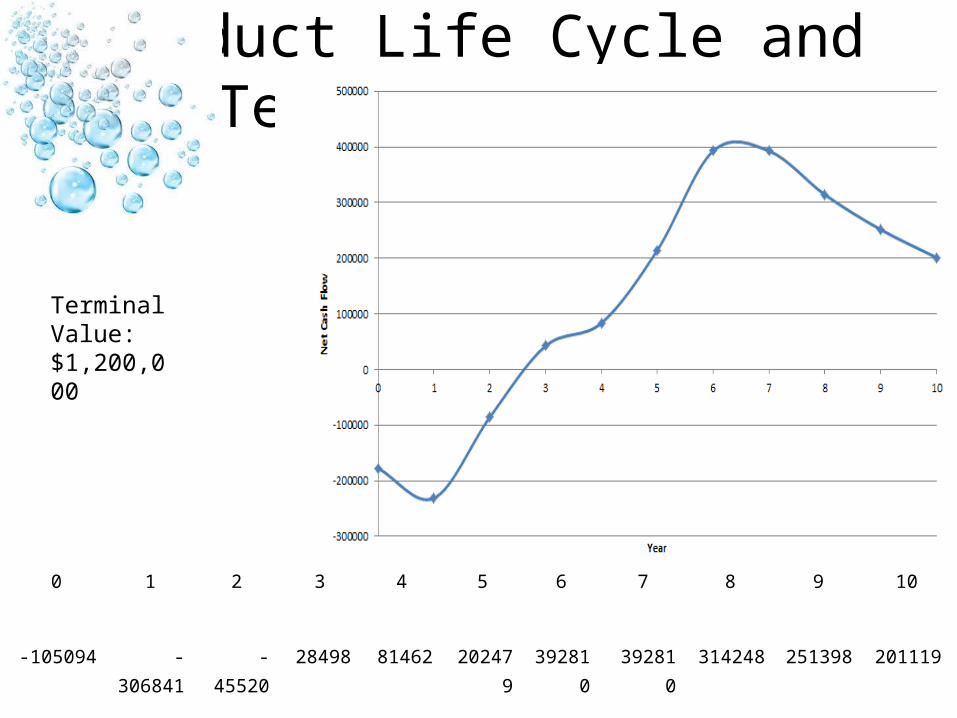
Product Life Cycle and Terminal Value
0 1 2 3 4 5 6 7 8 9 10
-105094 -306841 -45520 28498 81462 202479 392810 392810 314248 251398 201119
Terminal Value:$1,200,000