Embed Size (px)
Citation preview

AquacultureOverview
LaDon Swann
Mississippi-Alabama Sea Grant Consortium
Auburn University

Definition “Aquaculture is the farming of aquatic
organisms, including fish, molluscs, crustaceans and aquatic plants. Farming implies some form of intervention in the rearing process to enhance production, such as regular stocking, feeding, protection from predators, etc. Farming also implies individual or corporate ownership of the stock being cultivated.”
SOURCE: FAO FISHERIES CIRCULAR NO. 815 REVISION 8, 1996

Aquaculture’s Justification

Advantages of Aquaculture• Aquaculturists can improve both the fish and the
production methods• Commercial fishers can do little about the fish
and must concentrate on improving fishing gear and methods
• Aquaculture is an important source of employment
• The bulk of aquaculture production is composed of a small number of species– In 2000, 29 species accounted for 78 percent of
production. – Other species from among the several thousand that are
exploited by capture fisheries could eventually be farmed
• The appropriate legal framework for most modern aquaculture technologies is known

2003 Foreign Trade Deficit
• Imports – $11.1 billion (edible)– 4.9 billion pounds
• 40% from aquaculture
• Exports– $3.3 billion (edible)– 2.4 billion pounds
• Deficit• $7.8 billion• 2.5 billion pounds

World Production

World Production Trends
• According to FAO statistics aquaculture's contribution to global supplies of fish, crustaceans and molluscs– Increased from 3.9 percent of total production by weight
in 1970 to 27.3 percent in 2000. • Aquaculture is growing more rapidly than all
other animal food producing sectors. – Worldwide, the sector has increased at an average
compounded rate of 9.2 percent per year since 1970 – Only 1.4 percent increase for capture fisheries and – 2.8 percent for terrestrial farmed meat production
systems

World Aquaculture Production• In 2000 World aquaculture production of fish,
crustaceans and molluscs– 35.6 million tons in 2000 - 6.5% increase since 1999– US$ 50.9 billion, representing - 5.6% increase since 1999
• China has the largest aquaculture production – 24.6 million ton (69% of world production)– US$ 24.1 billion (47% of world value due to value of carps)
• If you exclude China, then World Aquaculture production of fish, crustaceans and molluscus – 11.0 million tons - 3.3% increase since 1999– US$ 26.7 million - 4.7% increase since 1999
• In 2000 aquaculture provided 27.3% of global fisheries – Excluding China - 12.4% of global fisheries production.
• Indications that Chinese production statistics have been over-estimated since the 1990s

86 8792 92 93 94
8894 95
92
1518
2124
27 29 31 33 3538
0102030405060708090
100
1992 1993 1994 1995 1996 1997 1998 1999 2000 2001
Mil
lio
n M
etri
c T
on
s
SOURCE: USDC/NOAA/NMFS CURRENT FISHERIES STATISTICS 9600, 2002
World Production
Commercial Catch
Aquaculture

World Aquaculture Production by Water Types in 2000

World Production by Species Groups and Environment in 2000

Aquaculture Production in Marine and Inland Waters

World Production Compared to Chinese Production

World Aquaculture Production by Major Species Groups in 2000

Trend of World Production by Major Species Groups

Consumption

World Per Capita Consumption
• The total food fish supply for the world excluding China has been growing at a rate of about 2.4% per annum since 1961– 25.2 million tons in 1961 to 62.9 million tons in 2000
• The population has been expanding at 1.8% per annum
• Since the late 1980s population growth for the world excluding China has occasionally outpaced total food fish supply– Resulting in a decrease in per capita fish supply from
14.6 kg per capita in 1987 to 13.1 kg in 2000.• For China, the corresponding figures are
– 6.4% per annum increase for food fish supply – 1.7% for the population.

Aquaculture’s Contribution to Per Capita Consumption
• 2/3 of the total food fish supply is obtained from fishing in marine and inland waters
• The remaining 1/3 is derived aquaculture • The contribution of commercial capture fisheries
to per caput food supply has stabilized – 10-11 kg per capita in the period 1970-2000
• The contribution of aquaculture (except China) to per capita food availability– 0.5 kg in 1970 to 1.8 kg in 2000 – at an average rate of 4.5% per annum.
• In China the per capita supply from aquaculture has increased from 1 kg to 19 kg in the same period (average growth of 11% per year)

Per Capita Consumption
11.811.5
12.512.8
12.112.2
12.912.7
13.4
13.0
12.512.7
12.5
13.4
14.2
15.1
15.5
16.2
15.2
15.6
15.014.914.815.0
15.215.0
14.814.6
14.915.2
15.6
14.8
15.6
16.3
11
12
13
14
15
16
17
1970 1975 1980 1985 1990 1995 2000 2005
POUNDS

Per-Capita Consumption
Species Pounds Per-Capita 2003 1992
Shrimp 4.0 2.50Tuna 3.4 3.50Salmon 2.219 0.87Pollock 1.706 1.23Catfish 1.137 0.91Cod 0.644 1.08Crabs 0.609 0.33Tilapia 0.541Clams 0.525 0.52Flatfish 0.323 0.51Scallops 0.27
15.104 11.72
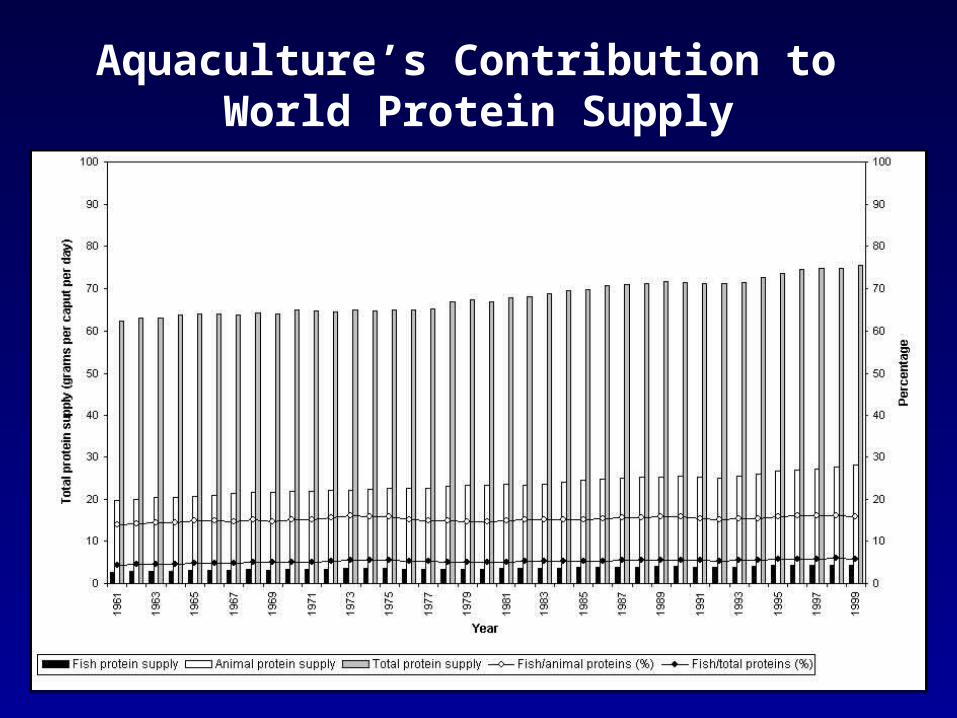
Aquaculture’s Contribution to World Protein Supply

Nutritional Comparisons
116
147
114
19.2 20.9 23.2 20.2
4.3 0.66.3 1.7
6.8
95
147
18.2
0
20
40
60
80
100
120
140
160
Catfish Shrimp Beef Chicken Pork
Species
Ca
lori
es o
r G
ram
s
Calories Protein Fat

US Aquaculture

1995 Farm Bill Proposal
“Aquaculture is poised to become a major growth industry.”

U.S. Aquaculture1998
• Food Fish Production increased – 308 million pounds in 1992 – 768 million pounds in 1998
• Farm-gate value increased – $261 million in 1992– $978 million in 1998– (NMFS and NASS,1999)

U.S. Aquaculture1998
• Farm Gate Value: $978 Million• Total Value: $5.6 Billion• 181,000 Full-time Jobs• Fastest Growing Sector Of U.S.
Agriculture

Aquaculture Sales

Value by Category

Top States
Source: 1998 Census of Aquaculture, USDA-NASS

Production StatesNORTH CENTRAL NORTHEASTERN
SOUTHERN
WESTERN
TROPICAL & SUBTROPICAL
PerchStriped BassTilapiaTrout
CatfishStriped BassTilapiaClams
TroutSalmonShellfishStriped BassTilapia
Ornamentals, Food and Shellfish
SalmonOystersClams Striped Bass
OrnamentalsCobia Shrimp

Agriculture vs. Aquaculture
• Variable body temperature
• Better converters of foodstuffs
• Requires less energy for body support
1 lb feed = 1 lb fish12

Species Selection
• Producer’s expertise• Water supply and climate• Species biology• Marketability• Production methods• Production economics ?

Water Temperature• Warmwater Range
– Cobia– Flounder– Red Drum– Snapper– Oysters

Water Temperature
• Coolwater Range – Flounder– Scallops– Oysters– Sea Bass

Water Temperature
• Coldwater Range– Atlantic Salmon– Blue Mussels– Oysters– Abalone

Types of Aquaculture
• Food• Bait• Ornamentals• Stock Enhancement• Sport• Fee Fishing

Food

Food Fish Species
• Catfish• Tilapia• Atlantic Salmon• Shrimp• Shellfish• Cobia• Snapper

Bait

Baitfish Species
• Fathead minnows• Golden shiners• Brown Shrimp• Mullet• Bull minnows

StockEnhancement

Stock Enhancement

Pond and Lake Stockings

Pond Stocking Species
• Channel catfish• Largemouth bass• Bluegill• Redear sunfish• Yellow perch• Trout

Ornamentals

Ornamental Species
• Goldfish• Angelfish• Crustaceans• Guppies• South American
Catfish• Clown fish• 100s more

Fee Fishing

Fee Fishing
• Long-term leases• Day leases or “ticket lakes”• “Fish-out” or by the pound ponds

Biological Supply Houses
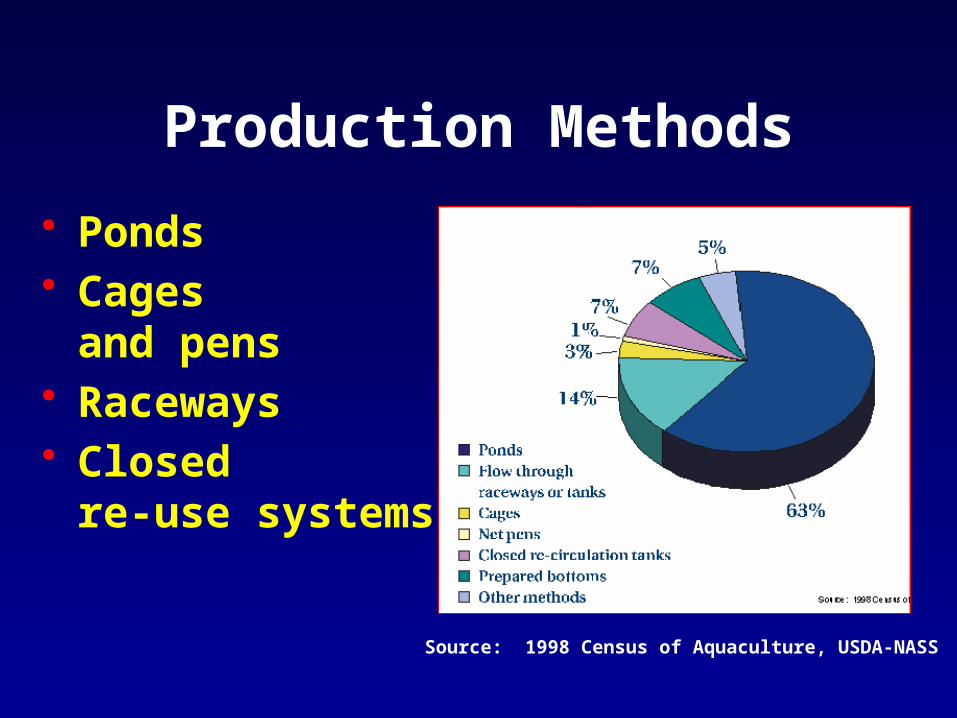
Production Methods
• Ponds• Cages
and pens• Raceways• Closed
re-use systems
Source: 1998 Census of Aquaculture, USDA-NASS

Levee Ponds

Production Phase Definition
• Securing and spawning of brood stock
• Hatching of eggs• Growing fry to produce fingerlings• Stocking and grow-out of fingerlings
to marketable size

Ponds
• Spawning– Broodstock– Hatching of eggs
• Fingerling• Grow-out to
market size
Spawning
0.1 acre
Fingerling1 acre
Food size
20 acre

Carrying Capacity
• Maximum weight that an area can support expressed either as lbs/acre or lbs/gal/min
Feed andaeration
2,000 - 8000lbs/acre
Feed2,0000
lbs/acre300 lbs/acre

Cages and Pens
4 feet
4 feet
4 feet

Cage and Net Pen Culture
• Allows existing bodies of water for production– Lakes– Bays– Offshore
• Low to high investment
• Decrease in production rates versus open ponds
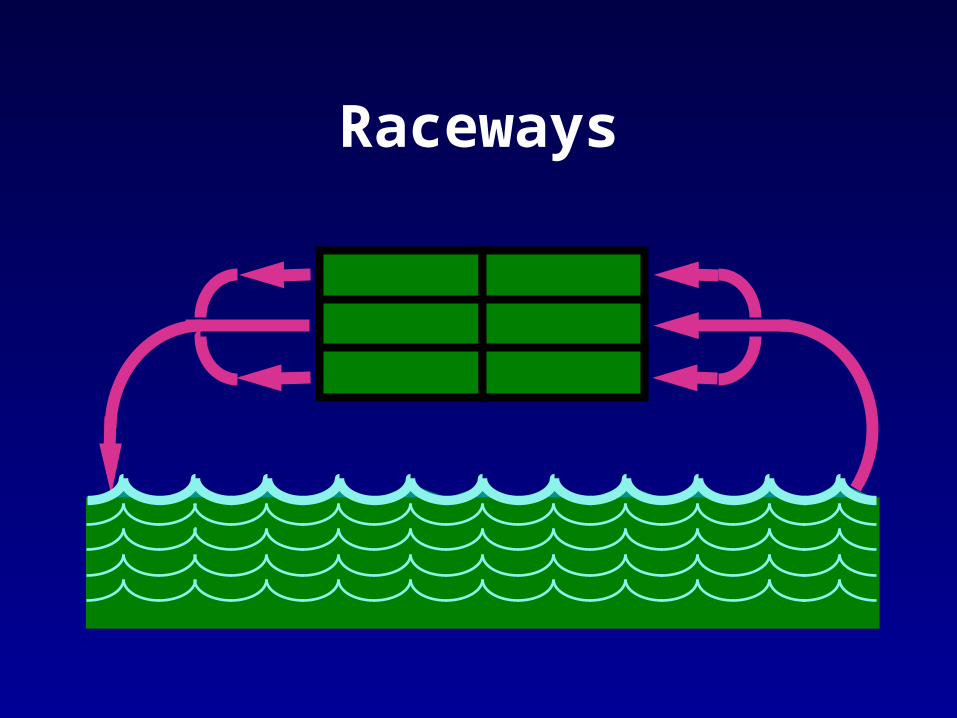
Raceways

Raceways
• Yield– 15-20,000 lbs for every
500 gallon/min flow.
Earthen Raceway
Concrete Raceway

Water Re-use Systems
H2OFish
Solidsfilter
Bio.filter
Pump

RAS Layout

Tilapia RAS
TankAeration
Biological Filters
Solids Filter