Embed Size (px)
Citation preview
AQS Asset Management, LLC
1
July 19, 2017
Mr. Kevin Fry Chair, Investment Risk- Based Capital (E) Working Group National Association of Insurance Commissioners 1100 Walnut Street, Suite 1500 Kansas City, MO 64106-2197
Re: Updated Recommendation of Corporate Bond Risk-Based Capital (RBC) Factors
AQS Asset Management respectfully submits the following comments on the American Academy of Actuaries’ C1 Work Group (C1WG) report titled, “Updated Recommendation of Corporate Bond Risk-Based Capital (RBC) Factors”.
Overview The C1WG Academy’s objectives as written in the report Model Construction and Development of RBC factors for Fixed Income Securities for the NAIC’s Life Risk-Based Capital Formula dated August 3, 2015, (page 8, paragraph 2):
1. “to eliminate large jumps in the C1 factors” and;2. “to better align the C1 factors with investment risks.” And;3. “Further, the more granular set of categories will better track changes in portfolios distributions by
not relying on average assumptions.”
As a result of this exercise, two components of the C1-o calculation have seen significant change:
1. The number of rating categories has increased from 6 (NAIC 1 – NAIC 6) to 14 and now to 20.2. The portfolio adjustment formula has been revised to include a larger multiplier for companies
with fewer issuers.
We take exception to the assumptions:
1. “To the extent that investment risks are reflected in the NRSRO rating, then that risk is capturedin the C1 capital requirement.” (August 3, 2015; page 5, paragraph 2)
2. “In other words, the risk of loss for an A-rated municipal is equivalent to the risk of loss for an A-rated corporate and the risk of loss for an A-rated private placement”. (October 17, 2016, page 5)
AQS asserts that the shortcomings of the NRSROs individually and collectively and NRSRO – NAIC mapping rubric in particular, inhibit the presumed accuracy of the proposed “NAIC 20”. We do not take issue with the analysis; instead, we take issue with the assumptions on which the analysis is based and point to the AAA’s own statements as evidence of the shortcomings of these results.
Mapping NRSRO ratings to SVO classes As presented in the August 3, 2015 report (page 5, paragraph 2), “To the extent that investment risks are reflected in the NRSRO rating, then that risk is captured in the C1 capital requirement.”
Portfolio managers already understand that specific issues trade rich or cheap to ratings. This is due to ratings lag.
Currently, NAIC ratings rely on the “second lowest” method for issues with multiple ratings, lower of two or if only one, a single rating. NRSROs are not always timely and typically do not update ratings at the same time. Some ratings may be updated or withdrawn years apart. The SVO mapping rubric, reliant on ratings at a given point in time, does not discriminate between current and stale ratings. It seems that any accuracy gained by 20 factors is significantly reduced without some effort to validate NRSRO ratings.
Will this methodology be changed? It would seem that this represents a greater weakness in the accuracy of risk capital calculations than the granularity obtained by 20 factors.
Private Placements - Is there enough data? Private placements, 20% of insurance assets, are reviewed at filing. NRSROs seldom rate such issues. Can the SVO assert that the process in place is equivalent to multiple NRSROs? Does this process
1
Attachment C
2
include periodic review equal or better than that of NRSRO – rated issues? Is the data reviewed consistently equivalent to the public filing requirements of publicly traded issues? Are these ratings stale? Is the SVO in a position to assert equivalent or greater expertise than NRSROs? If not, the opacity of these issues calls into question equivalence to public issues. This model also suggests that default rates of private placement issues is equivalent to same-rated public issues. Is there any evidence to support or refute this?
Liquidity of private placements is less than that of public issues.
Bankruptcies are not identical The C1WG model assumes that the risk of loss is identical for ratings across asset classes for all bonds of the same rating (pg. 5). Recent history in both the largest Corporate (Lehman Brothers - 2008) and largest Municipal (Detroit - 2013) defaults on record find this assumption does not hold in practice.
Senior unsecured Lehman, rated A2 on 9/12/08 (Friday) indicated they would file for bankruptcy on 9/15/08 (Monday) and was rated B3 (*-). This issue ultimately recovered approximately 42% of par.
Detroit Sewer was rated B1 (*-) just prior to bankruptcy and recovered fully 100% of par.
Utility of experience vs “random” events A-rated base factors increased between the ’02 and ’15 AAA studies.
From the response dated October 17, 2016, the impact of financial defaults during the crisis is addressed as “a random shortcoming in the rating process that could occur again with any other sector. In that light, all prior experience is appropriate to form the historical experience assumption.” (page 13)
On page 5, the C1WG writes that “In other words, the risk of loss for an A-rated municipal is equivalent to the risk of loss for an A-rated corporate and the risk of loss for an A-rated private placement”.
These statements seem to be contradicted by the actual experience of Detroit sewer and Lehman. If the idea of equivalent risk stated above does not hold in practice, how does increased granularity reconcile these contradictions?
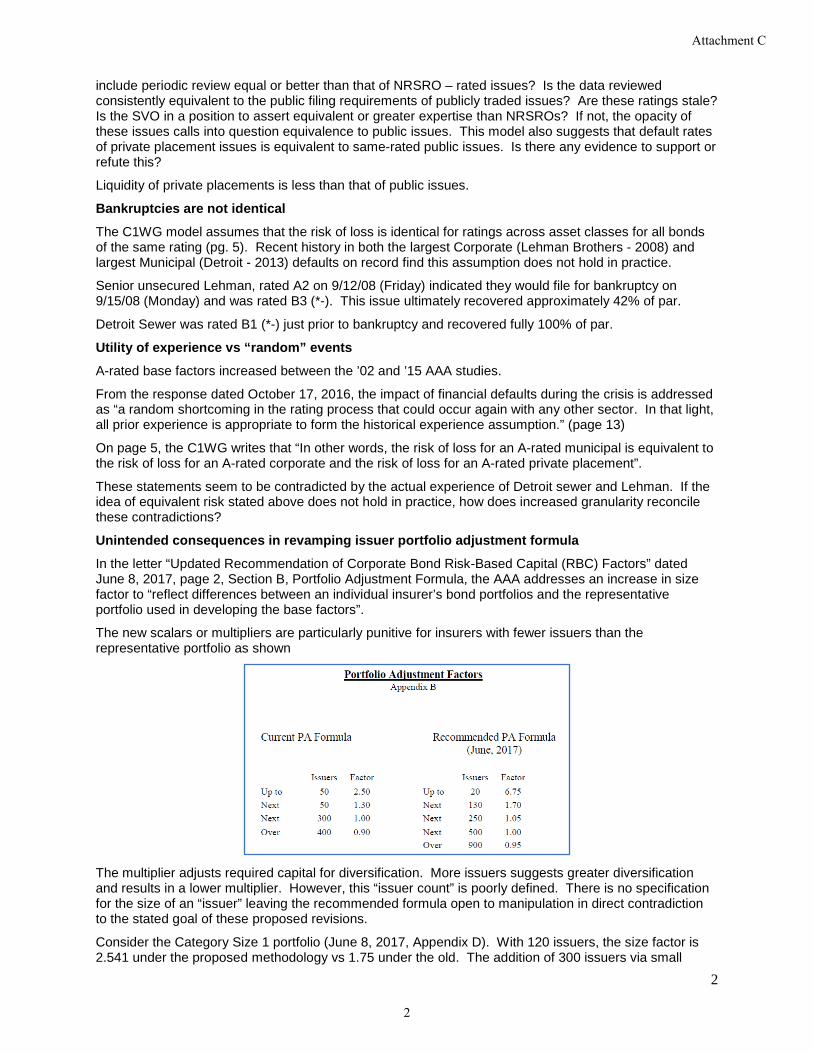
Unintended consequences in revamping issuer portfolio adjustment formula In the letter “Updated Recommendation of Corporate Bond Risk-Based Capital (RBC) Factors” dated June 8, 2017, page 2, Section B, Portfolio Adjustment Formula, the AAA addresses an increase in size factor to “reflect differences between an individual insurer’s bond portfolios and the representative portfolio used in developing the base factors”.
The new scalars or multipliers are particularly punitive for insurers with fewer issuers than the representative portfolio as shown
The multiplier adjusts required capital for diversification. More issuers suggests greater diversification and results in a lower multiplier. However, this “issuer count” is poorly defined. There is no specification for the size of an “issuer” leaving the recommended formula open to manipulation in direct contradiction to the stated goal of these proposed revisions.
Consider the Category Size 1 portfolio (June 8, 2017, Appendix D). With 120 issuers, the size factor is 2.541 under the proposed methodology vs 1.75 under the old. The addition of 300 issuers via small
2
Attachment C

3
($1,000) bond positions (an increase in assets of 0.36% in a portfolio of $84 million) reduces the size factor under the new formula to 1.52.
Consider the Category Size 2 portfolio (assets: $715.5 million; 293 issuers). Adding the same 300 - $1,000 par issuers (an increase in assets of 0.04%), the proposed multiplier is reduced from 1.727 to 1.368.
While diversification is a key tenet of portfolio management, the unintended consequence of this onerous increase in the multiplier incentivizes pseudo-diversification.
Impact of CUSIP method on the Portfolio Adjustment Formula? The proposed size factor was determined using non-CUSIP level data (Appendix D). The RBC workbook instructions for issuer count allows the first 6 digits of a CUSIP to be used for determination. It is an objective method by which issuer count can be determined. Why was this ignored? This necessarily skews the resultant multiplier. Conclusions
1. The ratings of the NRSROs, however stale, continue to determine the NAIC classifications. 2. The assignment rubric used, “second lowest”, is still without statistical relevance. 3. While the NRSROs claim to rate on a “global” basis, it is naïve to assume that all sectors have
similar default and recovery prospects. Secondary capital markets demonstrate this. 4. Default rates and recovery rates were taken from single NRSROs while 8 NRSROs are
recognized to establish NAIC mapping. Logic suggests this data to be thin at best. 5. The financial crisis is dismissed as “a random shortcoming in the rating process that could occur
again with any other sector.”
In short, the proposed solution, albeit more complex, does not appear to address the underlying problem with the current asset risk metric. An NAIC 20 with its attendant cost and effort addresses “large jumps in the C1 factors” but continues to rely on NRSRO ratings that may not be current.
Just after the financial crisis an innovative methodology to incorporate RMBS market valuations into SVO ratings was developed. While the solution does not directly translate here, it does suggest that a more timely and market-based solution might be possible.
3
Attachment C

4
Attachment C
Page | 1
Steven Clayburn Senior Actuary, Health Insurance & Reinsurance [email protected] July 24, 2017 Mr. Kevin Fry Chair NAIC Investment Risk-Based Capital Working Group RE: Updated Recommendation of Corporate Bond (RBC) Factors Dear Mr. Fry: The American Council of Life Insurers1 (ACLI) appreciates the opportunity to comment on the June 8, 2017 report from the American Academy of Actuaries (Academy) containing their updated recommendation of corporate bond RBC factors. We recognize the efforts of the Investment RBC Working Group to fulfill its charge of updating RBC C-1 bond factors. ACLI remains supportive of the Working Group’s charge and is committed to working collaboratively with regulators and other stakeholders on revised factors. We appreciate the additional work the Academy has done to update the proposed RBC bond factors. That said, we believe that further progress to address areas of concern is dependent upon direct engagement and transparent discussions among key stakeholders. As a next step, we request the formation of a joint working group of regulators, the Academy, and industry representatives to discuss possible targeted adjustments to address the open issues surrounding this proposal. EXECUTIVE SUMMARY The following are three main areas that we have identified after reviewing the Academy’s report on the proposed changes to the corporate bond factors (and other factors):
The portfolio adjustment factor (previously called the bond size factor) has changed significantly, resulting in a substantial and negative RBC impact, particularly for small and mid-sized insurance companies. This new approach needs to be more thoroughly discussed and analyzed (e.g., the linkage of this approach to the underlying base factors).
While the current base factors represent an improvement over the initial recommendation, the slope of the charges still is counterintuitive and provides an incentive to invest in below investment grade securities. We also believe recognition for differences in historical experience between corporate bonds, private placements, municipal bonds and sovereigns justifies consideration of unique base factors for each.
We continue to believe it is important to have a detailed implementation plan in place
before proceeding. The current corporate bond factors are used in other parts of the C-1 calculation. Companies need to know if additional granularity will be added to any of
1 ACLI is a Washington, D.C.-based trade association with approximately 290 member companies operating in the United States and abroad. ACLI advocates in federal, state, and international forums for public policy that supports the industry marketplace and the 75 million American families that rely on life insurers’ products for financial and retirement security. ACLI members offer life insurance, annuities, retirement plans, long-term care and disability income insurance, and reinsurance, representing 94 percent of industry assets, 93 percent of life insurance premiums, and 97 percent of annuity considerations in the United States. Learn more at www.acli.com.
5
Attachment C
Page 2 of 7
these other area, whether they retain the current 6-class structure with the current factors or retain 6-classes but with new factors.
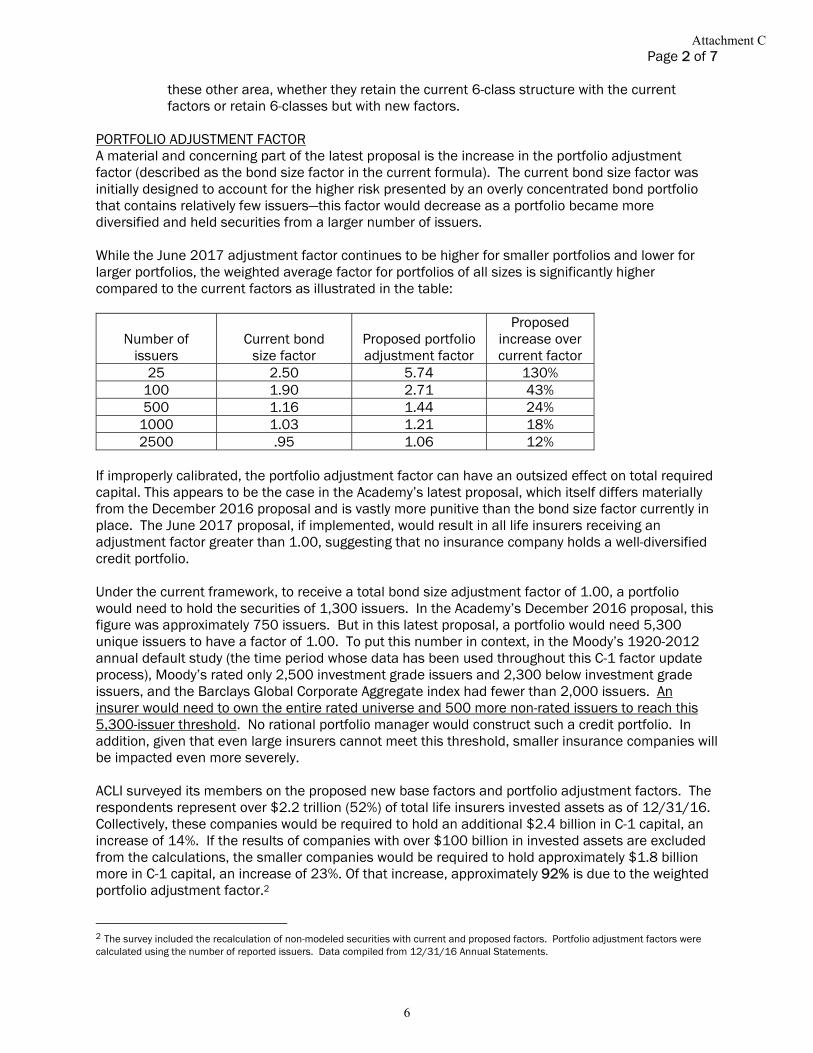
PORTFOLIO ADJUSTMENT FACTOR A material and concerning part of the latest proposal is the increase in the portfolio adjustment factor (described as the bond size factor in the current formula). The current bond size factor was initially designed to account for the higher risk presented by an overly concentrated bond portfolio that contains relatively few issuers—this factor would decrease as a portfolio became more diversified and held securities from a larger number of issuers. While the June 2017 adjustment factor continues to be higher for smaller portfolios and lower for larger portfolios, the weighted average factor for portfolios of all sizes is significantly higher compared to the current factors as illustrated in the table:
Number of
issuers
Current bond
size factor
Proposed portfolio adjustment factor
Proposed increase over current factor
25 2.50 5.74 130% 100 1.90 2.71 43% 500 1.16 1.44 24%
1000 1.03 1.21 18% 2500 .95 1.06 12%
If improperly calibrated, the portfolio adjustment factor can have an outsized effect on total required capital. This appears to be the case in the Academy’s latest proposal, which itself differs materially from the December 2016 proposal and is vastly more punitive than the bond size factor currently in place. The June 2017 proposal, if implemented, would result in all life insurers receiving an adjustment factor greater than 1.00, suggesting that no insurance company holds a well-diversified credit portfolio. Under the current framework, to receive a total bond size adjustment factor of 1.00, a portfolio would need to hold the securities of 1,300 issuers. In the Academy’s December 2016 proposal, this figure was approximately 750 issuers. But in this latest proposal, a portfolio would need 5,300 unique issuers to have a factor of 1.00. To put this number in context, in the Moody’s 1920-2012 annual default study (the time period whose data has been used throughout this C-1 factor update process), Moody’s rated only 2,500 investment grade issuers and 2,300 below investment grade issuers, and the Barclays Global Corporate Aggregate index had fewer than 2,000 issuers. An insurer would need to own the entire rated universe and 500 more non-rated issuers to reach this 5,300-issuer threshold. No rational portfolio manager would construct such a credit portfolio. In addition, given that even large insurers cannot meet this threshold, smaller insurance companies will be impacted even more severely. ACLI surveyed its members on the proposed new base factors and portfolio adjustment factors. The respondents represent over $2.2 trillion (52%) of total life insurers invested assets as of 12/31/16. Collectively, these companies would be required to hold an additional $2.4 billion in C-1 capital, an increase of 14%. If the results of companies with over $100 billion in invested assets are excluded from the calculations, the smaller companies would be required to hold approximately $1.8 billion more in C-1 capital, an increase of 23%. Of that increase, approximately 92% is due to the weighted portfolio adjustment factor.2
2 The survey included the recalculation of non-modeled securities with current and proposed factors. Portfolio adjustment factors were calculated using the number of reported issuers. Data compiled from 12/31/16 Annual Statements.
6
Attachment C
Page 3 of 7 The new portfolio adjustment factor will have the unintended consequence of incentivizing a higher risk portfolio. Insurers will be rewarded for holding more issuer names for the sake of holding more names, rather than knowing well the names they hold, and having a high conviction in the financial position of those names. Holding such a large number of issuers will also cause a material portion of the portfolio to be in issuers that do not trade with normal frequency, thus increasing the illiquidity and risk of the portfolio. Smaller to mid-size companies will again be disproportionately impacted as the small position sizes will only increase the liquidity challenges. While the application of the adjustment factor on its surface seems to be similar to the current process, the underlying methodology used to develop the adjustment factor represents a fundamentally and substantially different methodology. The original methodology was a statistical adjustment based solely on the number of issuers held and assuming that the underlying factors were developed at the 96th percentile for a representative company portfolio. The current approach restructures the RBC charges to develop a perceived 96th percentile for each company, as the factors themselves do not represent a 96th percentile safety level as noted by the Academy on page 11 of the June 8 report. Thus, there appears to be a linkage between the base bond factors and the portfolio adjustment factor such that the latter factor appears to be a “top-side” adjustment to scale the total RBC required. As a result, while the base factors have decreased relative to the initial Academy proposal, the total capital requirement after applying the portfolio adjustment factor is essentially the same under both proposals. Appendix A provides more detail on our analysis of the linkage between the base bond factors and the portfolio adjustment factors. The original objectives of the Working Group were to update the C-1 bond factors based on recent default experience since the last update and to incorporate additional granularity. While an increase in RBC for securities in the lower “AA” and “A” rating grades would be expected given the increased granularity, default experience since the 1990’s would have suggested comparable, if not lower, overall required capital levels. While there has been considerable amount of discussion over the last two years and additional analysis of the C-1 base factors that has helped to move them in a better direction, this is not the case with the proposed adjustment factors. The proposed adjustment factors were first published in June 2017, less than two months ago. We had a relatively brief conversation with the Academy regarding the portfolio adjustment factor and submitted follow up questions in an effort to better understand the approach and its development. However, given the short window of time to respond to the latest proposal, neither industry nor the Academy have had ample time to fully discuss what, in our opinion, is a significant and material change in both the philosophy and the structure of the C-1 calculation. Because of the impact this has on the overall C-1 results, and because of the potential disproportionate impact it will have on smaller companies, we believe that it is important to appropriately review and analyze such a major change to this calculation of a company’s RBC. We recommend and welcome further discussions to occur regarding this issue. We also suggest that the discussions be done through a joint working group with industry representatives, the Academy, and regulators to more quickly resolve the open issues surrounding this latest proposal. Appendix A includes proposed adjustments to the modeling approach. BASE BOND FACTORS We appreciate the additional work the Academy has done to respond to concerns the ACLI expressed regarding the Academy’s August 2015 proposal on corporate bond RBC factors. The increase in the proposed RBC base factors for investment grade securities compared to current factors, coupled with decreases in those for below investment grade securities, would have had profound impacts not only on company RBC ratios, but on the future investment strategies of life insurance companies. While the June 2017 base factors more appropriately represent the balance between investment
7
Attachment C
Page 4 of 7 grade and below investment grade securities, the slope of the charges still provides some incentives to invest in below investment grade securities. IMPLEMENTATION As the NAIC moves forward on the initiative of updating RBC calculations for bonds, companies must make plans to implement the changes. This is particularly important as it relates to system changes that may be needed to capture the required information going into the calculations. Other items that have been identified that need to be addressed include:
Will federal tax rates remain at 26.25% for non-defaulted assets or changed to the 28% rate referenced in the Academy’s August 2015 documentation?
The current corporate bond factors are used in other areas of the C-1 calculation. o For other securities also using the current 6-class structure, will this continue or will
added granularity be incorporated? o Will the factors for these other securities be changed? If so, how will the factors be
determined? Clarity on the application of the revised factors to structured securities, i.e., whether/how the
breakpoints for modeled and non-modeled structures will be updated to reflect the new factors will be necessary.
Given the potential RBC impact on companies, will there be a phase-in period? If so, what are the details?
Will a field test be done to assess the overall impact on various size companies before final implementation occurs?
Has communication with RBC software vendors been initiated of the future proposed changes?
Is the structure currently being put in place to support different capital factors for private placements, municipals and sovereigns?
Can the impacts of the more granular designation structure be accommodated by the NAIC’s Securities Valuation Office in time for the proposed implementation date?
Industry shares the interest of the regulators of being able to finalize this as soon as possible, and ACLI is committed to doing everything it can to achieve this objective. At the same time, it is important to understand that based on estimates from the Academy, the proposed changes will represent $6 billion in new capital requirements for the industry. Therefore, it is important for everyone to have a good understanding of what is creating the need for this additional capital, validation that the model is appropriately addressing the need, and comfort with the resulting company level impacts. Again, we request the opportunity to have transparent, meaningful discussions with the Academy and the Working Group on the technical aspects of the latest proposal. Sincerely,
Steven M. Clayburn, FSA, MAAA cc: Julie Garber, CPA, NAIC Sr. Manager, Solvency Regulation
8
Attachment C
Page 5 of 7
Appendix A Proposed Modeling Adjustments
To analyze the Academy’s latest proposal and determine appropriate and effective solutions through modeling adjustments, it helps to understand the overall C-1 framework as having three components:
A. Level of capital for the “representative portfolio” (as constructed by the Academy for use in their model)
B. Change in required capital due to credit quality (i.e., increase/decrease for portfolios holding securities with worse/better credit ratings)
C. Change in required capital due to portfolio diversification (i.e., increase/decrease for portfolios holding fewer/more issuers)
As compared to the current C-1 framework, the Academy’s proposal impacts each component as follows:
A. The level of capital for the representative portfolio has increased from 1.25% to 1.56%, an increase of 26%. Note that this is substantially similar to the Academy’s previous proposal, which increased capital requirements by 24%.
Historical default experience since the early 1990s has been substantially better than that of the 1980s – therefore, the level of capital should be decreasing or staying level, not increasing.
B. The ratio of base factors for a typical investment grade and high yield bond (A2 and Ba2, respectively) has increased from 9% to 22%, indicating substantially less differentiation and greater incentive to hold a lower credit quality portfolio.
C. The ratio of capital required for a typical smaller insurer (Academy insurer size #1: portfolio size less than $0.5 billion) to the representative portfolio has increased from 118% to 171%, indicating substantially larger penalties for less diversified portfolios
Based on the limited information that has been provided to date, it appears that these impacts are the result of the Academy’s modeling process, which involves two runs of the model for two distinct purposes:
Run 1: Calculating the 92nd percentile for each of 19 letter ratings (Aaa to Caa3)
These results directly affect component B
Run 2: Calculating the 96th percentile for each insurer portfolio (with different inputs for issuers by NAIC rating 1 to 5)
These results directly affect components A and C
Between the August 2015 and June 2017 proposals, only the first of these two runs was changed – the number of holdings in the model was roughly doubled, increasing diversification and thus lowering risk for the base factors. This change, however, had no impact on the second run, which is by far the more important model result. Our September 2016 comment letter raised many concerns with this modeling approach and certain key assumptions, but to date these concerns remain unaddressed. However, based on our extensive work of replicating the Academy’s model, we propose three intuitive and easily implemented adjustments that would yield more reasonable results:
9
Attachment C
Page 6 of 7
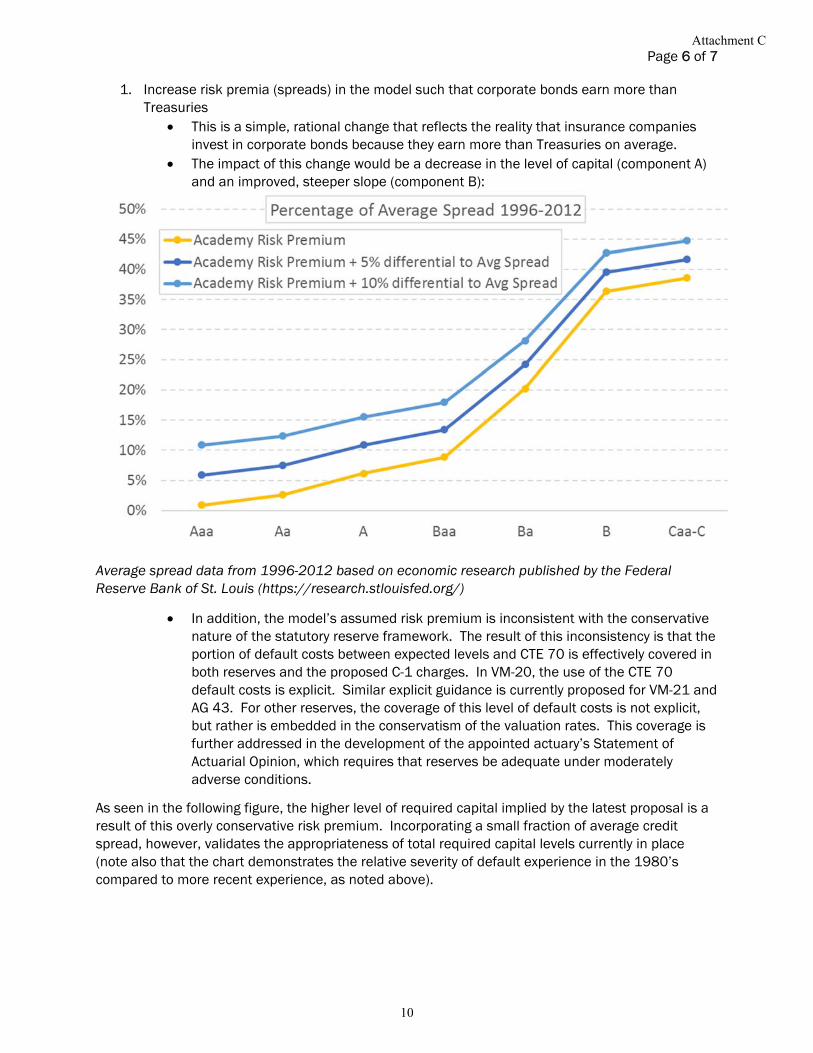
1. Increase risk premia (spreads) in the model such that corporate bonds earn more than Treasuries
This is a simple, rational change that reflects the reality that insurance companies invest in corporate bonds because they earn more than Treasuries on average.
The impact of this change would be a decrease in the level of capital (component A) and an improved, steeper slope (component B):
Average spread data from 1996-2012 based on economic research published by the Federal Reserve Bank of St. Louis (https://research.stlouisfed.org/)
In addition, the model’s assumed risk premium is inconsistent with the conservative nature of the statutory reserve framework. The result of this inconsistency is that the portion of default costs between expected levels and CTE 70 is effectively covered in both reserves and the proposed C-1 charges. In VM-20, the use of the CTE 70 default costs is explicit. Similar explicit guidance is currently proposed for VM-21 and AG 43. For other reserves, the coverage of this level of default costs is not explicit, but rather is embedded in the conservatism of the valuation rates. This coverage is further addressed in the development of the appointed actuary’s Statement of Actuarial Opinion, which requires that reserves be adequate under moderately adverse conditions.
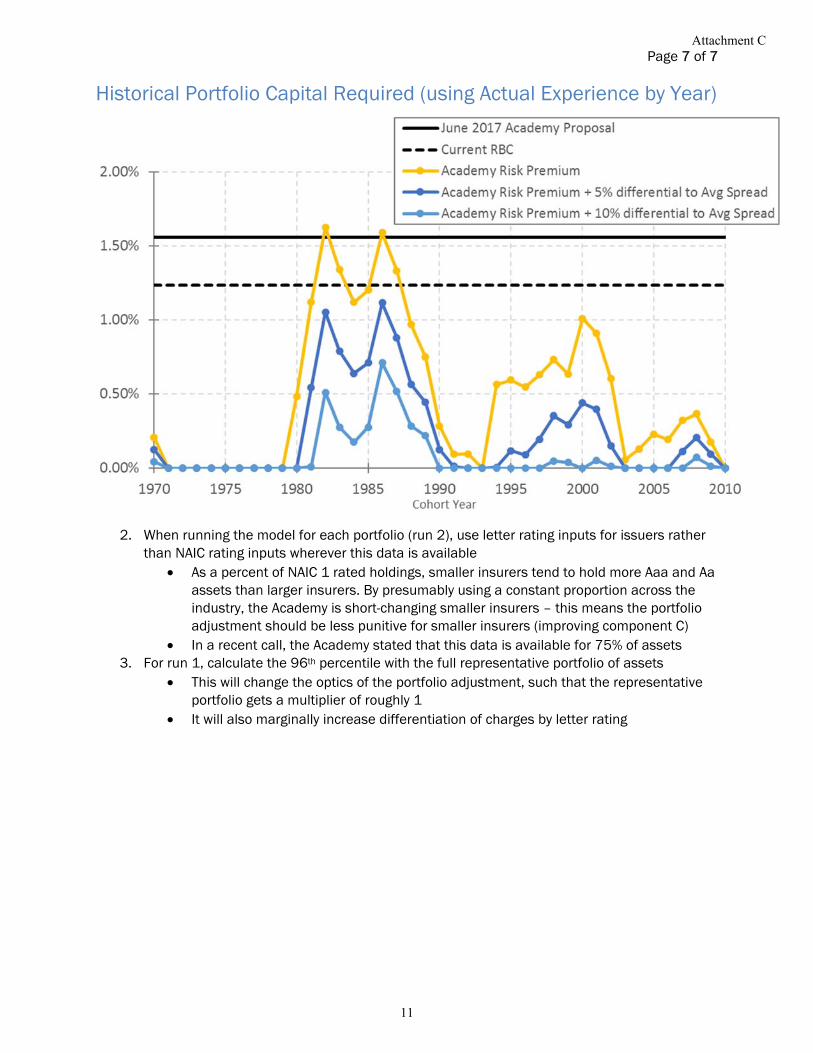
As seen in the following figure, the higher level of required capital implied by the latest proposal is a result of this overly conservative risk premium. Incorporating a small fraction of average credit spread, however, validates the appropriateness of total required capital levels currently in place (note also that the chart demonstrates the relative severity of default experience in the 1980’s compared to more recent experience, as noted above).
10
Attachment C
Page 7 of 7
Historical Portfolio Capital Required (using Actual Experience by Year)
2. When running the model for each portfolio (run 2), use letter rating inputs for issuers rather than NAIC rating inputs wherever this data is available
As a percent of NAIC 1 rated holdings, smaller insurers tend to hold more Aaa and Aa assets than larger insurers. By presumably using a constant proportion across the industry, the Academy is short-changing smaller insurers – this means the portfolio adjustment should be less punitive for smaller insurers (improving component C)
In a recent call, the Academy stated that this data is available for 75% of assets 3. For run 1, calculate the 96th percentile with the full representative portfolio of assets
This will change the optics of the portfolio adjustment, such that the representative portfolio gets a multiplier of roughly 1
It will also marginally increase differentiation of charges by letter rating
11
Attachment C

12
Attachment C
13
Attachment C
14
Attachment C
15
Attachment C
16
Attachment C

17
Attachment C

18
Attachment C
10534126v4
July 24, 2017
Via E-mail to: [email protected]
Mr. Kevin Fry
Chair, Investment Risk-Based Capital (E) Working Group
National Association of Insurance Commissioners
1100 Walnut Street, Suite 1500
Kansas City, MO 64106-2197
Re: Comments on American Academy of Actuaries’ June 8, 2017 Updated
Recommendation of Corporate Bond Risk-Based Capital (RBC) Factors
Dear Mr. Fry:
On behalf of the National Structured Settlements Trade Association (“NSSTA”) I am writing to
offer our association’s comments on the above-referenced Recommendation (the “2017 RBC
Bond Factor Recommendation”) and its potential implications for life insurers that issue single-
premium immediate annuities to fund structured settlements (“structured settlement annuities” or
“SSAs”).
NSSTA is a non-profit association dedicated to promoting the use of structured settlements to
resolve physical injury claims. Its members include life insurers that issue SSAs; property and
casualty insurers that use structured settlements to resolve claims against their insureds;
insurance brokers that specialize in arranging structured settlements; and lawyers, life care
planners and other professionals engaged in negotiating and implementing structured
settlements.
NSSTA commends the diligence of the American Academy of Actuaries (the “AAA”) in
preparing the 2017 RBC Bond Factor Recommendation. Its updated base C1 bond factors
represent an improvement on the factors recommended by AAA in August 2015; but we remain
concerned that the updated factors still would lead to problematic increases in capital costs for
life insurers that issue SSAs.
Because of the exceptionally long duration of structured settlement liabilities, SSA issuers
commonly have extensive holdings of long-term, investment grade bonds. While such holdings
would not be affected as dramatically by the updated bond factors as they would have been by
the factors that were suggested in August 2015, the updated factors still would impose
19
Attachment C
Mr. Kevin Fry
July 24, 2017
Page 2
10534126v4
substantially increased capital costs on SSA issuers. Insofar as they are passed through to SSA
purchasers (primarily property & casualty insurers), those increased capital costs would make
structured settlements less appealing as a means of settling physical injury claims. Insofar as the
costs are not passed through to SSA purchasers, they would discourage life insurers from
continuing to issue SSAs or from joining (or rejoining) the market if they do not currently issue
them.
In recent years the number of life insurers issuing SSAs has fallen sharply. Of the more than 700
stock or mutual life insurers in business in the United States, only nine now are writing SSAs. (In
2017 those companies issued approximately 25,000 new SSAs, for which they received
premiums totaling approximately $5.8 billion.) NSSTA hopes to see additional life insurers join,
or rejoin, the market; but they cannot be expected to do so if they would face substantially
increased capital costs for holdings of long-term, investment grade corporate bonds. Worse yet,
the increased capital costs resulting from use of the base C1 bond factors might prompt existing
SSA issuers to quit the market, leaving parties to structured settlements with fewer choices than
they have today.
By facilitating settlements and offering injury victims assured, continuing, tax-free payments
tailored to their needs and the needs of their families, structured settlements serve important
public policies that have been endorsed by Congress and by State legislatures throughout the
country. Those policies will be ill-served if use of updated base C1 bond factors leads to
disproportionately increased capital costs for SSA issuers and/or higher premiums charged to
SSA purchasers.
NSSTA thus recommends that before making any recommendation to the Capital Adequacy (E)
Task Force concerning the 2017 RBC Bond Factor Recommendation, the Investment Risk-Based
Capital (E) Working Group consider, and ask AAA, in consultation with other industry
stakeholders, to assess (i) how the updated base C1 bond factors would affect SSAs, and (ii) how
adverse effects on SSAs could be avoided or minimized.
* * * *
NSSTA welcomes this opportunity to comment on the 2017 RBC Bond Factor
Recommendation. If we can answer questions about the above comments or provide background
about structured settlements or SSAs, please feel free to direct inquiries to the undersigned or to
20
Attachment C
Mr. Kevin Fry
July 24, 2017
Page 3
10534126v4
NSSTA’s counsel, Craig Ulman of Hogan Lovells, who can be reached at (202) 637-5669 or by
e-mail at [email protected].
Very truly yours,
Eric Vaughn
Executive Director
National Structured Settlements Trade Association
21
Attachment C

22
Attachment C
Page 1 of 4
Julie Garber National Association of Insurance Commissioners 1100 Walnut Street Suite 1500 Kansas City, MO 64106-2197 Via e-mail: [email protected] Comment Submission on the American Academy of Actuaries Recommendation of Corporate Bond Risk-Based Capital (RBC) Factors Dear Ms. Garber, The North American CRO Council (“CRO Council” or “Council”) appreciates the opportunity to comment on the proposed updates to the credit risk (“C1”) component of Risk Based Capital (“RBC”). The CRO Council is a professional association of Chief Risk Officers (“CROs”) from leading insurers based in the United States, Canada, and Bermuda. Member CROs currently represent 31 of the largest Life, and Property and Casualty insurers in North America. As a body formed to promote sound practices in risk management, the CRO Council appreciates the opportunity to submit its comments and concerns regarding the proposed revisions. The Council understands and supports state regulators’ desire for a continuing dialogue between insurers and their regulators regarding insurers’ key risks and their risk management programs. Although the Council believes that good progress has been made on the base bond factors in the June 2017 proposal from the American Academy of Actuaries (“Academy”), we are concerned that significant modeling issues have not been addressed. Most notably:
• The model is not a true portfolio model, distorting both the magnitude of capital requirements as well as the trade-off from investment grade to below investment grade
• The model double-counts risks already covered by reserves • The model assumes that a credit portfolio only earns enough spread to cover expected losses • The model treats all debt as if it were senior unsecured public corporate exposure
These issues have been highlighted through industry letters and discussions since the publication of base factor methodology in August 2015. In the June 2017 proposal, the impact of these issues is most visible in the portfolio adjustment. An update to the portfolio adjustment framework was not part of the initial August 2015 proposal and methodology document. Instead, it was published over a year later in December 2016, and the industry did not have the opportunity to discuss the methodology underlying this adjustment in detail as the Academy was developing the new June 2017 proposal. The proposed portfolio adjustment framework is material and deserves proper documentation and review. Our initial concern with the June 2017 portfolio adjustment framework is that it does not match intuition and it seems to be a drastic departure from the current framework. The current framework is built on a
23
Attachment C
Page 2 of 4
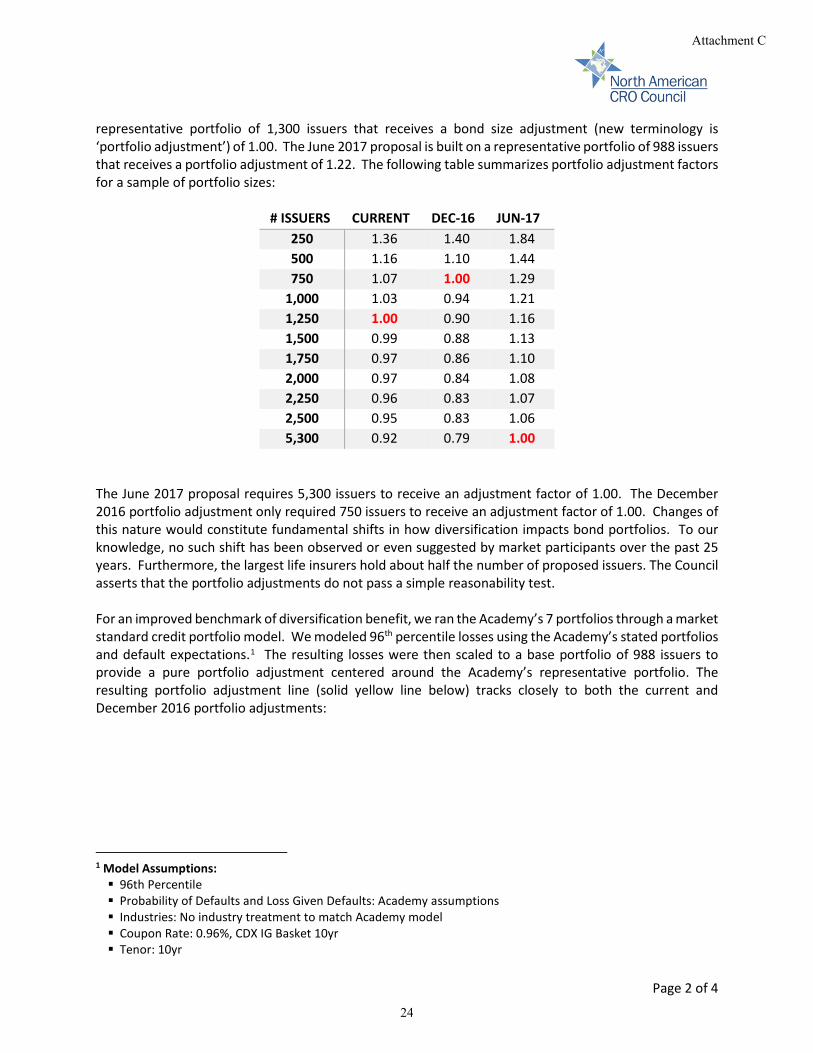
representative portfolio of 1,300 issuers that receives a bond size adjustment (new terminology is ‘portfolio adjustment’) of 1.00. The June 2017 proposal is built on a representative portfolio of 988 issuers that receives a portfolio adjustment of 1.22. The following table summarizes portfolio adjustment factors for a sample of portfolio sizes:
# ISSUERS CURRENT DEC-16 JUN-17 250 1.36 1.40 1.84 500 1.16 1.10 1.44 750 1.07 1.00 1.29
1,000 1.03 0.94 1.21 1,250 1.00 0.90 1.16 1,500 0.99 0.88 1.13 1,750 0.97 0.86 1.10 2,000 0.97 0.84 1.08 2,250 0.96 0.83 1.07 2,500 0.95 0.83 1.06 5,300 0.92 0.79 1.00
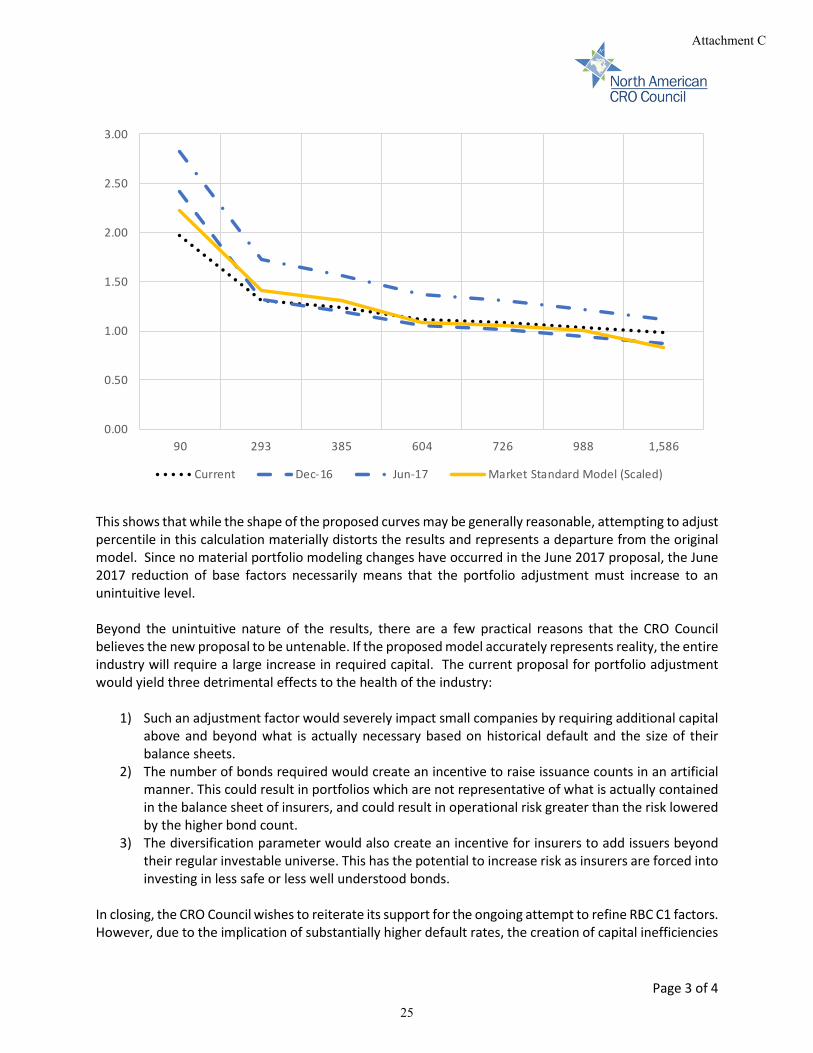
The June 2017 proposal requires 5,300 issuers to receive an adjustment factor of 1.00. The December 2016 portfolio adjustment only required 750 issuers to receive an adjustment factor of 1.00. Changes of this nature would constitute fundamental shifts in how diversification impacts bond portfolios. To our knowledge, no such shift has been observed or even suggested by market participants over the past 25 years. Furthermore, the largest life insurers hold about half the number of proposed issuers. The Council asserts that the portfolio adjustments do not pass a simple reasonability test. For an improved benchmark of diversification benefit, we ran the Academy’s 7 portfolios through a market standard credit portfolio model. We modeled 96th percentile losses using the Academy’s stated portfolios and default expectations.1 The resulting losses were then scaled to a base portfolio of 988 issuers to provide a pure portfolio adjustment centered around the Academy’s representative portfolio. The resulting portfolio adjustment line (solid yellow line below) tracks closely to both the current and December 2016 portfolio adjustments:
1 Model Assumptions: 96th Percentile Probability of Defaults and Loss Given Defaults: Academy assumptions Industries: No industry treatment to match Academy model Coupon Rate: 0.96%, CDX IG Basket 10yr Tenor: 10yr
24
Attachment C
Page 3 of 4
This shows that while the shape of the proposed curves may be generally reasonable, attempting to adjust percentile in this calculation materially distorts the results and represents a departure from the original model. Since no material portfolio modeling changes have occurred in the June 2017 proposal, the June 2017 reduction of base factors necessarily means that the portfolio adjustment must increase to an unintuitive level. Beyond the unintuitive nature of the results, there are a few practical reasons that the CRO Council believes the new proposal to be untenable. If the proposed model accurately represents reality, the entire industry will require a large increase in required capital. The current proposal for portfolio adjustment would yield three detrimental effects to the health of the industry:
1) Such an adjustment factor would severely impact small companies by requiring additional capital above and beyond what is actually necessary based on historical default and the size of their balance sheets.
2) The number of bonds required would create an incentive to raise issuance counts in an artificial manner. This could result in portfolios which are not representative of what is actually contained in the balance sheet of insurers, and could result in operational risk greater than the risk lowered by the higher bond count.
3) The diversification parameter would also create an incentive for insurers to add issuers beyond their regular investable universe. This has the potential to increase risk as insurers are forced into investing in less safe or less well understood bonds.
In closing, the CRO Council wishes to reiterate its support for the ongoing attempt to refine RBC C1 factors. However, due to the implication of substantially higher default rates, the creation of capital inefficiencies
0.00
0.50
1.00
1.50
2.00
2.50
3.00
90 293 385 604 726 988 1,586
Current Dec-16 Jun-17 Market Standard Model (Scaled)
25
Attachment C
Page 4 of 4
of smaller insurers, incentivizing artificially raised issuance counts, and incentivizing investment outside of the regular investable universe, the CRO Council recommends that the current proposal from The Academy be revisited, specifically with regards to the magnitude of the portfolio adjustment factors or the number of securities required to achieve these factors. We believe this would best be accomplished through creation of a working group that includes technical representatives from the NAIC, the Academy, and industry. Thank you again for the opportunity to respond to your efforts and we would welcome the opportunity to meet to discuss and answer any questions you may have. Sincerely,
Mark Verheyen, Chair North American CRO Council
Michael Slipowitz, Chair CRO Council – State Regulatory Working Group
26
Attachment C
27
Attachment C
28
Attachment C
2017 Officers:
William R. O’TooleChair of the BoardCatholic Financial Life
Kevin A. MartiVice Chair of the BoardGleaner Life Insurance Society
Marc SchoenfeldSecretary/TreasurerRoyal Neighbors of America
Patrick DeesImmediate Past Board ChairWoodmenLife
Directors:
Douglas BakerTeachers Life Insurance Society
Darcy G. CallasModern Woodmen of America
Eivind HeibergSons of Norway
Paul JohnstonThrivent Financial
Timothy L. KuzmaPolish Falcons of America
Cynthia MaleskiFirst Catholic Slovak LadiesAssociation of America
Timothy PorterForesters Financial
Buddy PreussHermann Sons Life
Thomas P. SmithKnights of Columbus
Joseph J. AnnottiPresident and CEO
2017 Executive SummitApril 3-5, 2017W Chicago – City CenterChicago, IL
2017 Spring SymposiumMay 23-25, 2017Loews Chicago O’HareChicago, IL
2017 Annual MeetingSept. 6-8, 2017Sheraton Wild Horse PassPhoenix, AZ
July 24, 2017
Kevin Frey, Chair, NAIC Investment RBC Working Group
Attn: Julie Garber – [email protected]
RE: Corporate Bond RBC Factors – Academy Recommendations
Dear Mr. Fry:
The American Fraternal Alliance (Alliance) appreciates the opportunity toprovide comments regarding the June 8, 2017 report presented by the AmericanAcademy of Actuaries (Academy) and its Updated Recommendation of CorporateBond Risk-Based Capital (RBC) Factors.
The Alliance has concerns regarding the negative impact from theModifications to the Base Factors and changes to the Portfolio Adjustment Formulaas proposed by the Academy in its June 8, 2017 report. Based on data that we havecollected from a sample of our members the Alliance is concerned that small to mid-sized fraternal benefit societies RBC Levels would be significantly impacted by theAcademy’s proposed changes. For instance, solely because of these changes small tomid-sized fraternal benefit societies, which are currently viable and financiallyhealthy insurers, could be pushed below the Company Action Level RBC and beunnecessarily subjected to further regulatory scrutiny.
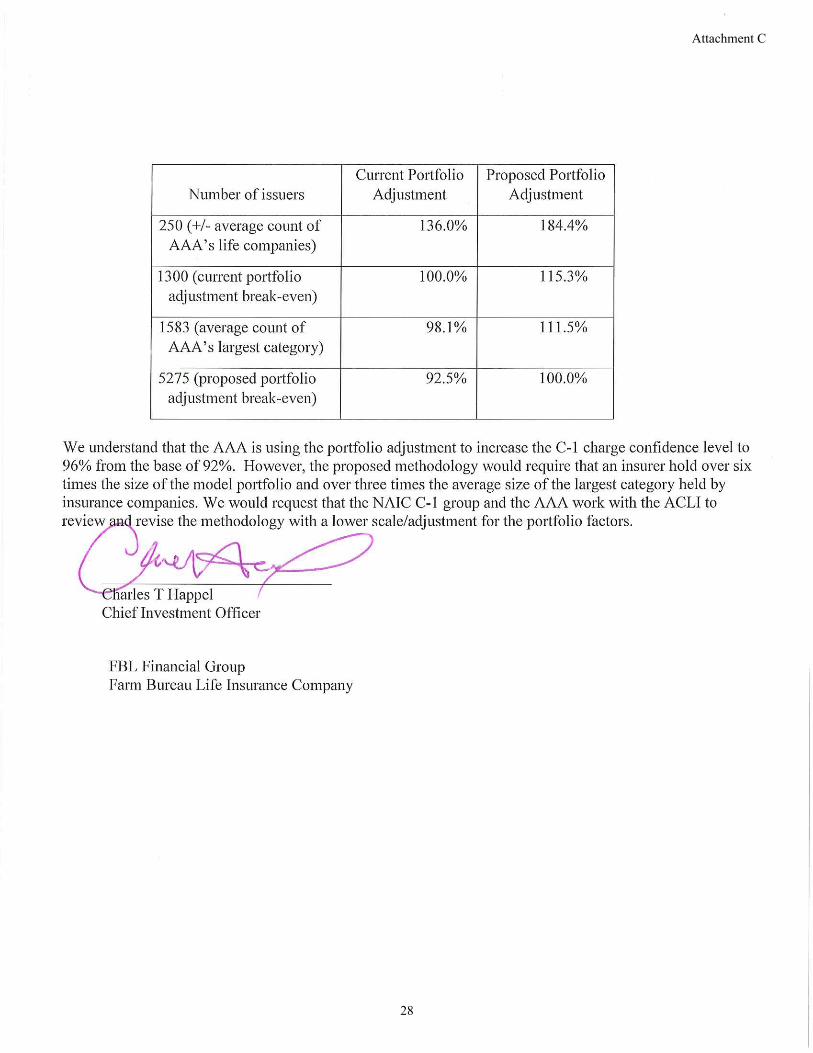
We appreciate the deliberate fashion in which NAIC is trying to address thismatter and welcome the opportunity to work with NAIC and other industryrepresentatives on this matter as it is expected to have significant negativeconsequences on small to mid-sized insurers.
Sincerely,
President and CEO
29
Attachment C

30
Attachment C
31
Attachment C
32
Attachment C
Ralph S. Blanchard, III FCAS, MAAA Vice President & Actuary Accounting Policy - Finance The Travelers Companies, Inc. One Tower Square Hartford, CT 06183 (860) 277-9975 (860) 954-3708 (fax) [email protected]
July 24, 2017 Kevin Fry, Chair NAIC’s Investment Risk-Based Capital Working Group ATTN: Julie L. Garber RE: Comments on the exposed report from the American Academy of Actuaries regarding bond
factors in all of the RBC formulas The Travelers Companies, Inc. (Travelers) appreciates the opportunity to comment on the exposed report from the American Academy of Actuaries regarding bond factors in all of the RBC formulas. Travelers is a leading provider of property and casualty (P&C) insurance products and services to a wide variety of businesses and organizations as well as individuals. Our products are distributed primarily through independent insurance agents and brokers throughout the United States and in selected international markets. Our comment letter deals exclusively with the Bond risk factors suggested for P&C and Health RBC, as shown on the exposed document’s Appendix C under the label “Alt 6/17”. Overall, we believe that the suggested factors for P&C and Health do not appear to be correct. They seem unreasonably high, so much so that it seems likely that some error or erroneous assumption likely occurred in their derivation. Specific reasons to question the suggested factors for P&C insurers include:
• The underlying analysis used a 10-year holding period for a hypothetical portfolio of bonds, despite the fact that bond durations for property/casualty insurers are typically far shorter. This is a major error in analysis, as the default probabilities are significantly higher for 10 year holding periods than they are for 5 year holding periods, and 5 year holding periods are far more typical of the P&C industry. As evidence of this we show the following average cumulative default rates by rating from the Moody’s Annual Default Study for corporate bonds (using data from 1983-2016, as found on page 37 of the study)”
5 yr 6 yr1 10 yr
Aaa 0.067% 0.100% 0.139% Aa 0.313% 0.408% 0.650% A 0.836% 1.111% 2.003% Baa 1.632% 2.049% 3.226% Ba 8.735% 10.444% 14.798% B 22.011% 25.702% 34.223%
1 We are aware that the American Academy of Actuaries is stating that 6 year holding periods is the average for the P&C industry. We believe that 5 year holding periods may be more typical (and consistent with our own stated bond duration of under 5 years), but have included a 6 year column in this table to reflect the Academy’s findings.
33
Attachment C
Based on the above, it seems likely that factors reflecting a 10 year holding period are as much as twice as high for investment grade bonds than a more correct holding period would have produced.
• The suggested factors were stated to be based on a 92% confidence level. With the portfolio adjustment factor, the Academy’s report states that the factors would represent a 96th percentile over a 10 year period. Ignoring for now that the P&C industry does not typically hold bonds for such a long average period, the major risks for P&C RBC are calibrated to only a 87.5th percentile. Combining risk factors for a major risk at an 87.5th percentile with risk factors for a minor risk at beyond the 96th percentile (as they reflect a holding period materially longer than is typical for P&C insurers) would result in a significant inconsistency within the P&C RBC formula.
• One stated reason to review the P&C RBC Bond risk factors at this time was to be consistent in the various RBC formula responses to bond risk. The theory is that the risk of holding an asset is independent of who holds it, accordingly, the risk charges should be consistent from one formula to the next. Yet this desire for consistent treatment is extremely inconsistent with regard to the proposed treatment of tax offsets. The Life RBC formula assumes that a troubled company would be able to fully utilize all tax credits resulting from bond defaults, while the P&C RBC formula assumes that a troubled company would not be able to utilize any tax credits for the same defaults. We have seen no evidence to support such inconsistent treatment. Absent such evidence, we would expect the proposal to be consistent between Life and P&C RBC with regard to tax offsets for bond defaults.
In summary, we believe that the suggested factors for P&C RBC Bond risk are flawed. We also note that the relative immateriality of Bond risk for P&C argues for a simplified solution to this problem. One such solution would be to use the same factors for P&C bond risk as for Life bond risk, i.e., have the P&C bond risk factors be equal to the life factors on an after-tax basis. This would be roughly consistent with adjusting the suggested factors for the use of a more realistic bond duration (5 years rather than 10, resulting in a 50% reduction in the factors), and the use of factors on an after-tax basis. Some adjustment would still be necessary for non-investment grade bonds to reflect the use of market value for such bonds held by P&C insurers vs. the amortized cost basis used by Life insurers.
34
Attachment C
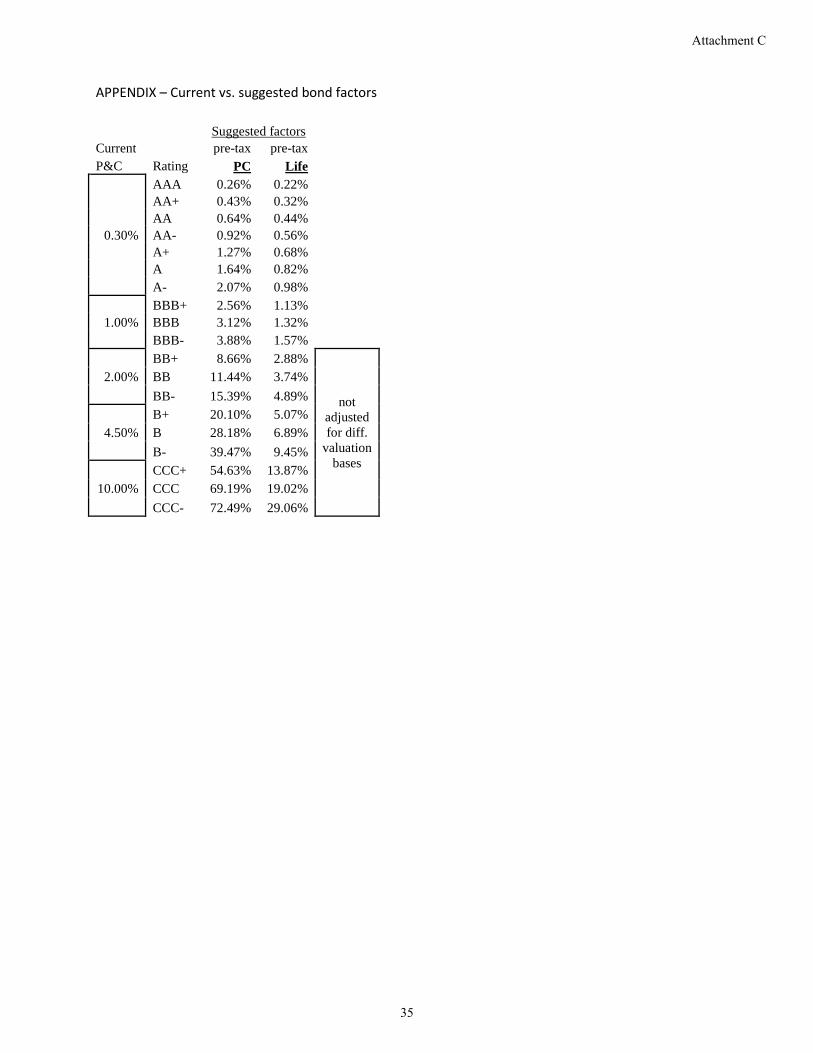
APPENDIX – Current vs. suggested bond factors
Suggested factors
Current
pre-tax pre-tax P&C Rating PC Life AAA 0.26% 0.22% AA+ 0.43% 0.32% AA 0.64% 0.44% 0.30% AA- 0.92% 0.56% A+ 1.27% 0.68% A 1.64% 0.82% A- 2.07% 0.98% BBB+ 2.56% 1.13% 1.00% BBB 3.12% 1.32% BBB- 3.88% 1.57% BB+ 8.66% 2.88%
not adjusted for diff.
valuation bases
2.00% BB 11.44% 3.74% BB- 15.39% 4.89% B+ 20.10% 5.07%
4.50% B 28.18% 6.89% B- 39.47% 9.45% CCC+ 54.63% 13.87% 10.00% CCC 69.19% 19.02% CCC- 72.49% 29.06%
35
Attachment C

36
Attachment C
1850 M Street NW Suite 300 Washington, DC 20036 Telephone 202 223 8196 Facsimile 202 872 1948 www.actuary.org
July 24, 2017 Via email to: [email protected] Kevin Fry Chair, Investment Risk-Based Capital (E) Working Group National Association of Insurance Commissioners c/o Julie Garber, Senior Manager—Solvency Regulation 1100 Walnut Street, Suite 1500 Kansas City, MO 64106-2197 Re: C1 Work Group Updated Recommendation of Corporate Bond Risk-Based
Capital Factors Dear Mr. Fry: The American Academy of Actuaries1 (“Academy”) Property and Casualty Risk-Based Capital Committee and Health Solvency Subcommittee is pleased to provide this response letter to the NAIC Investment Risk-Based Capital (E) Working Group (“IRBCWG”). This letter is in reference to the IRBCWG’s exposure of the American Academy of Actuaries C1 Work Group’s (“C1WG”) “Updated Recommendation of Corporate Bond Risk-Based Capital (“RBC”) Factors” letter dated June 8, 2017. IRBCWG Objectives—Basis for These Comments It is our understanding that the IRBCWG is considering implementing new life RBC fixed-income asset risk factors based on the work done by the C1WG and presented in the June 8, 2017, report titled “Updated Recommendation of Corporate Bond Risk-Based Capital Factors.” We understand that the IRBCWG is also considering implementing new property and casualty (“P&C”) and health fixed-income asset risk factors based on output from the C1WG’s corporate bond model, with certain adjustments. This letter sets forth some of the implications of, and issues related to, that change in the P&C and health fixed-income asset risk factors. 1 The American Academy of Actuaries is a 19,000-member professional association whose mission is to serve the public and the U.S. actuarial profession. For more than 50 years, the Academy has assisted public policymakers on all levels by providing leadership, objective expertise, and actuarial advice on risk and financial security issues. The Academy also sets qualification, practice, and professionalism standards for actuaries in the United States.
37
Attachment C
2
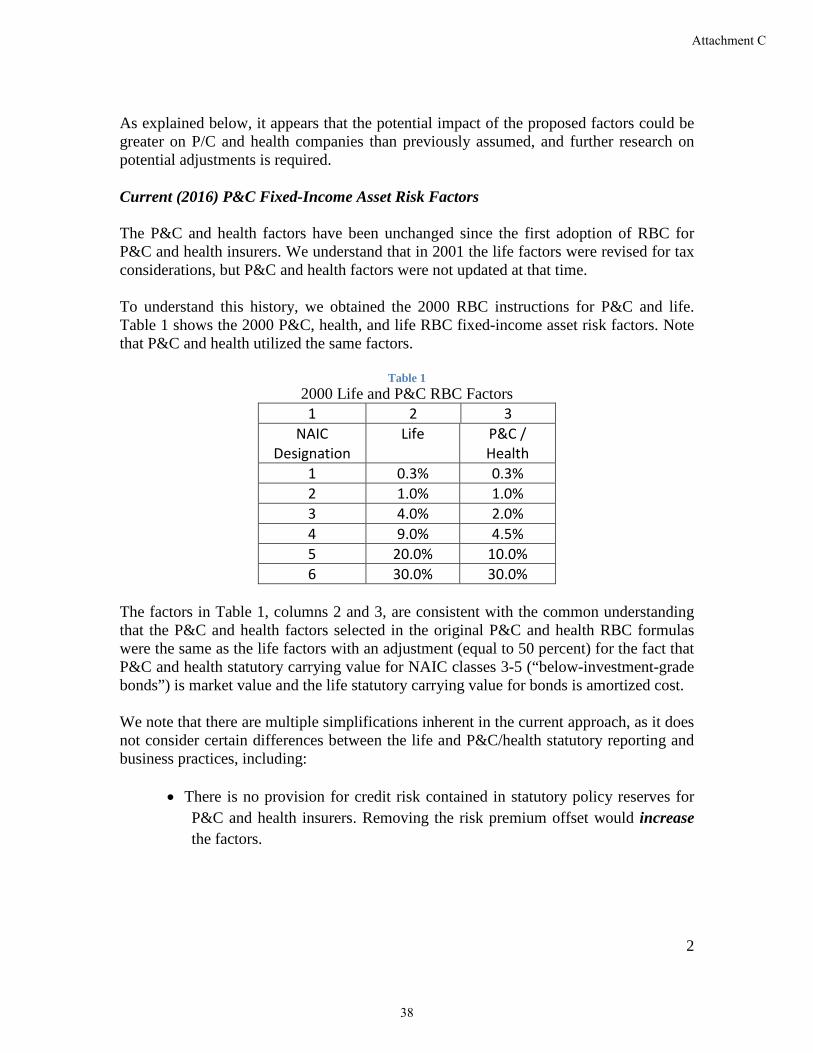
As explained below, it appears that the potential impact of the proposed factors could be greater on P/C and health companies than previously assumed, and further research on potential adjustments is required. Current (2016) P&C Fixed-Income Asset Risk Factors The P&C and health factors have been unchanged since the first adoption of RBC for P&C and health insurers. We understand that in 2001 the life factors were revised for tax considerations, but P&C and health factors were not updated at that time. To understand this history, we obtained the 2000 RBC instructions for P&C and life. Table 1 shows the 2000 P&C, health, and life RBC fixed-income asset risk factors. Note that P&C and health utilized the same factors.
Table 1 2000 Life and P&C RBC Factors 1 2 3
NAIC Designation
Life P&C / Health
1 0.3% 0.3% 2 1.0% 1.0% 3 4.0% 2.0% 4 9.0% 4.5% 5 20.0% 10.0% 6 30.0% 30.0%
The factors in Table 1, columns 2 and 3, are consistent with the common understanding that the P&C and health factors selected in the original P&C and health RBC formulas were the same as the life factors with an adjustment (equal to 50 percent) for the fact that P&C and health statutory carrying value for NAIC classes 3-5 (“below-investment-grade bonds”) is market value and the life statutory carrying value for bonds is amortized cost. We note that there are multiple simplifications inherent in the current approach, as it does not consider certain differences between the life and P&C/health statutory reporting and business practices, including:
• There is no provision for credit risk contained in statutory policy reserves for
P&C and health insurers. Removing the risk premium offset would increase the factors.
38
Attachment C
3
• P&C and health insurers typically have shorter duration assets. A number of speakers at IRBCWG meetings have expressed the view that an appropriate adjustment would decrease the factors.2
In addition, we have found minimal discussion of the basis for the 50 percent adjustment for below-investment-grade bonds.
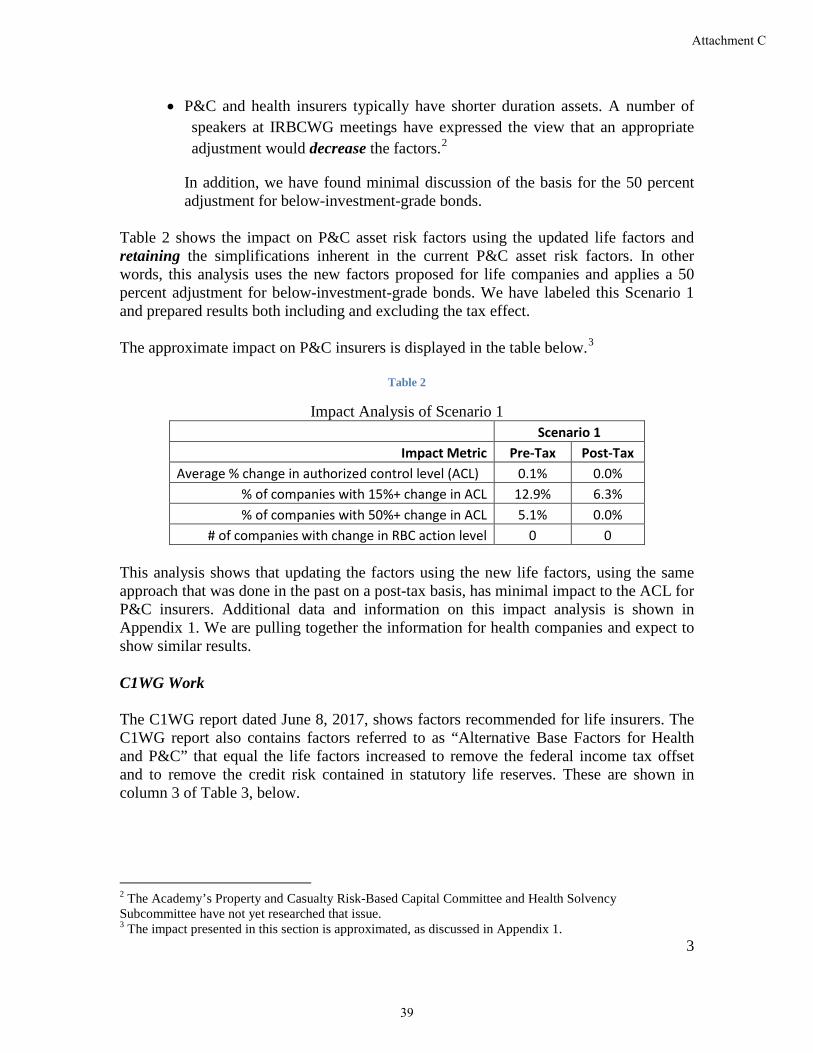
Table 2 shows the impact on P&C asset risk factors using the updated life factors and retaining the simplifications inherent in the current P&C asset risk factors. In other words, this analysis uses the new factors proposed for life companies and applies a 50 percent adjustment for below-investment-grade bonds. We have labeled this Scenario 1 and prepared results both including and excluding the tax effect. The approximate impact on P&C insurers is displayed in the table below.3
Table 2
Impact Analysis of Scenario 1 Scenario 1
Impact Metric Pre-Tax Post-Tax Average % change in authorized control level (ACL) 0.1% 0.0%
% of companies with 15%+ change in ACL 12.9% 6.3% % of companies with 50%+ change in ACL 5.1% 0.0%
# of companies with change in RBC action level 0 0
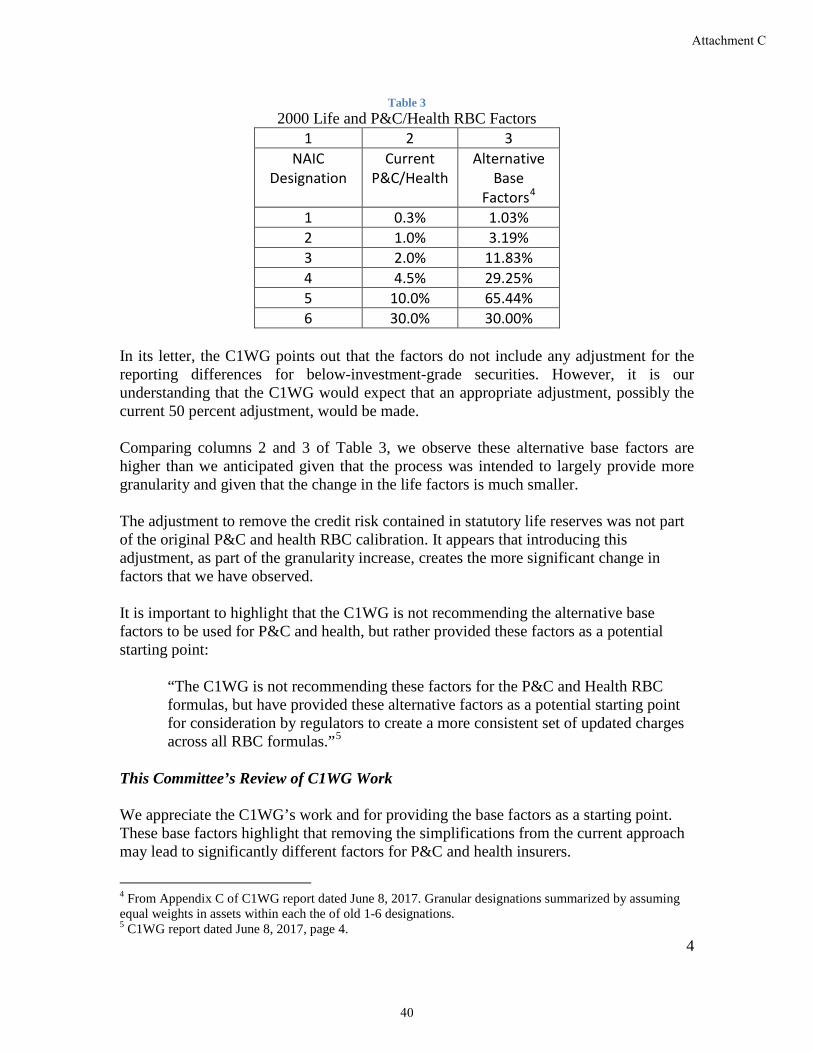
This analysis shows that updating the factors using the new life factors, using the same approach that was done in the past on a post-tax basis, has minimal impact to the ACL for P&C insurers. Additional data and information on this impact analysis is shown in Appendix 1. We are pulling together the information for health companies and expect to show similar results. C1WG Work The C1WG report dated June 8, 2017, shows factors recommended for life insurers. The C1WG report also contains factors referred to as “Alternative Base Factors for Health and P&C” that equal the life factors increased to remove the federal income tax offset and to remove the credit risk contained in statutory life reserves. These are shown in column 3 of Table 3, below.
2 The Academy’s Property and Casualty Risk-Based Capital Committee and Health Solvency Subcommittee have not yet researched that issue. 3 The impact presented in this section is approximated, as discussed in Appendix 1.
39
Attachment C
4
Table 3 2000 Life and P&C/Health RBC Factors
1 2 3 NAIC
Designation Current
P&C/Health Alternative
Base Factors4
1 0.3% 1.03% 2 1.0% 3.19% 3 2.0% 11.83% 4 4.5% 29.25% 5 10.0% 65.44% 6 30.0% 30.00%
In its letter, the C1WG points out that the factors do not include any adjustment for the reporting differences for below-investment-grade securities. However, it is our understanding that the C1WG would expect that an appropriate adjustment, possibly the current 50 percent adjustment, would be made. Comparing columns 2 and 3 of Table 3, we observe these alternative base factors are higher than we anticipated given that the process was intended to largely provide more granularity and given that the change in the life factors is much smaller. The adjustment to remove the credit risk contained in statutory life reserves was not part of the original P&C and health RBC calibration. It appears that introducing this adjustment, as part of the granularity increase, creates the more significant change in factors that we have observed. It is important to highlight that the C1WG is not recommending the alternative base factors to be used for P&C and health, but rather provided these factors as a potential starting point:
“The C1WG is not recommending these factors for the P&C and Health RBC formulas, but have provided these alternative factors as a potential starting point for consideration by regulators to create a more consistent set of updated charges across all RBC formulas.”5
This Committee’s Review of C1WG Work We appreciate the C1WG’s work and for providing the base factors as a starting point. These base factors highlight that removing the simplifications from the current approach may lead to significantly different factors for P&C and health insurers.
4 From Appendix C of C1WG report dated June 8, 2017. Granular designations summarized by assuming equal weights in assets within each the of old 1-6 designations. 5 C1WG report dated June 8, 2017, page 4.
40
Attachment C
5
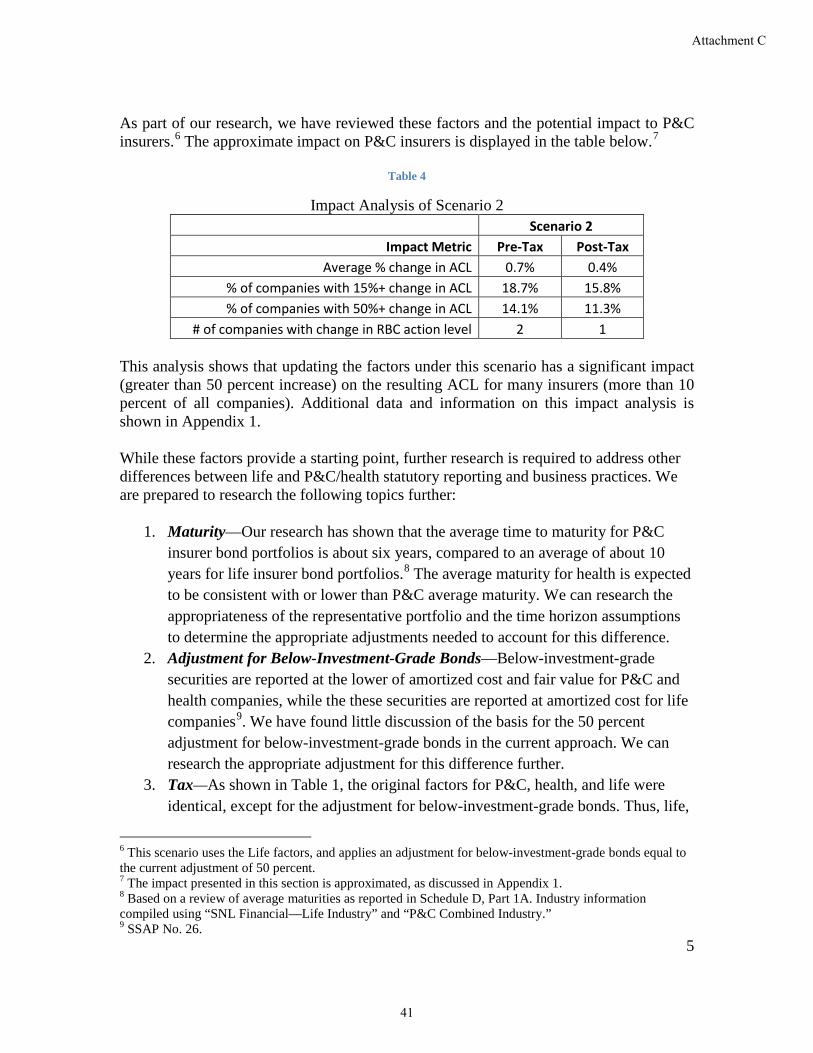
As part of our research, we have reviewed these factors and the potential impact to P&C insurers.6 The approximate impact on P&C insurers is displayed in the table below.7
Table 4
Impact Analysis of Scenario 2 Scenario 2
Impact Metric Pre-Tax Post-Tax Average % change in ACL 0.7% 0.4%
% of companies with 15%+ change in ACL 18.7% 15.8% % of companies with 50%+ change in ACL 14.1% 11.3%
# of companies with change in RBC action level 2 1
This analysis shows that updating the factors under this scenario has a significant impact (greater than 50 percent increase) on the resulting ACL for many insurers (more than 10 percent of all companies). Additional data and information on this impact analysis is shown in Appendix 1. While these factors provide a starting point, further research is required to address other differences between life and P&C/health statutory reporting and business practices. We are prepared to research the following topics further:
1. Maturity—Our research has shown that the average time to maturity for P&C insurer bond portfolios is about six years, compared to an average of about 10 years for life insurer bond portfolios.8 The average maturity for health is expected to be consistent with or lower than P&C average maturity. We can research the appropriateness of the representative portfolio and the time horizon assumptions to determine the appropriate adjustments needed to account for this difference.
2. Adjustment for Below-Investment-Grade Bonds—Below-investment-grade securities are reported at the lower of amortized cost and fair value for P&C and health companies, while the these securities are reported at amortized cost for life companies9. We have found little discussion of the basis for the 50 percent adjustment for below-investment-grade bonds in the current approach. We can research the appropriate adjustment for this difference further.
3. Tax—As shown in Table 1, the original factors for P&C, health, and life were identical, except for the adjustment for below-investment-grade bonds. Thus, life,
6 This scenario uses the Life factors, and applies an adjustment for below-investment-grade bonds equal to the current adjustment of 50 percent. 7 The impact presented in this section is approximated, as discussed in Appendix 1. 8 Based on a review of average maturities as reported in Schedule D, Part 1A. Industry information compiled using “SNL Financial—Life Industry” and “P&C Combined Industry.” 9 SSAP No. 26.
41
Attachment C
6
P&C, and health factors both considered taxes in the same way. In 2001, the life RBC formula was amended to show factors on a pre-tax basis, and then apply a tax adjustment later in the life RBC formula. This was not done for the P&C and health RBC formulas. We can research why the RBC view of the tax situation on default risk might be different for P&C and health companies than for life companies, and provide our analysis.
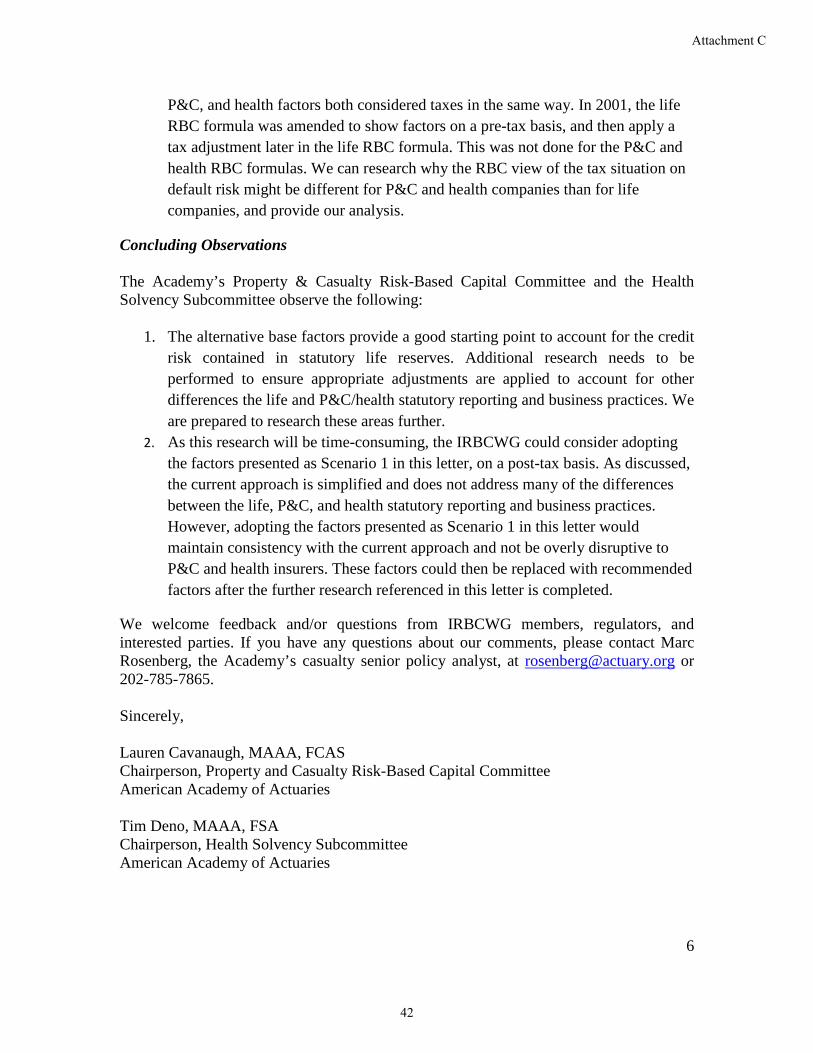
Concluding Observations The Academy’s Property & Casualty Risk-Based Capital Committee and the Health Solvency Subcommittee observe the following:
1. The alternative base factors provide a good starting point to account for the credit risk contained in statutory life reserves. Additional research needs to be performed to ensure appropriate adjustments are applied to account for other differences the life and P&C/health statutory reporting and business practices. We are prepared to research these areas further.
2. As this research will be time-consuming, the IRBCWG could consider adopting the factors presented as Scenario 1 in this letter, on a post-tax basis. As discussed, the current approach is simplified and does not address many of the differences between the life, P&C, and health statutory reporting and business practices. However, adopting the factors presented as Scenario 1 in this letter would maintain consistency with the current approach and not be overly disruptive to P&C and health insurers. These factors could then be replaced with recommended factors after the further research referenced in this letter is completed.
We welcome feedback and/or questions from IRBCWG members, regulators, and interested parties. If you have any questions about our comments, please contact Marc Rosenberg, the Academy’s casualty senior policy analyst, at [email protected] or 202-785-7865. Sincerely, Lauren Cavanaugh, MAAA, FCAS Chairperson, Property and Casualty Risk-Based Capital Committee American Academy of Actuaries Tim Deno, MAAA, FSA Chairperson, Health Solvency Subcommittee American Academy of Actuaries
42
Attachment C
7
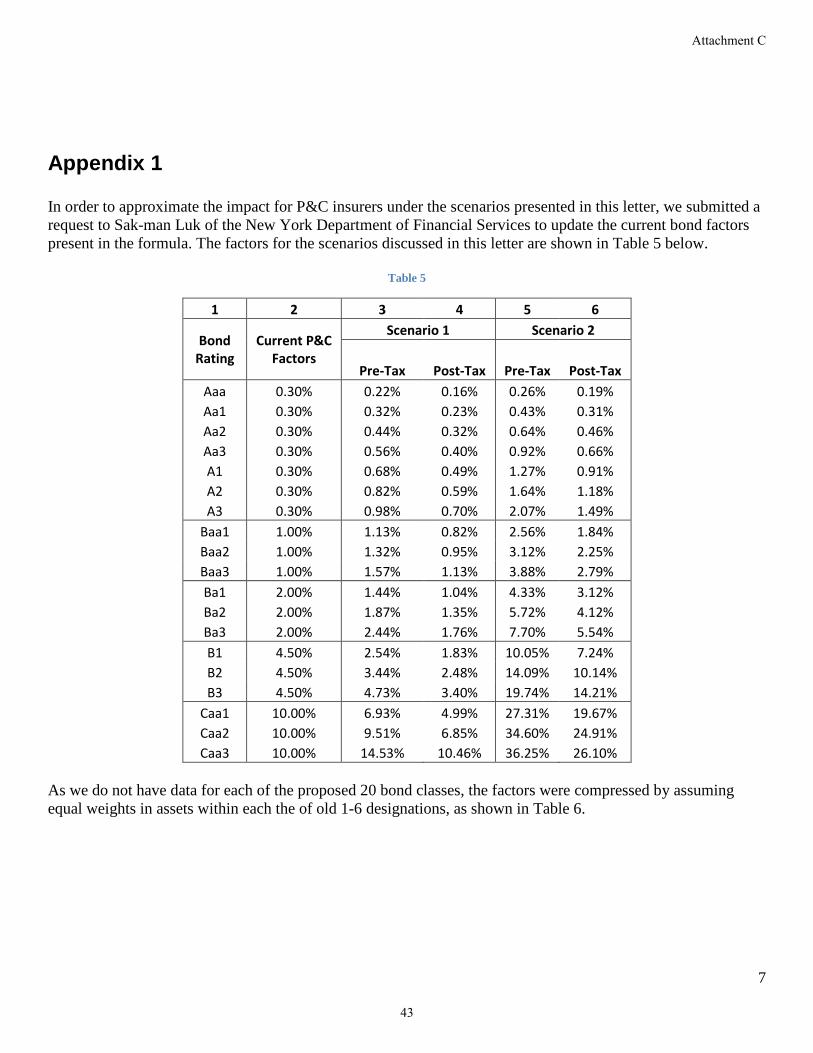
Appendix 1 In order to approximate the impact for P&C insurers under the scenarios presented in this letter, we submitted a request to Sak-man Luk of the New York Department of Financial Services to update the current bond factors present in the formula. The factors for the scenarios discussed in this letter are shown in Table 5 below.
Table 5
1 2 3 4 5 6
Bond Rating
Current P&C Factors
Scenario 1 Scenario 2
Pre-Tax Post-Tax Pre-Tax Post-Tax Aaa 0.30% 0.22% 0.16% 0.26% 0.19% Aa1 0.30% 0.32% 0.23% 0.43% 0.31% Aa2 0.30% 0.44% 0.32% 0.64% 0.46% Aa3 0.30% 0.56% 0.40% 0.92% 0.66% A1 0.30% 0.68% 0.49% 1.27% 0.91% A2 0.30% 0.82% 0.59% 1.64% 1.18% A3 0.30% 0.98% 0.70% 2.07% 1.49%
Baa1 1.00% 1.13% 0.82% 2.56% 1.84% Baa2 1.00% 1.32% 0.95% 3.12% 2.25% Baa3 1.00% 1.57% 1.13% 3.88% 2.79% Ba1 2.00% 1.44% 1.04% 4.33% 3.12% Ba2 2.00% 1.87% 1.35% 5.72% 4.12% Ba3 2.00% 2.44% 1.76% 7.70% 5.54% B1 4.50% 2.54% 1.83% 10.05% 7.24% B2 4.50% 3.44% 2.48% 14.09% 10.14% B3 4.50% 4.73% 3.40% 19.74% 14.21%
Caa1 10.00% 6.93% 4.99% 27.31% 19.67% Caa2 10.00% 9.51% 6.85% 34.60% 24.91% Caa3 10.00% 14.53% 10.46% 36.25% 26.10%
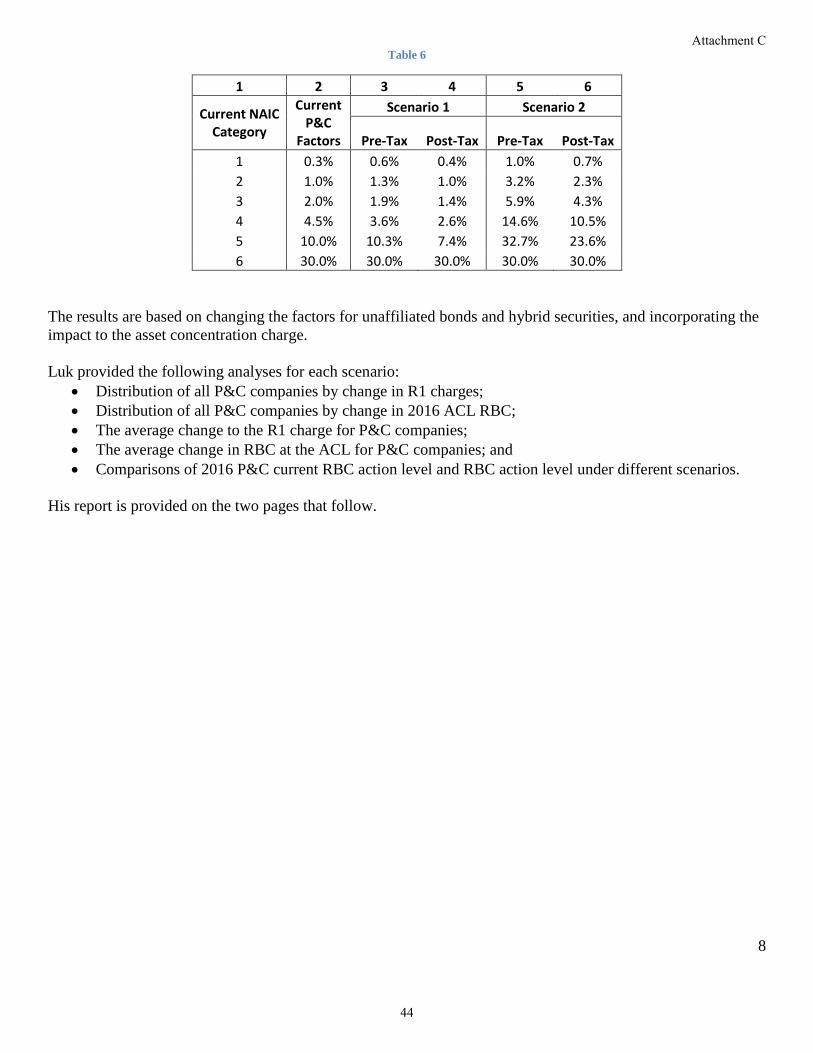
As we do not have data for each of the proposed 20 bond classes, the factors were compressed by assuming equal weights in assets within each the of old 1-6 designations, as shown in Table 6.
43
Attachment C
8
Table 6
1 2 3 4 5 6
Current NAIC Category
Current P&C
Factors
Scenario 1 Scenario 2
Pre-Tax Post-Tax Pre-Tax Post-Tax 1 0.3% 0.6% 0.4% 1.0% 0.7% 2 1.0% 1.3% 1.0% 3.2% 2.3% 3 2.0% 1.9% 1.4% 5.9% 4.3% 4 4.5% 3.6% 2.6% 14.6% 10.5% 5 10.0% 10.3% 7.4% 32.7% 23.6% 6 30.0% 30.0% 30.0% 30.0% 30.0%
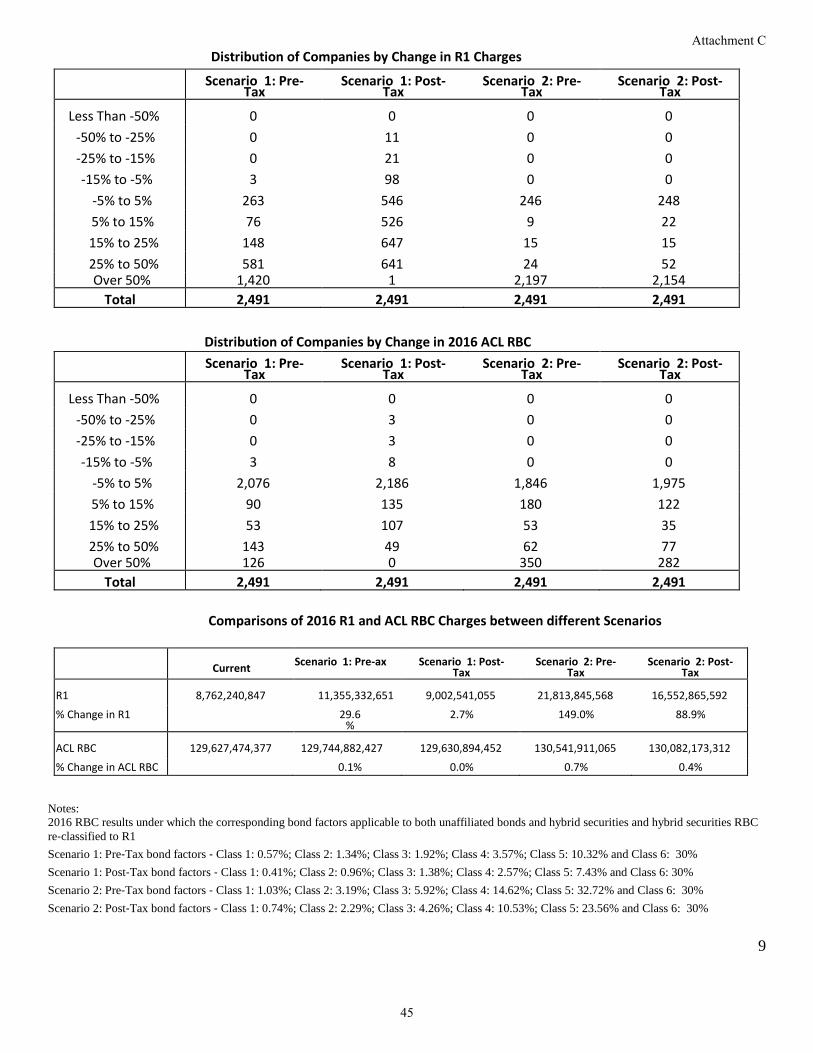
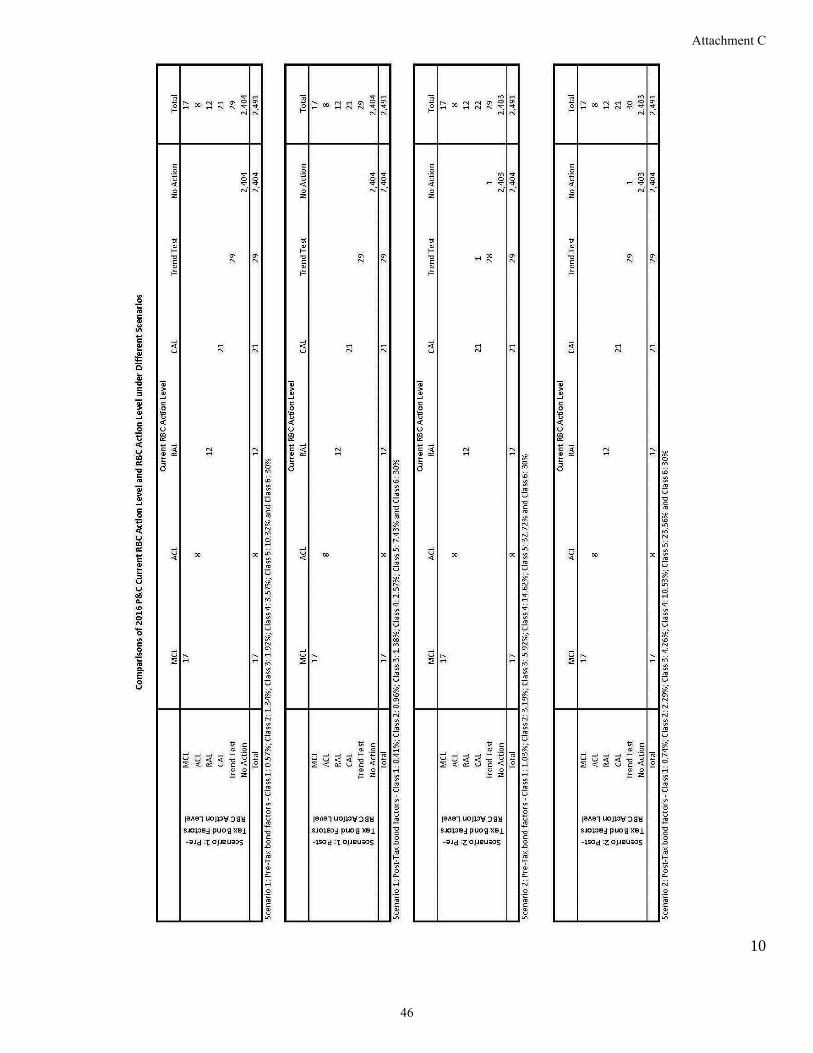
The results are based on changing the factors for unaffiliated bonds and hybrid securities, and incorporating the impact to the asset concentration charge. Luk provided the following analyses for each scenario:
• Distribution of all P&C companies by change in R1 charges; • Distribution of all P&C companies by change in 2016 ACL RBC; • The average change to the R1 charge for P&C companies; • The average change in RBC at the ACL for P&C companies; and • Comparisons of 2016 P&C current RBC action level and RBC action level under different scenarios.
His report is provided on the two pages that follow.
44
Attachment C
9
Distribution of Companies by Change in R1 Charges Scenario 1: Pre-
Tax Scenario 1: Post-
Tax Scenario 2: Pre-
Tax Scenario 2: Post-
Tax
Less Than ‐50% 0 0 0 0 ‐50% to ‐25% 0 11 0 0 ‐25% to ‐15% 0 21 0 0 ‐15% to ‐5% 3 98 0 0
‐5% to 5% 263 546 246 248 5% to 15% 76 526 9 22 15% to 25% 148 647 15 15 25% to 50% 581 641 24 52 Over 50% 1,420 1 2,197 2,154
Total 2,491 2,491 2,491 2,491
Distribution of Companies by Change in 2016 ACL RBC Scenario 1: Pre-
Tax Scenario 1: Post-
Tax Scenario 2: Pre-
Tax Scenario 2: Post-
Tax
Less Than ‐50% 0 0 0 0 ‐50% to ‐25% 0 3 0 0 ‐25% to ‐15% 0 3 0 0 ‐15% to ‐5% 3 8 0 0
‐5% to 5% 2,076 2,186 1,846 1,975 5% to 15% 90 135 180 122 15% to 25% 53 107 53 35 25% to 50% 143 49 62 77 Over 50% 126 0 350 282
Total 2,491 2,491 2,491 2,491
Comparisons of 2016 R1 and ACL RBC Charges between different Scenarios
Current Scenario 1: Pre-ax Scenario 1: Post-
Tax Scenario 2: Pre-
Tax Scenario 2: Post-
Tax
R1 8,762,240,847 11,355,332,651 9,002,541,055 21,813,845,568 16,552,865,592
% Change in R1 29.6%
2.7% 149.0% 88.9%
ACL RBC 129,627,474,377 129,744,882,427 129,630,894,452 130,541,911,065 130,082,173,312
% Change in ACL RBC 0.1% 0.0% 0.7% 0.4%
Notes: 2016 RBC results under which the corresponding bond factors applicable to both unaffiliated bonds and hybrid securities and hybrid securities RBC re‐classified to R1 Scenario 1: Pre‐Tax bond factors ‐ Class 1: 0.57%; Class 2: 1.34%; Class 3: 1.92%; Class 4: 3.57%; Class 5: 10.32% and Class 6: 30% Scenario 1: Post‐Tax bond factors ‐ Class 1: 0.41%; Class 2: 0.96%; Class 3: 1.38%; Class 4: 2.57%; Class 5: 7.43% and Class 6: 30% Scenario 2: Pre‐Tax bond factors ‐ Class 1: 1.03%; Class 2: 3.19%; Class 3: 5.92%; Class 4: 14.62%; Class 5: 32.72% and Class 6: 30% Scenario 2: Post‐Tax bond factors ‐ Class 1: 0.74%; Class 2: 2.29%; Class 3: 4.26%; Class 4: 10.53%; Class 5: 23.56% and Class 6: 30%
45
Attachment C
10
46
Attachment C
July 24, 2017
Mr. Kevin Fry, Chair
Investment Risk-Based Capital Working Group
National Association of Insurance Commissioners
2301 McGee Street, Suite 800
Kansas City, Missouri 64108-2662
Re: Comments on AAA Letter: Updated Recommendation for Corporate Bond Risk-
Based Capital (RBC) Factors dated June 8, 2017
Dear Mr. Fry,
America’s Health Insurance Plans (AHIP) appreciates the opportunity to provide these comments on the
exposure of the referenced American Academy of Actuaries’ Letter (“the Letter”). AHIP has followed
the development of processes to review the appropriateness of risk factors for various asset types since
2009.
As various projects have been completed by the Academy of Actuaries Life Practice Council, we have
noted that the models used contain assumptions that are intended to be appropriate when looking at asset
risks matched to life and annuity liabilities. We have commented on multiple occasions that such
modeling should be modified to reflect asset risks matched to health liabilities (of shorter duration and
generally less complexity than the life liabilities). This would allow for fair adjustments to the asset
factors for the Health RBC formula.
In review of the Letter, we have noted that some of the revisions to the assumptions in the Alternate Base
Factors would work to reduce the factors while others would increase the factors relative to those
proposed for the Life RBC formula. The Letter on page 8 applied adjustments expected to move in ways
that increased the factors but incorporated nothing to offset those adverse effects. As would be expected,
the resulting factors (in the column Alt 6/17) are unreasonable. We would oppose any consideration of
them as the basis for revising the bond factors to be used in the Health RBC formula.
It was our understanding that the Academy’s Health Practice Council, possibly in coordination with the
Academy’s Casualty Practice Council, was prepared to work to make the necessary modifications to the
new Life Corporate Bond model. AHIP and BCBSA members were also prepared to support the
Academy’s work with volunteer time. It seems the Working Group is moving ahead without waiting for
the results of those efforts. Consequently, we have attempted to provide some measure of the potential
adjustment necessary to reflect a portfolio of shorter duration bonds.
The AAA Life Practice Council model looks at a 10-year period during which no bonds mature. The
default rates are based on the initial bond classification and vary depending on the years from original
classification. A Health bond portfolio would be more likely to have shorter duration bonds to match the
health liabilities. This means that the bonds would potentially mature several times during the 10-year
47
Attachment C
July 24, 2017
Page 2
period. Replacing them with new bonds of the same rating classification would start the durational
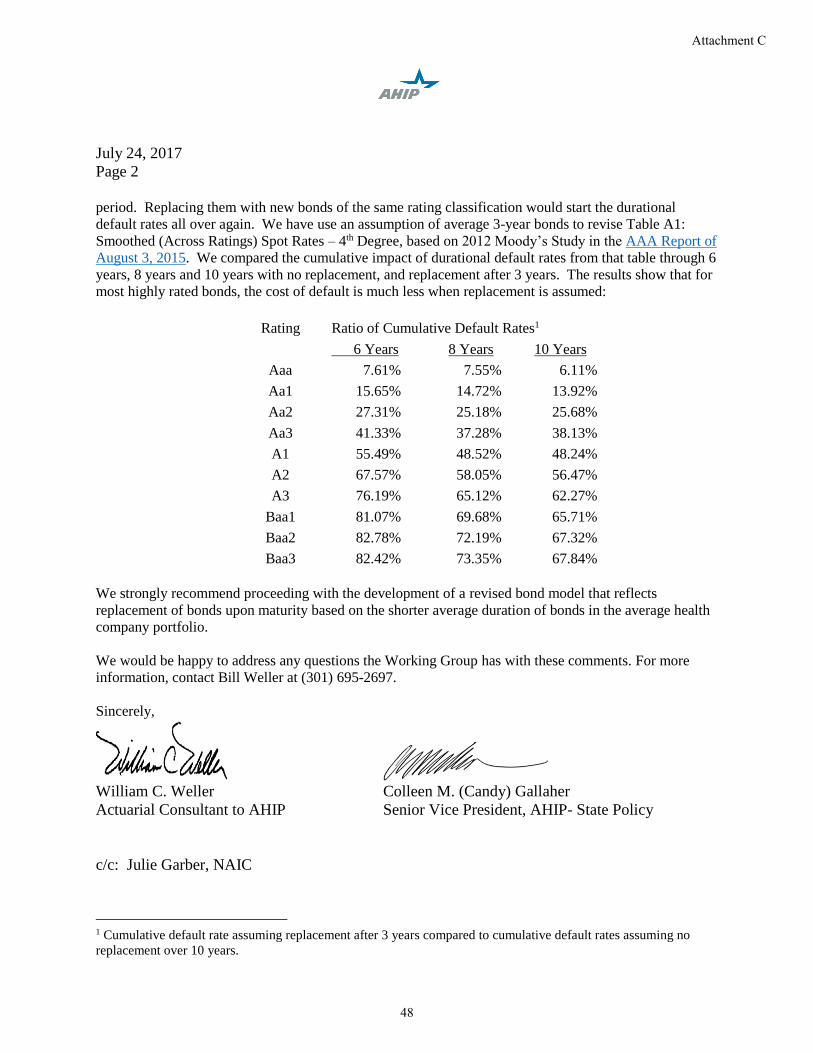
default rates all over again. We have use an assumption of average 3-year bonds to revise Table A1:
Smoothed (Across Ratings) Spot Rates – 4th Degree, based on 2012 Moody’s Study in the AAA Report of
August 3, 2015. We compared the cumulative impact of durational default rates from that table through 6
years, 8 years and 10 years with no replacement, and replacement after 3 years. The results show that for
most highly rated bonds, the cost of default is much less when replacement is assumed:
Rating Ratio of Cumulative Default Rates1
6 Years 8 Years 10 Years
Aaa 7.61% 7.55% 6.11%
Aa1 15.65% 14.72% 13.92%
Aa2 27.31% 25.18% 25.68%
Aa3 41.33% 37.28% 38.13%
A1 55.49% 48.52% 48.24%
A2 67.57% 58.05% 56.47%
A3 76.19% 65.12% 62.27%
Baa1 81.07% 69.68% 65.71%
Baa2 82.78% 72.19% 67.32%
Baa3 82.42% 73.35% 67.84%
We strongly recommend proceeding with the development of a revised bond model that reflects
replacement of bonds upon maturity based on the shorter average duration of bonds in the average health
company portfolio.
We would be happy to address any questions the Working Group has with these comments. For more
information, contact Bill Weller at (301) 695-2697.
Sincerely,
William C. Weller Colleen M. (Candy) Gallaher
Actuarial Consultant to AHIP Senior Vice President, AHIP- State Policy
c/c: Julie Garber, NAIC
1 Cumulative default rate assuming replacement after 3 years compared to cumulative default rates assuming no
replacement over 10 years.
48
Attachment C
July 24, 2017 Mr. Kevin Fry Chair, Investment Risk-Based Capital Working Group National Association of Insurance Commissioners 1100 Walnut Street, Suite 1500 Kansas City, MO 64106-2197 Attn: Julie Garber, NAIC Via E-mail: [email protected] Re: Bond Factors: All RBC Formulas Dear Mr. Fry: The National Association of Mutual Insurance Companies (NAMIC) appreciates the opportunity to comment on the proposed factors for fixed-income investments to apply to the RBC filing for year-end 2018. NAMIC is the largest property/casualty insurance trade association in in the United States, with more than 1,400 member companies representing 39 percent of the total U.S. market. NAMIC supports regional and local mutual insurance companies on main streets across the country and many of the country’s largest national and international insurers. NAMIC member companies serve more than 170 million policyholders and write more than $230 billion in annual premiums. Our members account for 54 percent of homeowners, 43 percent of automobile, and 32 percent of the business insurance markets in the United States. Through NAMIC advocacy programs we promote public policy solutions that benefit NAMIC member companies and the policyholders they serve and foster greater understanding and recognition of the unique alignment of interests between management and policyholders of mutual companies. The life, health, and property/casualty risk-based capital formulas have historically used the six RBC factor categories for bonds. This working group decided that more granularity was needed for the bond charges in the life formula; therefore, the decision to expand the number of categories from six to twenty for all three formulas was made to maintain consistency among the RBC formulas. NAMIC supports the decision to expand the number of categories, because implementing a two-structured approach would be difficult to manage for multi-line writers, many of which are NAMIC members. In addition, having a consistent structure allows for the recognition of the differences between the make-up of a property/casualty fixed income portfolio versus a life portfolio through the selection of different factors for those lines of businesses. NAMIC’s choice to support the working group decision on a more granular approach to investment risk was based in part on achieving a more risk-sensitive approach to RBC. As has
49
Attachment C
been noted in previous meetings of the working group, there are many open questions around the appropriateness of having differing factors in the RBC formula for the same asset. NAMIC holds the position that P/C insurers invest in asset classes based on the liabilities on their balance sheet, and we support the historical recognition that accounts for the differences between the different lines of businesses, including asset/liability duration, accounting, and taxing differences. P/C insurers, like life insurers, try to match cash flows as best they can based on the duration of their liabilities. By the nature of the products offered, P/C insurers hold shorter-duration bonds versus the longer duration fixed income bonds that life insurers typically hold. Consequently, P/C insurers have shorter investment cycles; therefore, reinvestment risk is lower. As well, the risk that corporations call their bonds is increased in a longer investment cycle. This is because in a longer duration cycle there is a greater chance of operating in a declining interest rate environment, a time when call risk increases. The different accounting treatment for fixed-income bonds between life insurers and P/C insurers is another reason why NAMIC supports a difference in factors. P/C insurers are required to report all NAIC 3-5 rated designations at the lower of fair value or amortized cost. Accordingly, the factors are applied to this cost-basis. In contrast, life insurers record NAIC 3-5 rated designations at amortized cost with the factors applied to this cost-basis. In effect, fixed-income bonds rated NAIC 3-5 are recorded at a lower value for P/C insurers than they are for life insurers. Having the same factors applied for these assets, even though they may be the same asset, does not seem appropriate, nor would it be risk-sensitive. In addition to the differences in carrying value, life insurers maintain an Asset Valuation Reserve (AVR) and an Interest Maintenance Reserve (IMR). These concepts don’t exist for P/C insurers and would need to be accounted for in determining factors to apply to the P/C formula. The presence of these concepts highlights a difference in how taxes are treated between the two formulas. As well, there are differences between how policy reserves are accounted for in the Academy model that should be included in future discussions. As it applies to the timing of the proposed changes, NAMIC has concern that the current timeline of the project, calling for a mid-2018 adoption of the factor changes and a 31 December 2018 target implementation date, is not enough time for companies to implement. The proposed timeline is concerning for a couple of reasons. Investment accounting system providers will not have adequate time to test and implement the proposed changes to meet the year-end 2018 deadline. Software providers can’t test the new factors until the Capital Adequacy Task Force adopts the factors and that may not be until mid-2018. This gives vendors very little time to code and test their products. Additionally, these changes also impact internal systems. The new rating categories have to be mapped into internal accounting systems and those can’t be updated until the vendor release is received. These delays further impact capital forecasting processes. Should these changes be adopted by the working group, we would ask you to consider the timing of the vendor releases so the industry has enough time to property update and test. In summary, NAMIC supports a more granular approach to investment risk. While it is widely understood that investment risk in the P/C formula is not as material as it is for the life formula, individual P/C companies may be impacted significantly. We understand why the working group chose to work on the C1 factors in the life formula first and we support the process used to develop those factors. As the working group turns its attention to the P/C formula, we urge them to use a similar process. Although it may be faster and more efficient to develop a way to account
50
Attachment C

for the key differences between the lines of business, we maintain that more granular approach would achieve the goal of consistency while recognizing these key differences. Thank you for your consideration of these comments. If there are any questions please feel free to contact me at 317-876-4206. Respectfully submitted,
Jonathan Rodgers Financial Regulation Manager National Association of Mutual Insurance Companies
51
Attachment C