Embed Size (px)
Citation preview

Timothy P. Cleary
Site Vice President
Sequoyah Nuclear Plant
April 28, 2009
Tennessee Valley Authority
Post Office Box 2000
Soddy Daisy, Tennessee 37384-2000
U.S. Nuclear Regulatory Commission
ATTN: Document Control Desk
Washington, D.C. 20555
Gentlemen:
In the Matter of
Tennessee Valley Authority (TVA)
Docket Nos. 50-327
50-328
SEQUOYAH NUCLEAR PLANT (SQN) - ANNUAL RADIOLOGICAL ENVIRONMENTAL
OPERATING REPORT - 2008
Enclosed is the subject report for the period of January 1 to December 31, 2008. This
report is being submitted as required by SQN Technical Specification 6.9.1.6 and SQN's
Offsite Dose Calculation Manual Administrative Control Section 5.1.
If you have any questions concerning this report, please contact Beth A. Wetzel at
(423)843-7170.
Sincerely,
Timothy P. Cleary
Enclosure
printed on recycled paper

U.S. Nuclear Regulatory Commission
Page 2
April 28, 2009
cc (Enclosure):
Mr. Tracy J. Orf, Project Manager
U.S. Nuclear Regulatory Commission
Mail Stop 08G-9a
One White Flint North
11555 Rockville Pike
Rockville, Maryland 20852-2739

U.S. Nuclear Regulatory Commission
Page 2
April 28, 2009
BAW:JWP:SKD
cc (Enclosure):
Mr. Tracy J. Orf, Project Manager
U.S. Nuclear Regulatory Commission
Mail Stop 08G-9a
One White Flint North
11555 Rockville Pike
Rockville, Maryland 20852-2739
cc (w/o Enclosure):
G.Arent, EQB1B-WBN
T. J. Bradshaw (NSRB Support), LP 4K-C
C. R. Church, POB 2B-SQN
D. E. Jernigan, LP 3R-C
K. R. Jones, OPS 4A-SQN
R. M. Kerwin, OPS 4A-SQN
M. J. Lorek, LP 3R-C
L. E. Nicholson, LP 3R-C
M. A. Purcell, LP 4K-C
P. D. Swafford, LP 3R-C
L. E. Thibault, LP 3R-C
S. A. Vance, ET 10A-K
E. J. Vigluicci, ET10A-K
WBN Site Licensing Files, ADM 1L-WBN
EDMS, WT CA-K
l:License/Annual Reports/2008/2008 AREOR

ENCLOSURE
ANNUAL RADIOLOGICAL ENVIRONMENTAL OPERATING REPORT
SEQUOYAH NUCLEAR PLANT
2008

Annual
Radiological
Environmental
Operating Report
Sequoyah
Nuclear Plant
2008

ANNUAL RADIOLOGICAL ENVIRONMENTAL OPERATING REPORT
SEQUOYAH NUCLEARPLANT
2008
TENNESSEE VALLEY AUTHORITY
April 2009

TABLE OF CONTENTS
Table of Contents ii
Executive Summary 1
Introduction 2
Naturally Occurring and Background Radioactivity 2
Electric Power Production 4
Site/Plant Description 6
Radiological Environmental Monitoring Program 7
Direct Radiation Monitoring 10
Measurement Techniques 10
Results 11
Atmospheric Monitoring 13
Sample Collection and Analysis 13
Results 14
Terrestrial Monitoring 15
Sample Collection and Analysis 15
Results 16
Liquid Pathway Monitoring 18
Sample Collection and Analysis 18
Results 19
Assessment and Evaluation 21
Results 21
Conclusions 22
References 23
-n-

Appendix A Radiological Environmental Monitoring Program and
Sampling Locations 27
Appendix B 2008 Program Modifications 38
Appendix C Program Deviations 40
Appendix D Analytical Procedures 43
Appendix E Nominal Lower Limits ofDetection (LLD) 46
Appendix F Quality Assurance/Quality Control Program 51
Appendix G Land Use Survey 56
Appendix H Data Tables and Figures 62
-in-

LIST OF TABLES
Table 1 Comparison ofProgram Lower Limits ofDetection with Regulatory
Limits for Maximum Annual Average Effluent Concentrations
Released to Unrestricted Areas and Reporting Levels 24
-IV-

LIST OF FIGURES
Figure 1 Tennessee Valley Region 25
Figure 2 Environmental Exposure Pathways ofMan Due
to Releases ofRadioactive Materials to the
Atmosphere and Lake 26
-v-

EXECUTIVE SUMMARY
This report describes the radiological environmental monitoring program (REMP) conducted by
TVA in the vicinity of the Sequoyah Nuclear Plant (SQN) in 2008. The program includes the
collection of samples from the environment and the determination of the concentrations of
radioactive materials in the samples. Samples were collected from locations in the general area
of the plant and from areas that would not be influenced by plant operations. Monitoring
includes the sampling of air, water, milk, foods, soil, fish, shoreline sediment and the
measurement of direct radiation levels. Results from stations near the plant are compared with
data from control stations and with preoperational measurements to determine potential impacts
of site operations.
The vast majority of radioactivity measured in environmental samples from the SQN
program resulted from naturally occurring radioactive materials. Trace quantities of cesium-137
(Cs-137) were measured in soil, shoreline sediment, and fish. Strontium-90 (Sr-90) at very low
levels was detected in milk samples. The concentrations were typical ofthe levels expected to be
present in the environment from past nuclear weapons testing or operation of other nuclear
facilities in the region. Tritium at concentrations slightly above the analytical detection limit was
detected in a limited number of water samples collected from Chickamauga Reservoir. These
levels would not represent a significant contribution to the radiation exposure to Members of the
Public.

INTRODUCTION
This report describes and summarizes the results of radioactivity measurements made in the
vicinity of SQN and laboratory analyses of samples collected in the area. The measurements are
made to comply with the requirements of the Code ofFederal Regulations (CFR), 10 CFR 50,
Appendix A, Criterion 64 and 10 CFR 50, Appendix I, Sections IV.B.2, IV.B.3 and IV.C, and to
determine potential effects on public health and safety. This report satisfies the annual reporting
requirements of SQN Plant Technical Specification (TS) 6.9.1.6 and Offsite Dose Calculation
Manual (ODCM) Administrative Control 5.1. The data presented in this report include results
from the prescribed program and other information to help correlate the significance of results
measured by this monitoring program to the levels of environmental radiation resulting from
naturally occurring radioactive materials.
Naturally Occurring and Background Radioactivity
Many materials in our world contain trace amounts of naturally occurring radioactivity. For
example, approximately 0.01 percent of all potassium is radioactive potassium-40 (K-40) which
has a half-life of 1.3 billion years. An individual weighing 150 pounds contains about 140 grams
ofpotassium (Reference 1). This is equivalent to approximately 100,000 picoCuries (pCi) of
K-40 which delivers a dose of 15 to 20 mrem per year to the bone and soft tissue of the body.
Other examples of naturally occurring radioactive materials are beryllium (Be)-7, bismuth (Bi)-
212 and 214, lead (Pb)-212 and 214, thallium (TI)-208, actinium (Ac)-228, uranium (U)-238 and
235, thorium (Th)-234, radium (Ra)-226, radon (Rn)-222, carbon (C)-14, and hydrogen (H)-3
(generally called tritium). These naturally occurring radioactive materials are in the soil, our
food, our drinking water, and our bodies. The radiation from these materials makes up a part of
the low level natural background radiation. The remainder of the natural background radiation is
produced by cosmic rays. The relative hazard of different types of radiation sources can be
compared by evaluating the amount of radiation the U.S. population receives from each type of
radiation source as displayed in the following table. This table was adapted from References 2
and 3.
-2-

U.S. GENERAL POPULATION AVERAGE DOSE EQUIVALENT ESTIMATES
Source Millirem/Year Per Person
Natural background dose equivalent
Cosmic 27
Cosmogenic 1
Terrestrial 28
In the body 39
Radon 200
Total 295
Release of radioactive material in
natural gas, mining, ore processing, etc. 5
Medical (effective dose equivalent) 53
Nuclear weapons fallout less than 1
Nuclear energy 0.28
Consumer products 0.03
Total 355 (approximately)
As can be seen from the table, natural background radiation dose equivalent to the U.S.
population normally exceeds that from nuclear plants by several hundred times. The 0.28 mrem
attributable to nuclear plant operations results in a population radiation dose equivalent which is
insignificant compared to that which results from natural background radiation.
-3-

Electric Power Production
Nuclear power plants are similar in many respects to conventional coal burning (or other fossil
fuel) electric generating plants. The basic process behind electrical power production in both
types ofplants is that fuel is used to heat water to produce steam which provides the force to turn
turbines and generators. In a nuclear power plant, the fuel is uranium and the heat is produced in
the reactor through the fission of the uranium. Nuclear plants include many complex systems to
control the nuclear fission process and to safeguard against the possibility of reactor malfunction.
The nuclear reactions produce radionuclides commonly referred to as fission and activation
products. Very small amounts of these fission and activation products are released into the plant
systems. This radioactive material can be transported throughout plant systems and some of it
released to the environment.
The pathways through which radioactivity is released are monitored. Liquid and gaseous
effluent monitors record the radiation levels for each release. These monitors provide alarm
mechanisms to prompt termination of release above limits.
Releases are monitored at the onsite points of release and through the environmental monitoring
program which measures the environmental radiation in areas around the plant. In this way, not
only is the release of radioactive materials from the plant tightly controlled, but measurements
are made in surrounding areas to verify that the population is not being exposed to significant
levels of radiation or radioactive materials.
The SQN ODCM, which is required by the plant Technical Specifications, prescribes limits for
the release of radioactive effluents, as well as limits for doses to the general public from the
release of these effluents.
-4-

The dose to a member of the general public from radioactive materials released to unrestricted
areas, as given in Nuclear Regulatory Commission (NRC) guidelines and the ODCM, is limited
as follows:
Liquid Effluents
Total body <3 mrem/year
Any organ <10 mrem/year
Gaseous Effluents
Noble gases:
Gamma radiation <10 mrad/year
Beta radiation <20 mrad/year
Particulates:
Any organ <15 mrem/year
The Environmental Protection Agency (EPA) limits for the total dose to the public in the vicinity
of a nuclear power plant, established in the Environmental Dose Standard of40 CFR 190, are as
follows:
Total body <25 mrem/year
Thyroid <75 mrem/year
Any other organ <25 mrem/year
Appendix B to 10 CFR 20 presents annual average limits for the concentrations of radioactive
materials released in gaseous and liquid effluents at the boundary of the unrestricted areas.
Table 1 of this report compares the nominal lower limits (LLD) of detection for the SQN
monitoring program with the regulatory limits for maximum annual average effluent
concentrations released to unrestricted areas and levels requiring special reports to the NRC. It
should be noted that the levels of radioactive materials measured in the environment are typically
only slightly above the lower limit of detection. The data presented in this report indicate
compliance with the regulations.
-5-

SITE/PLANT DESCRIPTION
Sequoyah is located on a site near the geographical center ofHamilton County, Tennessee, on a
peninsula on the western shore of Chickamauga Lake at Tennessee River Mile (TRM) 484.5.
Figure 1 shows the site in relation to other TVA projects. The SQN site, containing
approximately 525 acres, is approximately 7.5 miles northeast of the nearest city limit of
Chattanooga, Tennessee, 14 miles west-northwest of Cleveland, Tennessee, and approximately
31 miles south-southwest of TVAfs Watts Bar Nuclear Plant (WBN) site.
Population is distributed unevenly within 10 miles of the SQN site. Approximately 60 percent of
the population is in the general area between 5 and 10 miles from the plant in the sectors ranging
from the south, clockwise, to the northwest sector. This concentration is a reflection of suburban
Chattanooga and the town of Soddy-Daisy. This area is characterized by considerable vacant
land with scattered residential subdivisions. Residential subdivision growth has continued within
a 10-mile radius of the plant. There is also some small-scale farming and at least one dairy farm
located within 5 miles of the plant.
Chickamauga Reservoir is one of a series of highly controlled multiple-use reservoirs located on
the Tennessee River whose primary uses are flood control, navigation, and the generation of
electric power. Secondary uses include industrial and public water supply and waste disposal,
commercial fishing, and recreation. Public access areas, boat docks, and residential subdivisions
have been developed along the reservoir shoreline.
SQN consists of two pressurized water reactors. Fuel was loaded in Unit 1 on March 1, 1980,
and the unit achieved criticality on July 5, 1980. Fuel was loaded in Unit 2 in July 1981, and the
unit achieved initial criticality on November 5,1981.
-6-

RADIOLOGICAL ENVIRONMENTAL MONITORING PROGRAM
Most ofthe radiation and radioactivity generated in a nuclear power reactor is contained within
the reactor itself or one of the other plant systems. Plant effluent monitors are designed to detect
the small amounts ofradioactive material released to the environment. Environmental
monitoring provides a final verification that the systems are performing as planned. The
monitoring program is designed to monitor the pathways between the plant and the general
public in the immediate vicinity. Sample types are chosen so that the potential for detection of
radioactivity in the environment will be maximized. The radiological environmental monitoring
program is outlined in Appendix A.
There are two primary pathways by which radioactivity can move through the environment to
humans: air and water (see Figure 2). The air pathway can be separated into two components:
the direct (airborne) pathway and the indirect (ground or terrestrial) pathway. The direct
airborne pathway consists of direct radiation and inhalation by humans. In the terrestrial
pathway, radioactive materials may be deposited on the ground or on plants and subsequently be
ingested by animals and/or humans. Human exposure through the liquid pathway may result
from drinking water, eating fish, or by direct exposure at the shoreline. The types of samples
collected in this program are designed to monitor these pathways.
A number of factors were considered in determining the locations for collecting environmental
samples. The locations for the atmospheric monitoring stations were determined from a critical
pathway analysis based on weather patterns, dose projections, population distribution, and land
use. Terrestrial sampling stations were selected after reviewing such factors as the locations of
dairy animals and gardens in conjunction with the air pathway analysis. Liquid pathway stations
were selected based on dose projections, water use information, and availability ofmedia such as
fish and sediment. Table A-2 (Appendix A, Table 2: This identification system is used for all
tables and figures in the appendices.) lists the sampling stations and the types of samples
collected. Modifications made to the SQN monitoring program in 2008 are described in
Appendix B. Deviations from the sampling and analysis schedule are presented in Appendix C.
-7-

To determine the amount of radioactivity in the environment prior to the operation of SQN, a
preoperational radiological environmental monitoring program was initiated in 1971 and
operated until the plant began operation in 1980. Measurements of the same types of radioactive
materials that are measured currently were assessed during the preoperational phase to establish
normal background levels for various radionuclides in the environment. The knowledge ofpre
existing radionuclide patterns in the environment permits a determination, through comparison
and trending analyses, of any impact on the environment due to the operation of SQN.
The determination of impact from the plant during the operating phase also utilizes the data from
control stations that have been established in the monitoring program. Results of environmental
samples taken at control stations (far from the plant) are compared with those from indicator
stations (near the plant) to establish the extent of SQN influence.
Samples are analyzed by TVA's Environmental Radiological Monitoring and Instrumentation
(ERM&I) group located at the Western Area Radiological Laboratory (WARL) in Muscle
Shoals, Alabama, with the exception of the Sr-89, 90 analysis of soil samples which was
performed by a contract laboratory. Analyses are conducted in accordance with written and
approved procedures and are based on accepted methods. A summary of the analysis techniques
and methodology is presented in Appendix D. Data tables summarizing the sample analysis
results are presented in Appendix H.
The radiation detection devices and analysis methods used to determine the radionuclide content
of samples collected in the environment are very sensitive to small amounts of radioactivity. The
sensitivity of the measurements process is defined in terms of the lower limit of detection. A
description of the nominal LLDs for the radioanalytical laboratory is presented in Appendix E.
The ERM&I laboratory employs a comprehensive quality assurance/quality control program to
monitor laboratory performance throughout the year. The program is intended to detect any
problems in the measurement process as soon as possible so they can be corrected. This program
includes equipment checks, to ensure that the radiation detection instruments are working
-8-

properly, and the analysis of quality control samples. In 2008, the laboratory participated in a
blind cross check program administrated by a vendor. This program provided an independent
interlaboratory comparison program. A complete description of the laboratory's quality
assurance/quality control program is presented in Appendix F.
-9-

DIRECT RADIATION MONITORING
Direct radiation levels are measured at various monitoring points around the plant site.
These measurements include contributions from cosmic radiation, radioactivity in the
ground, fallout from atmospheric nuclear weapons tests conducted in the past, and any
radioactivity that may be present as a result of plant operations. Because of the relatively
large variations in background radiation as compared to the small levels from the plant,
contributions from the plant may be difficult to distinguish.
Measurement Techniques
The Landauer InLight environmental dosimeter is used in the radiological environmental
monitoring program for the measurement of direct radiation. This dosimeter contains
four elements consisting of aluminum oxide detectors with varying plastic and copper
filtrations to provide qualitative information about conditions during the exposure.
The dosimeters are placed approximately 1 meter above the ground, with two at each
monitoring location. Sixteen monitoring points are located around the plant near the site
boundary, one location in each of the 16 compass sectors. One monitoring point is also
located in each of the 16 compass sectors at a distance of approximately four to five miles
from the plant.
Dosimeters are also placed at additional monitoring locations out to approximately 32
miles from the site. The dosimeters are exchanged every 3 months. The dosimeters are
sent to Landauer for processing and results reporting. The values are corrected for
transit and shielded background exposure. An average of the two dosimeter results is
calculated for each monitoring point. The system meets or exceeds the performance
specifications outlined in American National Standard Institute (ANSI) Standard N545-1975
and Health Physics Society (HPS) Draft Standard N13.29 for environmental applications of
dosimeters.
-10-

Results
The results for environmental dosimeter measurements are normalized to a standard
quarter (91.25 days or 2190 hours). The monitoring locations are grouped according to
the distance from the plant. The first group consists of all monitoring points within 2
miles of the plant. The second group is made up of all locations greater than 2 miles
from the plant. Past data have shown that the average results from the locations more
than 2 miles from the plant are essentially the same. Therefore, for purposes of this
report, monitoring points 2 miles or less from the plant are identified as "onsite" stations
and locations greater than 2 miles are considered "offsite."
The quarterly gamma radiation levels determined from the dosimeters deployed around
SQN in 2008 are summarized in Table H-l. The exposures are measured in
milliroentgens (mR). For purposes of this report, one milliroentgen, one millirem
(mrem) and one millirad (mrad) are assumed to be numerically equivalent.
The rounded average annual exposures, as measured in 2008, are shown below. For
comparison purposes, the average direct radiation measurements made in the
preoperational phase of the monitoring program are also shown.
Annual SQN Average
Direct Radiation Levels
mR/Year
2008 1976-79
Onsite Stations 39 79
Offsite Stations 34 63
The data in Table H-l indicate that the average quarterly direct radiation levels at the
SQN onsite stations are approximately 1.3 mR/quarter higher than levels at the offsite
stations. This difference is consistent with levels measured for the preoperation and
construction phases ofTVA nuclear power plant sites where the average levels onsite
were slightly higher than levels offsite. Figure H-l compares plots of the data from the
-11-

onsite stations with those from the offsite stations over the period from 1976 through 2008.
The results from the Landauer InLight dosimeters are lower across all locations when compared
to the results previously obtained using the Panasonic UD-814 dosimeters. This difference is
most likely due to the manner in how background badge data was applied for
the in house processing ofPanasonic dosimeters as compared to the method used by the vendor.
The data in Table H-2 contains the results of the individual monitoring stations. The results
reported in 2008 are consistent with direct radiation levels identified at locations which are not
influenced by the operation of SQN. There is no indication that SQN activities increased the
background radiation levels normally observed in the areas surrounding the plant.
-12-

ATMOSPHERIC MONITORING
The atmospheric monitoring network is divided into three groups identified as local, perimeter,
and remote. Four local air monitoring stations are located on or adjacent to the plant site in the
general directions of greatest wind frequency. Four perimeter air monitoring stations are located
in communities out to about 10 miles from the plant, and four remote air monitors are located out
to approximately 20 miles. The monitoring program and the locations of monitoring stations are
identified in the tables and figures of Appendix A. The remote stations are used as control or
baseline stations.
Sample Collection and Analysis
Air particulates are collected by continuous sampling of air at a flow rate of approximately 2
cubic feet per minute (cfrn) through a 2-inch glass fiber filter. The sampling system consists of a
pump, magnehelic gauge for measuring the drop in pressure across the system, and a dry gas
meter to measure the volume of air sampled. This sampling system is housed in a metal
building. The filter is contained in a sampling head mounted on the outside of the monitor
building. The filter is replaced weekly. Each filter is analyzed for gross beta activity about 3
days after collection to allow time for the radon daughters to decay. Every 4 weeks composites
of the filters from each location are analyzed by gamma spectroscopy.
The presence of gaseous radioiodine is monitored using a commercially available cartridge
containing TEDA impregnated charcoal. This system is designed to collect iodine (I) in both the
elemental form and as organic compounds. The cartridge is located in the same sampling head
as the air particulate filter and is downstream of the particulate filter. The cartridge is changed at
the same time as the particulate filter and samples the same volume of air. Each cartridge is
analyzed for I-131 by gamma spectroscopy analysis.
-13-

Results
The results from the analysis of air particulate samples are summarized in Table H-3. Gross beta
activity in 2008 was consistent with levels reported in previous years. The average gross beta
activity for air filter samples was 0.022 pCi/m3. The annual average of the gross beta activity in
air particulate filters at these stations for the years 1971-2008 are presented in Figure H-2.
Increased levels due to fallout from atmospheric nuclear weapons testing are evident, especially
in 1971, 1977, 1978, and 1981. Evidence of a small increase resulting from the Chernobyl
accident can also be seen in 1986. These patterns are consistent with data from monitoring
programs conducted during the preoperation and construction phases at other TVA nuclear plant
sites.
Only naturally occurring radionuclides were identified by the monthly gamma spectral analysis
of the air particulate samples. No fission or activation products were detected. As shown in
Table H-4,1-131 was not detected in any of the charcoal cartridge samples collected in 2008.
-14-

TERRESTRIAL MONITORING
Terrestrial monitoring is accomplished by collecting samples of environmental media that may
transport radioactive material from the atmosphere to humans. For example, radioactive material
may be deposited on a vegetable garden and be ingested along with the vegetables or it may be
deposited on pasture grass where dairy cattle are grazing. When the cow ingests the radioactive
material, some of it may be transferred to the milk and consumed by humans who drink the milk.
Therefore, samples of milk, soil, and food crops are collected and analyzed to determine
potential impacts from exposure through this pathway. The results from the analysis of these
samples are shown in Tables H-5 through H-l 1.
A land use survey is conducted annually to locate milk producing animals and gardens within a
5-mile radius of the plant. One dairy farm was located on the east side of the river between 4
and 5 miles from the plant and one small farm with a milk cow is located approximately 1.5
miles northwest of the plant. These two locations were sampled in accordance with the SQN
sampling program. The results of the 2008 land use survey are presented in Appendix G.
Sample Collection and Analysis
Milk samples are collected every 2 weeks from the indicator locations and from at least one
control dairy. A radiochemical separation analysis for 1-131 and a gamma spectroscopy analysis
are performed on each sample and Sr-89, 90 analysis is performed quarterly.
The monitoring program includes provision for sampling of vegetation from locations where
milk is being produced when milk sampling cannot be conducted. There were no periods during
2008 when vegetation sampling was necessary.
-15-

Soil samples are collected annually from the air monitoring locations. The samples are collected
with either a "cookie cutter" or an auger type sampler. After drying and grinding, the sample is
analyzed by gamma spectroscopy and for Sr-89, 90.
Samples representative of food crops raised in the area near the plant are obtained from
individual gardens. Types of foods may vary from year to year as a result of changes in the local
vegetable gardens. In 2008 samples of apples, cabbage, corn, green beans, and tomatoes were
collected from local gardens. Samples of these same food crops were purchased from area
produce markets to serve as control samples. The edible portion of each sample is analyzed by
gamma spectroscopy.
Results
The results from the analysis of milk samples are presented in Table H-5. No radioactivity
attributable to SQN operations was identified. The 1-131 results were less than the established
nominal LLD of 0.4 pCi/liter. The results for the quarterly Sr-89 analysis were also less than the
nominal LLD value of 3.5 pCi/liter. Three of the samples of milk did contain low levels of
Sr-90. The Sr-90 concentration measured in these samples averaged 2.8 pCi/liter. The presence
of low levels of Sr-90 in milk samples is consistent with levels in the environment resulting from
past nuclear weapons testing. By far the predominant isotope reported in milk samples was the
naturally occurring K-40. The average K-40 concentration was approximately 1310 pCi/liter for
milk samples analyzed in 2008.
The gamma analysis of soil samples detected trace levels of Cs-137 with the maximum
concentration being 0.57 pCi/g. These concentrations are consistent with levels previously
reported from fallout. All other radionuclides reported were naturally occurring isotopes. The
soil analysis data are provided in Table H-6.
-16-

A plot of the annual average Cs-137 concentrations in soil is presented in Figure H-3. The
concentrations of Cs-137 in soil are steadily decreasing as a result of the cessation ofweapons
testing in the atmosphere, the 30-year half-life of Cs-137 and transport through the environment.
Radionuclides reported in food samples were all naturally occurring. Analysis of these samples
indicated no contribution from plant activities. The results are reported in Tables H-7 through
H-ll.
-17-

LIQUID PATHWAY MONITORING
Potential exposures from the liquid pathway can occur from drinking water, ingestion of edible
fish, or from direct radiation exposure from radioactive materials deposited in the river sediment.
The monitoring program includes the collection of samples of surface water, groundwater,
drinking water supplies, fish, and shoreline sediment. Samples from the reservoir are collected
both upstream and downstream from the plant.
Sample Collection and Analysis
Samples of surface water are collected from the Tennessee River downstream and upstream of
the plant using automatic sampling systems. A timer turns on the system at least once every 2
hours and the sample is collected into a composite jug. A 1-gallon sample is removed from the
composite jug at 4-week intervals and the remaining water in the jug is discarded. The
composite sample is analyzed for gamma emitting radionuclides and gross beta activity. A
quarterly composite sample is analyzed for tritium.
Samples are collected by an automatic sampling system at the first downstream drinking water
intake and at the water intake for the city of Dayton located approximately 20 miles upstream.
At other selected locations, grab samples are collected from drinking water systems which use
the Tennessee River as their source. The drinking water samples are analyzed every 4 weeks by
gamma spectroscopy and for gross beta activity. A quarterly composite sample from each
station is analyzed for tritium. Additional tritium analyses are performed on samples from two
of the locations that are shared with the Watts Bar monitoring program. The sample collected at
the water intake for the city ofDayton also serves as control sample for surface water.
Groundwater is sampled from an onsite well and from a private well in an area unaffected by
SQN. Gamma spectroscopy analysis is performed monthly on a composite sample from the
onsite well and quarterly on samples from an offsite well. Analyses are also performed for gross
beta activity and tritium.
-18-

Samples of commercial and game fish species are collected semiannually from each of two
reservoirs: the reservoir on which the plant is located (Chickamauga Reservoir) and the
upstream reservoir (Watts Bar Reservoir). The samples are collected using a combination of
netting techniques and electrofishing. Samples are prepared from filleted fish. After drying and
grinding, the samples are analyzed by gamma spectroscopy.
Samples of shoreline sediment are collected from two downstream recreational use areas and one
upstream location. The samples are dried and ground and analyzed by gamma spectroscopy.
Results
There were no fission or activation product radionuclides identified from the gamma
spectroscopy analyses performed on surface water samples. The tritium analysis of surface
water samples detected tritium in a total of five samples collected during a period of low river
flow rates. The highest tritium concentration detected in these samples was 622 pCi/L. This
level of tritium represented only a small fraction of the EPA drinking water limit of 20,000
pCi/L. Gross beta activity above the nominal LLD value was measured in most surface water
samples. The gross beta concentrations in samples from the indicator locations and control
location samples averaged 2.7 pCi/liter. The values were consistent with previously reported
levels. A trend plot of the gross beta activity in surface water samples from 1971 through 2008
is presented in Figure H-4. A summary table of the results is shown in Table H-12.
There were no fission or activation product radionuclides identified by the gamma analysis of
drinking water samples. Similar to the results reported above for surface water, the tritium was
detected at low levels in samples collected during periods of low river flow rates. The highest
tritium concentration was 631 pCi/L which is significantly below the EPA drinking water limit
for tritium. Average gross beta activity was 3.1 pCi/liter for the downstream stations and 2.7
pCi/liter at the control station. The results are shown in Table H-13 and a trend plot of the gross
beta activity in drinking water from 1971 to the present is presented in Figure H-5.
-19-

No fission or activation products were detected by the gamma analyses performed on ground-
water samples from the two REMP monitoring locations. The results for tritium analysis of
samples from these locations were all less than the nominal LLD. Gross beta concentrations in
samples from the onsite well averaged 2.8 pCi/liter, while the average from the offsite well was
8.2 pCi/liter. The results from the analysis of groundwater samples are presented in Table H-14.
Cesium-137 was identified in a total of five fish samples. The maximum Cs-137 concentration
for indicator samples was 0.03 pCi/g, while the maximum Cs-137 concentration for control
location samples was 0.07 pCi/g. A plot of the annual Cs-137 concentration in samples of game
fish is presented in Figure H-6. The results are summarized in Tables H-15 and H-16.
Cesium-137 was detected in two shoreline sediment samples. The concentration of Cs-137 in
sediment was consistent with previously identified levels. Results from the analysis of shoreline
sediment samples are shown in Table H-17.
Figure H-7 presents a plot of the Cs-137 concentrations measured in shoreline sediment since
1980.
-20-

ASSESSMENT AND EVALUATION
Potential doses to the public are estimated from measured effluents using computer models.
These models were developed by TVA and are based on methodology provided by the NRC in
Regulatory Guide 1.109 for determining the potential dose to individuals and populations living
in the vicinity of a nuclear power plant. The results of the effluent dose calculations are reported
in the Annual Radioactive Effluent Release Report. The doses calculated are a representation of
the dose to a "maximum exposed individual." Some of the factors used in these calculations
(such as ingestion rates) are maximum expected values which will tend to overestimate the dose
to this "hypothetical" person. The calculated maximum doses due to plant effluents are small
fractions of the applicable regulatory limits. In reality, the expected dose to actual individuals is
significantly lower.
Based on the very low concentrations ofradionuclides actually present in the plant effluents,
radioactivity levels measured in the environment as a result ofplant operations are expected to
be negligible. The results for the radiological environmental monitoring conducted for the SQN
2008 operations confirm this expectation.
Results
As stated earlier in this report, the estimated increase in radiation dose equivalent to the general
public resulting from the operation of SQN is negligible when compared to the dose from natural
background radiation. The results from environmental samples are compared with the
concentrations from the corresponding control stations as well as appropriate preoperational and
background data to determine influences from the plant. Measurable levels of Cs-137 were
detected in fish, soil, and shoreline sediment and Sr-90 was detected in milk. The Cs-137
and Sr-90 concentrations are consistent with levels identified previously that are the result of
fallout from past atmospheric nuclear weapons testing. The low levels of tritium measured in
water samples from Chickamauga Reservoir represented concentrations that were significantly
lower than the EPA drinking water limit.
-21-

Conclusions
It is concluded from the above analysis of the environmental sampling results and from the trend
plots presented in Appendix H that the exposure to members of the general public which may
have been attributable to SQN plant operations is negligible. The radioactivity reported herein is
primarily the result of fallout or natural background radiation. Any activity which may be
present as a result of plant operations does not represent a significant contribution to the
radiation exposure to Members ofthe Public.
-22-

REFERENCES
1. Merril Eisenbud, Environmental Radioactivity, Academic Press, Inc., New York, NY, 1987.
2. National Council on Radiation Protection and Measurements, Report No. 93, "Ionizing
Radiation Exposure of the Population of the United States," September 1987.
3. United States Nuclear Regulatory Commission, Regulatory Guide 8.29, "Instruction
Concerning Risks from Occupational Radiation Exposure," July 1981.
-23-

Table 1
COMPARISON OF
PROGRAM LOWER LIMITS OF DETECTION WITH THE REGULATORY LIMITS FOR
MAXIMUM ANNUAL AVERAGE EFFLUENT CONCENTRATIONS
RELEASED TO UNRESTRICTED AREAS
AND REPORTING LEVELS
Concentrations in Water, pCi/Liter
Effluent Reporting Lower limit
Concentration1 Level2 of Detection3
270
45
5
5
5
10
5
2
5
10
5
40
0.4
5
5
30
25
10
H-3
Cr-51
Mn-54
Co-58
Co-60
Zn-65
Sr-89
Sr-90
Nb-95
Zr-95
Ru-103
Ru-106
1-131
Cs-134
Cs-137
Ce-144
Ba-140
La-140
1,000,000
500,000
30,000
20,000
3,000
5,000
8,000
500
30,000
20,000
30,000
3,000
1,000
900
1,000
3,000
8,000
9,000
20,00C
1,000
1,000
300
300
400
400
2
30
50
200
200
Concentrations in Air, pCi/Cubic Meter
Effluent Reporting Lower limit
Concentration1 Level2 of Detection3
100,000
30,000
1,000
1,000
50
400
1,000
6
2,000
400
900
20
200
200
200
40
2,000
2,000
0.9
10
20
0.02
0.005
0.005
0.005
0.005
0.0011
0.0004
0.005
0.005
0.005
0.02
0.03
0.005
0.005
0.01
0.015
0.01
Note: lpCi = 3.7xlO"2Bq.
Note: For those reporting levels that are blank, no value is given in the reference.
1 Source: Table 2 ofAppendix B to 10 CFR 20
2 Source: SQN Offsite Dose Calculation Manual, Table 2.3-2
3 Source: Table E-l of this report
-24-

V
LOUISVILLE J
TENNESSEE VALLEY REGION \(TVA NUCLEAR PLANT SITES) V W V A.
ALABAMAM -WATTS BAR NUCLEAR PLANT
-SEQUOYAH NUCLEAR PLANT
- BELLEFONTE NUCLEAR PLANT
- BROWNS FERRY NUCLEAR PLANT

Figure 2
ENVIRONMENTAL EXPOSURE PATHWAYS OP MAN
DUE TO RELEASES OF RADIOACTIVE MATERIAL
TO THE ATMOSPHERE AND LAKE.
Diluted By Atmosphere Airborne Releases
Plume Exposure
Animals(Milk.Meat)
Consumed
By Animals
Vegetation
Uptake From Soil
Liquid Releases
Diluted By Lake
MAN
oConsumed By Man
Shoreline
Exposure
1 Drinking
Fish
-26-

APPENDDCA
RADIOLOGICAL ENVIRONMENTAL MONITORING PROGRAM AND
SAMPLING LOCATIONS
-27-

Table A-1
SEQUOYAH NUCLEAR PLANT
RADIOLOGICAL ENVIRONMENTAL MONITORING PROGRAM3
Exposure Pathway
and/or Sample
1. AIRBORNE
a. Particulates
tooo
b. Radioiodine
c. Soil
Number of Samples and
Locationsb
4 samples from locations (in different
sectors) at or near the site boundary
(LM-2, LM-3, LM-4, and LM-5).
4 samples from communities
approximately 6-10 miles from the
Plant(PM-2,3,8,and9).
4 samples from control locations
greater than 10 miles from the plant
(RM-1 RM-2, RM-3and RM-4).
Same locations as air particulates.
Samples from same locations as air
particulates
Sampling and
Collection Frequency
Continuous sampler operation with
sample collection once per 7 days
(more frequently if required by dust
loading).
Continuous sampler operation with
charcoal canister collected at same time
as particulate filters at least once per 7
days.
Once per year.
Type and Frequency
ofAnalysis
Analyze for gross beta radioactivity
greater than or equal to 24 hours
following filter change. Perform
gamma isotopic analysis on each
sample when gross beta is greater than
10 times yearly mean of control
samples. Composite at least once per
31 days (by location) for gamma scan.
1-131 by gamma scan on each sample.
Each sample is analyzed by gamma
isotopic and for Sr-89 and Sr-90.

Table A-l
SEQUOYAH NUCLEAR PLANT
RADIOLOGICAL ENVIRONMENTAL MONITORING PROGRAM3
to
Exposure Pathway
and/or Sample
Number of Samples and
Locationsb
2. DIRECT RADIATION 2 or more dosimeters placed at
locations at or near the site boundary
in each of the 16 sectors.
2 or more dosimeters placed at
stations located approximately 4 to 5
Miles from the plant in each of the
16 sectors.
2 or more dosimeters in other
locations of special interest.
3. WATERBORNE
a. Surface water
b. Groundwater
TRM 503.8dTRM 483.4
1 sample adjacent to the plant (Well
No. 6).
1 sample from groundwater source
upgradient (Farm HW).
Sampling and
Collection Frequency
At least once per 92 days.
Collected by automatic sequential-
type sampler0 with composite
samples collected over a period
of less than or equal to 31 days.
At least once per 31 days.
At least once per 92 days.
Type and Frequency
of Analysis
Gamma dose at least once per 92
days.
Gross beta and gamma scan on each
composite sample. Composite for
tritium analysis at least once per
92 days.
Composited for gross beta, gamma
scan, and tritium at least once per
92 days.
Gross beta, gamma scan, and
tritium at least once per 92 days.

Table A-l
SEQUOYAH NUCLEAR PLANT
RADIOLOGICAL ENVIRONMENTAL MONITORING PROGRAM3
Exposure Pathway
and/or Sample
c. Drinking Water
9
Number of Samples and
Locationsb
1 sample at the first potable
Water supply downstream from the
Plant (TRM 473.0).
1 sample at the next 2 downstream
potable water systems (greater than
10 miles downstream) (TRM 469.9
and TRM 465.3).
1 sample at the upstream control
location (TRM 503.8d).
Sampling and
Collection Frequency
Collected by automatic sequential-
type sampler0 with composite sample
collected over a period of less than
or equal to 31 days.
Grab sample once per 31 days.
Samples collected by sequential-type
sampler0 with composite sample
collected over a period of less than or
equal to 31 days.
Type and Frequency
ofAnalysis
Gross beta and gamma scan on each
composite sample. Composite for
tritium at least once per 92 days.
d. Shoreline sediment TRM 485
TRM 480
TRM 479
At least once per 184 days. Gamma scan of each sample.

Table A-l
SEQUOYAH NUCLEAR PLANT
RADIOLOGICAL ENVIRONMENTAL MONITORING PROGRAM"
Exposure Pathway
and/or Sample
4. INGESTION
a. Milk
b. Fish
Number of Samples and
Locationsb
1 sample from milk producing
animals in each of 1-3 areas indicated
by the cow census where doses are
calculated to be highest. If samples
are not available from a milk animal
location, doses to that area will be
estimated by projecting the doses
from concentrations detected in milk
from other sectors or by sampling
vegetation where milk is not
available.
At least one sample from a control
location
1 sample each from Chickamauga and
Watts Bar Reservoirs.
Sampling and
Collection Frequency
At least once per 15 days.
Type and Frequency
ofAnalysis
Gamma isotopic and 1-131 analysis of
each sample. Sr-89 and Sr-90 once
per quarter.
At least once per 184 days. One
sample representing a commercially
important species and one sample
representing a recreationally
important species.
Gamma scan on edible portion.

Table A-1
SEQUOYAH NUCLEAR PLANT
RADIOLOGICAL ENVIRONMENTAL MONITORING PROGRAM
Exposure Pathway
and/or Sample
c. Food Products
Number of Samples and
Locations1*
1 sample each ofprincipal food
products grown at private gardens
and/or farms in the immediate
vicinity of the plant.
Sampling and
Collection Frequency
At least once per 365 days at time of
harvest. The types of foods available
for sampling will vary. Following is
a list of typical foods which may be
available:
Cabbage, lettuce, or greens
Corn
Green Beans
Potatoes
Tomatoes
Type and Frequency
ofAnalysis
Gamma scan on edible portion.
to
d. Vegetation6
One sample of each of the same foods
grown at greater than 10 miles
distance from the plant.
Samples from farms producing milk
but not providing a milk sample.
At least once per 31 days. 1-131 and gamma scan at least once
per 31 days.
Control sample from one control
dairy farm when sampling is
performed at an indicator location.
a. The sampling program outlined in this table is that which was in effect at the end of 2008.
b. Sample locations, sector and distance from plant, are described in Table A-2 and A-3 and shown in
Figures A-l, A-2, and A-3.
c. Composite samples shall be collected by collecting an aliquot at intervals not exceeding 2 hours.
d. The sample collected at this location shall be considered a control for the drinking water and surface water.
e. Vegetation sampling is applicable only for farms that meet the criteria for milk sampling and when implementation
of milk sampling is not possible.

Table A-2
SEQUOYAH NUCLEAR PLANT
RADIOLOGICAL ENVIRONMENTAL MONITORING PROGRAM
SAMPLING LOCATIONS
Map
Location
Number3
2
3
4
5
7
8
9
10
11
12
13
14
19
21
23
24
25
31
32
33
35
37
38
40
44
46
47
a. See Figures A-1
b. Sample codes:
Station
LM-2
LM-3
LM-4
LM-5
PM-2
PM-3
PM-8
PM-9
RM-1
RM-2
RM-3
RM-4
FarmHW
FarmHS
Farm EH
Well No. 6
FarmK
TRMe 473.0
(East Side
Utilities)
TRM 469.9
(E. I. DuPont)
TRM 465.3
(Chattanooga)
TRM 503.8
(Dayton)
TRM 485.0
TRM 483.4
TRM 479.0
TRM 480.0
Sector
N
ssw
NE
NNE
sw
w
ssw
wsw
sw
NNE
ESE
NW
NW
E
ENE
NNE
NE
._
—
—
—
—
—
—
Chickamauga Reservoir (TRM 471-530)
Watts Bar Reservoir (TRM 530-602)
, A-2, and A-3
AP = Air particulate filter
CF = Charcoal filter
F = Fish
M = Milk
PW = Public Water
S = Soil
Approximate
Distance
(Miles)
0.7
2.0
1.5
1.8
3.8
5.6
8.7
2.6
16.7
17.8
11.3
20.0
1.2
4.6
9.5
0.15
40.0
10.7d
13.8d
18.4d
20. ld
1.3d0.3d4.7d3.7d—
—
Indicator (I)
or
Control (C)
]
]
C
C
c
c
I
I
c
I
c
I
I
I
c
c
I
I
I
I
c
Samples
Collected6AP,CF,S
AP,CF,S
AP,CF,S
AP,CF,S
AP,CF,S
AP,CF,S
AP,CF,S
AP,CF,S
AP,CF,S
AP,CF,S
AP,CF,S
AP,CF,S
M,W°
M
M
W
M
PW
PW
PW
PW,SW
SS
sw
SS
SS
F
F
SS = Shoreline Sediment
SW = Surface water
W = Well water
c. A control for well water.
d. Distance from plant discharge (TRM 483.7).
e. TRM = Tennessee River Mile
-33-

Table A-3
SEQUOYAH NUCLEAR PLANT
ENVIRONMENTAL DOSIMETER LOCATIONS
Map
Location
Number3
3
4
5
7
8
9
10
11
12
13
14
49
50
51
52
53
55
56
57
58
59
60
62
63
66
67
68
69
70
71
72
73
74
75
76
77
78
79
81
82
83
84
85
86
87
88
89
90
Station
SSW-1C
NE-1A
NNE-1
SW-2
W-3
SSW-3
WSW-2A .
SW-3
NNE-4
ESE-3
NW-3
N-l
N-2
N-3
N-4
NNE-2
NE-1
NE-2
ENE-i
ENE-2
E-l
E-2
ESE-1
ESE-2
SE-1
SE-2
SE-4
SSE-1
SSE-2
S-l
S-2
SSW-1
SSW-2
SW-1
WSW-l
WSW-2
WSW-3
WSW-4
W-l
W-2
WNW-1
WNW-2
NW-1
NW-2
NNW-1
NNW-2
NNW-3
SSW-1 B
Sector
SSW
NE
NNE
SW
w
SSW
wsw
SW
NNE
ESE
NW
N
N
N
N
NNE
NE
NE
ENE
ENE
E
E
ESE
ESE
SE
SE
SE
SSE
SSE
S
S
• ssw
SSW
SW
WSW
WSW
WSW
WSW
w
w
WNW
WNW
NW
NW
NNW
NNW
NNW
SSW
Approximate
Distance
(miles)
2.0
1.5
1.8
3.8
5.6
8.7
2.6
16.7
17.8
11.3
20.0
0.6
2.1
5.2
10.0
4.5
2.4
4.1
0.2
5.1
1.2
5.2
1.2
4.9
1.4
1.9
5.2
1.6
4.6
1.5
4.7
0.6
4.0
0.7
0.9
2.5
5.7
7.8
0.6
4.3
0.4
5.3
0.4
5.2
0.6
1.7
5.3
1.5
Onsite (On)bor
Offsite (Off*
On
On
On
Off
Off
Off
Off
Off
Off
Off
Off
On
Off
Off
Off
Off
Off
Off
On
Off
On
Off
On
Off
On
On
Off
On
Off
On
Off
On
Off
On
On
Off
Off
Off
On
Off
On
Off
On
Off
On
On
Off
On
a. See Figures A-l,A-2, and A-3.
b. Dosimeters designated "onsite" are located 2 miles or less from the plant; "offsite" are located more than 2 miles from the
plant.
-34-

Figure A-1
Radiological Environmental Monitoring Locations
Within 1 mile of the Plant
348.75 N 11.25NNW ^===M====^L NNE
326.25 33.75
NE
56.25
ENE
281.25
EQUOYAH
NUCLEAR
PLANT
78.75
258.75 101.25
SE
213.75 146.25
ssw191.25 e 168.75
SSE
Scale
Mile
-35-

Figure A-2
Radiological Environmental Monitoring Locations
Between 1 and 5 miles from the Plant
NW
303.75 56.25
WNWENE
281.25
w-
258.75
WSW
348.75 N 11.25
78.75
101.25
ESE
236.25 123.75
SW SE
213.75 146.25
SSW
191.25
SSE
168.75 SCALE
0 1 2
MILES
-36-

Figure A-3
Radiological Environmental Monitoring Locations
More than 5 miles from the Plant
326.25
303.75
281.25
258.7!
wsw
326.2
213.75
33.75
56.25
78.75
101.25
123.75
146.25
191.25 168.75
-37-

APPENDIX B
2008 PROGRAM MODIFICATIONS

Appendix B
Radiological Environmental Monitoring Program Modification
No modifications were made to the SQN REMP during 2008,
-39-

APPENDIX C
PROGRAM DEVIATIONS
-40-

Appendix C
Program Deviations
A problem with the sampling equipment prevented the collection of air monitoring samples from
one of the twelve sampling locations for one sampling period. A milk sample was not available
from one of the two control locations for one biweekly sampling period.
Table C-l provides additional details on these missed samples.
-41-

Table C-l
Radiological Environmental Monitoring Program Deviations
Date Station Location Remarks
04/08/08 Farm EH 9.5 miles ENE The milk sample was not available at this control farm location. The
farmer was changing out his holding tank and was not saving any milk. A
sample was collected from the other farm used as a control location
meeting the requirement for at least one control sample.
09/30/08 RM-4 20.0 miles NW The total sample volume for air filter and charcoal cartridge samples was
not adequate due to a failure of the sampling pump. The problem was a
failure of the drive motor. The motor was replaced and the system
returned to normal operation. The missed samples were documented in
the Corrective Action Program with Problem Evaluation Report (PER)
153800.
to

APPENDIX D
ANALYTICAL PROCEDURES
-43-

Appendix D
Analytical Procedures
Analyses of environmental samples are performed by the radioanalytical laboratory located at the
Western Area Radiological Laboratory facility in Muscle Shoals, Alabama. The analysis
procedures are based on accepted methods. A summary of the analysis techniques and
methodology follows.
The gross beta measurements are made with an automatic low background counting system.
Normal counting times are 50 minutes. Water samples are prepared by evaporating 500 ml of
sample to near dryness, transferring to a stainless steel planchet and completing the evaporation
process. Air particulate filters are counted directly in a shallow planchet.
The specific analysis of 1-131 in milk is performed by first isolating and purifying the iodine by
radiochemical separation and then counting the final precipitate on a beta-gamma coincidence
counting system. The normal count time is 50 minutes. With the beta-gamma coincidence
counting system, background counts are virtually eliminated and extremely low levels of activity
can be detected.
After a radiochemical separation, samples analyzed for Sr-89, 90 are counted on a low
background beta counting system. The sample is counted a second time after minimum ingrowth
period of six days. From the two counts the Sr-89 and Sr-90 concentrations can be determined.
Water samples are analyzed for tritium content by first distilling a portion of the sample and then
counting by liquid scintillation. A commercially available scintillation cocktail is used.
Gamma analyses are performed in various counting geometries depending on the sample type
and volume. All gamma counts are obtained with germanium type detectors interfaced with a
computer based multichannel analyzer system. Spectral data reduction is performed by the
computer program HYPERMET.
-44-

The charcoal cartridges used to sample gaseous radioiodine are analyzed by gamma spectroscopy
using a high resolution gamma spectroscopy system with germanium detectors.
The necessary efficiency values, weight-efficiency curves, and geometry tables are established
and maintained on each detector and counting system. A series of daily and periodic quality
control checks are performed to monitor counting instrumentation. System logbooks and control
charts are used to document the results of the quality control checks.
-45-

APPENDIX E
NOMINAL LOWER LIMITS OF DETECTION (LLD)
-46-

Appendix E
Nominal Lower Limits of Detection
A number of factors influence the Lower Limit of Detection (LLD) for a specific analysis
method, including sample size, count time, counting efficiency, chemical processes, radioactive
decay factors, and interfering isotopes encountered in the sample. The most probable values for
these factors have been evaluated for the various analyses performed in the environmental
monitoring program. The nominal LLDs are calculated from these values, in accordance with
the methodology prescribed in the ODCM. The current nominal LLD values achieved by the
ERM&I radioanalytical lab are listed in Table E-l. For comparison, the maximum values for the
lower limits of detection specified in the ODCM are given in Table E-2.
The nominal LLDs are also presented in the data tables in Appendix H. For analyses for which
LLDs have not been established, an LLD of zero is assumed in determining if a measured
activity is greater than the nominal LLD.
-47-

Table E-l
Gross Beta
Tritium
Iodine-131
Strontium-89
Strontium-90
Air Filters
(pCi/m3)
0.002
A.
Water
fpCi/L)
1.9
270
0.4
5.0
2.0
Nominal LLD Values
Radiochemical Procedures
Milk
(pCi/L)
0.4
3.5
2.0
Wet Vegetation
fpCi/Ke wet)
6.0
31.0
12.0
Sediment
and Soil
fpCi/e dry)
1.6
0.4

Ce-141
Ce-144
Cr-51
1-131
Ru-103
Ru-106
Cs-134
Cs-137
Zr-95
Nb-95
Co-58
Mn-54
Zn-65
Co-60
K-40
Ba-140
La-140
Fe-59
Be-7
Pb-212
Pb-214
Bi-214
Bi-212
Tl-208
Ra-224
Ra-226
Ac-228
Air
Particulates
DCi/m3
.005
.01
.02
.005
.005
.02
.005
.005
.005
.005
.005
.005
.005
.005
.04
.015
.01
.005
.02
.005
.005
.005
.02
.002
—
—
.01
Charcoal
Filter
pCi/m3
.02
.07
0.15
0,03
0:02
0.12
0.02
0.02
0.03
0.02
0.02
0.02
0.03
0.02
0.30
0.07
0.04
0.04
0.15
0.03
0.07
0.05
0.20
0.02
—
—
0.07
Water
and Milk
pCi/L
10
30
45
10
5
40
5
5
10
5
5
5
10
5
100
25
10
10
45
15
20
20
50
10
~
__
20
Table E-l
Nominal LLD Values
B. Gamma
Vegetatior
and Grain
pCi/p, drv
.07
.15
.30
.20
.03
.15
.03
.03
.05
.25
.03
.03
.05
.03
.40
.30
.20
.08
.25
.04
.50
.10
.25
.03
—
—
.10
Analyses
i Wet
Vegetation
pCi/kg, wet
35
115
200
60
25
190
30
25
45
30
20
20
45
20
400
130
50
40
200
40
80
55
250
30
—
—
70
Soil and
Sediment
pCi/g, drv
.10
.20
.35
.25
.03
.20
.03
.03
.05
.04
.03
.03
.05
.03
.75
.30
.20
.05
.25
.10
.15
.15
.45
.06
.75
.15
.25
Fish
pCi/g, drv
.07
.15
.30
.20
.03
.15
.03
.03
.05
.25
.03
.03
.05
.03
.40
.30
.20
.08
.25
.04
.50
.10
.25
.03
—
—
.10
Clam Flesh
pCi/g, drv
.35
.85
2.4
1.7
.25
1.25
.14
.15
.45
.25
.25
.20
.40
.20
3.50
2.4
1.4
.45
1.9
.30
.10
.50
2.0
.25
—
.75
Foods
Tomatoes
Potatoes, etc
pCi/kg, wet
20
60
95
20
25
90
10
10
45
10
10
10
45
10
250
50
25
25
90
40
80
40
130
30
~
~
50

Table E-2
Maximum Values for the Lower Limits of Detection (LLD)
Specified by the SQN Offsite Dose Calculation Manual
Analysis
gross beta
H-3
Mn-54
Fe-59
Co-58,60
Zn-65
Zr-95
Nb-95
1-131
Cs-134
Cs-137
Ba-140
La-140
Water
pCi/L
4
2000a
15
30
15
30
30
15
lb
15
18
60
15
Airborne
Particulate
or Gases
j>Ci/m3
1 x 10⁻²
N.A.
N.A.
N.A.
N.A.
N.A.
N.A.
N.A.
7 x 10"2
5 xlO"2
6xlO"2
N.A.
N.A.
Fish
pCi/kg. wet
N.A.
N.A.
130
260
130
260
N.A.
N.A.
N.A.
130
150
N.A.
N.A.
Milk
pCi/L
N.A.
N.A.
N.A.
N.A.
N.A.
N.A.
N.A.
N.A.
1
15
18
60
15
Food
Products
pCi/kg. wet
N.A.
N.A.
N.A.
N.A.
N.A.
N.A.
N.A.
N.A.
60
60
80
N.A.
N.A.
Sediment
pCi/kg. dry
N.A.
N.A.
N.A.
N.A.
N.A.
N.A.
N.A.
N.A.
N.A.
150
180
N.A.
N.A.
a. If no drinking water pathway exists, a value of 3000 pCi/liter may be used.
b. If no drinking water pathway exists, a value of 15 pCi/liter may be used.
-50-

APPENDIX F
QUALITY ASSURANCE/QUALITY CONTROL PROGRAM
-51-

Appendix F
Quality Assurance/Quality Control Program
A quality assurance program is employed by the laboratory to ensure that the environmental
monitoring data are reliable. This program includes the use of written, approved procedures in
performing the work, provisions for staff training and certification, internal self assessments of
program performance, audits by various external organizations, and a laboratory
quality control program.
The quality control program employed by the radioanalytical laboratory is designed to ensure
that the sampling and analysis process is working as intended. The program includes equipment
checks and the analysis of quality control samples along with routine samples. Instrument
quality control checks include background count rate and counts reproducibility. In addition to
these two general checks, other quality control checks are performed on the variety of detectors
used in the laboratory. The exact nature of these checks depends on the type of device and the
method it uses to detect radiation or store the information obtained.
Quality control samples of a variety of types are used by the laboratory to verify the performance
of different portions of the analytical process. These quality control samples include blanks,
replicate samples, blind samples, or cross-checks.
Blanks are samples which contain no measurable radioactivity or no activity of the type being
measured. Such samples are analyzed to determine whether there is any contamination of
equipment or commercial laboratory chemicals, cross-contamination in the chemical process, or
interference from isotopes other than the one being measured.
Duplicate samples are generated at random by the sample computer program which schedules
the collection of the routine samples. For example, if the routine program calls for four milk
samples every week, on a random basis each farm might provide an additional sample several
-52-

times a year. These duplicate samples are analyzed along with other routine samples. They
provide information about the variability of radioactive content in the various sample media.
If enough sample is available for a particular analysis, the laboratory staff can split it into two
portions. Such a sample provides information about the variability of the analytical process
since two identical portions of material are analyzed side by side.
Analytical knowns are another category of quality control sample. A known amount of
radioactivity is added to a sample medium. The lab staff knows the radioactive content of the
sample. Whenever possible, the analytical knowns contain the same amount of radioactivity
each time they are run. In this way, analytical knowns provide immediate data on the quality of
the measurement process.
Blind spikes are samples containing radioactivity which are introduced into the analysis
process disguised as ordinary environmental samples. The lab staff does not know the sample
contains radioactivity. Since the bulk of the ordinary workload of the environmental laboratory
contains no measurable activity or only naturally occurring radioisotopes, blind spikes can be
used to test the detection capability of the laboratory or can be used to test the data review
process. If an analysis routinely generates numerous zeroes for a particular isotope, the presence
of the isotope is brought to the attention of the laboratory supervisor in the daily review process.
Blind spikes test this process since the blind spikes contain radioactivity at levels high enough to
be detected. Furthermore, the activity can be put into such samples at the extreme limit of
detection (near the LLD) to verify that the laboratory-can detect very low levels of activity.
Another category of quality control samples is the internal cross-checks. These samples have a
known amount ofradioactivity added and are presented to the lab staff labeled as cross-check
samples. This means that the quality control staff knows the radioactive content or "right
answer" but the lab personnel performing the analysis do not. Such samples test the best
-53-

performance of the laboratory by determining if the lab can find the "right answer". These
samples provide information about the accuracy of the measurement process. Further
information is available about the variability of the process if multiple analyses are requested on
the same sample. Like blind spikes or analytical knowns, these samples can also be spiked with
low levels of activity to test detection limits. During 2008, all analysis results for internal cross
check samples were within agreement limits when compared to the known value.
To provide for an independent verification of the laboratory's ability to make accurate
measurements, the laboratory participated in an environmental level cross-check program
Eckert & Ziegler Analytics (formerly Analytics, Inc.), during 2008. The results of TVA's
participation in this cross-check program are presented in Table F-l.
The quality control data are routinely collected, examined and reported to laboratory supervisory
personnel. They are checked for trends, problem areas, or other indications that a portion of the
analytical process needs correction or improvement. The end result is a measurement process
that provides reliable and verifiable data and is sensitive enough to measure the presence of
radioactivity far below the levels which could be harmful to humans.
-54-

Table F-l
Results For 2008 External Cross Checks
Test Period
First Quarter
First Quarter
First Quarter
Third Quarter
Third Quarter
Third Quarter
Third Quarter
Sample Tvpe / Analysis
Water (pCi/L)
Gross Beta
Water (pCi/Filter)
3H
Water (pCi/L)
hi,
l41Ce
51Cr
134Cs
l37Cs
58Co
54Mn
59Fe
65Zn
60Co
Milk (pCi/L)
mI
89Sr
90Sr
Water (pCi/L)
3H
Sand (pCi/gram)
l41Ce
51Cr
l34Cs
137Cs
58Co
54Mn
59Fe
65Zn
60Co
Air Filter (pCi/filter)
Gross Beta
Air Filter (pCi/filter)
14lCe
5lCr
I34Cs
137Cs
58Co
54Mn
59Fe
65Zn
60Co
Results
Known
2.30E+02
4.01E+03
7.04E+01
1.98E+02
2.86E+02
9.97E+01
1.16E+02
5.64E+01
7.50E+01
8.14E+01
1.09E+02
1.88E+02
7.29E+01
9.89E+01
1.33E+01
1.14E+04
0.341
0.890
0.491
0.343
0.377
0.351
0.305
0.675
0.496
56.0
104.0
272.0
150.0
105.0
115.0
107.0
93.3
206.0
151.0
TVA
2.16E+02
4.10E+03
7.14E+01
1.80E+02
2.94E+02
9.41E+01
1.19E+02
5.65E+01
8.28E+01
7.58E+01
1.09E+02
1.92E+02
7.58E+01
9.85E+01
1.10E+01
1.16E+04
0.321
0.862
0.439
0.329
0.373
0.374
0.294
0.676
0.495
52.5
99.9
269.0
127.0
101.0
113.0
114.0
89.2
203.0
142.0
Agreement
0.94
1.02
1.01
0.91
1.03
0.94
1.03
1.00
1.10
0.93
1.00
1.02
1.04
1.00
0.83
1.02
0.94
0.97
0.89
0.96
0.99
1.07
0.96
1.00
1.00
0.94
0.96
0.99
0.85
0.96
0.98
1.07
0.96
0.99
0.94
-55-
APPENDIX G
LAND USE SURVEY
-56-

Appendix G
Land Use Survey
A land use survey is conducted annually to identify the location of the nearest milk producing
animal, the nearest residence, and the nearest garden of greater than 500 square feet producing
fresh leafy vegetables in each of 16 meteorological sectors within a distance of 5 miles from the
plant.
The land use survey is conducted between April 1 and October 1 using appropriate techniques
such as door-to-door survey, mail survey, telephone survey, aerial survey, or information from
local agricultural authorities or other reliable sources.
Using survey data, relative radiation doses are projected for individuals living near the plant.
These projections use the data obtained in the survey and historical meteorological data. They
also assume that releases are equivalent to the design basis source terms. The calculated doses
are relative in nature and do not reflect actual exposures received by individuals living near
SQN. Calculated doses to individuals based on measured effluents from the plant are well below
applicable dose limits.
In response to the 2008 SQN land use survey, annual dose projections were calculated for air
submersion, vegetable ingestion, and milk ingestion. External doses due to radioactivity in air
(air submersion) are calculated for the nearest resident in each sector, while doses from drinking
milk or eating foods produced near the plant are calculated for the areas with milk producing
animals and gardens, respectively.
There were no changes in the location of the nearest resident as identified in 2008 compared to
2007. There were two changes in the location for nearest gardens as identified in 2008.
-57-

For milk ingestion, there were no changes as compared to 2007.
Tables G-1, G-2, and G-3 show the comparative relative calculated doses for 2007 and 2008.
-58-

Table G-l
SEQUOYAH NUCLEAR PLANT
Relative Projected Annual Air Submersion Dose to the Nearest Resident
Within Five Miles of Plant
mrem/year
Sector
N
NNE
NE
ENE
E
ESE
SE
SSE
S
SSW
sw
wsw
w
WNW
NW
NNW
2007 Survev
Approximate
Distance
Miles
0.8
1.5
1.5
1.3
1.0
1.0
1.1
1.3
1.1
1.3
1.4
0.6
0.6
1.1
0.8
0.5
Annual
Dose
0.12
0.07
0.06
0.02
0.02
0.02
0.02
0.03
0.11
0.15
0.06
0.05
0.06
0.02
0.04
0.14
2008 Survev
Approximate
Distance
Miles
0.8
1.5
1.5
1.3
1.0
1.0
1.1
1.3
1.1
1.3
1.4
0.6
0.6
0.9
0.8
0.5
Annual
Dose
0.12
0.07
0.06
0.02
0.02
0.02
0.02
0.03
0.11
0.15
0.06
0.05
0.06
0.02
0.04
0.14
-59-

Table G-2
SEQUOYAH NUCLEAR PLANT
Relative Projected Annual Dose to Child's Bone from
Ingestion ofHome-Grown Foods
mrem/year
Sector
N
NNE
NE
ENE
E
ESE
SE
SSE
S
SSW
SW
WSW
W
WNW
NW
NNW
2007 Survey
Approximate
Distance
Miles
1.1
3.3
2.9
2.8
1.5
1.1
2.0
1.3
1.3
2.8
2.2
2.3
0.9
1.1
0.9
1.5
Annual
Dose
2.25
0.74
0.74
0.26
0.42
0.50
0.30
1.00
2.72
1.70
1.01
0.27
1.03
0.62
1.26
0.87
2008 Survey
Approximate
Distance
Miles
1.1
2.5
2.9
2.8
1.5
1.1
2.0
2.8
1.3
2.8
2.2
2.3
0.9
1.1
0.9
1.5
Annual
Dose
2.25
1.13
0.74
0.26
0.42
0.50
0.30
0.34
2.72
1.70
1.01
0.27
1.03
0.62
1.26
0.87
-60-

Table G-3
SEQUOYAH NUCLEAR PLANT
Relative Projected Annual Dose to Receptor Thyroid
from Ingestion ofMilk
mrem/year
r
Location
FarmHSb
FarmHW
Sector
E
NW
Approximate
Distance
(Miles)*
4.6
1.2
2007
0.008
0.052
Annual Dose
2008
0.008
0.052
X/Q
funits-s/m3)
6.74 E-8
5.48 E-7
a. Distances measured to nearest property line.
b. Grade A dairy.
-61-

APPENDIX H
DATA TABLES AND FIGURES
-62-

1 st qtr
Average,
0 - 2 miles 8.4
(onsite)
Average,
> 2 miles 7.4
(offsite)
Table H -1
DIRECT RADIATION LEVELS
Average External Gamma Radiation Levels Onsite and Offsite
Sequoyah Nuclear Plant for Each Quarter - 2008
mR / Quarter (a)
Average External Gamma Radiation Levels (b)
2nd qtr 3rd qtr
8.5
6.8
11.2
9.9
4th qtr
11.2
10.2
(a) Field periods normalized to one standard quarter (2190 hours)
(b) Average of the individual measurements in the set
mR/yr
39
34
-63-

TABLE H -2 continued
DIRECT RADIATION LEVELS
Individual Stations at Sequoyah Nuclear Plant
Map
Location
Number
71
72
73
90
3
74
9
75
7
11
76
77
10
78
79
81
82
8
83
84
85
86
14
87
88
89
TLD
Station
Number
S-1
S-2
SSW-1
SSW-1B
SSW-1 C
SSW-2
SSW-3
SW-1
SW-2
SW-3
WSW-1
WSW-2
WSW-2A
WSW-3
WSW-4
W-1
W-2
W-3
WNW-1
WNW-2
NW-1
NW-2
NW-3
NNW-1
NNW-2
NNW-3
Direction,
decrees
183
185
203
192
198
204
203
228
227
228
241
238
250
248
244
260
275
280
292
295
315
318
320
344
342
334
I
Approx
Distance,
miles
1.5
4.7
.6
1.5
2.0
4.0
8.7
.7
3.8
16.7
.9
2.5
2.6
5.7
7.8
.6
4.3
5.6
.4
5.3
.4
5.2
20.0
.6
1.7
5.3
Environmental Radiation Levels
1st Qtr
Jan-Mar
2008
13.4
5.9
6.4
3.2
7.0
9.7
8.6
10.7
7.5
11.3
12.3
3.2
5.9
7.5
10.2
14.5
7.0
7.5
10.7
7.0
7.0
12.3
8.6
7.5
7.0
7.0
mR / quarter
2nd Qtr
Apr-Jun
2008
9.9
3.4
6.2
3.8
6.2
12.2
7.6
10.4
8.0
10.4
13.2
3.4
7.6
11.8
5.7
12.2
2.4
6.6
12.2
7.6
8.0
14.5
4.3
10.8
6.2
5.2
3rd Qtr
Jul-Sep
2008
15.9
1.8
11.5
6.7
10.6
15.9
13.0
15.4
13.5
12.0
15.4
5.2
7.2
14.0
9.6
15.9
3.8
9.6
8.6
9.6
4.2
15.9
7.2
14.0
6.2
9.1
4th Qtr
Oct-Dec
2008
14.3
6.3
9.7
6.8
8.6
MA
12.5
14.8
11.4
12.5
16.0
6.8
7.4
12.0
10.8
12.5
8.6
8.6
10.3
8.6
7.4
14.3
8.0
13.1
12.0
8.6
I
Annual
Exposure
mR/vear
53.5
17.4
33.8
20.5
32.4
54.9
41.7
51.3
40.4
46.2
56.9
18.6
28.1
45.3
36.3
55.1
21.8
32.3
41.8
32.8
26.6
57.0
28.1
45.4
31.4
29.9

TABLE H-2
DIRECT RADIATION LEVELS
Individual Stations at Sequoyah Nuclear Plant
Map
Location
Number
49
50
51
52
5
53
12
55
4
56
57
58
59
60
62
63
13
66
67
68
69
70
TLD
Station
Number
N-1
N-2
N-3
N-4
NNE-1
NNE-2
NNE-4
NE-1
NE-1A
NE-2
ENE-1
ENE-2
E-1
E-2
ESE-1
ESE-2
ESE-3
SE-1
SE-2
SE-4
SSE-1
SSE-2
Direction,
deqrees
3
4
358
355
13
31
32
38
50
51
73
66
96
87
110
112
117
131
129
136
154
158
Approx
Distance,
miles
.6
2.1
5.2
10.0
1.8
4.5
17.8
2.4
1.5
4.1
.2
5.1
1.2
5.2
1.2
4.9
11.3
1.4
1.9
5.2
1.6
4.6
| Environmental Radiation Levels
1stQtr
Jan-Mar
2008
7.5
9.1
3.2
5.9
9.7
8.1
5.9
9.7
8.6
3.2
5.9
8.1
6.4
5.9
8.1
6.4
6.4
3.8
4.3
10.2
8.6
10.2
mR / quarter
2nd Qtr
Apr-Jun
2008
8.5
8.5
6.2
5.7
14.1
8.0
5.2
9.9
6.6
1.5
8.0
5.7
5.2
5.7
8.0
4.8
5.2
3.8
4.3
9.4
5.7
9.0
3rd Qtr
Jul-Sep
2008
10.6
13.0
10.1
10.1
14.9
9.1
9.7
14.0
11.0
7.2
8.1
6.2
10.6
12.5
8.6
13.0
8.1
7.2
11.5
15.4
6.2
12.5
4th Qtr
Oct-Dec
2008
13.1
9.7
8.0
11.4
14.3
8.6
7.5
13.7
10.8
10.8
10.3
11.4
7.4
10.3
8.6
13.1
8.0
8.0
9.7
12.5
9.1
14.3
I
Annual
Exposure
mR/vear
39.7
40.3
27.5
33.1
53.0
33.8
28.3
47.3
37.0
22.7
32.3
31.4
29.6
34.4
33.3
37.3
27.7
22.8
29.8
47.5
29.6
46.0

Tennessee Valley Authority
Environmental Radiological Monitoring and Instrumentation
Western Area Radiological Laboratory
Name of Facility: SEQUOYAH NUCLEAR PLANT
Location of Facility: HAMILTON TENNESSEE
Type and
Total Number
of Analysis
Performed
Lower Limit
of Detection
(LLD)
See Note 1
Indicator Locations
Mean (F)
Range
See Note 2
RADIOACTIVITY IN AIR FILTER
PCI/M3 - 0.037 BQ/M3
Location with Highest
Name
Distance and Direction
Docket Number: 50-327,328
Reporting Period: 2008
Annual Mean Control Locations Number of
Mean (F) Mean (F) Nonroutine
Range Range Reported
See Note 2 See Note 2 Measurements
GROSS BETA 623
OnON
BE-7
BI-214
K-40
PB-212
PB-214
TL-208
2.00E-03 2.18E-02 (416/416)
1.03E-02 - 3.55E-02
GAMMA SCAN (GELI) 156
AC-228 1.00E-02 104 VALUES < LLD
2.00E-02 1.17E-01 (104/104)
7.25E-02 - 1.76E-01
5.00E-03 1.94E-02 (98/104)
5.80E-03 - 6.91 E-02
4.00E-02 4.07E-02 (1/104)
4.07E-02 - 4.07E-02
5.00E-03 104 VALUES < LLD
5.00E-03 1.95E-02 (97/104)
5.10E-03 - 6.80E-02
2.00E-03 104 VALUES < LLD
PM-8 HARRISON TN
8.7 MILES SSW
PM-3 DAISY TN
5.6 MILES W
PM-2 COUNTY PARK TN
3.8 MILES SW
PM-8 HARRISON TN
8.7 MILES SSW
LM-3 HARRISON BAY RD
2.0 MILES SSW
LM-5 WARE POINT
1.8 MILES NNE
PM-8 HARRISON TN
8.7 MILES SSW
PM-2 COUNTY PARK TN
3.8 MILES SW
2.22E-02 (52/52)
1.14E-02 - 3.53E-02
13 VALUES < LLD
1.24E-01 (13/13)
9.64E-02 - 1.76E-01
2.54E-02 (12/13)
6.40E-03 - 6.56E-02
4.07E-02 (1/13)
4.07E-02 - 4.07E-02
13 VALUES < LLD
2.43E-02 (12/13)
7.90E-03 - 6.55E-02
13 VALUES < LLD
2.22E-02 (207/207)
1.09E-02 - 4.52E-02
52 VALUES < LLD
1.20E-01 (52/52)
7.98E-02 - 1.72E-01
1.82E-02 (50/52)
5.00E-03 - 8.34E-02
4.40E-02 (1/52)
4.40E-02 - 4.40E-02
52 VALUES < LLD
1.81 E-02 (49/52)
5.00E-03 - 7.71 E-02
2.00E-03 (1/52)
2.00E-03 - 2.00E-03
Note: 1. Nominal Lower Level of Detection (LLD) as described in Table E -1
Note: 2. Mean and Range based upon detectable measurements only. Fraction of detectable measurements at specified location is indicated in parentheses (F).

Tennessee Valley Authority
Environmental Radiological Monitoring and Instrumentation
Western Area Radiological Laboratory
RADIOACTIVITY IN CHARCOAL FILTER
PCI/M3 - 0.037 BQ/M3
Name of Facility:
Location of Facility:
Type and
Total Number
of Analysis
Performed
GAMMA SCAN (GELI)
BI-214
1-131
K-40
PB-212
PB-214
i
<* TL-208
SEQUOYAH NUCLEAR PLANT
HAMILTON TENNESSEE
Lower Limit
of Detection
(LLD)
See Note 1
623
5.00E-02
3.00E-02
3.00E-01
3.00E-02
7.00E-02
2.00E-02
Indicator Locations
Mean (F)
Range
See Note 2
7.72E-02 (137/416)
5.01E-02 - 2.13E-01
SEE NOTE 3
3.79E-01 (84/416)
3.01 E-01 - 5.52E-01
416 VALUES < LLD
1.02E-01 (75/416)
7.00E-02 - 2.59E-01
416 VALUES < LLD
Location with Highest
Name
Distance and Direction
LM-5 WARE POINT
1.8 MILES NNE
LM-2 NORTH
0.8 MILES NORTH
PM-2 COUNTY PARK TN
3.8 MILES SW
LM-2 NORTH
0.8 MILES NORTH
LM-2 NORTH
0.8 MILES NORTH
Docket Number: 50-327,328
Reporting Period: 2008
Annual Mean
Mean (F)
Range
See Note 2
8.71 E-02 (12/52)
5.08E-02 - 1.44E-01
4.02E-01 (8/52)
3.24E-01 - 5.52E-01
52 VALUES < LLD
1.21 E-01 (9/52)
7.37E-02 - 1.99E-01
52 VALUES < LLD
Control Locations
Mean (F)
Range
See Note 2
7.53E-02 (56/207)
5.02E-02 - 1.41 E-01
3.70E-01 (43/207)
3.01 E-01 - 4.90E-01
207 VALUES < LLD
9.91 E-02 (29/207)
7.03E-02 - 1.89E-01
207 VALUES < LLD
Number of
Nonroutine
Reported
Measurements
Note: 1. Nominal Lower Level of Detection (LLD) as described in Table E -1
Note: 2. Mean and Range based upon detectable measurements only. Fraction of detectable measurements at specified location is indicated in parentheses (F).
Note: 3. The analysis of Charcoal Filters was performed by Gamma Spectroscopy. No 1-131 was detected. The LLD for 1-131 by Gamma Spectroscopy was 0.03 pCi/cubic meter.

Tennessee Valley Authority
Environmental Radiological Monitoring and Instrumentation
Western Area Radiological Laboratory
RADIOACTIVITY IN MILK
PCI/L - 0.037 BQ/L
Name of Facility: SEQUOYAH NUCLEAR PLANT
Location of Facility: HAMILTON TENNESSEE
Docket Number: 50-327,328
Reporting Period: 2008
Type and
Total Number
of Analysis
Performed
IODINE-131
GAMMA SCAN (GELI)
AC-228
BI-214
K-40
^ PB-212
OO
PB-214
TL-208
SR89
SR90
Lower Limit
of Detection
(LLD)
See Note 1
103
4.00E-01
103
2.00E+01
2.00E+01
1.00E+02
1.50E+01
2.00E+01
1.00E+01
16
3.50E+00
16
2.00E+00
Indicator Locations
Mean (F)
Range
See Note 2
52 VALUES < LLD
52 VALUES < LLD
3.42E+01 (23/52)
2.00E+01 - 7.10E+01
1.34E+03 (52/52)
8.33E+02 - 1.55E+03
52 VALUES < LLD
3.08E+01 (18/52)
2.05E+01 - 5.85E+01
52 VALUES < LLD
8 VALUES < LLD
2.80E+00 (3/8)
2.12E+00 - 3.59E+00
Location with Highest
Name
Distance and Direction
H. SMITH FARM
4.6 MILES E
H WALKER FARM
1.2 MILES NW
H. SMITH FARM
4.6 MILES E
H WALKER FARM
1.2 MILES NW
H WALKER FARM
1.2 MILES NW
H. SMITH FARM
4.6 MILES E
H WALKER FARM
1.2 MILES NW
Annual Mean
Mean (F)
Range
See Note 2
26 VALUES < LLD
3.55E+01 (13/26)
2.01E+01 - 7.10E+01
1.39E+03 (26/26)
1.27E+03 - 1.53E+03
26 VALUES < LLD
3.34E+01 (10/26)
2.11E+01 - 5.85E+01
26 VALUES < LLD
2.86E+00 (2/4)
2.12E+00 - 3.59E+00
Control Locations
Mean (F)
Range
See Note 2
51 VALUES < LLD
51 VALUES < LLD
3.92E+01 (19/51)
2.03E+01 - 9.27E+01
1.28E+03 (51/51)
1.13E+03 - 1.43E+03
51 VALUES < LLD
3.20E+01 (15/51)
2.07E+01 - 5.72E+01
51 VALUES < LLD
8 VALUES < LLD
8 VALUES < LLD
Number of
Nonroutine
Reported
Measurements
Note: 1. Nominal Lower Level of Detection (LLD) as described in Table E -1
Note: 2. Mean and Range based upon detectable measurements only. Fraction of detectable measurements at specified location is indicated in parentheses (F).

Tennessee Valley Authority
Environmental Radiological Monitoring and Instrumentation
Western Area Radiological Laboratory
RADIOACTIVITY IN SOIL
PCI/GM - 0.037 BQ/G (DRY WEIGHT)
ON
Name of Facility: SEQUOYAH NUCLEAR PLANT
Location of Facility: HAMILTON TENNESSEE
Type and
Total Number
of Analysis
Performed
GAMMA SCAN (GELI) 12
AC-228
BE-7
BI-212
BI-214
CS-137
K-40
PB-212
PB-214
RA-224
RA-226
TL-208
SR89 12
SR90 12
Lower Limit
of Detection
(LLD)
See Note 1
2.50E-01
2.50E-01
4.50E-01
1.50E-01
3.00E-02
7.50E-01
1.00E-01
150E-01
7.50E-01
1.50E-01
6.00E-02
1.60E+00
4.00E-01
Indicator Locations
Mean (F)
Range
See Note 2
9.11E-01 (8/8)
5.44E-01 - 1.23E+00
3.17E-01 (5/8)
2.59E-01 - 3.53E-01
9.80E-01 (8/8)
5.20E-01 - 1.32E+00
9.43E-01 (8/8)
6.92E-01 - 1.26E+00
3.79E-01 (8/8)
1.26E-01 - 5.66E-01
5.79E+00 (8/8)
2.35E+00 - 1.20E+01
8.83E-01 (8/8)
5.32E-01 - 1.16E+00
1.02E+00 (8/8)
7.93E-01 - 1.33E+00
1.11E+00 (3/8)
1.03E+00 - 1.20E+00
9.43E-01 (8/8)
6.92E-01 - 1.26E+00
2.96E-01 (8/8)
1.59E-01 - 3.80E-01
8 VALUES < LLD
8 VALUES < LLD
Location with Highest
Name
Distance and Direction
LM-4 SKULL ISLAND
1.5 MILES NE
PM-8 HARRISON TN
8.7 MILES SSW
LM-4 SKULL ISLAND
1.5 MILES NE
LM-4 SKULL ISLAND
1.5 MILES NE
LM-4 SKULL ISLAND
1.5 MILES NE
LM-2 NORTH
0.8 MILES NORTH
LM-2 NORTH
0.8 MILES NORTH
LM-4 SKULL ISLAND
1.5 MILES NE
LM-2 NORTH
0.8 MILES NORTH
LM-4 SKULL ISLAND
1.5 MILES NE
LM-4 SKULL ISLAND
1.5 MILES NE
Docket Number: 50-327,328
Reporting Period: 2008
Annual Mean Control Locations Number of
Mean (F) Mean (F) Nonroutine
Range Range Reported
See Note 2 See Note 2 Measurements
1.23E+00 (1/1)
1.23E+00 - 1.23E+00
3.53E-01 (1/1)
3.53E-01 - 3.53E-01
1.32E+00 (1/1)
1.32E+00 - 1.32E+00
1.26E+00 (1/1)
1.26E+00 - 1.26E+00
5.66E-01 (1/1)
5.66E-01 - 5.66E-01
1.20E+01 (1/1)
1.20E+01 - 1.20E+01
1.16E+00 (1/1)
1.16E+00 - 1.16E+00
1.33E+00 (1/1)
1.33E+00 - 1.33E+00
1.20E+00 (1/1)
1.20E+00 - 1.20E+00
1.26E+00 (1/1)
1.26E+00 - 1.26E+00
3.80E-01 (1/1)
3.80E-01 - 3.80E-01
7.85E-01 (4/4)
5.18E-01 - 1.02E+00
3.87E-01 (3/4)
2.73E-01 - 5.26E-01
8.14E-01 (4/4)
4.94E-01 - 1.08E+00
8.63E-01 (4/4)
6.64E-01 - 1.01E+00
2.05E-01 (4/4)
1.38E-01 - 3.58E-01
5.02E+00 (4/4)
3.51 E+00 - 6.38E+00
7.65E-01 (4/4)
4.76E-01 - 1.04E+00
9.63E-01 (4/4)
7.03E-01 - 1.17E+00
1.11 E+00 (1/4)
1.11E+00 - 1.11E+00
8.63E-01 (4/4)
6.64E-01 - 1.01 E+00
2.62E-01 (4/4)
1.63E-01 - 3.27E-01
4 VALUES < LLD
4 VALUES < LLD
CD*
Note: 1. Nominal Lower Level of Detection (LLD) as described in Table E -1
Note: 2. Mean and Range based upon detectable measurements only. Fraction of detectable measurements at specified location is indicated in parentheses (F).
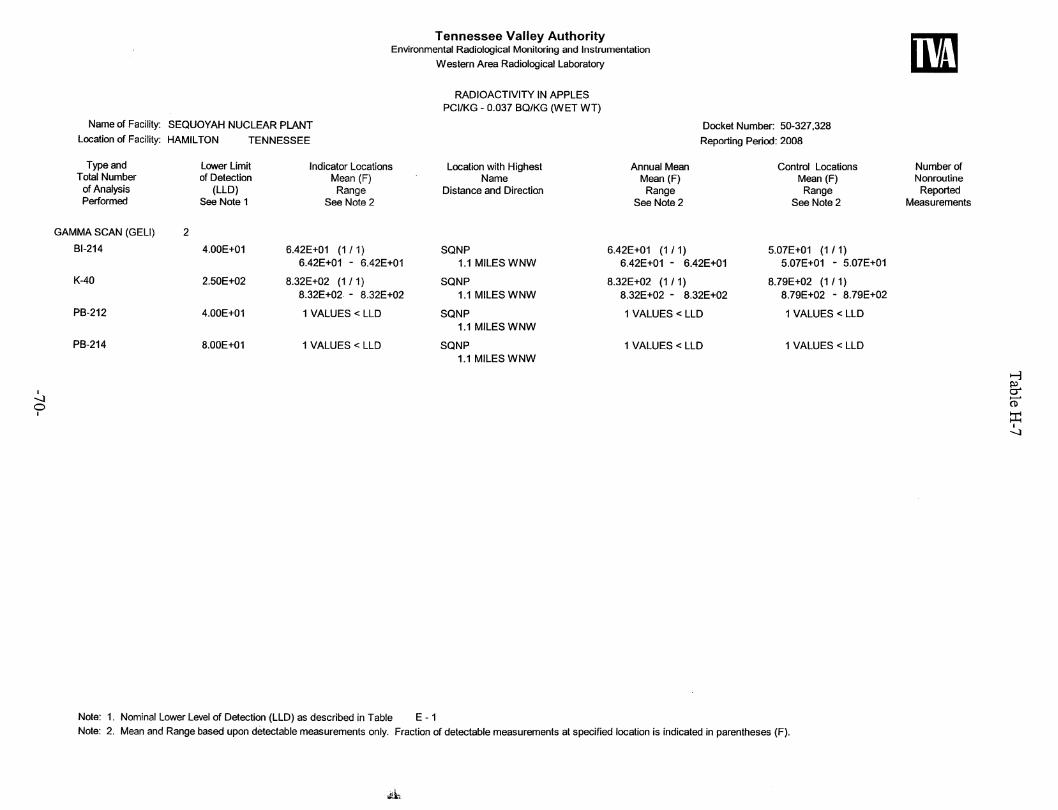
Tennessee Valley Authority
Environmental Radiological Monitoring and Instrumentation
Western Area Radiological Laboratory
RADIOACTIVITY IN APPLES
PCI/KG - 0.037 BQ/KG (WET WT)
Name of Facility: SEQUOYAH NUCLEAR PLANT
Location of Facility: HAMILTON TENNESSEE
Docket Number: 50-327,328
Reporting Period: 2008
Type and
Total Number
of Analysis
Performed
GAMMA SCAN (GELI)
BI-214
K-40
PB-212
PB-214
Lower Limit
of Detection
(LLD)
See Note 1
2
4.00E+01
2.50E+02
4.00E+01
8.00E+01
Indicator Locations
Mean (F)
Range
See Note 2
6.42E+01 (1/1)
6.42E+01 - 6.42E+01
8.32E+02 (1/1)
8.32E+02 - 8.32E+02
1 VALUES < LLD
1 VALUES < LLD
Location with Highest
Name
Distance and Direction
SQNP
1.1 MILES WNW
SQNP
1.1 MILES WNW
SQNP
1.1 MILES WNW
SQNP
1.1 MILES WNW
Annual Mean
Mean (F)
Range
See Note 2
6.42E+01 (1/1)
6.42E+01 - 6.42E+01
8.32E+02 (1/1)
8.32E+02 - 8.32E+02
1 VALUES < LLD
1 VALUES < LLD
Control Locations
Mean (F)
Range
See Note 2
5.07E+01 (1/1)
5.07E+01 - 5.07E+01
8.79E+02 (1/1)
8.79E+02 - 8.79E+02
1 VALUES < LLD
1 VALUES < LLD
Number of
Nonroutine
Reported
Measurements
9
i:
Note: 1. Nominal Lower Level of Detection (LLD) as described in Table E -1
Note: 2. Mean and Range based upon detectable measurements only. Fraction of detectable measurements at specified location is indicated in parentheses (F).

Tennessee Valley Authority
Environmental Radiological Monitoring and Instrumentation
Western Area Radiological Laboratory
RADIOACTIVITY IN CABBAGE
PCI/KG - 0.037 BQ/KG (WET WT)
Name of Facility: SEQUOYAH NUCLEAR PLANT
Location of Facility: HAMILTON TENNESSEE
Docket Number: 50-327,328
Reporting Period: 2008
Type and
Total Number
of Analysis
Performed
GAMMA SCAN (GELI)
BI-214
K-40
PB-214
Lower Limit
of Detection
(LLD)
See Note 1
2
4.00E+01
2.50E+02
8.00E+01
Indicator Locations
Mean (F)
Range
See Note 2
6.80E+01 (1/1)
6.80E+01 - 6.80E+01
1.62E+03 (1/1)
1.62E+03 - 1.62E+03
1 VALUES < LLD
Location with Highest
Name
Distance and Direction
H WALKER FARM
1.2 MILES NW
H WALKER FARM
1.2 MILES NW
H WALKER FARM
1.2 MILES NW
Annual Mean
Mean (F)
Range
See Note 2
6.80E+01 (1/1)
6.80E+01 - 6.80E+01
1.62E+03 (1/1)
1.62E+03 - 1.62E+03
1 VALUES < LLD
Control Locations
Mean (F)
Range
See Note 2
7.14E+01 (1/1)
7.14E+01 - 7.14E+01
1.22E+03 (1/1)
1.22E+03 - 1.22E+03
1 VALUES < LLD
Number of
Nonroutine
Reported
Measurements
CO
Note: 1. Nominal Lower Level of Detection (LLD) as described in Table E -1
Note: 2. Mean and Range based upon detectable measurements only. Fraction of detectable measurements at specified location is indicated in parentheses (F).

Tennessee Valley Authority
Environmental Radiological Monitoring and Instrumentation
Western Area Radiological Laboratory
RADIOACTIVITY IN CORN
PCI/KG - 0.037 BQ/KG (WET WT)
Name of Facility: SEQUOYAH NUCLEAR PLANT
Location of Facility: HAMILTON TENNESSEE
Docket Number: 50-327,328
Reporting Period: 2008
Type and
Total Number
of Analysis
Performed
GAMMA SCAN (GELI)
BI-214
K-40
PB-214
Lower Limit
of Detection
(LLD)
See Note 1
2
4.00E+01
2.50E+02
8.00E+01
Indicator Locations
Mean (F)
Range
See Note 2
6.10E+01 (1/1)
6.10E+01 - 6.10E+01
1.98E+03 (1/1)
1.98E+03 - 1.98E+03
1 VALUES < LLD
Location with Highest
Name
Distance and Direction
GOINS FARM
1.5 MILES NNW
GOINS FARM
1.5 MILES NNW
GOINS FARM
1.5 MILES NNW
Annual Mean
Mean (F)
Range
See Note 2
6.10E+01 (1/1)
6.10E+01 - 6.10E+01
1.98E+03 (1/1)
1.98E+03 - 1.98E+03
1 VALUES < LLD
Control Locations
Mean (F)
Range
See Note 2
5.77E+01 (1/1)
5.77E+01 - 5.77E+01
1.70E+03 (1/1)
1.70E+03 - 1.70E+03
1 VALUES < LLD
Number of
Nonroutine
Reported
Measurements
to
Note: 1. Nominal Lower Level of Detection (LLD) as described in Table E -1
Note: 2. Mean and Range based upon detectable measurements only. Fraction of detectable measurements at specified location is indicated in parentheses (F).
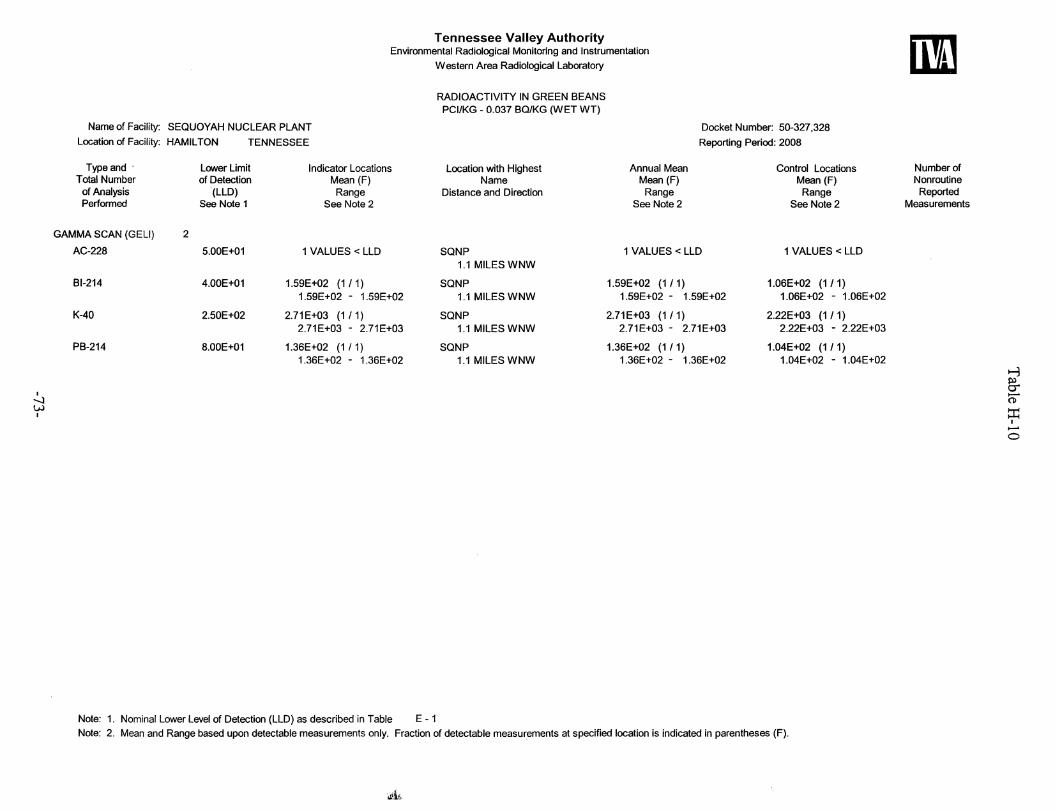
Tennessee Valley Authority
Environmental Radiological Monitoring and Instrumentation
Western Area Radiological Laboratory
RADIOACTIVITY IN GREEN BEANS
PCI/KG - 0.037 BQ/KG (WET WT)
Name of Facility: SEQUOYAH NUCLEAR PLANT
Location of Facility: HAMILTON TENNESSEE
Docket Number: 50-327,328
Reporting Period: 2008
Type and
Total Number
of Analysis
Performed
GAMMA SCAN (GELI)
AC-228
BI-214
K-40
PB-214
Lower Limit
of Detection
(LLD)
See Note 1
2
5.00E+01
4.00E+01
2.50E+02
8.00E+01
Indicator Locations
Mean (F)
Range
See Note 2
1 VALUES < LLD
1.59E+02 (1/1)
1.59E+02 - 1.59E+02
2.71 E+03 (1/1)
2.71 E+03 - 2.71 E+03
1.36E+02 (1/1)
1.36E+02 - 1.36E+02
Location with Highest
Name
Distance and Direction
SQNP
1.1 MILES WNW
SQNP
1.1 MILES WNW
SQNP
1.1 MILES WNW
SQNP
1.1 MILES WNW
Annual Mean
Mean (F)
Range
See Note 2
1 VALUES < LLD
1.59E+02 (1/1)
1.59E+02 - 1.59E+02
2.71 E+03 (1/1)
2.71 E+03 - 2.71 E+03
1.36E+02 (1/1)
1.36E+02 - 1.36E+02
Control Locations
Mean (F)
Range
See Note 2
1 VALUES < LLD
1.06E+02 (1/1)
1.06E+02 - 1.06E+02
2.22E+03 (1/1)
2.22E+03 - 2.22E+03
1.04E+02 (1/1)
1.04E+02 - 1.04E+02
Number of
Nonroutine
Reported
Measurements
OJ
a
o
Note: 1. Nominal Lower Level of Detection (LLD) as described in Table E -1
Note: 2. Mean and Range based upon detectable measurements only. Fraction of detectable measurements at specified location is indicated in parentheses (F).

Tennessee Valley Authority
Environmental Radiological Monitoring and Instrumentation
Western Area Radiological Laboratory
Name of Facility: SEQUOYAH NUCLEAR PLANT
Location of Facility: HAMILTON TENNESSEE
Type and
Total Number
of Analysis
Performed
Lower Limit
of Detection
(LLD)
See Note 1
Indicator Locations
Mean (F)
Range
See Note 2
RADIOACTIVITY IN TOMATOES
PCI/KG - 0.037 BQ/KG (WET WT)
Location with Highest
Name
Distance and Direction
Docket Number: 50-327,328
Reporting Period: 2008
Annual Mean Control Locations Number of
Mean (F) Mean (F) Nonroutine
Range Range Reported
See Note 2 See Note 2 Measurements
GAMMA SCAN (GELI) 2
BI-214 4.00E+01
K-40
PB-214
2.50E+02
8.00E+01
1.08E+02 (1/1)
1.08E+02 - 1.08E+02
2.34E+03 (1/1)
2.34E+03 - 2.34E+03
1.21 E+02 (1/1)
1.21 E+02 - 1.21 E+02
GOINS FARM
1.5 MILES NNW
GOINS FARM
1.5 MILES NNW
GOINS FARM
1.5 MILES NNW
1.08E+02 (1/1)
1.08E+02 - 1.08E+02
2.34E+03 (1/1)
2.34E+03 - 2.34E+03
1.21 E+02 (1/1)
1.21 E+02 - 1.21 E+02
4.89E+01 (1/1)
4.89E+01 - 4.89E+01
2.15E+03 (1/1)
2.15E+03 - 2.15E+03
1 VALUES < LLD
ffi
Note: 1. Nominal Lower Level of Detection (LLD) as described in Table E -1
Note: 2. Mean and Range based upon detectable measurements only. Fraction of detectable measurements at specified location is indicated in parentheses (F).

Tennessee Valley Authority
Environmental Radiological Monitoring and Instrumentation
Western Area Radiological Laboratory
Name of Facility: SEQUOYAH NUCLEAR PLANT
Location of Facility: HAMILTON TENNESSEE
Type and
Total Number
of Analysis
Performed
GROSS BETA 26
GAMMA SCAN (GELI) 26
AC-228
Bl-214
K-40
PB-212
PB-214
TL-208
TRITIUM 21
Lower Limit
of Detection
(LLD)
See Note 1
1.90E+00
2.00E+01
2.00E+01
1.00E+02
1.50E+01
2.00E+01
1.00E+01
2.70E+02
Indicator Locations
Mean (F)
Range
See Note 2
2.69E+00 (11/13)
2.20E+00 - 3.96E+0C
13 VALUES < LLD
4.10E+01 (7/13)
2.58E+01 - 6.97E+01
13 VALUES < LLD
13 VALUES < LLD
3.67E+01 (5/13)
2.11E+01 - 6.38E+01
13 VALUES < LLD
4.77E+02 (2/4)
3.31 E+02 - 6.22E+02
RADIOACTIVITY IN SURFACE WATER(Total)
PCI/L - 0.037 BQ/L
Location with Highest
Name
Distance and Direction
TRM 483.4
TRM 483.4
TRM 483.4
TRM 483.4
TRM 483.4
TRM 483.4
TRM 483.4
TRM 483.4
Docket Number: 50-327,328
Reporting Period: 2008
Annual Mean Control Locations Number of
Mean (F) Mean (F) Nonroutine
Range Range Reported
See Note 2 See Note 2 Measurements
2.69E+00 (11/13)
2.20E+00 - 3.96E+00
13 VALUES < LLD
4.10E+01 (7/13)
2.58E+01 - 6.97E+01
13 VALUES < LLD
13 VALUES < LLD
3.67E+01 (5/13)
2.11E+01 - 6.38E+01
13 VALUES < LLD
4.77E+02 (2/4)
3.31 E+02 - 6.22E+02
2.67E+00 (12/13)
1.94E+00 - 3.93E+00
13 VALUES < LLD
4.95E+01 (8/13)
2.05E+01 - 1.33E+02
13 VALUES < LLD
13 VALUES < LLD
4.78E+01 (5/13)
2.73E+01 - 9.72E+01
13 VALUES < LLD
4.55E+02 (3/17)
4.09E+02 - 5.31 E+02
ffi
Note: 1. Nominal Lower Level of Detection (LLD) as described in Table E -1
Note: 2. Mean and Range based upon detectable measurements only. Fraction of detectable measurements at specified location is indicated in parentheses (F).

Tennessee Valley Authority
Environmental Radiological Monitoring and Instrumentation
Western Area Radiological Laboratory
RADIOACTIVITY IN PUBLIC WATER(Total)
PCI/L - 0.037 BQ/L
Name of Facility: SEQUOYAH NUCLEAR PLANT
Location of Facility: HAMILTON TENNESSEE
O\
Type and
Total Number
of Analysis
Performed
GROSS BETA
GAMMA SCAN (GELI)
AC-228
BI-214
K-40
PA-234M
PB-212
PB-214
TL-208
fRITIUM
Lower Limit
of Detection
(LLD)
See Note 1
52
1.90E+00
52
2.00E+01
2.00E+01
1.00E+02
8.00E+02
1.50E+01
2.00E+01
1.00E+01
42
2.70E+02
Indicator Locations
Mean (F)
Range
See Note 2
3.08E+00 (25/39)
1.91E+00 - 5.74E+00
39 VALUES < LLD
5.52E+01 (30/39)
2.15E+01 - 1.37E+02
1.12E+02 (1 /39)
1.12E+02 - 1.12E+02
39 VALUES < LLD
39 VALUES < LLD
4.53E+01 (23/39)
2.27E+01 - 1.24E+02
39 VALUES < LLD
3.88E+02 (8/25)
2.83E+02 - 6.31 E+02
Location with Highest
Name
Distance and Direction
CF INDUSTRIES
TRM 473.0
E.I. DUPONT
TRM 470.5
CF INDUSTRIES
TRM 473.0
CF INDUSTRIES
TRM 473.0
CF INDUSTRIES
TRM 473.0
E.I. DUPONT
TRM 470.5
CF INDUSTRIES
TRM 473.0
CHATTANOOGA
TRM 465.3
CF INDUSTRIES
TRM 473.0
Annual Mean
Mean (F)
Range
See Note 2
3.27E+00 (11/13)
2.58E+00 - 4.62E+00
13 VALUES < LLD
6.00E+01 (9/13)
2.53E+01 - 1.37E+02
1.12E+02 (1/13)
1.12E+02 - 1.12E+02
13 VALUES < LLD
13 VALUES < LLD
4.95E+01 (7/13)
2.48E+01 - 1.24E+02
13 VALUES < LLD
3.98E+02 (7/17)
2.83E+02 - 6.31 E+02
Docket Number: 50-327,328
Reporting Period: 2008
Control Locations
Mean (F)
Range
See Note 2
2.67E+00 (12/13)
1.94E+00 - 3.93E+00
13 VALUES < LLD
4.95E+01 (8/13)
2.05E+01 - 1.33E+02
13 VALUES < LLD
13 VALUES < LLD
13 VALUES < LLD
4.78E+01 (5/13)
2.73E+01 - 9.72E+01
13 VALUES < LLD
4.55E+02 (3/17)
4.09E+02 - 5.31 E+02
Number of
Nonroutine
Reported
Measurements
Note: 1. Nominal Lower Level of Detection (LLD) as described in Table E -1
Note: 2. Mean and Range based upon detectable measurements only. Fraction of detectable measurements at specified location is indicated in parentheses (F).
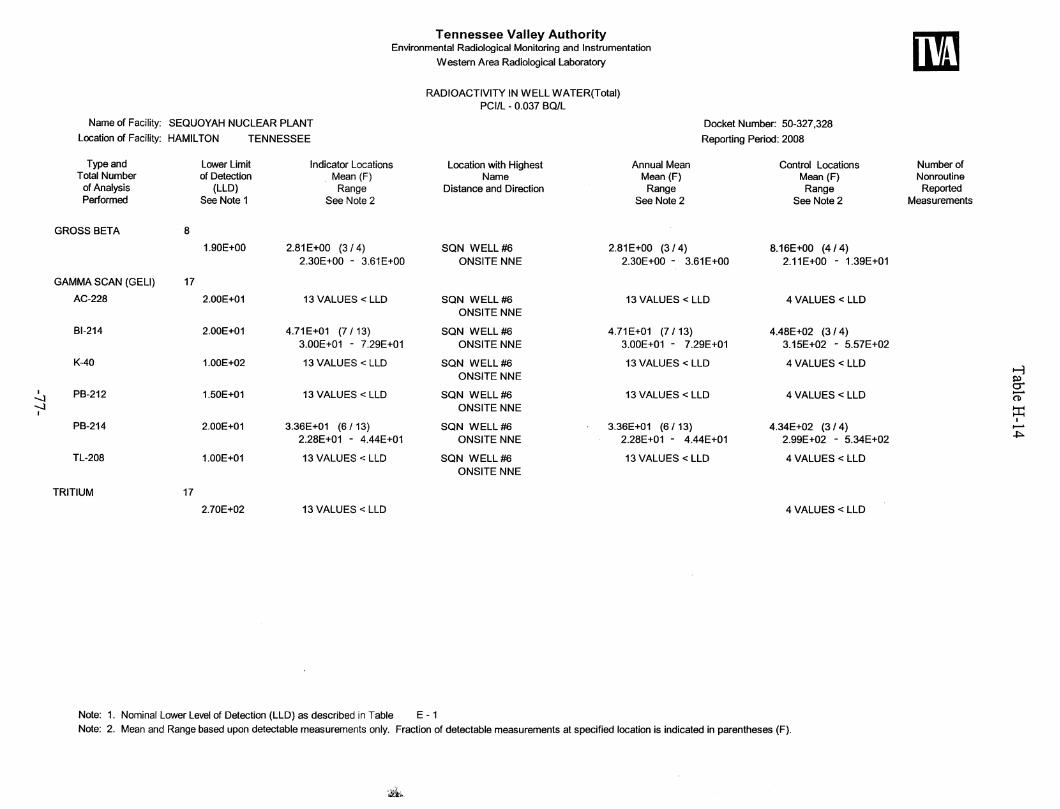
Tennessee Valley Authority
Environmental Radiological Monitoring and Instrumentation
Western Area Radiological Laboratory
RADIOACTIVITY IN WELL WATER(Total)
PCI/L - 0.037 BQ/L
Name of Facility: SEQUOYAH NUCLEAR PLANT
Location of Facility: HAMILTON TENNESSEE
Type and
Total Number
of Analysis
Performed
GROSS BETA
GAMMA SCAN (GELI)
AC-228
BI-214
K-40
PB-212
PB-214
TL-208
fRITIUM
Lower Limit
of Detection
(LLD)
See Note 1
8
1.90E+00
17
2.00E+01
2.00E+01
1.00E+02
1.50E+01
2.00E+01
1.00E+01
17
2.70E+02
Indicator Locations
Mean (F)
Range
See Note 2
2.81 E+00 (3/4)
2.30E+00 - 3.61 E+00
13 VALUES < LLD
4.71 E+01 (7/13)
3.00E+01 - 7.29E+01
13 VALUES < LLD
13 VALUES < LLD
3.36E+01 (6/13)
2.28E+01 - 4.44E+01
13 VALUES < LLD
13 VALUES < LLD
Location with Highest
Name
Distance and Direction
SQN WELL #6
ONSITE NNE
SQN WELL #6
ONSITE NNE
SQN WELL #6
ONSITE NNE
SQN WELL #6
ONSITE NNE
SQN WELL #6
ONSITE NNE
SQN WELL #6
ONSITE NNE
SQN WELL #6
ONSITE NNE
Annual Mean
Mean (F)
Range
See Note 2
2.81 E+00 (3/4)
2.30E+00 - 3.61 E+00
13 VALUES < LLD
4.71E+01 (7/13)
3.00E+01 - 7.29E+01
13 VALUES < LLD
13 VALUES < LLD
3.36E+01 (6/13)
2.28E+01 - 4.44E+01
13 VALUES < LLD
Docket Number: 50-327,328
Reporting Period: 2008
Control Locations
Mean (F)
Range
See Note 2
8.16E+00 (4/4)
2.11 E+00 - 1.39E+01
4 VALUES < LLD
4.48E+02 (3/4)
3.15E+02 - 5.57E+02
4 VALUES < LLD
4 VALUES < LLD
4.34E+02 (3/4)
2.99E+02 - 5.34E+02
4 VALUES < LLD
4 VALUES < LLD
Number of
Nonroutine
Reported
Measurements
ffi
Note: 1. Nominal Lower Level of Detection (LLD) as described in Table E -1
Note: 2. Mean and Range based upon detectable measurements only. Fraction of detectable measurements at specified location is indicated in parentheses (F).

Tennessee Valley Authority
Environmental Radiological Monitoring and Instrumentation
Western Area Radiological Laboratory
RADIOACTIVITY IN COMMERCIAL FISH
PCI/GM - 0.037 BQ/G (DRY WEIGHT)
Name of Facility: SEQUOYAH NUCLEAR PLANT
Location of Facility: HAMILTON TENNESSEE
Docket Number: 50-327,328
Reporting Period: 2008
Type and
Total Number
of Analysis
Performed
GAMMA SCAN (GELI)
BI-214
CS-137
K-40
PB-214
Lower Limit
of Detection
(LLD)
See Note 1
4
1.00E-01
3.00E-02
4.00E-01
5.00E-01
Indicator Locations
Mean (F)
Range
See Note 2
125E-01 (2/2)
1.13E-01 - 1.37E-01
3.07E-02 (1/2)
3.07E-02 - 3.07E-02
1.10E+01 (2/2)
9.20E+00 - 1.28E+01
2 VALUES < LLD
Location with Highest
Name
Distance and Direction
CHICKAMAUGA RES
TRM 471-530
CHICKAMAUGA RES
TRM 471-530
CHICKAMAUGA RES
TRM 471-530
CHICKAMAUGA RES
TRM 471-530
Annual Mean
Mean (F)
Range
See Note 2
1.25E-01 (2/2)
1.13E-0.1 - 1.37E-01
3.07E-02 (1/2)
3.07E-02 - 3.07E-02
1.10E+01 (2/2)
9.20E+00 - 1.28E+01
2 VALUES < LLD
Control Locations
Mean (F)
Range
See Note 2
1.63E-01 (1/2)
1.63E-01 - 1.63E-01
5.49E-02 (2/2)
4.24E-02 - 6.73E-02
1.10E+01 (2/2)
1.05E+01 - 1.14E+01
2 VALUES < LLD
Number of
Nonroutine
Reported
Measurements
COffi
Note: 1. Nominal Lower Level of Detection (LLD) as described in Table E -1
Note: 2. Mean and Range based upon detectable measurements only. Fraction of detectable measurements at specified location is indicated in parentheses (F).

Tennessee Valley Authority
Environmental Radiological Monitoring and Instrumentation
Western Area Radiological Laboratory
RADIOACTIVITY IN GAME FISH
PCI/GM - 0.037 BQ/G (DRY WEIGHT)
Name of Facility: SEQUOYAH NUCLEAR PLANT
Location of Facility: HAMILTON TENNESSEE
Docket Number: 50-327,328
Reporting Period: 2008
Type and
Total Number
of Analysis
Performed
GAMMA SCAN (GELI)
BI-214
CS-137
K-40
PB-212
PB-214
Lower Limit
of Detection
(LLD)
See Note 1
4
1.00E-01
3.00E-02
4.00E-01
4.00E-02
5.00E-01
Indicator Locations
Mean (F)
Range
See Note 2
1.32E-01 (2/'2)
1.03E-01 - 1.61E-01
2 VALUES < LLD
1.21E+01 (2/2)
1.01E+01 - 1.40E+01
2 VALUES < LLD
2 VALUES < LLD
Location with Highest
Name
Distance and Direction
CHICKAMAUGA RES
TRM 471-530
CHICKAMAUGA RES
TRM 471-530
CHICKAMAUGA RES
TRM 471-530
CHICKAMAUGA RES
TRM 471-530
CHICKAMAUGA RES
TRM 471-530
Annual Mean
Mean (F)
Range
See Note 2
1.32E-01 (2/2)
103E-01 - 1.61E-01
2 VALUES < LLD
1.21E+01 (2/2)
1.01E+01 - 1.40E+01
2 VALUES < LLD
2 VALUES < LLD
Control Locations
Mean (F)
Range
See Note 2
1.09E-01 (1/2)
1.09E-01 - 1.09E-01
5.55E-02 (2/2)
4.35E-02 - 6.75E-02
129E+01 (2/2)
1.26E+01 - 1.32E+01
2 VALUES < LLD
2 VALUES < LLD
Number of
Nonroutine
Reported
Measurements
vo
ctT
Note: 1. Nominal Lower Level of Detection (LLD) as described in Table E -1
Note: 2. Mean and Range based upon detectable measurements only. Fraction of detectable measurements at specified location is indicated in parentheses (F).

Tennessee Valley Authority
Environmental Radiological Monitoring and Instrumentation
Western Area Radiological Laboratory
RADIOACTIVITY IN SHORELINE SEDIMENT
PCI/GM - 0.037 BQ/G (DRY WEIGHT)
oo
o
Name of Facility:
Location of Facility:
Type and
Total Number
of Analysis
Performed
GAMMA SCAN (GELI)
AC-228
BE-7
BI-212
BI-214
CS-137
K-40
PB-212
PB-214
RA-224
RA-226
TL-208
SEQUOYAH NUCLEAR PLANT
HAMILTON TENNESSEE
Lower Limit
of Detection
(LLD)
See Note 1
6
2.50E-01
2.50E-01
4.50E-01
1.50E-01
3.00E-02
7.50E-01
1.00E-01
1.50E-01
7.50E-01
1.50E-01
6.00E-02
Indicator Locations
Mean (F)
Range
See Note 2
1.27E+00 (4/4)
1.14E+00 - 1.40E+00
4.45E-01 (1/4)
4.45E-01 - 4.45E-01
1.25E+00 (4/4)
1.15E+00 - 1.33E+00
8.43E-01 (4/4)
5.96E-01 - 1.12E+00
3.83E-02 (1/4)
3.83E-02 - 3.83E-02
1.91E+01 (4/4)
7.50E+00 - 3.31 E+01
1.27E+00 (4/4)
1.12E+00 - 1.38E+00
9.06E-01 (4/4)
6.29E-01 - 1.19E+00
1.39E+00 (3/4)
1.32E+00 - 1.44E+00
8.43E-01 (4/4)
5.96E-01 - 1.12E+00
3.98E-01 (4/4)
3.67E-01 - 4.23E-01
Location with Highest
Name
Distance and Direction
TRM 479.0
TRM 479.0
TRM 480.0
TRM 480.0
TRM 479.0
TRM 479.0
TRM 479.0
TRM 479.0
TRM 480.0
TRM 480.0
TRM 480.0
TRM 480.0
TRM 480.0
TRM 480.0
TRM 479.0
TRM 479.0
TRM 479.0
TRM 479.0
TRM 479.0
TRM 479.0
TRM 479.0
TRM 479.0
Docket Number: 50-327,328
Reporting Period: 2008
Annual Mean
Mean (F)
Range
See Note 2
1.34E+00 (2/2)
1.28E+00 - 1.40E+00
4.45E-01 (1/2)
4.45E-01 - 4.45E-01
1.30E+00 (2/2)
1.26E+00 - 1.33E+00
1.06E+00 (2/2)
9.99E-01 - 1.12E+00
3.83E-02 (1/2)
3.83E-02 - 3.83E-02
3.01 E+01 (2/2)
2J0E+01 - 3.31 E+01
1.29E+00 (2/2)
1.25E+00 - 1.32E+00
1.16E+00 (2/2)
1.12E+00 - 1.19E+00
1.44E+00 (1/2)
1.44E+00 - 1.44E+00
1.06E+00 (2/2)
9.99E-01 - 1.12E+00
4.14E-01 (2/2)
4.05E-01 - 4.23E-01
Control Locations
Mean (F)
Range
See Note 2
1.17E+00 (2/2)
8.68E-01 - 1.47E+00
3.54E-01 (1/2)
3.54E-01 - 3.54E-01
1.31E+00 (2/2)
8.93E-01 - 1.72E+00
1.03E+00 (2/2)
6.56E-01 - 1.40E+00
4.76E-02 (1/2)
4.76E-02 - 4.76E-02
6.09E+00 (2/2)
3.78E+00 - 8.40E+00
1.07E+00 (2/2)
7.77E-01 - 1.37E+00
1.08E+00 (2/2)
6.84E-01 - 1.48E+00
2 VALUES < LLD
1.03E+00 (2/2)
6.56E-01 - 1.40E+00
3.82E-01 (2/2)
2.67E-01 - 4.96E-01
Number of
Nonroutine
Reported
Measurements
Note: 1. Nominal Lower Level of Detection (LLD) as described in Table E -1
Note: 2. Mean and Range based upon detectable measurements only. Fraction of detectable measurements at specified location is indicated in parentheses (F).

25
20
00
s
3 15oQ.X
Lit
2a>
10
5 —
1970
Direct Radiation Levels
Sequoyah Nuclear Plant
Four Quarter Moving Average
Initial SQNP operation in July, 1980 InLight OSL deployment in Jan 2007
—A— On-Site
-O-Off-Site
o
1975 1980 1985 1990 1995
Calendar Year
2000 2005 2010 2015
;■'&.

Annual Average Gross Beta Activity
in Air Filters
Sequoyah Nuclear Plant
00to
CO<
E
o
0.25 r
0.20
0.15
3 0.100)
2
< 0.05
0.00
Initial SQNP Operation in July, 1980
- Indicator
- Control
O
I
to
1965 1970 1975 1980
Note: no gross beta measurements
w ere made in 1974
1985 1990
Calendar Year
1995 2000 2005 2010

00
3.0
Annual Average Activity
ofCs-137inSoil
Sequoyah Nuclear Plant
Initial SQNP Operation in July, 1980
- Indicator
- Control
O
U)
1975 1980 1985 1990
Calendar Year
1995 2000 2005 2010

Average Annual Gross Beta Activity
in Surface Water
Sequoyah Nuclear Plant
oo
6 r- -
oQ.
I 3<
5<
0
1970
Initial SQNP
Operation in
July, 1980
- Indicator
- Control
o
1975 1980 1985 1990
Calendar Year
1995 2000 2005 2010
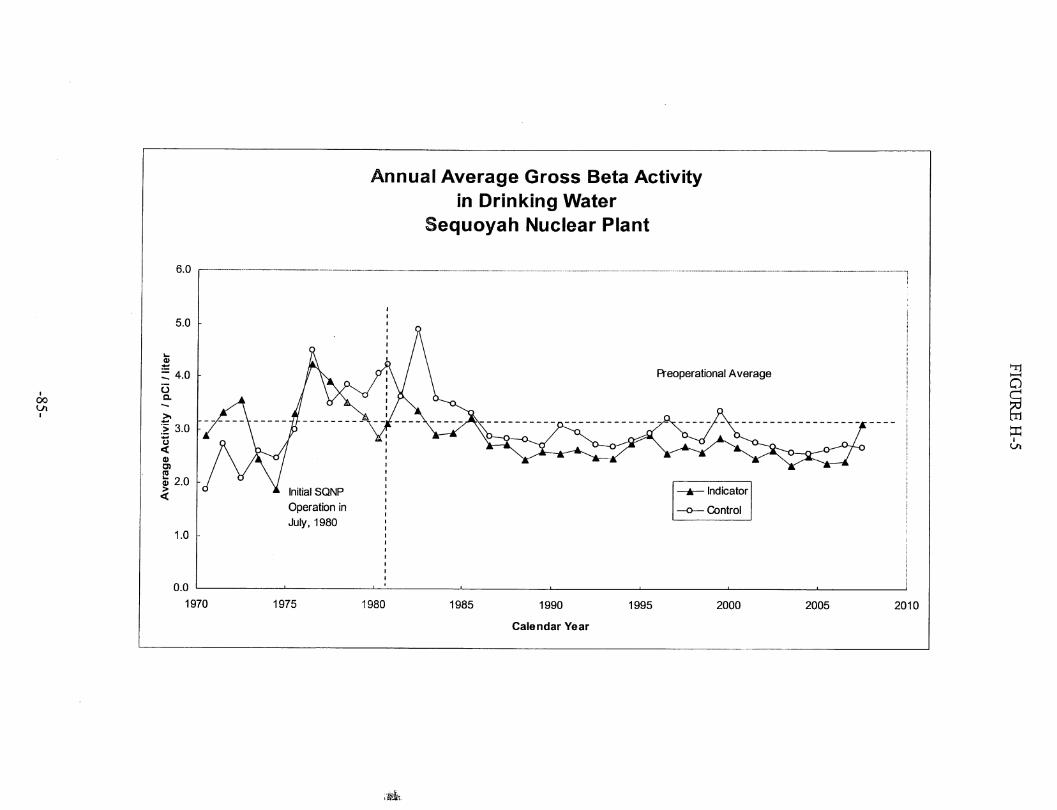
00
6.0
5.0
- 4.0
1.0
0.0
1970
Annual Average Gross Beta Activity
in Drinking Water
Sequoyah Nuclear Plant
Initial SQNP
Operation in
July, 1980
FVeoperational Average
o
- Indicator
- Control
1975 1980 1985 1990
Calendar Year
1995 2000 2005 2010

Annual Average Activity
Cs-137 in Game Fish
Sequoyah Nuclear Plant
oo
0.60
0.50
E0.40
Oa
0.30
0.20|
i0.10
0.00
1970
Initial SQNP Operation
in July, 1980
- Dow nstream
- Upstream
I—I
o
On
1975 1980 1985 1990
Calendar Year
1995 2000 2005 2010

Annual Average Activity
Cs-137 in Shoreline Sediment
Sequoyah Nuclear Plant
00
0.30
0.25
20.20
oQ.
I* 0.15
<
I 0.10
I0.05
0.00
Note: Initial SQNP Operation in
July, 1980. There was no
preoperational sampling of
shoreline sediment
- Dow nstream
- Upstream a
1970 1975 1980 1985 1990
Calendar Year
1995 2000 2005 2010