Embed Size (px)
Citation preview

April 2018 Entire Research, Volume-X, Issue-II
ISSN 0975-5020
INDEX
Sr. Research Subject Pg. No.
Editorial
1 Influence of Structural Parameters on the Fundamental Time Period of
Multistoried Regular RC Building Frames: Matias Abebe Mengistu,
Saravanakumar Jagannathan
1-37
2 Application of Traditional Ecological knowledge for Sustainable Ecological
Restoration- Concepts and Cases: R. N. Gamachchige
38-52
3 The Future of Organic Electronics: Small Molecules and Conducting
Polymers: Sonali Kokane
53-56
4 A Study of Problems Faced by Customers While Using ATMs and Internet
Banking Products in Public Sector V/S Private Sector Banks in Thane Region:
Vrushali Ravindra Alve, Shreya Mohan Pandit, Sanchit Sanjay Agarwal,
Dr.Shraddha M. Bhome
57-63
5 A Study of Green Banking as Innovative Ethical Banking WRT State Bank of
India: Anita Nallamuthu Konar, Pooja Jagannath Kharat, Jyoti Vithoba
Dhavan
64-68
6 Analysis of Customer‘s Opinion about Mobile Banking WRT Mumbai
Region: Shreya Mahesh Newaskar, Jewelson Wilson Fernandes
69-76
7 Effect of Yoga on Muscular Endurance of Slum Area Girls of Mumbai:
Dr. Rohini Chandrakant Kawade
77-80

April 2018 Entire Research, Volume-X, Issue-II
ISSN 0975-5020
Editorial INFORMATION TECHNOLOGY: A Necessity
Information technology is the technology used to store, control, disseminate or make
data. All these can be summed up effectively – It's having learning, and learning originates
from having information. Gaining knowledge through information is the role of
“information technology” IT in today’s educated world. IT is a set of tools that can help
provide the right people with the right information at the right time. Though IT is not a
solution to everything, for IT to work, people must learn how to use it. So, you cannot
assume that IT will work for you to share information across the organization when people
in the organization don’t know how to use it. The present society is diverse to the one that
existed not all that numerous years back. Our society is constantly evolving. The most
imperative qualities of our time might be the change, transmission, and domain of
information. We live in an information society where the main part has been given to new
advances, particularly those committed to an information. Our society couldn't be envisioned
without new innovations and their part both in this society and in human life when all is
said in done. Current innovation has changed individuals' communication tool.
Technology is building spans between individuals on inverse sides of the globe,
bringing individuals from all societies and foundations into contact with each other. The
Internet has a colossal information. Technology has made it workable for this data to reach
far and wide. IT assumes an essential part in every one of the segments for instance
education, banking, insurance, transport, communication, and so forth. In this quicker and
present-day world, Education is an unavoidable fragment. Online education has set in,
making it conceivable to render learning to students occupying remote areas on Earth. The
new part of data innovation is Online tuition educating. Change of IT makes another route
for the students for new creations. It is because of the World Wide Web that the
information could achieve every last one over the computer networks. Likewise, current
innovation has additionally given approaches to develop more sustenance, transport more
individuals and make more items for a developing society. Computerization of procedures
has realized productivity and speed. Expedient execution of assignments has spared human
exertion and time. Yet, in my opinion, new advances in some cases are influencing
individuals to dull. Because of reliance on innovation for each errand. So, we require
advances, since they are making our lives more agreeable and security, yet how about we not
make innovations our propensity. To conclude, if we use the IT in a proper way, we can say
that information technology plays an effective role.

April 2018 Entire Research, Volume-X, Issue-II 1
ISSN 0975-5020
Influence of Structural Parameters on the Fundamental Time
Period of Multistoried Regular RC Building Frames
Matias Abebe Mengistu: Lecturer, Civil Engineering Department, College of Engineering
and Technology, Adigrat University, Ethiopia
Saravanakumar Jagannathan: Lecturer, Civil Engineering Department, College of
Engineering and Technology, Adigrat University, Ethiopia
Abstract:
Ethiopian Building Code Standards, Part 8 (EBCS-8) express the fundamental time
period 𝑇1 approximately as a function of the building height (𝐻) only 𝑇1 = 𝐶1𝐻3 4 , thus
to verify the level of appropriateness, an extensive study was conducted to identify the
important structural parameters and their influence on the fundamental time period of regular
multistory RC building frames for earthquake resistant design.
Data were gathered and selected model frames were analyzed by modal analysis
technique using computer software SAP 2000 v14 and Rayleigh‘s formula. Periods of model
frames were plotted against respective parameters.
This study have identified the important building frame parameters that govern the
earthquake response of a regular building frame structure, and thus appreciated the influence
of structural parameters on fundamental time period of regular reinforced concrete moment
resisting multistoried building frames by providing an improved alternative empirical relation.
Key Words: Fundamental Time Period, EBCS-8, Rayleigh‘s Method, Equivalent Static
Analysis, Modal Analysis, Earthquake Resistant Design, Base Shear, Structural Parameters,
Regular Moment Resisting Building Frames.
1. Introduction
1.1 Background
Building frames are the most widely used structural systems in construction practice.
Seismic codes including EBCS-8 suggest Equivalent Static Method for earthquake resistant
design.
This method suggest a simplified equivalent static approach for the calculation of
base shear and its distribution as earthquake forces over the height of the building frame [1].
In this approach, to calculate the fundamental time period (𝑇1)for regular frames up to 80m
height, the code provides an approximate formula 𝑇1 = 𝐶1𝐻3
4 in terms of building height.
Then this fundamental time period is used for the determination of the base shear. Thus the
base shear obtained by using the formula (𝑇1 = 𝐶1𝐻3/4) is of conservative nature.
1.2 Problem Statement
Lack of consideration of other structural parameters makes this code formula wholly
approximate. According to modal analysis technique, however, frequency and hence time
period of a structure are functions of its stiffness and mass [2]. It is anticipated, therefore, the
fundamental time period of the structure would be influenced in addition to height by the
width and number of bays, size of columns and beams, strength and density of concrete of
frames, as these would affect the stiffness and mass.

April 2018 Entire Research, Volume-X, Issue-II 2
ISSN 0975-5020
Thus the intention of this study is to bring, the effect of structural parameters into
attention since using the approximate formula leads to an under/over estimation of the
earthquake forces. If it‘s underestimated it will eventually lead to an unexpected structural
failure, caused by inadequate provision of section dimensions of structural elements,
endangering the livelihood of the occupants and loss of property in the building and if it‘s
overestimated it will cause a huge impact on economy due to exaggerations in providing
section dimensions of structural elements.
1.3 Objectives
A detailed literature review was carried to define the objectives. Next chapter is
giving the in-depth details of literature review carryout for this thesis work.
1.3.1 General Objective
Broadly the objective of this study is to examine the influence of different structural
parameters on fundamental time period of regular RC building frames for earthquake resistant
design. Particularly the followings were the specific objectives
1.3.2 Specific Objectives 1. To compare the fundamental time period by approximate formula and the modal analysis.
2. To outline the possible implications of the effects of the parameters on period in light of
Earthquake resistant design.
3. To come up with a new empirical formula comprising of the investigated parameters
The following research questions were addressed in the study.
1.4 Significance
Apart from the researcher‘s personal interest and detail self-acquaintance on the subject
matter the thesis work will be useful in the following aspects
(i) To bring into attention the effect of structural parameters, other than building height, on
fundamental period.
(ii) To reduce the under/over estimation of the earthquake forces, that arise from using the
approximate formulae suggested in EBCS-8, which have a great role in determining
economy and structural safety or wellbeing of occupants during such natural hazards.
(iii) To incorporate the effects of structural parameters on earthquake resistant designs which
otherwise could be taken as conservative by providing the necessary design data
(empirical formula).
(iv) To encourage other researchers to pursue further study in this area.
1.5 Scope
(i) The present study is limited to reinforced concrete (RC) regular and symmetric multi-
storied moment resisting building frames.
(ii) Infill stiffness is not considered in the present study. However, associated mass and
weight is assumed in the analysis.
(iii) Moment resisting building frames from 3storeys to20storeys with different variations of
system parameters are considered.
(iv) Soil-structure interaction effects are not considered in the present study.
(v) Column ends are assumed to be fixed at the foundation.
1.6 Origin of the Code Formula
The magnitude of the mass and the stiffness of the structure are not separable, and do
affect simultaneously the response to ground motion. However, because the structure is
subjected to a base motion and not to a force, the maximum stress that the structure
experiences is a function of its stiffness as well as of its period of vibration. But for ease of

April 2018 Entire Research, Volume-X, Issue-II 3
ISSN 0975-5020
calculation codes suggest approximate formulae for the base shear force and period. [1].
Base Shear and period by EBCS-8
According to EBCS-8 base shear Fbis given by;
Fb= Sd (T1) W (1)
Where, Sd(T1) Ordinate of the design spectrum at period T1
T1 Fundamental period of the structure for translational motion in the direction
Considered.
W Seismic dead load
For buildings with heights up to 80m, T1 can be approximated using the following
formula
T1 = C1H3/4
(2)
Where, T1 fundamental period of buildings in seconds
H height of the base above the building in meters
C1 =0.075 for RC moment resisting frames
Eq. (2), which was appeared first time in the ATC3-06 (Applied Technological
Council, 1978) report, was derived using Rayleigh's method (Chopra 1995) with the following
assumptions: (i) Equivalent static lateral forces are distributed linearly over the height of the
building; (ii) seismic base shear is proportional to 1/T2/3
; and (iii) deflections of the building
are controlled by drift limitations. Although the first two assumptions are evident, the third
assumption implies that the height wise distribution of stiffness is such that the inter-story
drift under linearly distributed forces is uniform over the height of the building [9].
Rayleigh‘s Method is based on the principle of conservation of energy which was
published in 1873 developed by Lord Rayleigh. The maximum potential energy of the system
over a vibration cycle is equal to its strain energy associated with the maximum displacements
and the maximum kinetic energy of the system over a vibration cycle is associated with the
maximum velocities. The principle of conservation of energy states that the total energy in a
freely vibrating system without damping is constant (i.e. it doesn‘t vary with time) thus the
two energies must be equal which obtains the natural vibration frequency. The accuracy of
the natural vibration frequency estimated using Rayleigh‘s method depends entirely on the
shape function that is assumed to approximate the exact mode shape. In principle any shape
may be selected that satisfies the displacement boundary conditions.
For a multistory building frame the natural frequency, using Rayleigh‘s method, can
be calculated using the formula
𝜔𝑛2 =
𝑓𝑖𝛿𝑖
𝑚 𝑖𝛿𝑖2Where fi,mi&i are the lateral force, mass and deflection for i
th story
The success of Rayleigh‘s method for estimating the fundamental natural frequency of
a structure depends on the ability to visualize the corresponding natural mode of vibration that
the shape function is intended to approximate, However the mode shape of more complex
systems may not be easy to visualize, and even a shape function calculated from static
deflections due to self-weight of the structure may not be appropriate [10].

April 2018 Entire Research, Volume-X, Issue-II 4
ISSN 0975-5020
Moreover Rayleigh‘s formula for the computation of fundamental period T (in second)
is given by:
𝑇 = 2𝜋 𝑤𝑖 𝛿𝑖
2
𝑔 𝑓𝑖 𝛿𝑖
wi-the portion of the total seismic dead load located at or assigned to level i
i –the horizontal relative displacement at level i due to applied lateral forces
fi- the lateral force at level i and
g- Acceleration due to gravity.
The code specifies that the fundamental period may be determined through an
alternative substantiated analysis such as normal mode analysis or Rayleigh‘s method, both of
which require the use of a computer program which make the determination of the
fundamental period cumbersome for most practicing engineers.
Therefore the fundamental vibration period of a building which appears in the
equation specified in building codes, adopted from ATC3-06 report 1978, to calculate the
design base shear and lateral forces is provided from empirical relationships based on
regression analysis. Because this building property cannot be computed for a structure that is
yet to be designed, building codes provide empirical formulae that depend on the building
material [steel, reinforced concrete (RC), etc.], building type (frame, shear wall, etc.), and
overall dimensions calculated using regression analysis based on periods of buildings
―measured‖ from their motions recorded during the 1971 San Fernando earthquake.
The authors of ATC-3 realized the Tentative Provisions include many innovations and
thus need careful assessment. Thus the preface states [8]:
Consequently the salient objective of this research is to assess the influence of other
structural parameters on fundamental period other than building height suggested in the code.
2. Methodology
2.1 Introduction
The study in this paper is based on analysis of a number of structural models
representing regular multistoried MRF buildings. These models are analyzed using computer
software SAP 2000 v14. The first part of this chapter presents the various considerations and
assumptions related with the modeling of the structural members and the frame at large. The
next part deals with the study area and source of data used in the study together with the
values of the parameters under investigation.
The last part of this chapter presents a brief outline on the modal analysis technique
for better understanding of the results.
2.2 Modeling
Modeling a building comprises of demonstrating and grouping of its various load-
carrying elements. The model must ideally represent the mass distribution, strength, stiffness
and deformability characteristics of the building under consideration. Modeling of the
material properties and structural elements used in the present study is discussed below.
2.2.1Material Properties C-25 grade of concrete and S-300 grade of reinforcing steel are used for all the frame
models used in this study. Elastic material properties of these materials are taken as per
EBCS-2 1995 clause 2.5.2.
2.2.2 Structural Elements Beams and columns are modeled by 2D frame elements. The beam-column joints are

April 2018 Entire Research, Volume-X, Issue-II 5
ISSN 0975-5020
assumed to be rigid and the column end at foundation was considered as fixed for all the
models in this study.
The structural effect of slabs due to their in-plane stiffness is taken into
account by assigning ‗diaphragm‘ action at each floor level. The mass/weight contribution of
slab is modeled separately on the supporting beams. Infill stiffness is not considered in the
present study. However, associated mass and weight is assumed in the analysis.
Lumped mass idealization is exercised in the present study, in which the masses of
the floor, beam, column and additional masses of a single bay are lumped (discredited) at the
center of the beam of that bay.
The choice of this particular idealization owes the fact that the dynamic analysis of a
consistent- mass system requires considerably more computational effort than does a lumped
mass idealization, for two reasons (Chopra 1995) : (1) The lumped mass matrix is diagonal,
whereas the consistent mass matrix has off-diagonal terms; and (2) the rotational DOF can be
eliminated by static condensation from the equations of motion for a lumped mass system,
whereas all DOFs must be retained in a consistent mass system. Hence lumped mass
idealization is the feasible approach to multistory dynamic analysis of buildings.
Figure 1: Illustration of a Lumped mass idealization of a 3 story 3 bay model frame on SAP
2000v14.
A two dimensional dynamic analysis of the models is carried out using SAP 2000 v14
in this study. For a building that is regular and essentially symmetrical, a 2D model is
generally sufficient. When there is irregularity in plan the eccentricity between the center of
mass and center of stiffness is large, in which torsion response may be predominant, thus
requiring a 3D analysis in an otherwise symmetrical and regular building.
2.3 Selected Parameters
The study is based on two dimensional RC building frames with varying heights and
widths. Different building frame geometries were taken for the study. The parameters chosen
in this study were taken from different literatures discussed in chapter 2 of this paper. They
are listed as follows;
April 2018 Entire Research, Volume-X, Issue-II 6
ISSN 0975-5020
l –Beam Span (m) s – Number of Stories
h– Column Height (m) p – Number of Bays ms – Story Mass (Kg)
All of the parameters listed above are related to the stiffness and mass characteristics
of the building, they can also be categorized as member and cross-sectional properties. The
values or data under each parameter are determined by two basic data collection methods,
namely primary and secondary data collection methods.
Primarily data have been collected through direct observation and structured
questionnaire (see Appendix) prepared and aim to collect the real life input data from the
design practice. Several consultancy firms and individual design professionals around
Mekelle and Adigrat towns (Ethiopia) have responded upon request. Values for maximum,
minimum and most common design provisions of each parameter have been gathered.
Summary of Questionnaire Survey:- Table i: Summary of Questionnaire Survey
Si.No PARAMETER RANGE COMMON VALUES
1 length (m) 3-7 5
2 Height (m) 2.6-5 3
3 Panel 2-10 4
4 storey 2-11 5
5 Column Size(mm)* 350 x 350to700 x
700 400 x 400
6 Beam Size(mm) 250 x 400 250 x 400
*The values for this parameter are story dependent
The Variations in values of each parameter considered is presented below, altogether
there are around 200 model frames which have been analyzed with SAP 2000 v14.
Table ii: Parameters and their cases considered for investigation.
PARAMETER Value 1 Value 2 Value 3 Value 4 Value 5
l –Beam Span (m) 3 4 5 6 7
h –Column Height (m) 2.6 3 3.5 4 5
s – Number of Stories 3 5 10 15 20
Table iii: Cases considered for investigating effect of story mass.
PARAMETER 3 Stories 5 Stories 10 Stories 15 Stories 20 Stories
ms –Story Mass, x
(103) Kg*
49.85– 59.85 52.1 – 62.1 57.5 – 67.5 64.1 – 74.1 71.9 – 81.9
*Story Mass- an increment of 2000 Kgs have been taken in those intervals for each
story, i.e a total of 6 cases for each story.
Table iv: Cases considered for investigating effect of number of bays.
PARAMETER
Value Number
1 2 3 4 5 6 7 8 9
p – No. of bays 2 3 4 5 6 7 8 9 10

April 2018 Entire Research, Volume-X, Issue-II 7
ISSN 0975-5020
While carrying out the investigation of a parameter the rest are kept constant to see its
effect on period clearly. A combination of all the cases for each parameter have been
investigated turn by turn resulting in 200 models and can be found attached in the appendix.
Table v: Cross sectional dimensions of beam and columns considered for study.
NUMBER
OF
STORIES
BEAM
DIMENSION, mm
Ib(m4) COLUMN
DIMENSION, mm
Ic(m4)
3 250x400 0.001333 350x350 0.001251
5 250x400 0.001333 400x400 0.002133
10 250x400 0.001333 500x500 0.005208
15 250x400 0.001333 600x600 0.010800
20 250x400 0.001333 700x700 0.020008
The above constant values are dependent on story levels. From the requirement of
gravity load analysis as the number of stories increases so does the column dimensions with
their associated masses. The remaining parameters are not story dependent.
Table vi: Constant values for the parameters that do not vary with story number.
PARAMETER Constant Values
l – Beam Span (m) 5
h –Column Height (m) 3
p – Number of Bays 4
In addition the slab thickness is considered to be 0.15 m for all the cases and the unit
weight of C-25 concrete is taken as 25 KN/m3.
2.4 Modal Analysis Technique
In the majority of analyses carried out by engineers the forces are treated as static and
even in situations where the forces are not actually constant with time they are considered to
change sufficiently slowly that dynamic effects are not significant. If the force acting on the
structure changes at such rate that the inertial and damping forces have a significant effect on
the equation of equilibrium, then a dynamic analysis is required [5]
In some cases like the proposed 2005 edition of the National Building Code of
Canada, it specifies dynamic analysis as the preferred method for computing seismic design
forces and deflections, while maintaining the equivalent static force method for areas of low
seismicity and for buildings with certain height limitations.
The equivalent static force procedure is permitted for buildings in low seismic regions,
regular buildings below a certain height limit, and short buildings with certain irregularities. It
may be preferred by designers because of its simplicity when dynamic analysis is not
mandatory. In the 2005 NBCC, dynamic analysis is mandatory for the following
classifications of buildings: (i) regular structures that are 60 m or taller or have fundamental
period greater than or equal to 2.0 s and are located in areas of high seismicity with IEFaSa
(0.2) ≥0.35, where IE is the moment of inertia, Fa is an acceleration-based site coefficient, and
Sa (0.2) is the spectral response acceleration for a period of 0.2 s; (ii) irregular buildings that
are 20 m or taller or have a fundamental period of 0.5 s or longer and are located in areas of
high seismicity with IEFaSa (0.2)≥0.35; and (iii) all buildings that have rigid diaphragms and
are torsionally sensitive.

April 2018 Entire Research, Volume-X, Issue-II 8
ISSN 0975-5020
When free vibration is under consideration, the structure is not subjected to any
external excitation (force or support motion) and its motion is governed only by the
initial conditions. There are occasionally circumstances for which it is necessary to determine
the motion of the structure under conditions of free vibration. However, the analysis of the
structure in free motion provides the most important dynamic properties of the
structure which are the natural frequencies and the corresponding modal shapes.
The natural frequency of free vibration associated with a single degree of freedom
system vibrating in simple harmonic motion has its equivalent in multi-degree of freedom
systems. At each natural frequency of free vibration the structure vibrates in simple harmonic
motion where the displaced shape, or mode shape, of the structure is constant but the
amplitude of the displacement is varying in a sinusoidal manner with time. A system with N
degrees of freedom has N natural frequencies of free vibration and N mode shapes of free
vibration {Ø}, this set of N mode shapes forms a basis set of displacement vectors in that any
displacement shape of the structure can be made up of a combination of these linearly
independent mode shapes. Luckily, most engineers are generally only concerned with a small
number of these modes, i.e. those associated with the few lowest natural frequencies of free
vibration [5].
The Complete dynamic equilibrium of a multi degree of freedom structure is given by
[m]{Ü}+[c]{Ů}+ [k]{U} = {p(t)} (3)
Where, [m] = mass matrix {p (t)} = load vector
[c] = damping matrix {Ü} = acceleration vector
[k] = stiffness matrix {Ů} = velocity vector
{U} = displacement vector
For free vibration of an undamped MDOF frame structure, Eq. 3 simplifies to
[m]{Ü}+ [k]{U} = {0} (4)
For a nontrivial solution of the above equations it can be shown (Clough and Penzien
1993) that the following determinant equation must satisfy
𝑘 − 𝛚2 𝑚 = 0 (5)
Where, 𝛚2 represent the frequencies of the N modes of vibration which are possible in
the system.
SAP 2000 solves the problem by extracting Eigen values which represent frequencies
and Eigen vectors representing mode shapes.
The vector made up of the entire set of modal frequencies, arranged in sequence, is the
frequency vector, { 𝛚}. For the real, symmetric, positive definite mass and stiffness matrices
which pertain to a stable frame structure, all the frequencies will be real and positive. The
lowest among these, 𝛚1 will correspond to the first mode. The fundamental period, T of the
frame structure can then be determined as
𝑇1 =2𝜋
𝜔1(6)
It should be noted that particularly for tall structures, the use of dynamic analysis
methods will not only result in a more realistic characterization of the distribution of inertial
forces in the structure, but may also result in reduced forces, particularly with regard to
overturning demands. Therefore, use of a dynamic analysis method is recommended for such

April 2018 Entire Research, Volume-X, Issue-II 9
ISSN 0975-5020
structures, regardless of the Seismic Design Category [16].
After analyzing the models using SAP 2000 v14 their periods have been recorded and
compared with periods computed using Rayleigh‘s formula described in Chapter 2.
Figure 2: Assumed mode shape of vibration for Rayleigh‘s formula
A simple program is written in Visual Basic 2008 to calculate period using Rayleigh‘s
formula and can be found attached in the Appendix.
Figure 3: Analysis tool box to calculate period using Rayleigh‘s formula programmed using
Visual Basic 2008.
Finally new relationships were developed between period and the investigated
parameters. The new relations were developed, by taking all seven parameters (beam span,
column height, story mass, number of stories, and number of bays) in different combinations.
The relations were developed, by taking 200 samples, and multiple linear regressions was
then made using SPSS v20 for IBM software.
The multiple regression equations take the form y=b1x1+b2x2+-----+c. The b‘s are the
regression coefficients, representing the amount the dependent variable changes when the
independent changes one unit. The c is the constant, where the regression line intercepts the y
axis, representing the amount the dependent y will take when all the independent variables are

April 2018 Entire Research, Volume-X, Issue-II 10
ISSN 0975-5020
zero.
The regression coefficients were then calculated using the statistical tool, SPSS v20
for IBM software, and tested for selected samples, which are used as a control to test the
relations.
Generally the steps undertaken in the present study to achieve the above-mentioned
objectives are as follows:
a. Carry out extensive literature review, to establish the objectives of the research
work.
b. Select an exhaustive set of moment resisting building frame models with different heights
(3 to 20 stories), beam & column dimensions, beam spans and column heights and
different bay masses.
c. Perform modal analysis for each of the building models using SAP 2000 v14.
d. Analyzing and recording the results of modal analysis
e. Developing new empirical expression to calculate period
This chapter presented details of the structural models used for the analysis of
fundamental period of vibration. It also described the selected building frame geometries
used in the present study. The selected building frames are representing the realistic
regular and symmetric two dimensional buildings of 3-20 stories. Modal analysis technique
used in the present study is also explained in this chapter.
3. Results and Discussions
3.1 Introduction
This chapter presents the analysis results and appropriate discussions. According to
the objectives of the present study, the results presented here are focused on
fundamental time period of selected regular RC MRF buildings. The details of the selected
building frames and the outline of the analysis procedure followed in this study are presented
in Chapter 2.
All the selected building frame models with different geometries were analyzed
for linear dynamic behavior using commercial software SAP2000 (v14).
3.2 Fundamental Time Period for Regular RC MRF Buildings
The fundamental time periods of 200 selected regular RC MRF buildings were
calculated using modal analysis technique and Rayleigh‘s formula. The results are tabulated
and shown in graphs for each parameter.
The parameters selected for investigating their effect on fundamental period all
translate into mass and stiffness characteristics of the building frames, thus it‘s important to
see the effect of each parameter on story mass and story stiffness.
Story mass is calculated by taking the cross sectional dimensions of the members and
multiplying it by unit weight of C-25 grade of concrete and number of bays.
By taking depth of slab 0.15m and center to center spacing of frames 5m
ms= {(0.15×5×l×25) + (b×d×l×25) + (b×d×h×25)} ×100×p(7)
b×d- cross sectional area of beam and column
For calculation of lateral story stiffness of MRF an approximate estimate proposed by
Schultz (1992) is used. The relationship is given by,
𝐾𝑠 = 24
2 1
2
𝐾𝑐 +
1
𝐾𝑏𝑎 +
1
𝐾𝑏𝑏
(8)
Where 𝐾𝑐 – is the sum of relative flexural stiffness of columns in the story (i.e =𝐸𝐼𝑐
)

April 2018 Entire Research, Volume-X, Issue-II 11
ISSN 0975-5020
in kN-m
𝑲𝒃𝒂 – is the sum of relative flexural stiffness of beams above the story (i.e =𝑬𝑰𝒃
𝒍)
in kN-m
𝑲𝒃𝒃 – is the sum of relative flexural stiffness of beams below the story (i.e =𝑬𝑰𝒃
𝒍)
in kN-m
- is the column heightin m
E – is the modulus of elasticity (according to EBCS-2 for C-25, E = 29 Gpa)
Ib&Ic– are the moment of inertias for beam and column in m4 respectively
And Ks– is the lateral story stiffness in kN/m.
For the first story of a frame with fixed base 𝐾𝑏𝑏 is taken equal to infinity, thus
eliminating the corresponding term in the denominator of (8).
The story stiffness calculations were estimated accordingly for bottom, intermediate
and top stories of each frame. Since bottom story stiffness is larger than the intermediate and
top stories (which are constant for uniform frames) effect of parameters was considered for
this study on bottom story stiffness.
3.2.1Column Height The values selected for the investigation of these parameters are presented in Chapter
3. There are altogether 125 sample frame models analyzed for these parameters.
Table vii: Period Values for a 3 Story with varying beam span & story stiffness.
l h
Ks(bottom)
×(103)
kN/m
ms×(103)
Kg
T1
(MODAL)
T1
(EBCS-8) T1
(RAYLEIGH) % (T1-MODAL
& T1-EBCS-8)
3 2.6 47.56 31.12 0.65 0.35 0.41 46.34
3 3.0 33.73 32.10 0.81 0.39 0.49 51.89
3 3.5 23.16 33.33 0.97 0.44 0.59 55.10
3 4.0 16.65 34.55 1.26 0.48 0.71 61.71
3 5.0 9.49 37.00 1.80 0.57 0.95 68.18
4 2.6 52.77 39.87 0.73 0.35 0.43 52.11
4 3.0 37.19 40.85 0.90 0.39 0.52 56.90
4 3.5 25.37 42.08 1.14 0.44 0.63 61.65
4 4.0 18.13 43.30 1.40 0.48 0.75 65.43
4 5.0 10.24 45.75 1.98 0.57 1.00 71.07
5 2.6 58.20 48.87 0.80 0.35 0.45 56.29
5 3.0 40.76 49.85 0.99 0.39 0.54 60.57
5 3.5 27.62 51.08 1.24 0.44 0.65 64.82
5 4.0 19.62 52.30 1.52 0.48 0.78 68.21
5 5.0 10.97 54.75 2.14 0.57 1.05 73.28
6 2.6 69.09 59.47 0.87 0.35 0.46 59.53
6 3.0 47.79 60.45 1.07 0.39 0.55 63.44
6 3.5 31.96 61.68 1.34 0.44 0.66 67.32
6 4.0 22.45 62.90 1.64 0.48 0.78 70.43
6 5.0 12.33 65.35 2.29 0.57 1.06 75.08
April 2018 Entire Research, Volume-X, Issue-II 12
ISSN 0975-5020
7 2.6 73.98 69.37 0.93 0.35 0.46 62.18
7 3.0 50.89 70.35 1.14 0.39 0.55 65.80
7 3.5 33.83 71.58 1.43 0.44 0.67 69.40
7 4.0 23.65 72.80 1.74 0.48 0.80 72.27
7 5.0 12.89 75.25 2.44 0.57 1.08 76.59
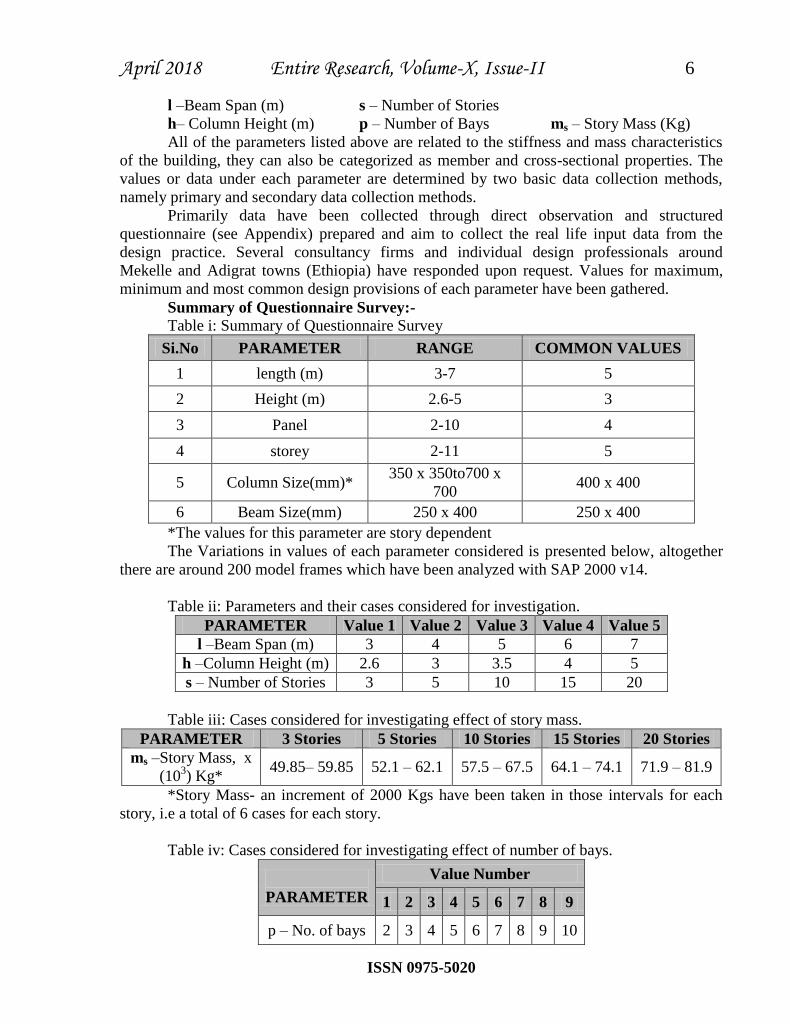
Figure 4: Period Values for a 3 Story with 3m beam span& varying story stiffness.
Table vii presented period values for a 3 story MRF obtained from modal analysis
using SAP 2000 v14, EBCS-8 empirical formula and Rayleigh‘s formula. For better
understanding of the variations the results for a beam span of 3m have also been plotted in
graphs shown in Figure 11.
It can be seen from the results that fundamental period is significantly influenced by
increase in column height which results in decrease of story stiffness and increase of story
mass causing period to increase. It can also be observed that increase in beam span increases
both the story stiffness and the story mass which in turn increases period.
The graphical illustration of the results for the remaining beam spans can be found
attached in the appendix. The % difference between periods found from modal analysis and
EBCS-8 is also given in the table.
Table viii: Period Values for a 5 Story with varying beam span & column heights.
l h Ks(bottom)
×(103)
kN/m
ms×(103)
Kg
T1
(MODAL)
T1
(EBCS-8) T1
(RAYLEIGH)
% (T1-MODAL
& T1-EBCS-8)
3 2.6 56.54 33.07 0.69 0.51 0.63 25.35
3 3.0 40.79 34.35 0.86 0.57 0.75 33.29
3 3.5 28.56 35.95 1.09 0.64 0.91 41.12
3 4.0 20.88 37.55 1.35 0.71 1.08 47.31
3 5.0 12.26 40.75 1.93 0.84 1.45 56.48
4 2.6 64.07 41.82 0.77 0.51 0.66 33.03
4 3.0 45.98 43.10 0.95 0.57 0.79 39.88
0.00
0.20
0.40
0.60
0.80
1.00
1.20
1.40
1.60
1.80
2.00
47.56 33.73 23.16 16.65 9.49
Pe
rio
d (
Sec)
Bottom story stiffness (*103) kN/m
3 STORY--BEAM SPAN-3m
MODAL
EBCS-8
RAYLEIGH

April 2018 Entire Research, Volume-X, Issue-II 13
ISSN 0975-5020
4 3.5 31.99 44.70 1.20 0.64 0.95 46.67
4 4.0 23.27 46.30 1.48 0.71 1.13 52.05
4 5.0 13.53 49.50 2.10 0.84 1.50 60.09
5 2.6 72.25 50.82 0.84 0.51 0.69 38.67
5 3.0 51.56 52.10 1.04 0.57 0.81 44.77
5 3.5 35.65 53.70 1.31 0.64 0.98 50.84
5 4.0 25.78 55.30 1.60 0.71 1.16 55.66
5 5.0 14.85 58.50 2.26 0.84 1.54 62.89
6 2.6 89.85 61.42 0.90 0.51 0.69 43.07
6 3.0 63.34 62.70 1.11 0.57 0.82 48.61
6 3.5 43.22 64.30 1.40 0.64 0.99 54.12
6 4.0 30.89 65.90 1.71 0.71 1.17 58.52
6 5.0 17.44 69.10 2.40 0.84 1.55 65.13
7 2.6 98.29 71.32 0.96 0.51 0.71 46.67
7 3.0 68.89 72.60 1.19 0.57 0.83 51.78
7 3.5 46.71 74.20 1.49 0.64 1.01 56.87
7 4.0 33.21 75.80 1.82 0.71 1.21 60.95
7 5.0 18.59 79.00 2.55 0.84 1.59 67.08
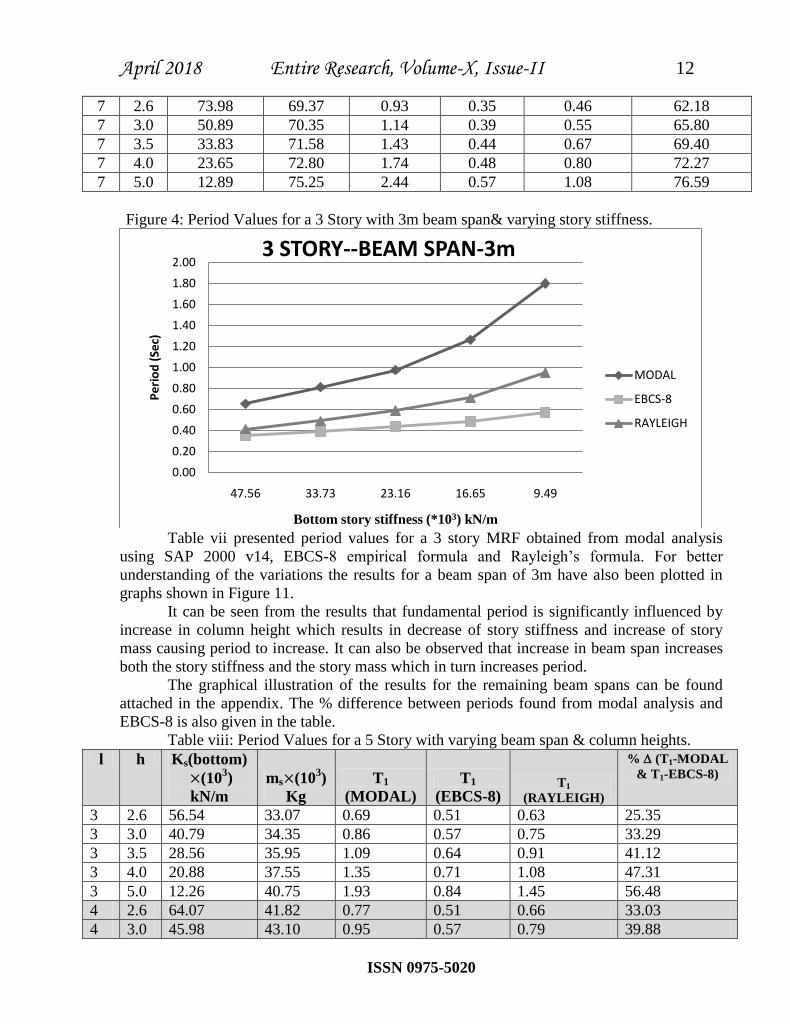
Table viii presented period values for a 5 story MRF obtained from modal analysis
using SAP 2000 v14, EBCS-8 empirical formula and Rayleigh‘s formula. For better
understanding of the variations the results for a beam span of 4m have also been plotted in
graphs shown in Figure 12 below.
It can be seen from the results that fundamental period is significantly influenced by
increase in column height which results in decrease of story stiffness and increase of story
mass causing period to increase. It can also be observed that increase in beam span increases
both the story stiffness and the story mass which in turn increases period. The graphical
illustration of the results for the remaining beam spans can be found attached in the appendix.
The % difference between periods found from modal analysis and EBCS-8 is also given in the
table.
Figure 5: Period Values for a 5 Story with 4m beam span & varying story stiffness
Table ix below presented period values for a 10 story MRF obtained from modal
0.00
0.50
1.00
1.50
2.00
2.50
64.07 45.98 31.99 23.27 13.53
Pe
rio
d (
Sec)
Bottom story stiffness (*103) kN/m
5 STORY--BEAM SPAN-4m
MODAL
EBCS-8
RAYLEIGH

April 2018 Entire Research, Volume-X, Issue-II 14
ISSN 0975-5020
analysis using SAP 2000 v14, EBCS-8 empirical formula and Rayleigh‘s formula. For better
understanding of the variations the results for a beam span of 5m have also been plotted in
graphs shown in Figure 13 below.
Again here it can be seen from the results that fundamental period is significantly
influenced by increase in column height which results in decrease of story stiffness and
increase of story mass causing period to increase. It can also be observed that increase in
beam span increases both the story stiffness and the story mass which in turn increases period.
Table ix: Period Values for a 10 Story with varying beam span& column heights.
l h
Ks(bottom)
×(103)
kN/m
ms×(103)
Kg
T1
(MODAL)
T1
(EBCS-8) T1
(RAYLEIGH) % (T1-MODAL
& T1-EBCS-8)
3 2.6 67.16 37.75 0.70 0.86 0.72 -23.67
3 3.0 49.45 39.75 0.88 0.96 0.81 -9.80
3 3.5 35.46 42.25 1.12 1.08 1.02 3.86
3 4.0 26.52 44.75 1.40 1.19 1.23 14.62
3 5.0 16.21 49.75 2.03 1.41 1.53 30.43
4 2.6 78.05 46.50 0.77 0.86 0.75 -12.03
4 3.0 57.29 48.50 0.96 0.96 0.84 -0.01
4 3.5 40.92 51.00 1.23 1.08 1.06 11.90
4 4.0 30.49 53.50 1.52 1.19 1.29 21.33
4 5.0 18.52 58.50 2.18 1.41 1.57 35.31
5 2.6 90.54 55.50 0.84 0.86 0.82 -3.19
5 3.0 66.22 57.50 1.09 0.96 0.97 12.09
5 3.5 47.10 60.00 1.32 1.08 1.16 18.17
5 4.0 34.95 62.50 1.63 1.19 1.35 26.63
5 5.0 21.07 67.50 2.32 1.41 1.66 39.24
6 2.6 119.98 66.10 0.90 0.86 0.91 4.06
6 3.0 87.01 68.10 1.11 0.96 1.06 13.68
6 3.5 61.27 70.60 1.41 1.08 1.28 23.27
6 4.0 45.05 73.10 1.73 1.19 1.44 30.93
6 5.0 26.71 78.10 2.45 1.41 1.75 42.41
7 2.6 135.53 76.00 0.96 0.86 1.01 9.86
7 3.0 97.84 78.00 1.18 0.96 1.21 18.69
7 3.5 68.55 80.50 1.49 1.08 1.46 27.53
7 4.0 50.16 83.00 1.82 1.19 1.62 34.60
7 5.0 29.49 88.00 2.54 1.41 1.91 44.53
The graphical illustration of the results for the remaining beam spans can be found
attached in the appendix. The % difference between periods found from modal analysis and
EBCS-8 is also given in the table.

April 2018 Entire Research, Volume-X, Issue-II 15
ISSN 0975-5020
Figure 6: Period Values for a 10 Story with 5m beam span&varying story stiffness.
Table x: Period Values for a 15 Story with varying beam span& column heights.
l h Ks(bottom)
×(103)
kN/m
ms×(103)
Kg
T1
(MODAL)
T1
(EBCS-8) T1
(RAYLEIGH)
% (T1-MODAL
& T1-EBCS-8)
3 2.6 72.02 43.47 0.77 1.17 0.84 -51.63
3 3.0 53.54 46.35 0.97 1.30 0.95 -33.88
3 3.5 38.84 49.95 1.26 1.46 1.21 -16.45
3 4.0 29.36 53.55 1.57 1.62 1.53 -2.78
3 5.0 18.33 60.75 2.31 1.91 1.78 17.16
4 2.6 84.68 52.22 0.84 1.17 0.91 -38.93
4 3.0 62.84 55.10 1.06 1.30 1.05 -23.37
4 3.5 45.48 58.70 1.35 1.46 1.30 -7.99
4 4.0 34.31 62.30 1.69 1.62 1.64 4.15
4 5.0 21.34 69.50 2.45 1.91 1.85 22.02
5 2.6 99.59 61.22 0.91 1.17 1.07 -28.92
5 3.0 73.75 64.10 1.13 1.30 1.18 -15.00
5 3.5 53.24 67.70 1.45 1.46 1.49 -1.16
5 4.0 40.07 71.30 1.79 1.62 1.77 9.81
5 5.0 24.80 78.50 2.59 1.91 1.96 26.07
6 2.6 136.42 71.82 0.97 1.17 1.16 -20.43
6 3.0 100.49 74.70 1.21 1.30 1.28 -7.91
6 3.5 72.10 78.30 1.53 1.46 1.55 4.61
6 4.0 53.93 81.90 1.89 1.62 1.92 14.57
6 5.0 33.00 89.10 2.71 1.91 2.06 29.43
7 2.6 156.88 81.72 1.03 1.17 1.19 -13.59
7 3.0 115.23 84.60 1.28 1.30 1.34 -2.07
7 3.5 82.39 88.20 1.62 1.46 1.65 9.46
7 4.0 61.43 91.80 1.97 1.62 1.98 17.99
7 5.0 37.36 99.00 2.83 1.91 2.15 32.48
0.00
0.50
1.00
1.50
2.00
2.50
90.54 66.22 47.10 34.95 21.07
Pe
rio
d (
Sec)
Bottom story stiffness (*103) kN/m
10 STORY--BEAM SPAN-5m
MODAL
EBCS-8
RAYLEIGH

April 2018 Entire Research, Volume-X, Issue-II 16
ISSN 0975-5020
Table x above presented period values for a 15 story MRF obtained from modal
analysis using SAP 2000 v14, EBCS-8 empirical formula and Rayleigh‘s formula. For better
understanding of the variations the results for a beam span of 6m have also been plotted in
graphs shown in Figure 14 below.
It can be seen from the results that fundamental period is significantly influenced by
increase in column height which results in decrease of story stiffness and increase of story
mass causing period to increase. It can also be observed that increase in beam span increases
both the story stiffness and the story mass which in turn increases period. The graphical
illustration of the results for the remaining beam spans can be found attached in the appendix.
Figure 7: Period Values for a 15 Story with 6m beam span& varying story stiffness.
Table xi below presented period values for a 20 story MRF obtained from modal
analysis using SAP 2000 v14, EBCS-8 empirical formula and Rayleigh‘s formula. For better
understanding of the variations the results for a beam span of 7m have also been plotted in
graphs shown in Figure 15 below.
Again here it can be seen from the results that fundamental period is significantly
influenced by increase in column height which results in decrease of story stiffness and
increase of story mass causing period to increase. It can also be observed that increase in
beam span increases both the story stiffness and the story mass which in turn increases period.
The graphical illustration of the results for the remaining beam spans can be found
attached in the appendix.
Table xi: Period Values for a 20 Story with varying beam span& column heights.
l h Ks(bottom)
×(103)
kN/m
ms×(103)
Kg
T1
(MODAL)
T1
(EBCS-8) T1
(RAYLEIGH)
% (T1-MODAL
& T1-EBCS-8)
3 2.6 74.32 50.23 0.82 1.45 0.97 -77.72
3 3.0 55.50 54.15 1.04 1.62 1.19 -56.20
3 3.5 40.49 59.05 1.34 1.82 1.42 -35.14
3 4.0 30.78 63.95 1.69 2.01 1.77 -18.69
3 5.0 19.42 73.75 2.50 2.37 2.28 5.14
4 2.6 87.89 58.98 0.88 1.45 1.09 -64.49
4 3.0 65.56 62.90 1.11 1.62 1.25 -45.44
0.00
0.50
1.00
1.50
2.00
2.50
3.00
136.42 100.49 72.10 53.93 33.00
Pe
rio
d (
Sec)
Bottom story stiffness (*103) kN/m
15 STORY--BEAM SPAN-6m
MODAL
EBCS-8
RAYLEIGH

April 2018 Entire Research, Volume-X, Issue-II 17
ISSN 0975-5020
4 3.5 47.76 67.80 1.43 1.82 1.65 -26.63
4 4.0 36.27 72.70 1.79 2.01 1.96 -11.84
4 5.0 22.83 82.50 2.63 2.37 2.41 9.82
5 2.6 104.05 67.98 0.94 1.45 1.13 -53.73
5 3.0 77.53 71.90 1.18 1.62 1.29 -37.47
5 3.5 56.40 76.80 1.52 1.82 1.73 -19.54
5 4.0 42.75 81.70 1.89 2.01 2.09 -6.05
5 5.0 26.83 91.50 2.75 2.37 2.53 13.85
6 2.6 144.93 78.58 1.01 1.45 1.19 -44.37
6 3.0 107.64 82.50 1.26 1.62 1.34 -28.83
6 3.5 78.00 87.40 1.60 1.82 1.80 -13.34
6 4.0 58.91 92.30 1.99 2.01 2.12 -1.02
6 5.0 36.71 102.10 2.86 2.37 2.66 17.12
7 2.6 168.24 88.48 1.06 1.45 1.27 -36.72
7 3.0 124.74 92.40 1.32 1.62 1.41 -22.41
7 3.5 90.19 97.30 1.68 1.82 1.89 -8.08
7 4.0 67.97 102.20 2.08 2.01 2.26 3.37
7 5.0 42.18 112.00 2.98 2.37 2.74 20.43
Figure 8: Period Values for a 20 Story with 7m beam span & varying story stiffness.
The graphical illustration of the results for the remaining beam spans can be found
attached in the appendix.
It is seen from the analysis results that an increase in column height results in decrease
of story stiffness and increase in story mass a more detailed assessment of this fact is
presented in the following table.
0.00
0.50
1.00
1.50
2.00
2.50
3.00
3.50
168.24 124.74 90.19 67.97 42.18
Pe
rio
d (
Sec)
Bottom story stiffness (*103) kN/m
20 STORY--BEAM SPAN-7m
MODAL
EBCS-8
RAYLEIGH

April 2018 Entire Research, Volume-X, Issue-II 18
ISSN 0975-5020
Table xii : Effect of column height on story stiffness and story mass
3 story h (m) Ks, ×10
3
(kN/m) % Ks
ms, ×103
(Kg) % ms
Top & Intermediate
story 0.5 -11.78 -31.8 1.23 3.73
Bottom story 0.5 -17.03 -33.5 1.23 3.73
5 story h (m) Ks, ×10
3
(kN/m) % Ks
ms, ×103
(Kg) % ms
Top & Intermediate
story 0.5 -13.93 -30.4 1.60 4.56
Bottom story 0.5 -22.12 -32.2 1.60 4.56
10 story h (m) Ks, ×10
3
(kN/m) % Ks
ms, ×103
(Kg) % ms
Top & Intermediate
story 0.5 -16.29 -28.55 2.50 6.17
Bottom story 0.5 -29.19 -29.92 2.50 6.17
15 story h (m) Ks, ×10
3
(kN/m) % Ks
ms, ×103
(Kg) % ms
Top & Intermediate
story 0.5 -17.28 -27.62 3.60 7.64
Bottom story 0.5 -32.71 -28.50 3.60 7.64
20 story h (m) Ks, ×10
3
(kN/m) % Ks
ms, ×103
(Kg) % ms
Top & Intermediate
story 0.5 -17.72 -27.15 4.90 8.93
Bottom story 0.5 -34.40 -27.69 4.90 8.93
Table xii provides % changes in story stiffness (top, intermediate and bottom) and
story mass when the column height increases from3 to 3.5m for all stories considered in this
study.
In general when column height increases from 3to3.5m, bottom story stiffness
decreases by 30.62% top and intermediate stories also decrease by 29.1% on average while
story mass increases by 6.2% for all stories on average.
It is observed that for the same overall building height but with different column
heights EBCS-8 empirical formula gives similar fundamental periods while SAP 2000‘s
output and Rayleigh‘s formula yield different periods. A good case in point is the periods of a
3 story frame with 5m column height and a 5 story frame with 3m column height. In both
cases the overall building height is 15m hence EBCS-8 gives a period of 0.5716 for both cases
while SAP 2000‘s output and Rayleigh‘s formula give 0.8& 0.45 for the first case and 1.04&
0.81 for the second case respectively.
It can be further noted that the difference in period between Modal analysis and
EBCS-8 is positive in the 3 – 10 storey range which indicates that the code underestimates
period in this range. Starting from and above 10 stories the difference is negative which
suggests that period is slightly overestimated when evaluated using the code formula.
The % differences in period between SAP 2000 and EBCS-8 out puts are given for all
the cases.

April 2018 Entire Research, Volume-X, Issue-II 19
ISSN 0975-5020
3.2.2 Beam Span
To clearly see the effect of beam span on story stiffness and story mass and let alone
on period, separate analysis is carried out by keeping the column height constant for every
story considered in this study and is presented in the table below.
Table 1: Effect of beam span on story stiffness, story mass and period.
l h s Ks(bottom)
×(103)
kN/m
ms×(103)
Kg
T1
(MODAL)
T1
(EBCS-8) T1
(RAYLEIGH)
% (T1-MODAL
& T1-EBCS-8)
3 3.0 3 50.81 32.85 0.78 0.39 0.38 50.04
4 3.0 3 45.23 41.35 0.89 0.39 0.46 56.21
5 3.0 3 40.76 49.85 0.99 0.39 0.54 60.64
6 3.0 3 37.10 58.35 1.08 0.39 0.62 63.92
7 3.0 3 34.04 66.85 1.17 0.39 0.71 66.69
3 3.0 5 68.74 35.10 0.83 0.57 0.65 30.79
4 3.0 5 58.92 43.60 0.94 0.57 0.73 38.86
5 3.0 5 51.56 52.10 1.04 0.57 0.81 45.03
6 3.0 5 45.83 60.60 1.13 0.57 0.90 49.41
7 3.0 5 41.24 69.10 1.21 0.57 0.98 52.76
3 3.0 10 97.53 40.50 0.89 0.96 0.81 -8.02
4 3.0 10 78.88 49.00 0.99 0.96 0.89 2.89
5 3.0 10 66.22 57.50 1.09 0.96 0.97 11.80
6 3.0 10 57.06 66.00 1.20 0.96 1.06 19.88
7 3.0 10 50.12 74.50 1.31 0.96 1.14 26.61
3 3.0 15 114.80 47.10 0.93 1.30 1.02 -40.43
4 3.0 15 89.81 55.60 1.03 1.30 1.11 -26.13
5 3.0 15 73.75 64.10 1.13 1.30 1.18 -15.32
6 3.0 15 62.56 72.60 1.23 1.30 1.27 -5.96
7 3.0 15 54.32 81.10 1.33 1.30 1.34 1.91
3 3.0 20 124.24 54.90 0.98 1.62 1.13 -65.54
4 3.0 20 95.48 63.40 1.07 1.62 1.21 -50.52
5 3.0 20 77.53 71.90 1.18 1.62 1.29 -37.47
6 3.0 20 65.26 80.40 1.27 1.62 1.38 -27.13
7 3.0 20 56.35 88.90 1.38 1.62 1.46 -17.43
When the column height is fixed an increase in beam span alone results in decrease of
story stiffness (when column height increases an increase in beam span increases story
stiffness) and increase in story mass which resulted in an increase in fundamental period.
Table xiii above presented period values for all stories obtained from modal analysis using
SAP 2000 v14, EBCS-8 empirical formula and Rayleigh‘s formula. For better understanding
of the variations the results for a 5 story frame have also been plotted in graphs shown in
Figure 16 below.

April 2018 Entire Research, Volume-X, Issue-II 20
ISSN 0975-5020
Figure 9: Period values for a 5 story frame with varying story stiffness
It is seen from the analysis results that an increase in beam span results in decrease of
story stiffness and increase in story mass a more detailed assessment of this fact is presented
in the following table.
Table xiv: Effect of beam span on story stiffness and story mass
3 story Top &
Intermediate
Bottom
l (m) l (m) Ks, ×103
(kN/m)
% Ks Ks, ×103 (kN/m) % Ks m, ×10
3
(Kg)
% m
3 __ __ -15.25 __ -10.97 __ 25.88
4 1 -5.66 __ -5.57 __ 8.50 __
5 story Top &
Intermediate
Bottom
l (m) l (m) Ks, ×103
(kN/m)
% Ks Ks, ×103 (kN/m) % Ks m, ×10
3
(Kg)
% m
3 __ __ -18.18 __ -14.29 __ 24.22
4 1 -8.33 __ -9.82 __ 8.50 __
10 story Top &
Intermediate
Bottom
l (m) l (m) Ks, ×103
(kN/m)
% Ks Ks, ×103 (kN/m) % Ks m, ×10
3
(Kg)
% m
3 __ __ -21.67 __ -19.12 __ 20.99
4 1 -12.36 __ -18.65 8.50
15 story Top &
Intermediate
Bottom
l (m) l (m) Ks, ×103
(kN/m)
% Ks Ks, ×103 (kN/m) % Ks m, ×10
3
(Kg)
% m
3 __ __ -23.28 __ -21.77 __ 18.05
0.00
0.20
0.40
0.60
0.80
1.00
1.20
1.40
35.10 43.60 52.10 60.60 69.10
Pe
rio
d (
Sec)
Bottom story stiffness (*103) kN/m
5 STORY
MODAL
EBCS-8
RAYLEIGH

April 2018 Entire Research, Volume-X, Issue-II 21
ISSN 0975-5020
4 1 -14.56 __ -25.00 __ 8.50 __
20 story Top &
Intermediate
Bottom
l (m) l (m) Ks, ×103
(kN/m)
% Ks Ks, ×103 (kN/m) % Ks m, ×10
3
(Kg)
% m
3 __ __ -24.04 __ -23.15 __ 15.48
4 1 -15.69 __ -28.76 __ 8.50 __
Table xiv provides % changes in story stiffness (top, intermediate & bottom) and story
mass when the beam span increases from3m to 4m for all stories considered in this study.
In general when beam span increases from 3m to 4m, bottom story stiffness decreases
by 17.86%, top & intermediate stories also decrease by 20.48% on average while story mass
increases by 20.92% for all stories on average. Hence both a decrease in story stiffness and an
increase in story mass result in increase in period.
3.2.3 Story Mass
The values considered for the investigation of this parameter are given in table iii.
There are altogether 30 sample frame models analyzed for this parameter.
Table xv: Period Values for a 3 Story with varying story masses.
l h s Ks(bottom)
× (103)
kN/m
ms× (103)
Kg
T1
(MODAL)
T1
(EBCS-8) T1
(RAYLEIGH)
% (T1-
MODAL & T1-
EBCS-8)
5 3.0 3 40.76 49.85 0.99 0.39 0.54 60.61
5 3.0 3 40.76 51.85 1.01 0.39 0.55 61.31
5 3.0 3 40.76 53.85 1.03 0.39 0.56 62.14
5 3.0 3 40.76 55.85 1.05 0.39 0.57 62.86
5 3.0 3 40.76 57.85 1.06 0.39 0.58 63.37
5 3.0 5 40.76 59.85 1.08 0.39 0.59 63.89
5 3.0 5 51.56 52.10 1.04 0.57 0.81 45.19
5 3.0 5 51.56 54.10 1.06 0.57 0.82 46.23
5 3.0 5 51.56 56.10 1.07 0.57 0.83 46.73
5 3.0 5 51.56 58.10 1.09 0.57 0.84 47.71
5 3.0 10 51.56 60.10 1.11 0.57 0.85 48.65
5 3.0 10 51.56 62.10 1.13 0.57 0.86 49.56
5 3.0 10 66.22 57.50 1.09 0.96 0.97 11.93
5 3.0 10 66.22 59.50 1.11 0.96 0.98 13.51
5 3.0 10 66.22 61.50 1.13 0.96 0.99 15.04
5 3.0 15 66.22 63.50 1.15 0.96 1.00 16.52
5 3.0 15 66.22 65.50 1.16 0.96 1.01 17.24
5 3.0 15 66.22 67.50 1.18 0.96 1.02 18.64
5 3.0 15 73.75 64.10 1.13 1.30 1.18 -15.04
5 3.0 15 73.75 66.10 1.15 1.30 1.19 -13.04
5 3.0 20 73.75 68.10 1.17 1.30 1.20 -11.11
5 3.0 20 73.75 70.10 1.19 1.30 1.21 -9.24
5 3.0 20 73.75 72.10 1.20 1.30 1.22 -8.33

April 2018 Entire Research, Volume-X, Issue-II 22
ISSN 0975-5020
5 3.0 20 73.75 74.10 1.22 1.30 1.23 -6.56
5 3.0 20 77.53 71.90 1.23 1.62 1.29 -37.29
Table xv above presented period values for all stories obtained from modal analysis
using SAP 2000 v14, EBCS-8 empirical formula and Rayleigh‘s formula. For better
understanding of the variations the results for a 20 frame has also been plotted in graphs
shown in Figure 17 below.
It can be seen from the results that fundamental period increases with an increase in
story mass. The period values obtained from EBCS-8 and Rayleigh‘s formula show a small
difference.
The alterations in period between SAP 2000 and EBCS-8 are given in Table xix for all
the cases.
Figure 10: Period Values for a 20 Story with varying story masses.
In general when story mass increases by 2000 Kg due to additional mass from
partition walls and floor finishes story mass increases by 3.45% for all stories on average
which resulted in increase of period by 1.85% on average. This is presented in detail in table
xvi below.
Table xvi: Effect of story mass on period
(3 story)ms×103 Kg
s
(×103),Kg %ms T1 (Sec) T1 (Sec) % T1
49.85 __ 4.01 0.99 __ 2.02
51.85 2 __ 1.01 0.02 __
(5 story)ms×103 Kg
ms
(×103),Kg %ms T1 (Sec) T1 (Sec) % T1
52.10 __ 3.84 1.04 __ 1.92
54.10 2 __ 1.06 0.02 __
0
0.2
0.4
0.6
0.8
1
1.2
1.4
1.6
1.8
71.90 73.90 75.90 77.90 79.90 81.90
Pe
rio
d (
Sec)
Story mass, (*103) Kg
20 STORY
MODAL
EBCS-8
RAYLEIGH
(10 story)ms×103
Kg
s
(×103),Kg %ms
T1
(Sec) 1
(Sec) % T1
57.50 __ 3.48 1.09 __ 1.83
59.50 2 __ 1.11 0.02 __
(15 story)ms×103 s %ms T1 1 (Sec) % T1

April 2018 Entire Research, Volume-X, Issue-II 23
ISSN 0975-5020
3.2.4 Number of Bays
The values considered for the investigation of this parameter is given in table iv. There
are altogether 45 sample frame models analyzed for this parameter.
Table xvii: Period Values for a 3 Story with varying number of bays.
l h
P
Ks(bottom)
×(103)
kN/m
ms×(103)
Kg
T1
(MODAL)
T1
(EBCS-8) T1
(RAYLEIGH)
% (T1-
MODAL &
T1-EBCS-8)
5 3.0 2 22.26 24.93 0.91 0.39 0.52 57.17
5 3.0 3 31.57 37.39 0.96 0.39 0.53 59.41
5 3.0 4 40.76 49.85 0.99 0.39 0.54 60.64
5 3.0 5 49.90 62.31 1.00 0.39 0.54 61.03
5 3.0 6 59.01 74.78 1.02 0.39 0.54 61.79
5 3.0 7 68.11 87.24 1.03 0.39 0.54 62.16
5 3.0 8 77.19 99.70 1.03 0.39 0.55 62.16
5 3.0 9 86.26 112.16 1.04 0.39 0.55 62.53
5 3.0 10 95.33 124.63 1.05 0.39 0.55 62.88
Figure 11: Period Values for a 3 Story with varying number of bays.
Table xvii above presented period values for a 3 story MRF obtained from modal
analysis using SAP 2000 v14, EBCS-8 empirical formula and Rayleigh‘s formula. For better
understanding of the deviations the results for all the cases considered have also been plotted
in graphs shown in Figure 18. It can also be grasped from the results that an increase in
number of bays increases both story stiffness and story mass which caused a slight increase on
fundamental period. The period values obtained from EBCS-8 and Rayleigh‘s formula display
a small difference. The differences in period between SAP 2000 and EBCS-8 are given in
Table xvii for all the cases.
0.00
0.20
0.40
0.60
0.80
1.00
1.20
1.40
1.60
22.26 31.57 40.76 49.90 59.01 68.11 77.19 86.26 95.33
PER
IOD
(Se
c)
Bottom Story Stiffness (kN/m) *103
3 STORY
MODAL
EBCS-8
RAYLEIGH
Kg (×103),Kg (Sec)
64.10 __ 3.12 1.13 __ 1.77
66.10 2 __ 1.15 0.02 __
(20 story)ms×103
Kg
s
(×103),Kg %ms
T1
(Sec) 1 (Sec) % T1
71.90 __ 2.78 1.18 __ 1.69
73.90 2 __ 1.20 0.02 __

April 2018 Entire Research, Volume-X, Issue-II 24
ISSN 0975-5020
Table xviii: Period Values for a 5 Story with varying number of bays.
l h
P
Ks(bottom)
×(103)
kN/m
ms×(103)
Kg
T1
(MODAL)
T1
(EBCS-8) T1
(RAYLEIGH)
% (T1-
MODAL &
T1-EBCS-8)
5 3.0 2 27.50 26.05 0.96 0.57 0.78 40.45
5 3.0 3 39.59 39.08 1.00 0.57 0.80 42.84
5 3.0 4 51.56 52.10 1.04 0.57 0.81 45.03
5 3.0 5 63.45 65.13 1.05 0.57 0.81 45.56
5 3.0 6 75.32 78.15 1.07 0.57 0.81 46.57
5 3.0 7 87.16 91.18 1.08 0.57 0.81 47.07
5 3.0 8 98.99 104.20 1.08 0.57 0.82 47.07
5 3.0 9 110.81 117.23 1.09 0.57 0.83 47.56
5 3.0 10 122.62 130.25 1.10 0.57 0.84 48.03
Figure 12: Period Values for a 5 Story with varying number of bays.
Table xviii above presented period values for a 5 story MRF obtained from modal
analysis using SAP 2000 v14, EBCS-8 empirical formula and Rayleigh‘s formula. For better
appreciation of the deviations the results for all the cases considered have also been plotted in
graphs shown in Figure 19. It can be seen from the results that an increase in number of bays
increases both story stiffness and story mass which caused a minor increase on fundamental
period. The period values obtained from EBCS-8 and Rayleigh‘s formula display little or no
difference.
The differences in period between SAP 2000 and EBCS-8 are given in Table xviii for
all the cases.
0.00
0.20
0.40
0.60
0.80
1.00
1.20
1.40
1.60
27.50 39.59 51.56 63.45 75.32 87.16 98.99 110.81 122.62
PER
IOD
(Se
c)
Bottom Story Stiffness (kN/m) *103
5 STORY
MODAL
EBCS-8
RAYLEIGH

April 2018 Entire Research, Volume-X, Issue-II 25
ISSN 0975-5020
Table xix: Period Values for a 10 Story with varying number of bays.
l h
P
Ks(bottom)
×(103)
kN/m
ms×(103)
Kg
T1
(MODAL)
T1
(EBCS-8) T1
(RAYLEIGH)
% (T1-
MODAL &
T1-EBCS-8)
5 3.0 2 34.23 28.75 0.96 0.96 0.95 -0.15
5 3.0 3 50.28 43.13 1.01 0.96 0.96 4.81
5 3.0 4 66.22 57.50 1.04 0.96 0.97 7.56
5 3.0 5 82.09 71.88 1.06 0.96 0.97 9.30
5 3.0 6 97.94 86.25 1.07 0.96 0.97 10.15
5 3.0 7 113.77 100.63 1.08 0.96 0.98 10.98
5 3.0 8 129.59 115.00 1.09 0.96 0.98 11.80
5 3.0 9 145.40 129.38 1.10 0.96 0.99 12.60
5 3.0 10 161.20 143.75 1.11 0.96 1.00 13.39
Figure 13:Period Values for a 10 Story with varying number of bays.
Table xix above presented period values for a 10 story MRF obtained from modal
analysis using SAP 2000 v14, EBCS-8 empirical formula and Rayleigh‘s formula. For better
appreciation of the deviations the results for all the cases considered have also been plotted in
graphs shown in Figure 20. It can be seen from the results that an increase in number of bays
increases both story stiffness and story mass which caused a small increase on fundamental
period. The period values obtained from EBCS-8 and Rayleigh‘s formula display little or no
difference.
The differences in period between SAP 2000 and EBCS-8 are given in Table xxiii for
all the cases.
0.00
0.20
0.40
0.60
0.80
1.00
1.20
1.40
1.60
34.23 50.28 66.22 82.09 97.94 113.77 129.59 145.40 161.20
PER
IOD
(Se
c)
Bottom Story Stiffness (kN/m) *103
10 STORY
MODAL
EBCS-8
RAYLEIGH

April 2018 Entire Research, Volume-X, Issue-II 26
ISSN 0975-5020
Table xx: Period Values for a 15 Story with varying number of bays.
l h
P
Ks(bottom)
×(103)
kN/m
ms×(103)
Kg
T1
(MODAL)
T1
(EBCS-8) T1
(RAYLEIGH)
% (T1-
MODAL &
T1-EBCS-8)
5 3.0 2 37.54 32.05 1.04 1.30 1.16 -25.30
5 3.0 3 55.68 48.08 1.10 1.30 1.17 -18.46
5 3.0 4 73.75 64.10 1.13 1.30 1.18 -15.32
5 3.0 5 91.78 80.13 1.15 1.30 1.19 -13.31
5 3.0 6 109.79 96.15 1.17 1.30 1.19 -11.37
5 3.0 7 127.79 112.18 1.18 1.30 1.19 -10.43
5 3.0 8 145.78 128.20 1.19 1.30 1.20 -9.50
5 3.0 9 163.76 144.23 1.20 1.30 1.20 -8.95
5 3.0 10 181.74 160.25 1.21 1.30 1.21 -7.69
Figure 14: Period Values for a 15 Story with varying number of bays.
Table xx above presented period values for a 15 story MRF obtained from modal
analysis using SAP 2000 v14, EBCS-8 empirical formula and Rayleigh‘s formula. For better
understanding of the deviations the results for all the cases considered have also been plotted
separately in graphs shown in Figure 21. It can be observed from the results that an increase
in number of bays increases both story stiffness and story mass which caused a minor increase
on fundamental period. The period values obtained from EBCS-8 and Rayleigh‘s formula
display a difference while agreeing more with Modal periods.
The differences in period between SAP 2000 and EBCS-8 are given in Table xx for all
the cases.
Table xxi: Period Values for a 20 Story with varying number of bays.
l h
P
Ks(bottom)
×(103)
kN/m
ms×(103)
Kg
T1
(MODAL)
T1
(EBCS-8) T1
(RAYLEIGH)
% (T1-
MODAL &
T1-EBCS-8)
5 3.0 2 39.16 35.95 1.09 1.62 1.27 -49.02
5 3.0 3 58.37 53.93 1.15 1.62 1.28 -40.84
5 3.0 4 77.53 71.90 1.18 1.62 1.29 -36.68
0.00
0.20
0.40
0.60
0.80
1.00
1.20
1.40
1.60
37.54 55.68 73.75 91.78 109.79 127.79 145.78 163.76 181.74
PER
IOD
(Se
c)
Bottom Story Stiffness (kN/m) *103
15 STORY
MODAL
EBCS-8
RAYLEIGH

April 2018 Entire Research, Volume-X, Issue-II 27
ISSN 0975-5020
5 3.0 5 96.67 89.88 1.21 1.62 1.29 -34.07
5 3.0 6 115.80 107.85 1.22 1.62 1.29 -32.23
5 3.0 7 134.92 125.83 1.23 1.62 1.30 -30.94
5 3.0 8 154.03 143.80 1.24 1.62 1.30 -29.98
5 3.0 9 173.14 161.78 1.25 1.62 1.31 -29.35
5 3.0 10 192.25 179.75 1.26 1.62 1.31 -28.63
Figure 15: Period Values for a 20 Story with varying number of bays.
Table xxi above presented period values for a 20 story MRF obtained from modal
analysis using SAP 2000 v14, EBCS-8 empirical formula and Rayleigh‘s formula. For better
understanding of the deviations the results for all the cases considered have also been plotted
separately in graphs shown in Figure 22. It can be observed from the results that an increase
in number of bays increases both story stiffness and story mass which caused a minor increase
on fundamental period. The period values obtained from EBCS-8 and Rayleigh‘s formula
display a difference while agreeing more with Modal periods. The differences in period
between SAP 2000 and EBCS-8 are given in Table xxi for all the cases.
Table xxii: Effect of number of bay on story stiffness & story mass
3 story Top &
Intermediate
Bottom
p p Ks, ×103
(kN/m)
% Ks Ks, ×103
(kN/m)
% Ks m, ×103 (Kg) % m
2 __ __ 44.60 __ 41.84 __ 50.00
3 1 6.45 __ 9.31 __ 12.46 __
5 story Top &
Intermediate
Bottom
p p Ks, ×103
(kN/m)
% Ks Ks, ×103
(kN/m)
% Ks m, ×103(Kg) % m
2 __ __ 46.34 __ 44.00 __ 50.00
3 1 7.65 __ 12.10 __ 13.03 __
0.00
0.20
0.40
0.60
0.80
1.00
1.20
1.40
1.60
1.80
39.16 58.37 77.53 96.67 115.80 134.92 154.03 173.14 192.25
PER
IOD
(Se
c)
Bottom Story Stiffness (kN/m) *103
20 STORY
MODAL
EBCS-8
RAYLEIGH

April 2018 Entire Research, Volume-X, Issue-II 28
ISSN 0975-5020
10 story Top &
Intermediate
Bottom
p p Ks, ×103
(kN/m)
% Ks Ks, ×103
(kN/m)
% Ks m, ×103(Kg) % m
2 __ __ 48.28 __ 46.88 __ 50.00
3 1 9.03 __ 16.05 __ 14.38 __
15 story Top &
Intermediate
Bottom
p p Ks, ×103
(kN/m)
% Ks Ks, ×103
(kN/m)
% Ks m, ×103(Kg) % m
2 __ __ 49.12 __ 48.33 __ 50.00
3 1 9.65 __ 18.14 __ 16.03 __
20 story Top &
Intermediate
Bottom
p p Ks, ×103
(kN/m)
% Ks Ks, ×103
(kN/m)
% Ks m, ×103(Kg) % m
2 __ __ 49.51 __ 49.06 __ 50.00
3 1 9.95 __ 19.21 __ 17.98 __
From table xxii above it is clear that for an increase of number of bays from 2 to 3 top
& intermediate story stiffness increase by 47.57%, bottom story stiffness increases by 46.02%
on average while story mass increases by 50% constantly for all stories considered in this
study.
The slight increase of period seen when number of bays increase can be explained by
the fact that the % increase in both story mass and story stiffness is relatively close which
indicates that the two complement each other with regard to their effect on period. Since
period decreases with increase in story stiffness and increases with increase in story mass, an
increase in 46.02% of story stiffness is balanced by an increase in 50% of story mass resulting
in a few increase of period.
It is observed that for the same overall building height but with different number of
bays EBCS-8 formula gives similar (constant) fundamental periods while SAP 2000‘s output
and Rayleigh‘s formula yield a slightly increasing period values with increase in number of
bays.
The findings of this particular investigation are supported by the findings of the
research made on the effect of number of bays on fundamental period of MRF RC buildings
by Michel S.Chalhouba in 2014which is presented in Chapter 2 of this paper
3.2.5 Number of Stories
As seen from the previous analysis results of the parameters the effect of number of
stories on fundamental period has been indirectly reflected in every case considered so far.
It can be learned from the results that as the number of stories increase period shows
an increase it is also evident that size of columns increase as the number of stories increase
from the requirement of gravity load analysis which resulted in increase of both story stiffness
and story mass.
The % differences in period between SAP and EBCS-8 outputs are given for all the
cases of each parameter.

April 2018 Entire Research, Volume-X, Issue-II 29
ISSN 0975-5020
Figure 16: Effect of number of stories on period
From figure 23 it is clear that period increases with increase in number of stories. Up to
around 13 stories both Rayleigh and EBCS-8 formulations tend to underestimate period
leading to a conservative estimate of earthquake forces. Above 13 stories EBCS-8 period
values are overestimated which translate in to lower earthquake forces compared to modal
analysis and Rayleigh‘s output.
3.3 Expression for Fundamental Time Period One of the objectives of the present study was to formulate an improved empirical relation
to evaluate fundamental time period of regular RC MRF buildings considering different
system parameters that have a considerable effect on period beside building height seen in
many building codes including EBCS-8.
To this effect SPSS v20 for IBM software was used to come up with a best fit to the modal
analysis outputs using multiple linear regressions.
The outline of the multiple linear regression technique is discussed in Chapter 3 of this paper.
The mathematical model used for the regression takes the following form,
T1 = C + b1l+b2h+ b3s+b4ms+b5p (9)
The values for the constant C and the regression coefficients (b1, b2,…& b5)were then
calculated using the software.
The statistical outputs are presented as follows,
Table xxiii: Model Summary
Model Summary
Mode
l
R R Square Adjusted R
Square
Std. Error of
the Estimate
1 .990a .981 .981 .06842
a. Predictors: (Constant), Number of Bays, Number of
Stories, Beam Span (m), Column Height (m), Story Mass
(*103) Kg
(Source: SPSS v20 for IBM software)
The model summary table above reports the strength of the relationship between the model
0
0.2
0.4
0.6
0.8
1
1.2
1.4
1.6
1.8
3 5 10 15 20
PER
IOD
(Se
c)
NUMBER OF STORIES
MODAL
EBCS-8
RAYLEIGH

April 2018 Entire Research, Volume-X, Issue-II 30
ISSN 0975-5020
and the dependent variable.
R, the multiple correlation coefficient, is the linear correlation between the observed and
model-predicted values of the dependent variable. Values closer to 1 indicate a strong
relationship.
R Square, the coefficient of determination, is the squared value of the multiple correlation
coefficients. It shows that 98.1% of the variation in period is explained by the model (9).
Table xxiv: ANOVA
Model Sum of
Squares df Mean Square F Sig.
1
Regression 46.892 5 9.378 2003.191 .000b
Residual .908 194 .005
Total 47.800 199
a. Dependent Variable: Period (Sec)
b. Predictors: (Constant), Number of Bays, Number of Stories, Beam Span (m), Column
Height (m), Story Mass (*103) Kg
(Source: SPSS v20 for IBM software)
The ANOVA table tests the acceptability of the model from a statistical perspective. The
Regression row displays information about the variation accounted for by the model. The
Residual row displays information about the variation that is not accounted for by the chosen
model. As seen in the table the regression sum of squares is considerably larger than the
residual sum of squares, which indicates that about most of the variation in Period is
explained by the model. The significance value of the F statistic is less than 0.05, which
means that the variation that is explained by the model is not simply due to chance.
Table xxv: Coefficients
(Source: SPSS v20 for IBM software)
Table xxv above presents values for the regression coefficients (b1, b2….& b5) in the model
which can be seen in the first column of the table. It can also be seen from the table that some
of the independent variables do not contribute much to the model. The significance value for
those independent variables less than 0.05 indicate a greater contribution to the model.
April 2018 Entire Research, Volume-X, Issue-II 31
ISSN 0975-5020
Figure 17: Normal P-P Plot of regression Standardized Residual
(Source: SPSS v20 for IBM software)
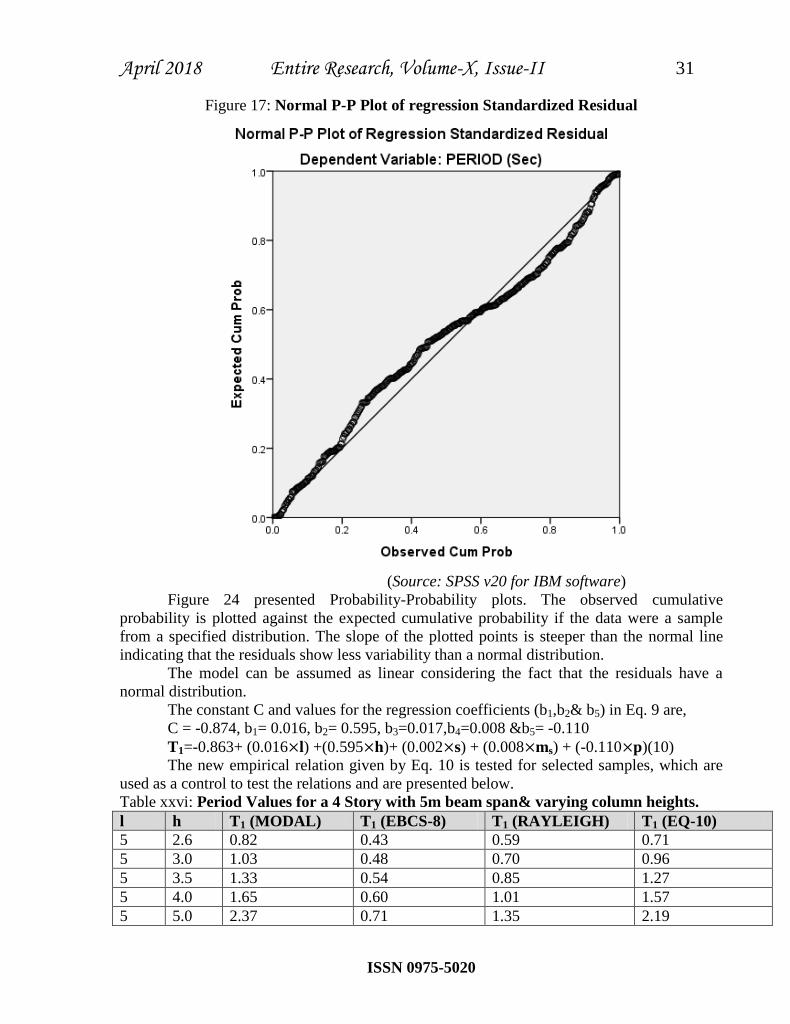
Figure 24 presented Probability-Probability plots. The observed cumulative
probability is plotted against the expected cumulative probability if the data were a sample
from a specified distribution. The slope of the plotted points is steeper than the normal line
indicating that the residuals show less variability than a normal distribution. The model can be assumed as linear considering the fact that the residuals have a
normal distribution. The constant C and values for the regression coefficients (b1,b2& b5) in Eq. 9 are,
C = -0.874, b1= 0.016, b2= 0.595, b3=0.017,b4=0.008 &b5= -0.110
T1=-0.863+ (0.016×l) +(0.595×h)+ (0.002×s) + (0.008×ms) + (-0.110×p)(10)
The new empirical relation given by Eq. 10 is tested for selected samples, which are
used as a control to test the relations and are presented below.
Table xxvi: Period Values for a 4 Story with 5m beam span& varying column heights.
l h T1 (MODAL) T1 (EBCS-8) T1 (RAYLEIGH) T1 (EQ-10)
5 2.6 0.82 0.43 0.59 0.71
5 3.0 1.03 0.48 0.70 0.96
5 3.5 1.33 0.54 0.85 1.27
5 4.0 1.65 0.60 1.01 1.57
5 5.0 2.37 0.71 1.35 2.19

April 2018 Entire Research, Volume-X, Issue-II 32
ISSN 0975-5020
Figure 18: Period Values for a 4 Story with 5m beam span& varying story stiffness.
The improved formula given in EQ-10 is tested for each parameter. Table 26 and
Figure 25 above portray the variations in period calculated using modal analysis technique
(SAP 2000 v14), EBCS-8 empirical formula, Rayleigh‘s formula and the improved formula
(EQ-10) with 5m spanof beam and varying column heights of a 4 story RC MRF. It can be
seen in Figure 25 the improved formula presents closer values to the SAP outputs with similar
pattern of variation.
The period variation with increase in story mass is presented for a 13 story RC MRF
in Table xxvii and Figure 26 below and a better closeness in period between the improved
formula and SAP 2000 outputs can be observed.
Table xxvii: Period Values for a 13 Story with varying story mass.
Story Mass
(×103) Kg
T1 (MODAL) T1 (EBCS-8) T1 (RAYLEIGH) T1 (EQ-10)
64.10 1.11 1.17 1.16 1.09
66.10 1.13 1.17 1.17 1.11
68.10 1.15 1.17 1.18 1.12
70.10 1.17 1.17 1.19 1.14
72.10 1.19 1.17 1.20 1.15
74.10 1.21 1.17 1.21 1.17
Figure 19: Period Values for a 13 Story with varying story mass.
0
0.5
1
1.5
2
2.5
58.20 40.76 27.62 19.62 10.97
PER
IOD
(Se
c)
BOTTOM STORY STIFFNESS (*103) kN/m
4 STORY
MODAL
EBCS-8
0
0.2
0.4
0.6
0.8
1
1.2
1.4
1.6
1.8
64.10 66.10 68.10 70.10 72.10 74.10
PER
IOD
(Se
c)
STORY MASS (Kg) *103
13 STORY
MODAL
EBCS-8

April 2018 Entire Research, Volume-X, Issue-II 33
ISSN 0975-5020
Table xxviii and Figure 27 below reveal the variations in period calculated using
modal analysis technique (SAP 2000 v14), EBCS-8 empirical formula, Rayleigh‘s formula
and the improved formula (EQ-10) with varying number of bays for a 22 story RC MRF. It
can be seen in Figure 27 the improved formula presents closer values to the SAP outputs and
Rayleigh‘s formula with similar pattern of variation
Table xxviii: Period Values for a 22 Story with varying Number of bays.
Number of Bays T1 (MODAL) T1 (EBCS-8) T1 (RAYLEIGH) T1 (EQ-10)
2 1.15 1.74 1.34 1.10
3 1.21 1.74 1.35 1.14
4 1.24 1.74 1.35 1.17
5 1.25 1.74 1.35 1.20
6 1.26 1.74 1.36 1.24
7 1.27 1.74 1.36 1.27
8 1.28 1.74 1.37 1.31
9 1.29 1.74 1.37 1.34
10 1.30 1.74 1.38 1.37
Figure 20: Period Values for a 22 Story with varying Number of bays.
4. Conclusions and Recommendations
This chapter presents a brief summary of the research findings discussed in details in
Chapter 4 along with significant conclusions and recommendations from this study and for
further study.
Fundamental time period of all the selected RC MRF building models were
estimated using modal analysis, Rayleigh‘s method, and empirical equation given in EBCS-
8. The results were critically analyzed and are presented in this chapter.
4.1. Summary of Findings
The important findings obtained from the analysis of 200 sample RC MRF building
frames are summarized as follows.
1. An increase in both beam span l, and column height h decreases story stiffness while
increasing story mass which ultimately resulted in increase in the time period. More
0.00
0.20
0.40
0.60
0.80
1.00
1.20
1.40
1.60
1.80
PER
IOD
(Se
c)
BOTTOM STORY STIFFNESS (*103) kN/m
22 STORY
MODAL
EBCS-8

April 2018 Entire Research, Volume-X, Issue-II 34
ISSN 0975-5020
specifically when column height increases from 3 to 3.5m bottom story stiffness decreases
by 30.62%; top and intermediate stories also decrease by 29.1% on average, while story
mass increases by 6.2% on average for all stories considered in this study.
When beam span increases from 3 to 4m, bottom story stiffness decreases by 17.86%, top
and intermediate stories also decrease by 20.48% on average while story mass increases
by 20.92% for all stories on average.
The range of increment in period for the parameter column height h is found to be more
significant than beam span l. It is observed that for the same overall building height but
with different heights of column and span of beams EBCS-8 formula gives similar
fundamental periods while SAP 2000 output and Rayleigh‘s formula yield different
periods.
2. Fundamental time period increases with an increase in additional mass from partition
walls and floor finishes. It was observed that when story mass increases by 2000Kg story
mass increases by 3.45% for all stories on average which resulted in increase of period by
1.85% on average. It was also witnessed that for the same overall building height but with
variations in story masses EBCS-8 formula gives similar (constant) fundamental periods
while SAP 2000 output and Rayleigh‘s formula yield increasing period values with
increase in story mass.
3. Fundamental time period increases slightly with an increase in number of bays p. It has
been seen that for an increase of number of bays from 2 to 3 top and intermediate story
stiffness increase by 47.57%; bottom story stiffness increases by 46.02% on average,
while story mass increases by 50% constantly for all stories considered in this study. It
was also observed that for the same overall building height but with different number of
bays EBCS-8 formula gives similar (constant) fundamental periods while SAP 2000
output and Rayleigh‘s formula yield a slightly increasing period values with increase in
number of bays.
4. It is clear that period increases with increase in number of stories. Up to around 13 stories
both Rayleigh and EBCS-8 formulations tend to underestimate period leading to a
conservative estimate of earthquake forces. Above 13 stories EBCS-8 period values are
overestimated which translate in to lower earthquake forces compared to modal analysis
and Rayleigh‘s output.
5. An attempt to provide an improved empirical relation using story mass, story stiffness and
number of stories as independent variables and period as a dependent variable revealed
that the correlation % between story mass and story stiffness to be 70% which implies that
these parameters cannot be considered as independent variables as far their effect on
period is considered.
Therefore an another relationship among the parameters beam span, column
height, number of bays, story mass and number of stories is presented separately with
period using SPSS v20 for IBM software to come up with a best fit to the modal analysis
outputs using multiple linear regressions.
The values for the constant c and the regression coefficients in the mathematical
model used for the regression have been evaluated by the statistical software and it is
found out that 98.1% of the variation in period is explained by the model.
6. The new empirical relation has been tested for selected samples of RC MRF buildings and
the period values estimated using the new formula show a good resemblance to the SAP
2000 outputs.

April 2018 Entire Research, Volume-X, Issue-II 35
ISSN 0975-5020
4.2. Conclusions Based on the findings presented in this thesis report, the following item wise
conclusions are drawn below: 1. It is concluded that the fundamental time period in a RC regular MRF building is not a
function of building height only, which i.e. the influence of important structural parameters on fundamental time period of a regular RC MRF building have not been addressed in EBCS-8 provisions. The simplified code formula, pertaining to total building height, exhibited discrepancies with the modal analysis result and Rayleigh‘s method results.
2. Based on the findings from the analysis, it can be concluded that fundamental time period is significantly influenced by story stiffness and story mass. It is evident that period increases with an increase in story mass and decreases with increase in story stiffness and vice versa but this fact is not reflected in the EBCS-8 Code.
3. Fundamental time period increases with increasing beam span and column height since an increase in both parameters results in decrease of story stiffness and increase of story mass. A variation in column height has more significant influence on story stiffness than a variation in beam span and a variation in beam span has more significant influence on story mass than a variation in column height. This is not accounted in EBCS-8 provisions since it is observed that for the same overall building height but with different height of columns and span of beams EBCS-8 formula gives similar fundamental periods while SAP 2000 output and Rayleigh‘s formula yield different periods.
4. Considering the outcome of the analysis it is also rational to generalize that fundamental time period increases with an increase in additional story mass due to partition walls and floor finishes. But this is not addressed in EBCS-8 provisions since it is witnessed that for the same overall building height but with additional story masses EBCS-8 formula gives constant fundamental time periods while SAP 2000 output and Rayleigh‘s formula give increasing periods.
5. Looking at the results of the analysis it is imperative to conclude that fundamental time period increases slightly with an increase in number of bays. The influence of a variation in number of bays on story stiffness and story mass is relatively close with a slight increase in the influence of story mass which resulted in increase of period as number of bays increase. This is not reflected in EBCS-8 provisions since it is seen that for the same overall building height but with increasing number of bays EBCS-8 formula gives constant fundamental time periods while SAP 2000‘s output and Rayleigh‘s formula give slightly increasing periods.
6. The study also indicates that period increases with increase in number of stories. Within a range of 3 to approximately 13 stories both Rayleigh and EBCS-8 formulations tends to underestimate the time period leading to a conservative estimate of earthquake forces. More than 13 stories EBCS-8 period values are overestimated which translate in to lower earthquake forces compared to modal analysis and Rayleigh‘s output.
7. Overall results of the analysis shows that the column height, beam span, number of bays, and story mass when included in the fundamental time period evaluation, yields results that are closer to the exact modal analysis solution than do the simplified code formula given in EBCS-8.
8. Lastly it can be concluded that story mass and story stiffness cannot be considered as independent variables as far as their effect on fundamental period is considered. Since they are inherent properties of structural members changes in parameters affects both.

April 2018 Entire Research, Volume-X, Issue-II 36
ISSN 0975-5020
4.3. Recommendations 4.3.1. Recommendations from this study (i) It is strongly recommended that it is clearly essential to consider revision of EBCS-8
provisions for calculating fundamental time period of regular RC MRF buildings by considering the important system parameters that greatly influence fundamental period other than building height.
(ii) In addition to the above suggestion it is recommended to use the improved empirical relation obtained from this study by adopting it in EBCS-8 code provisions after assessing its workability especially for preliminary design of building structures for earthquake resistance.
(iii)It is also wise to consider decreasing the 80m building height limit in which equivalent static analysis is allowed for estimating fundamental time period of regular RC MRF buildings in EBCS-8. From the current study it is observed that more than 13 stories (about 40m height) EBCS-8 formula overestimates fundamental time period resulting in lower values of base shear force which has a detrimental effect on structural safety and wellbeing of occupants during an earthquake. Therefore it is recommended to decrease the height limit to about 40m or 13 stories and to suggest the use of dynamic analysis methods beyond 13 stories.
(iv) While carrying out the data collection using questionnaires around Mekelle and Adigrat towns the researcher has noticed that most of the design and consultancy professionals do not consider or have limited knowledge of the effect of the different system (building) parameters on earthquake resistance. Most of the parameters that have been studied in this paper (beam span and column heights, number of bays & stories) are provided in design from the requirements of space, architecture and gravity load analysis only. Considering the fact that these towns are in a high seismic zone it is recommended to give the necessary attention to earthquake effects while providing design values for these parameters.
4.3.2. Scope for further study (i) The present study was limited to reinforced concrete (RC) multi-storied MRF buildings.
There is a further scope for RC multi-storied frame buildings with lateral force resisting systems such as shear walls.
(ii) A similar detailed study can also be conducted on Steel structures. (iii) This thesis work was also limited to two dimensional frames with lumped mass
idealization. There is a further scope for a three dimensional analysis of frames with distributed mass.
(iv) This study did not take into account the soil-structure interaction which has a great influence in seismic response of buildings. Further analysis can be carried out considering soil-structure interaction.
(v) The present study did not consider irregularities with height in both story mass and story stiffness in the frame. Further studies can include this irregularity to study their effect on fundamental period and come up with an all rounded empirical relations.
(vi) The current study is limited to reinforced concrete (RC) multi-storied MRF buildings without infill there is a scope for future study considering infill stiffness.
(vii) Further studies can include effect of T-beams and cracked sections as they are cases present in reinforced concrete design which influence the stiffness of members in particular and story stiffness in general.

April 2018 Entire Research, Volume-X, Issue-II 37
ISSN 0975-5020
5. References [1] Ethiopian Building Code Standard (EBCS-8) 1995, ―Design of Structures for
Earthquake Resistance‖. Ministry of Works & Urban Development, Addis Ababa, Ethiopia.
[2] S.K. Duggal (2007). ―Earthquake Resistant Design of Structures‖.Oxford university press, India, New Delhi. Pp. 140-145.
[3] A.M.M. Taufiqul Anwar and Md. ZahidHossain.(1996), ―Bay Effect on Period of Framed Buildings‖, Journal of Civil Engineering, The institution of Engineers, Bangladesh, Vol. CE 24, No.2.
[4] R. Sudarshan Brahma and KaustubhDasgupta , October 2011,:International Journal of Earth Sciences and Engineering ISSN 0974-5904, Volume 04, No 06 , pp. 560-564.
[5] Amr S. Elnashai and Luigi Di Sarno (2008), ―Fundamentals of Earthquake Engineering‖, ISBN: 978-0-470-02483-6 (Hbk). Antony Rowe Ltd, Chippenham, Wilts, England.
[6] Athol J. Carr (1994), ―Dynamic Analysis of Structures‖, Bulletin of the New Zealand National Society for Earthquake Engineering, vol 27,No.2, June 1994.
[7] SAP 2000 v14 User‘s manual for Revision 5.2 (1996), Volume i-iv, Swanson Analysis Systems Inc., P.O.Box 65, Johnson Road, Houston.
[8] Applied Technological Council. (1978). "Tentative provisions for the development of seismic regulations forbuildings.‖Rep. No.ATC3-06.Applied Technological Council. Palo Alto, California.
[9] Goel, R. K., and Chopra, A. K. (1996). ―Evaluation of Code Formulas for Fundamental Period of Buildings‖. CD-ROM Proc., 11th World Conf. on Earthquake Engrg., Paper No. 1127, Elsevier Science Ltd., Oxford, U.K.
[10] Chopra. A. K. (1995). ―Dynamics of structures: theory and applications to earthquake engineering‖. Prentice-Hall.Inc., Upper Saddle River, N.J.
[11] Clive L. Dym P.E and Harry E. Williams (2007).―Estimating fundamental frequencies of tall buildings‖.Journal of Structural Engineering ASCE, NY.[12] A. Jalali and A. Salem Milani (2003). ―Vibration Properties of Reinforced Concrete Buildings Determined from Ambient Vibration Tests‖. 4
th International Conference of Earthquake
Engineering and Seismology.Tehran, Islamic Republic of Iran. [13] EhsanSaliniFiroozabad, Dr. K. Rama Mohan and RaoBahadorBagheri (2013)
―Determination of Time Period of Vibration Effect on Seismic Performance of Building‖. Applied Mechanics and Materials.Vol.330 pp. 878-883. Switzerland.
[14] Commentary Eurocode 2. European Concrete Platform ASBL, June2008.8 rue Volta, 1050 Brussels.
[15] EhsanEsnaAsari (2014). ―Calculating Free and Forced Vibrations of Multi-Story Shear Buildings by Modular Method‖. International Science Congress Association, Research Journal of Recent Sciences. Vol.3 (1), pp.83-90.
[16] Chiauzzi L. Masi., Mucciarelli M.et.al. (2012). ―Estimate of fundamental period of reinforced concrete buildings: code provisions Vs. experimental measures in Victoria and Vancouver (BC Canada) ‖. 15
th World Conference on Earthquake Engineering,
Lisboa. [17] Vinay Mohan Agrawal and PradipSarkar, ―Effect of Irregularity on the fundamental
period of setback buildings‖,11th
International conference, RASD 2013 Pisa, Italy
* * *

April 2018 Entire Research, Volume-X, Issue-II 38
ISSN 0975-5020
Application of Traditional Ecological knowledge for Sustainable
Ecological Restoration- Concepts and Cases
R. N. Gamachchige: Department of Geography, University of Sri Jayawardenepura,
Nugegoda, Sri Lanka.
Abstract
It is the scientific notion that the sustainable features observed in the concept of
Traditional Ecological Knowledge can be used as solutions for most ecological issues
emerged in the recent decade. The process of preventing the environmental pollution and
environmental degradation in order to reinstate the ecological system which is defined as the
Ecological Restoration Process is considered as a scientific concept as well as a discipline of
applied sciences in the contemporary era on the basis of such ecological issues. This article
aims to analyze the application of Traditional Ecological Knowledge in restoring the degraded
ecological systems sustainably with reference to recent researches. Further, the article serves
to determine the possibility of converting scientific restoration methodologies into sustainable
restoration methodologies by making the experiential knowledge in the context of Traditional
Ecological Knowledge overlapped with the ecological restoration concept which is considered
as a scientific perspective.
The compositions of those concepts, experience of the Asian region and differences in
the application of them in Sri Lankan context have been mainly focused in this study.
Sustainable ecological restoration methodologies are mostly explicit in the traditional
knowledge of Sri Lanka and South Asia which claim to have the highest bio-diversity and a
cultural history while there is a possibility of minimizing the environmental degradation and
restoring the degraded ecological systems through using those methodologies under a
scientific and culturally flexible perspective.
Key Words: Traditional Ecological Knowledge, Sustainable ecological restoration,
Degradation
1. Introduction
The concept of traditional ecological knowledge (TEK), along with synonymous or
closely related terms like indigenous knowledge and native science, has some of its origins in
literatures on international development and adaptive management. There is no universally
accepted definition for traditional ecological knowledge (TEK). In the literature it is defined
as an ambiguous term which has many theoretical arguments. Societies and cultures have
been changing through the time and the space. Temporal and the spatial pattern of the living
area influence the human adaptation to their surrounding or environment. Because of those
experiences which have been taken from the environment, a unique knowledge about the eco
system of the surrounding area is built. That kind of spatial knowledge about the environment
can basically defined as a traditional ecological knowledge.
Many scholars prefer to identify TEK as a collaborative concept. Because of that
many kinds of dissimilarities occur in the definitions of the TEK.
Traditional ecological knowledge refers to the knowledge, practice and belief
concerning the relationship of living beingsto one another and to the physical environment,
which is held by people in relatively non-technological societies with a direct dependence

April 2018 Entire Research, Volume-X, Issue-II 39
ISSN 0975-5020
upon local resources (Berkes 1993)
Traditional ecological knowledge is not unique to Native American culture but exists
all over the world, independent of ethnicity. It is born of long intimacy and attentiveness to a
homeland and can arise wherever people are materially and spiritually integrated with their
landscape (Kimmerer 2000).
This long intellectual tradition exists in parallel to Western science, yet has been
historically marginalized by the scientific community (Salmon 1996).
Mainly these definitions prove that the native knowledge is a strong tool to identify
the novel scientific themes. Because of these comparisons of the TEK and SEK, most of the
scientists try to distinguish these topics. Traditional knowledge has much in common with
scientific ecological knowledge (SEK), which is not surprising since both traditions derive
from the same source: systematic observations of nature. Both knowledge systems yield
detailed empirical information of natural phenomena and relationships among the ecosystem
components. Both SEK and TEK have predictive power, and in both intellectual traditions,
observations are interpreted within a particular cultural context. TEK is being recognized as
having equal status with scientific knowledge (UNEP 1998)1.
FikeretBerkes (1993) has mentioned that there are 9 differentiations of the TEK from
the SEK.
TEK
SEK
Mainly qualitative. Mainly quantitative.
Possesses an intuitive component. Purely rational.
Holistic. Reductionist.
Mind and matter are considered together. A separation of mind and matter.
Moral. Supposedly value-free.
Spiritual. Mechanistic.
Based on empirical observations and
accumulation of facts by trial-and-error.
Based on experimentation and systematic
deliberate accumulation of fact.
Based on data generated by resource users
themselves.
Based on data generated by a specialized
cadre of researchers.
Based on diachronic data, i.e., long time-
series on information on one locality.
Based on synchronic data, i.e., short time-
series over a large area.
Traditional knowledge encompasses a wide range of biological information, which
overlaps significantly with the content of a mainstream course in ecology or conservation
biology. The scope of traditional ecological knowledge includes detailed empirical knowledge
of population biology, resource assessment and monitoring, successional dynamics, patterns
of fluctuation in climate and resources, species interactions, ethno taxonomy, sustainable
harvesting and adaptive management and manipulation of disturbance regimes (Berkes1999).
2. Characteristics of traditional ecological knowledge
Characteristics of traditional ecological knowledge (TEK) have been investigated by
many researchers and the following paragraph has summarized the main characteristics and
how those characteristics have been explained.
TEK adopts a more holistic approach, and does not separate observations into different

April 2018 Entire Research, Volume-X, Issue-II 40
ISSN 0975-5020
disciplines as does western science (Mazzocchi, F., 2006). Moreover, according to the
Freeman (1992) TEK systems do not interpret reality on the basis of a direct cause and effect,
but rather as a world made up of complex web of interactions. Some of these TEK are based
on their religion and even based on super natural incidents as well. These quantities may not
be able to either measure or compare or even these may not be tangible (Sharma &Pegu,
2011). According to Somasundara (2006) TEK is mainly based on cognitive, ideational and
social environments.
According to Clarkson et al. (1992); Berkes (1993); Doubleday (1993); Tyler (1993);
Wavey (1993); Mitchell (1994), other common characteristics of traditional ecological
knowledge are as follows;
Knowledge is gained through intimate contact with the local environment, while noting
patterns or trends in its flora, fauna and natural phenomena. It is based on data collected
by resource users through observation and hands-on experience referred to as qualitative.
Knowledge is transmitted by oral tradition.
Social context that sees the world in terms of social and spiritual relations among all life
forms which manifeststhatall parts of the natural world are infused with spirit. Mind,
matter and spirit are perceived as inseparable referredtoas spiritual.
Promote balance and harmony between the well-being of the individual and the well-
being of the social group referred to as mutual well-being, reciprocity and cooperation.
Views time and processes as cyclical refers as non-linearity.
According to the above statements, the holistic view or approach compared to cause
and effect view can be identified as the main characteristic of Traditional Knowledge. Also it
has been identified asthis knowledge cannot be measured or compared with current scientific
methods. The qualitative, nonlinearity, spiritual and mutual well-being, reciprocity and
cooperation can be identified as the key significant characteristics. Although the above
characteristics have directed traditional knowledge towardsmore of practical knowledge, it is
not possible to simply reduce TEK to practical knowledge that is exclusively based on
experience as opposed to theoretical knowledge, which is developed through deductive or
inductive reasoning.
3. Ecological restoration
This refers to the process of assisting the recovery of an ecosystem that has been degraded,
damaged or destroyed. Although the idea of ecological restoration is introduced as a field of
Biology in 1980, it is being practiced by community over thousands of years. This has strong
linkage with TEK as well. Most of the TEK on agriculture focuses on agro productivity
coined with ecological balance and restoration.
Ecological restoration is mainly based on approaches of Sustainable Ecology, Cultural
Ecology and Sustainable Adaptation Ecology. Restoring or recovering the damaged, degraded
or disturbed environmental systems without compromising sustainability of human kind and
ecological balance of the environment can be defined as Ecological restoration
(Douterlungneet al.,2010).
In most of sustainable development projects, environmental conservation projects, the
requirement of sustainable interrelationship between human and environment which arises
from the ecological restoration is a vital fact and it is necessary to enforce rules or
mechanisms to secure it.
The above concept of ecological restoration can be stated in five steps.
1. Understanding the ecological system.

April 2018 Entire Research, Volume-X, Issue-II 41
ISSN 0975-5020
2. Understating the ecological process.
3. Identifying the disturbances and damages of the ecological system.
4. Restoration of ecological system caused by the above disturbances or damages.
5. Adapting to the restored ecological system.
Restoration of endangered species types, Restoration or conservation of bio-diverse
eco systems and Restoration of cultural or environmental habitats are few common examples
for ecological restoration. Among these ecological restoration & sustainability concepts, the
restoration of agricultural systems and ecosystems which falls under restoration of cultural or
environmental habitats becomes a higher priority due to direct relationship of agriculture and
in human sustainability.
With regard to agricultural ecological restoration, following methods are widely used
around the world for various restoration processes.
Reforestation and re-vegetation to minimize soil erosion.
Day lighting streams.
Remove of non-native species and weeds.
Reintroduction of native species.
Habitats and range improvement for targeted species.
Upretyet al (2012) believes that the ER mainly depends on two approaches: scientific
approach and multidisciplinary approach. Scientific approach mainly coordinates with
scientific subjects including Biology and Geology, Chemistry, Climatology, Soil Science, etc.
As the Multidisciplinary approach, social, cultural, physical and spiritual contexts are
the key areas which will coordinate the ecological restoration. Approach tries to coordinate
cultural and social environment with physical environmental conditions and spiritual contexts
of a society for ecological restoration. TEK for ecological restoration is a vast area which
comes under this multidisciplinary approach.
There are three main arguments which have been stated by scholars about usability of
TEK. Those arguments give an important idea about the method which can be used to overlap
the scientific system of ER and the TEK. Localization, ethical consideration and adaptation.
According to localization argument, some of the scientists have different opinion due to
inherited nature of TEK. Since TEK is not fully scientifically sounded or understandable,
some of the scholars have been skeptical about the usability of this knowledge beyond limited
region (Hobbs & Harris, 2001). Acording to Mazzocchi(2006), TEK contains mysterious
rituals, beliefs, folk tales, etc. which are hard to justify with modern scientific methods and
indistinct information available about the origin of this knowledge questions many methods of
traditional knowledge.
According to ethical consideration, many scholars concern on the ethic of exploiting
or exploring these culturally related things for the academic or policy purposes.Bellet al.,
(1997) believes that by investigating, verifying or challenging their cultural identities,
landmarks will harm or disrupt their cultural sustainability, etc. They propose to conserve the
TEK.
According to the adaptation argument, scholars have stated that science is not a
medium which can fully understand the TEK. They believe that understanding of TEK should
be based on the perception of traditional people. This concept has been used by
Gariboldi&Turneer() to understand the usability and the outcome of the TEK. In their study,
they have used this adaptive method to identify the keystone species in Canada. As mentioned
above, though there are peeks and falls in use of TEK, it is important to account TEK for

April 2018 Entire Research, Volume-X, Issue-II 42
ISSN 0975-5020
better ER and investigate TEK without harming or disrupting the culture which it resides.
When considering the name ―TEK‖, although there are some differences in the terms,
indigenous knowledge, traditional ecological knowledge, traditional ecological knowledge
and wisdom, traditional environmental knowledge, local ecological knowledge, etc. theyrefer
to the same context in many materials (Hobbs. and Norton, 1996).
Understanding limits of the modern science and how TEK can extend those limits is
important. This can be explained in two ways. The modern science or scientific method
requires practical experiences or incidents to construct a hypotheses or model. Since these
experiences or incidents are rarely constructed in lab environment, scientists mainly rely on
investigated phenomenon observed by real world. Though modern science evolves
continuously, it requires above phenomena or observations to expand its limits. Since TEK
contains enormous amount of observations, mechanisms and methods, this gives rise to new
models, hypotheses, etc. for modern science (Mazzocchi,2006).
As of the second point, due to inheriting nature of the TEK, the mechanisms and
methods contained in it had been evolved for centuries and due to these iterative processes
TEK consists of previously gathered ecological data by providing concordant and additional
information at a finer geographic scale than scientific data. The limited ability of modern
science to deal effectively with environmental issues of increasing magnitude and complexity
can be comprehended much easily with above data (Mazzocchi,2006).
In 1980, Restoration ecology has been introduced as the scientific study for supporting
ER practices. Restoration ecology is also introduced as the academic study of the process of
ER. This concept mainly comes under conservation biology and it alignswith scientific study
protecting and restoring bio-diversity. Some researchers believe that restoration ecology
provides effective conceptual and practical tools for restoration of ecosystems (Hobbs &
Harris, 1996). They argue that restoration ecology has to be an integral component of land
management as well. Apart from the common theme of ―scientific study‖, some of the
researchers have explored on various other fields where there are interconnections between
restoration ecology such as landscape ecology and cultural ecology,etc. (Bell et al., 1997).
Although many researchers have taken various paths, almost all the researches are
based on two fundamental concepts, which are namely ―ecosystem health‖ and ―ecosystem
integrity‖ [SER 2002]. There are four main key processes which Hobbs&Nortan (1996) have
depicted.
I. Identifying and dealing with the processes leading to degradation,
II. Determining realistic goals and measures of success,
III. Developing methods for implementing the goals and incorporating them into land-
management and planning strategies,
IV. Monitoring the restoration and assessing its success (Hobbs &Nortan,1996).
This research mainly set to examine the first three processes.
3.1 Goals of ecological restoration
This can be linked with the above-mentioned restoration ecology; that these goals can
be identified as the conceptual goals derived from restoration ecology models. When the ER
goals are considered, many researches and organizations have identified various goals which
cover many aspects of the ecosystems. They are,
I. Improvement of biological diversity in degraded landscapes,

April 2018 Entire Research, Volume-X, Issue-II 43
ISSN 0975-5020
II. Increment of the population levels and widening the distribution of rare and threatened
species,
III. Enhancement of landscape connectivity,
IV. Increasing the availability of environmental goods and services, and contribution to
the improvement of human well-being
These are considered as the key goals(SERI & IUCN, 2004). As shown in Figure 01,
for a successful ecological restoration there should be a combination of economic,
environmental and social sustainability.
Figure 01: The relationship between social, economic and environmental sustainability
(adapted from Jepma & Munasinghe, 1998)
As a single rigid goal of ER, the return of an ecosystem to its pre-disturbance state
could be identified and it is believed that the knowledge of historic conditions is the starting
point of restoration design (Kimmerer, 2000; Egan & Howell, 2001; Lamb et al., 2005).
3.2 Reference eco-system
In ER, it is important to understand how restoration ecologists measure their success
and how they identify the degraded ecosystems. Both of the above ideas need a reference eco
system, which can give a basic reference to an ideal ecosystem. Determination of reference
conditions or reference ecosystem becomes the central component of ER (Higgs, 1997). The
reference ecosystem provides a model to follow and is also used as a standard for evaluation
and monitoring (Meffee& Carroll, 1994). Finding a reference ecosystem can be done either by
a predictive basis or a historical basis. Predictive basis is mainly based on scientific
methodologies dealing with concepts of sustainability. Although predictive basis
methodologies are more aligned with ER scientific approach for constructing reference
ecosystems, TEKand historical information play vital roles in the determination of the
reference eco system for both methods. In this study, a concept of reference eco system will
be examined in respective villages and TEK will be the main factor which is going to be
utilized for construction of reference eco system.
An ecosystem is mainly based on the composition of existing animal species, forestry
and landscape. Many ecologists believe that the site selection for restoration plantation is as
important as species selection (Shebitz, 2005). According to Higgs et al (2014),amodel of
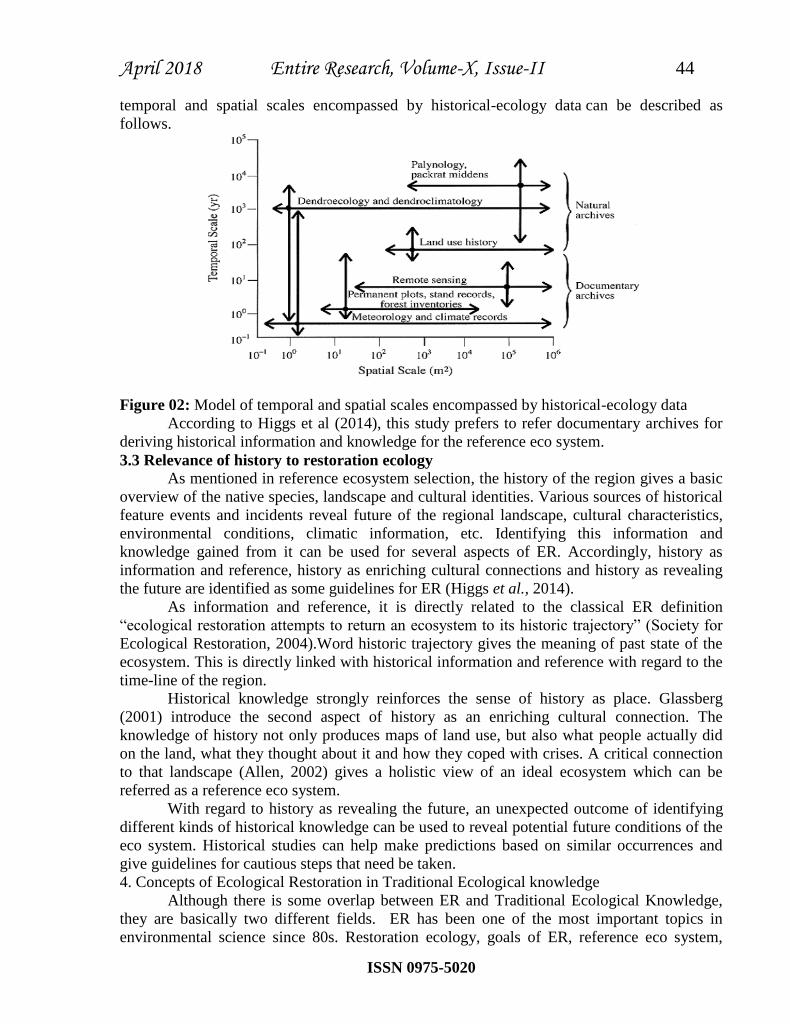
April 2018 Entire Research, Volume-X, Issue-II 44
ISSN 0975-5020
temporal and spatial scales encompassed by historical-ecology data can be described as
follows.
Figure 02: Model of temporal and spatial scales encompassed by historical-ecology data
According to Higgs et al (2014), this study prefers to refer documentary archives for
deriving historical information and knowledge for the reference eco system.
3.3 Relevance of history to restoration ecology As mentioned in reference ecosystem selection, the history of the region gives a basic
overview of the native species, landscape and cultural identities. Various sources of historical
feature events and incidents reveal future of the regional landscape, cultural characteristics,
environmental conditions, climatic information, etc. Identifying this information and
knowledge gained from it can be used for several aspects of ER. Accordingly, history as
information and reference, history as enriching cultural connections and history as revealing
the future are identified as some guidelines for ER (Higgs et al., 2014).
As information and reference, it is directly related to the classical ER definition
―ecological restoration attempts to return an ecosystem to its historic trajectory‖ (Society for
Ecological Restoration, 2004).Word historic trajectory gives the meaning of past state of the
ecosystem. This is directly linked with historical information and reference with regard to the
time-line of the region.
Historical knowledge strongly reinforces the sense of history as place. Glassberg
(2001) introduce the second aspect of history as an enriching cultural connection. The
knowledge of history not only produces maps of land use, but also what people actually did
on the land, what they thought about it and how they coped with crises. A critical connection
to that landscape (Allen, 2002) gives a holistic view of an ideal ecosystem which can be
referred as a reference eco system.
With regard to history as revealing the future, an unexpected outcome of identifying
different kinds of historical knowledge can be used to reveal potential future conditions of the
eco system. Historical studies can help make predictions based on similar occurrences and
give guidelines for cautious steps that need be taken.
4. Concepts of Ecological Restoration in Traditional Ecological knowledge
Although there is some overlap between ER and Traditional Ecological Knowledge,
they are basically two different fields. ER has been one of the most important topics in
environmental science since 80s. Restoration ecology, goals of ER, reference eco system,
April 2018 Entire Research, Volume-X, Issue-II 45
ISSN 0975-5020
relevance of history in ER and restoration vs. rehabilitation can be found as the most
important concepts in the context of ER in this research. Measuring ER using traditional
ecological knowledge, localization and validation of traditional ecological knowledge, are the
mainly focused concepts in TEK.
4.1 Relating traditional ecological knowledge to ecological restoration
TEK is defined as a cumulative body of knowledge, practice and belief that evolves by
adaptive processes and handed down through generations by cultural transmission, and
centers on the relationships of humans with one another and with their environment (Berkes,
Colding, and Folke, 2000). Examples of TEK include: impacts of historical land loss on
affected communities, changes in flora and fauna, natural resource use and degradation of
those resources over time, a history of man-made structures and impacts on the ecosystem and
community and the identification of priority areas of community significance or concern. A
substantial body of TEK exists in traditional communities, particularly in the traditional
groups that have historically lived in theirown forests and made their living directly from the
ecosystem services offered by those forests. That source of information is virtually unused in
the restoration planning process. There are evidences that restoration managers and scientists
have started to recognize the value of incorporating TEK into ER.
4.2 Measuring ecological restoration using traditional ecological knowledge
TEK has been found to be an effective and efficient method for the monitoring and
assessment of restoration projects (Monelaet al., 2004). Most traditional monitoring methods
used by indigenous cultures are rapid, low-cost and easily comprehensible (Moller et al.,
2004). Monitoring resource status is a common practice among many indigenous or
traditional people, and it is often accompanied by the monitoring of ecosystem changes
(Berkes, et al. 2000). Local people observe day-to-day changes and are among the first to
notice if resources are no longer readily available (Berkeset al., 2000). Potential value of TEK
for the management of natural resources was identified by several organizations that are in
belief that it might be useful in conservation of education as well as in development planning
and environmental assessment (World Conservation Union, 1986).
Traditional ecological knowledge based monitoring methods are useful in ecosystem
monitoring and timely planning resource allocations and reinforcements, before resource
reaches a critical level. In particular, TEK can provide information about the spatial and
temporal distribution, composition,health, condition and behavior of many species and the
factors that affect them (Stevenson, 2005). It can also provide information about the trajectory
of the restoration, disturbance factors and further interventions, if necessary, at low cost and
with little delay. Monitoring not only enables ecological bodies to determine if the objectives
of the restoration are being met, it also provides information on the capacity of the restored
ecosystem to supply desired goods and services to the local people.
In this research, the concept of measuring ecological restoration using traditional
ecological knowledge will be employed and agricultural TEKmonitoring systems of the
Knuckles region will be examined.
4.3 Localization
When considering TEK, it is important to understand that ecological knowledge may
be localized in specific areas or regions. The validity or the methods may only work relevant
to the area or regions. This concept should be incorporated in this study to investigate TEK
methods relevant to different ecological conditions to derive effective TEK related ER.

April 2018 Entire Research, Volume-X, Issue-II 46
ISSN 0975-5020
4.4 Validation of traditional knowledge
Cultures from all over the world have developed different views on nature throughout
human history. Many of them are rooted in traditional systems of beliefs, which indigenous
people use to understand and interpret their biophysical environment (Iaccarino, 2003). It is
not possible to simply reduce them to practical knowledge that is exclusively based on
experience as opposed to theoretical knowledge, which is developed through deductive or
inductive reasoning.
Western science is deeply rooted both in the philosophy of Ancient Greece and the
Renaissance, and TEK systems have radically developed different strategies to create and
transmit knowledge. Most of the scientists believe that, it is exceedingly difficult to analyze
one form of knowledge using the criteria of another tradition (Mazzocchi,2006).
Scientific method favors analytical and reductive methods as opposed to the more
intuitive and holistic view often found in TEK. Western science is seen as positivist and
materialist in contrast to TEK, which is spiritual and does not make distinctions between
empirical and sacred (Nakashima &Roue, 2002). Furthermore, Western science is objective
and quantitative as opposed to TEK, which is mainly subjective and qualitative. Western
science usually isolates its objects of study from their vital context by putting them in
simplified and controllable experimental environments which also means that scientists
separate themselves from nature, the object of their studies; by contrast, TEK always depends
on its context and particular local conditions (Nakashima & Roué, 2002).TEK systems do not
interpret reality on the basis of a linear conception of cause and effect, but rather as a world
made up of constantly forming multidimensional cycles in which all elements are part of an
entangled and complex web of interactions (Freeman, 1992).
From the above brief comparison, it gives an understanding of how hard it is to
compare the two systems of knowledge that are so profoundly different. Trying to analyze and
validate TEK systems by using scientific criteria carries the risk of distorting such systems in
the process. At the same time, scientists or valuators cannot extract just those parts of TEK
that seem to measure up to scientific criteria and ignore the rest.
TEK seems to be better suited to cope with the uncertainty and unpredictability that
are viewed as intrinsic characteristics of natural systems. Western science and TEK constitute
different paths to knowledge, but they are rooted in the same reality.
This indicates that, though verification and validation of TEK is tedious, the concepts
and ideas of TEK can be useful for the humankind. Traditional ecological knowledge that
comes in many forms such as rituals, folk tales, gossips, etc. can be a good source for gaining
new insights and ideas for real life problems. In this study,TEK can be validated using
traditional methods which have been identified by the people who have been living there for
many years.
5. Application of ecological restoration using traditional knowledge: South Asian
experience
As the third part of this chapter, application of ER using traditional ecological
knowledge is discussed. As mentioned in part two, it is known that TEK can be used in ER
assessment, site selection, identifying key stakeholders of the eco system, etc.
The researches which have been carried out relevant to this study have been described
below. The South Asian region has more similarities with Sri Lanka in both environmental
and cultural aspects and it is believed that it might have some similar characteristics which
may have good resources for the study.

April 2018 Entire Research, Volume-X, Issue-II 47
ISSN 0975-5020
Acording to Ghimieret al. (2008), Himalayan medicinal plants are threatened by over-
harvesting for trade. They have analyzed the effects of harvesting patterns on the population
ecology of two highly endangered Himalayan medicinal plants,
Nardostachysgrandiflora (Valerianaceae)
and Neopicrorhizascrophulariiflora (Scrophulariaceae) in Shey-Phoksundo National Park and
in its buffer zone in North-Western Nepal. They have first recognized local harvesting
approaches of two main user groups: amchi (traditional doctors trained in Tibetan medicine),
who harvest plants in a selective manner for local health care purposes, and commercial
collectors, who harvest at much higher intensity for trade. Grimier et al. have applied the
selective harvesting approach of amchi in an experiment to test the effects of different
harvesting levels on the population ecology of two species. In this sector,Rotation harvesting
method applied by local people was investigated by the scholars. Traditional knowledge about
harvesting and the sustainable usage of the land has been mainly considered by Ghimier et al.
(2008) According to TEK rotation, harvesting provides enough time to restore population in
old harvested sites. Their experiments revealed a positive effect of low harvesting levels on
plant density, but recruitment and survival rates decreased with the increasing harvesting
levels. They also analyzed the effect of high harvesting pressure for trade on the population
ecology of N. grandiflora. Recruitment and survival rates were higher in N.
scrophulariiflora than in N. grandiflora; the latter species is more vulnerable to harvesting
than the former. The difference between them in sustainability of harvest is related to
differences in their strategies of vegetative reproduction and in harvesting practices associated
with these strategies. According to Ghimier et al. (2008), management of Himalayan
medicinal plants can be improved by taking harvesting patterns, plant life forms and growth
patterns into consideration. This research has mentioned that TEK harvesting methods are
more sustainable than the new methods and they have subjected that TEK methods can be
used for ecological restoration in the Himalayan region.
Another research carried out by Ramakrishnan (2007) on Traditional Soil Fertility
Restoration Practices was used to restore soil fertility from erosion or leaching. In this study
Ramakrishnan tried to come up with forest management techniques to restore forest ecology
by combining modern conservation mechanisms with traditional knowledge gathered by
forest inhabitants.
5.1. Traditional knowledge practices in Sri Lanka- Potentials to the sustainable
ecological restoration
TEK had been developed with the civilization of Sri Lanka. When analyzing TEK, it
is important to consider the evolution of local civilization. As started in, Indian and local
literature from the era of king ―Ravana ‖, it is believed that a unique knowledge had been
existed and it had been passed down from one generation to another (Ananda&Nahallage,
2014; ,Knighton, 2013). Along with the ―Mahindagamanaya‖ in 250 BC, this unique
knowledge had been re-engineered and left with many rituals embraced with Buddhist
philosophy. Not only that, due to strategic location of the island in the world such as being in
the silk root, several knowledge channels from western to eastern had been shared among the
natives. Since this mixing of knowledge happened in localized manner, the enhancements of
local TEK took a regional-based differentiation. Coastal area (Amarasingheet al.,1997), dry
land (Ulluwishewa, 1991,1995) and highland area or the hill areas (Daskon&Binns, 2009)
had been identified as the main regions which had their own knowledge systems and
practices.

April 2018 Entire Research, Volume-X, Issue-II 48
ISSN 0975-5020
Among all those TEK systems and practices, agricultural knowledge (Ulluwishewa,
1991,1995, Ananda&Nahallage, 2013), irrigation technologies (Geekiyanage&Pushpakumara,
2013), traditional medication, architectural knowledge and mathematical knowledge were
functioned up to 15th
century. Remaining of ancient tank systems, ancient irrigation systems,
remnants of buildings and other equipment recovered in archaeological sites are proofs for the
vast TEK systems existed in Sri Lanka.
In the present study, the main interest in on TEK or traditional ecological knowledge
relating to agricultural practices. There can be two main types of knowledge or practice types
in agriculture; i) Physical knowledge and ii) Arcane knowledge.Physical knowledge includes
all knowledge based on precipitation, nature of the soil structure, topography and species
diversity.
The physical knowledge is separated as knowledge of pre-irrigation era and
knowledge of post- irrigation era. The pre-irrigation knowledge had been long lost and the
remaining parts are integrated to post-irrigation knowledge with enhancements.
Irrigation technology can be considered as the major turning point in ecological
knowledge in agriculture where it organized knowledge in systematic manner and gave an
opportunity to enhance the knowledge over the iterations. The tank technology, dam building
mechanisms, canal systems and water management are the major knowledge parts. Harvesting
of large areas of dry land with limited amount of water is one of the best examples showing
how productive those traditional water management techniques were
(Geekiyanage&Pushpakumara, 2013).―Bethma‖ method, ―Kekulan‖ method (Upawansa,
1997)―Pangu‖ method,etc. are some other examples for the existence of physical agricultural
TEKinSriLanka (Karunaratne&Herath, 1989, Wills-Johnson, 2004).
Each of these methods has unique way of managing water and land quality. Bethma
method used tank water for paddy fields which led to optimize the usage of seasonal rain
water, where excess water in rainy season was stored and utilized in dry season. This ensures
continuous harvesting as well as eco system protection in dry season. Alternative plantation of
rice and gathering is known as Kekulan method and Karunaratne&Herath (1989) believed that
Kakulan ensured the quality of soil through adding micro nutrients to the soil system.
Traditional agricultural knowledge not only focused on harvesting, but also there are
many evidences for using this knowledge in land use techniques, water management
techniques and bio- diversity maintenance techniques that enhanced the eco system continuity
and possesses (Geekiyanage&Pushpakumara, 2013).
Some scientists believe that Sri Lankan TEKhad a spiritual philosophy (Dharmasena,
2010). The Sri Lankan agri-technology can be described in three extensive processes:bio-
agriculture (physical structure of plantation, maintenance and harvesting), socio-cultural
process and spiritual philosophy (Senaviratne, 2001).
Traditional native farmers maintained sustainability via eco system continuity and
ecological balance. The key concepts of TEK can be identified as working with the eco
system and utilization of agricultural methods/environmental strategies which were parallel
and compelled with existing ecosystem. Traditional people have identified over the
generations, that practicing of eco system friendly strategies and methods prevents
environmental issues such as disasters and hazards (Geekiyanage&Pushpakumara, 2013,
Ulluwishewa, 1991).
According to Senaviratne (2001), Sri Lankan traditional farmers‘ spiritual philosophy
can be explained in three categories: astrology or constellation based spiritual philosophy, god

April 2018 Entire Research, Volume-X, Issue-II 49
ISSN 0975-5020
and spirits based spiritual philosophy and charms, spells, amulet and symbols or emblems
based philosophy.
In TEK, influence to the eco system by astrological objects such as solar systems,
constellation, etc. has been described by astrology. In traditional agricultural practices from
seed plantation to harvesting, almost all the main activities were identified as auspicious
activities and all of them were commenced according to astrology. According to Jayaratne
(1997), native Sri Lankans had enormous unique knowledge on astronomy and it provided the
base and accuracy for the above astrological activities.
The incidents that could notbe explained by general perceptions were explained using
god and spirit concepts. The concepts of ―Gopaludevi‖ (God supreme to cows) and
―Gopaluyaksha‖ (Demon supreme to cows) are examples for those and some of the scientists
believe that those ―hyper-physical‖ activities may have some truth that the modern science
could not explained yet. Traditional folks believed that worshiping gods‘ statues, shrines and
sacrifices or offerings to gods were the basic methods to overcome those hyper-physical
activities or to get favors (Kariyawasam, 1986) from those activities. ‖Muttinemema‖
ceremony is one of the best examples that can be seen even in modern days.
For charms, spells and amulets, ―pirith‖ was used and these kinds of traditional habits
are still functioning in rural areas. In Agricultural activities, amulets and ―kem‖ methods are
used and most of these methods are based on gods or spirits. Amulets are basically worn as a
protection mechanism and for agricultural lands; these amulets are hidden in each corner of
the lands. Sometimes it symbolizes the binding of some sort of spirits to the amulet and for
each of these charms it contains unique regulations for the user and once the regulations are
violated it is believed that the power of the charm or amulet will be weakening (Senaviratne,
2001).
Spells are mainly based on vocal patterns, rhythms and verbal patterns. It is believed
that those rhythms and patterns contain special powers. The wild elephants controlling spells
can be introduced as one of the best examples for these kinds of spells which contain such a
rhythm and pattern.
References
1. Abhayawardhana, H. (2009). LekhamMitiVimarshanaya. 1st ed. Department of National
Archives, Colombo: pp.101-222.
2. Amarasinghe, U. S., Chandrasekara, W. U., &Kithsiri, H. M. P. (1997). Traditional
practices for resource sharing in an artisanal fishery of a Sri Lankan estuary. Asian
Fisheries Science, 9, 311-324.
3. Ananda, T., &Nahallage, C. (2015). Religious Practices Performed by Meemure Villagers
in Kandy District Sri Lanka
4. Ananda, T., &Nahallage, C. (2014).Traditional Agricultural Practices Unique to Meemure
Village, Kandy District Sri Lanka. International Journal of multidisciplinary Studies, 1(1)
5. Antons, C. (Ed.). (2009). Traditional knowledge, traditional cultural expressions, and
intellectual property law in the Asia-Pacific region (Vol. 14).Kluwer Law International.
6. Aronson, J., Falk, D.A., Hobbs, R.J. and Palmer, M.A., society for ecological restoration.
7. Bell, S. S., Fonseca, M. S., &Motten, L. B. (1997).Linking restoration and landscape
ecology. Restoration ecology, 5(4), 318-323.
8. Berkes, F., Colding, J. and Folke, C., 2000.Rediscovery of traditional ecological
knowledge as adaptive management. Ecological applications, 10(5), pp.1251-1262.

April 2018 Entire Research, Volume-X, Issue-II 50
ISSN 0975-5020
9. Cooray, P. G. (1998). Knuckles Massif--a portfolio. Forest Dept., Forestry Information
Service.
10. Daskon, C., &Binns, T. (2009). Culture, tradition and sustainable rural livelihoods:
exploring the culture–development interface in Kandy, Sri Lanka. Community
Development Journal, 45(4), 494-517.
11. Dharmadasa, R. M., Hettiarachchi, P. L., &Premakumara, G. A. S. (2011).Geographical
distribution and conservation of a rare medicinal plant Munroniapinnata (Wall.)
12. Theob.(Meliaceae) in Sri Lanka. Bangladesh Journal of Plant Science
13. Dharmasena, P. B. (2010). Traditional rice farming in Sri Lanka. Economic
Review, 36(1&2), 48-53.
14. Freeman, M. M. (1992). The nature and utility of traditional ecological
knowledge. Northern Perspectives, 20(1), 9-12.
15. Garvais, D. J. (2003).Spiritual But Not Intellectual-The Protection of Sacred Intangible
Traditional Knowledge. Cardozo J. Int'l & Comp. L., 11, 467.
16. Geekiyanage, N., &Pushpakumara, D. K. N. G. (2013). Ecology of ancient tank cascade
systems in island Sri Lanka. Journal of Marine and Island Cultures, 2(2), 93-101.
17. Ghimire, S. K., McKey, D., &Aumeeruddy-Thomas, Y. (2005). Conservation of
Himalayan medicinal plants: Harvesting patterns and ecology of two threatened species,
Nardostachysgrandiflora DC. andNeopicrorhizascrophulariiflora (Pennell)
Hong. Biological Conservation, 124(4), 463-475.
18. Higgs, E.S., 1997. What is good ecological restoration?. Conservation biology, 11(2),
pp.338-348.
19. Higgs, E., Falk, D.A., Guerrini, A., Hall, M., Harris, J., Hobbs, R.J., Jackson, S.T.,
Rhemtulla, J.M. and Throop, W., 2014.The changing role of history in restoration
ecology. Frontiers in Ecology and the Environment, 12(9), p
20. Hobbs, R. J. and Norton, D. A. (1996), Towards a Conceptual Framework for Restoration
Ecology. Restoration Ecology, 4:
21. Hobbs, R. J., & Norton, D. A. (1996).Towards a conceptual framework for restoration
ecology. Restoration ecology, 4(2), 93-110
22. Hobs, R.J. and Harris, J.A., 2001. Restoration Ecology: Repairing the Earths Ecosystem in
the New Millenium. Restoration Ecology, 9(2), pp.239-246.
23. Jayaratne ,C. (1997). Astrological knowledge our ancient people had. Vidurawa, 19(1),
pp.35-41.
24. Jepma, C. J., &Munasinghe, M. (1998). Climate change policy: Facts, issues and
analyses. Cambridge University Press.
25. Jepma, C.J., Munasinghe, M., Bolin, F.B.B., Watson, R. and Bruce, J.P., 1998.Climate
change policy. Climate Change Policy, by Catrinus J. Jepma, Mohan Munasinghe,
Foreword by Bert Bolin, Robert Watson and James P. Bruce, pp. 349. Cambridge
University Press, March 1998. p.349.
26. Kariyawasam, D. (1991). Resource use and settlement in the forests of the Knuckles
Range. The Sri Lanka Forester, 20, 3-13.
27. Kariyawasam, T. (1986).Rituals in Matale. MataleWiththi, 2(1), pp.197-207.
28. Karunaratne, M. A. K. H. S. S., &Herath, H. M. G. (1989). Efficiency of rice production
under major irrigation conditions: a frontier production function approach.
29. Kimmerer, R. W. (2000). Native knowledge for native ecosystems. Journal of
Forestry, 98(8), 4-9.

April 2018 Entire Research, Volume-X, Issue-II 51
ISSN 0975-5020
30. Knighton, W. (2013). The history of Ceylon from the earliest period to the present time:
with an appendix, containing an account of its present condition. Cambridge University
Press.
31. Lindström, S., Mattsson, E., &Nissanka, S. P. (2012). Forest cover change in Sri Lanka:
The role of small scale farmers. Applied Geography, 34, 680-692.
32. May, C., 2006. World Intellectual Property Organization (WIPO): Resurgence and the
Development Agenda. Routledge
33. Mazzocchi, F. (2006).Western science and traditional knowledge. EMBO reports, 7(5),
463-466
34. Meffe, G. KCarroll. Principles of conservation biology.No. 333.9516 M495.Sinauer,
1994.
35. Monela, G.C., Chamshama, S.A.O., Mwaipopo, R. and Gamassa, D.M., 2005. A study on
the social, economic and environmental impacts of forest landscape restoration in
Shinyanga Region, Tanzania. Final Report to the Ministry of Natural Resources and
Tourism and IUCN.
36. Nakashima, D. and Roué, M., 2002.Indigenous knowledge, peoples and sustainable
practice. Encyclopedia of global environmental change, 5, pp.314-324.
37. Ngulube, P., &Onyancha, O. B. (2016).Conceptualizing the Knowledge of Traditional and
Indigenous Communities Using Informetrics Approaches. Handbook of Research on
Theoretical Perspectives on Indigenous Knowledge Systems in Developing Countries,
198.
38. Pedersen, M.L., Andersen, J.M., Nielsen, K. and Linnemann, M., 2007. Restoration of
Skjern River and its valley: Project description and general ecological changes in the
project area. Ecological Engineering, 30(2), pp.131-144.
39. Reyes, T., Luukkanen, O., & Quiroz, R. (2006). Small cardamom—precious for people,
harmful for mountain forests: possibilities for sustainable cultivation in the east
Usambaras, Tanzania. Mountain research and development, 26(2), 131-137.
40. Roué, M. and Nakashima, D., 2002. Knowledge and foresight: the predictive capacity of
traditional knowledge applied to environmental assessment. International Social Science
Journal, 54(173), pp.337-347.
41. Schultes, R. E., & Reis, S. V. (1995). Ethnobotany: evolution of a discipline. Chapman
and Hall Ltd.
42. Seneviratne, D. (2001). SampradayikaWarshaPoshithaGovithena. Vidurawa, 24(1), pp.34-
52.
43. Sharma, U. K., &Pegu, S. (2011). Ethnobotany of religious and supernatural beliefs of the
Mising tribes of Assam with special reference to the'DoburUie'. Journal of ethnobiology
and ethnomedicine, 7(1), 16.
44. Siriweera, W. I. (2002). History of Sri Lanka: from earliest times up to the sixteenth
century. DayavamsaJayakodiSahaSamagama.
45. Somasundara, D.2006 Preservation, Protection and Management of Traditional
knowledge of Indigenous and Local Communities in Sri Lanka.
46. Southern, A. (1994). Acquisition of Indigenous Ecological Knowledge about Forest
Gardens in Kandy District, Sri Lanka..M.phil. University of Wales.
47. Stevenson, M.G., 2005. Traditional knowledge and sustainable forest management.

April 2018 Entire Research, Volume-X, Issue-II 52
ISSN 0975-5020
48. Ulluwishewa, R. (1991). Modernization versus sustainability: disintegrating village agro-
ecocomplexes in the Dry Zone of Sri Lanka. Environmental Conservation, 18(2), 103-
109.
49. Ulluwishewa, R. (1991). Soil fertility management of paddy fields by traditional farmers
in the dry zone of Sri Lanka. Journal of Sustainable Agriculture, 1(3), 95-106.
50. Ulluwishewa, R. (1995). Traditional practices of inland fishery resources Management in
the Dry Zone of Sri Lanka: implications for sustainability. Environmental
conservation, 22(2), 127-132.
51. UNESCO (2006) Traditional Knowledge
http://www.unesco.org/bpi/pdf/memobpi48_tradknowledge_en.pdf (last retrieved: 3 Feb
2017)
52. Upaswansa, G. K. (1989). Ancient methods for modern dilemmas. Ileia Newsletter, 3, 9-
11.
53. Upawansa, G. K. (1997). New Kekulam rice cultivation: a practical and scientific
ecological approach. Rebuilding lost soil fertility, 13(3), 20-21.
54. Uprety, Y., Asselin, H., Dhakal, A., &Julien, N. (2012). Traditional use of medicinal
plants in the boreal forest of Canada: review and perspectives. Journal of ethno biology
and ethno medicine, 8(1), 7.
55. Warren, D.M., Showers, K.B., Serrano, R.C., Semali, L., Köhler-Rollefson, I.U., van
Hooft, K., Hess, C.G., Haverkort, B., Dialla, B.E. and Brokensha, D.W., 1995. Comments
on article by ArunAgrawal. Indigenous Knowledge and Development Monitor, 4(1),
p.p12.
56. Wills-Johnson, N., Kenyon, P., &Pollett, C. (2004). Sustainable Water Management
Practices: Lessons from Ancient Sri Lanka.
57. Wimalaratne, W.A(1986). Rituals in Matale. MataleWiththi, 2(1), pp.19-23
58. Wolters, M., Bakker, J.P., Bertness, M.D., Jefferies, R.L. and Möller, I., 2005. Saltmarsh
erosion and restoration in south‐east England: squeezing the evidence requires
realignment. Journal of Applied Ecology, 42(5), pp.844-851.
* * *

April 2018 Entire Research, Volume-X, Issue-II 53
ISSN 0975-5020
The Future of Organic Electronics: Small Molecules and
Conducting Polymers
Sonali Kokane: Chemistry Department, S. P. Dnyanasadhana college.
Organic semiconductors represent new class of active materials for electronic
applications. This paper traces the history of organic semiconductors including conducting
plastics. The fact that organics popularly called plastics, could carry current started gaining
currency in 1950s. Several small molecules namely polycyclic aromatic compounds under
suitable doping conditions exhibited conductivity upto 1S/cm. Although conductivity was
reported in polyaniline in 1862, concrete report of conductivity in doped polymer –
polyacetylene – emerged from Shirakawa‘s Lab in 1977. The 2000 Nobel for this discovery
went to Shirakawa, Heeger and MacDiarmid and was really a culmination of long-
standing recognition that was due to these materials. With the discovery of
electroluminescence in polymers by Robert Partridge, the devices with polymers were on the
horizon. In 1987, the first organic diode was produced at Eastman Kodak by Twang and
Slyke, setting the stage for the present day design of Light emitting diodes based on organic
materials, abbreviated as OLEDs. Today, after 65 years of Silicon-based electronics, organic
materials have become viable candidates for applications such as OLEDs in flat panel
displays, solar cells, organic lasers, rechargeable batteries and host of other applications in
electronics.
Key Words: Organic, polymers, Light Emitting Diode
Introduction
In 1862, Henry Letheby synthesized a dark green coloured powder by anodic
oxidation of aniline in sulphuric acid1. It was called aniline black. Letheby noted that the
powder was mildly conducting. Between 1907 and 1911, Richard Willstater (Nobel Laureate,
1915) characterized oxidation products of Aniline and noted that it is electrochromic. The
oxidized form is blue while the reduced form is colourless. This electrochromic behavior
under aqueous conditions is important for technological importance.
Small molecules (polycyclic aromatic compounds) and Charge-transfer
complexes.
But the fact that organics popularly called Plastics, could carry current started gaining
currency in 1950s. Researchers at Bell Labs found that polycyclic compounds such as
Perylene, Anthracene and Rubrene under suitable doping conditions exhibited conductivity as
high as 1 S cm-12,3
. The dopants used were halogens. A prominent example of this is the
Perylene-Iodine complex. Such complexes were called the charge-transfer complexes where
the organic molecule is electron-donor while the halogen is electron acceptor.These charge-
transfer complexes are not purely organic. The first purely organic charge-transfer complex
was discovered in 1973 and was called TTF-TCNQ( TTF= tetrathiafulvalene,
TCNQ=tetracyanoquinodimethane)4. Its electrical conductivity was almost metal-like. TTF-
TCNQ initiated a generation of purely organic semiconductors. Superconductivity in purely
organic molecule was first discovered in these complexes5. The complex Tetramethyl-
tetraselenafulvalene-phosphorus hexafluoride (TMTSF2PF6), a semi-conductor at ambient
conditions, shows superconductivity at 0.9 K and 12 K bar. Unfortunately, critical current

April 2018 Entire Research, Volume-X, Issue-II 54
ISSN 0975-5020
densities in these complexes are very small. Alq3 (tris-quinolatoaluminium) is another
prominent example of organic semiconductor. It is used as efficient electron-transporting
layer and also emits in the green6.
Conducting Polymers
An important class in Organic semiconductors is conducting polymers. Polyaniline
belongs to this category. Today polyaniline in form of various composites with various
materials such as graphene, nanoTiO2, CNTs is used in supercapacitors. In 1963, another
conducting polymer Polypyrrole with very low resistivities was reported by Australians B.A.
Bolto, D.E. Weiss and coworkers7. Despite these reports, the polymer that actually launched
this field of research was Polyacetylene. This polymer was synthesized way back in 1966 by
K. Ziegler and G. Natta by polymerizing acetylene using Ziegler-Natta catalyst. A major
breakthrough came in 1977 when Shirakawa, MacDiarmid and Heeger synthesized Iodine-
doped polyacetylene that exhibited a conductivity of 103 S m-1- a conductivity comparable to
that of metals8.The seminal paper received for publication on May16, 1977, had the title:
Synthesis of electrically conducting organic polymers: Halogen derivatives of polyacetylene
(CH)x. They were awarded the 2000 Chemistry Nobel for this discovery – for demonstrating
that organic material can show conductivity comparable to that of metals. Since then science
of conductive polymers has rapidly advanced in various directions. Other polymers studied
extensively since 1980s include Polypyrrole, Polyphenylenevinylene and Polyaniline.
Polyacetylene may have opened up the field of ―Plastic Electronics‖ but it has not found any
practical applications mainly because it is susceptible to oxidation and sensitive to humidity.
Electroluminesence: Organic Light Emitting Diodes. In early 1950s Andre Bernanose at Nancy Universite, France was first to discover EL
in organic molecule-acridine orange9. In 1960 Pope and coworkers studied direct current
Electroluminesence (EL) in pure single crystal of anthracene although photoconductivity in
anthracene was reported as early as 190610
. Through the 1950s and 1960s considerable
amount of research was devoted to understanding the charge transport properties in these
small molecules organic semiconductors.EL from polymer films was first observed by Roger
Patridge at National Physical Laboratory at UK11
. The device consisted of poly (n-
vinylcarbazole). The result was patented in 1975 and published in 1983. In 1987, the first
organic diode device was produced at Eastman Kodak by Twang and Slyke, setting the stage
for present day design of Light Emitting diodes based on organic materials, abbreviated as
OLEDs. In 1990, Burroughs et al at the Cavendish Laboratory reported high efficiency green
light –emitting polymer based devise using PPV12
.
Applications The commercial applications of conducting polymers is given below:
Doped polyaniline is used as a conductor and for electromagnetic shielding of
electronic circuits. Polyaniline is also manufactured as a corrosion inhibitor.
Poly(ethylenedioxythiophene) (PEDOT) doped with polystyrenesulfonic acid is
manufactured as an antistatic coating material to prevent electrical discharge exposure on
photographic emulsions and also serves as a hole injecting electrode material in polymer
light-emitting devices.
Poly(phenylenevinylidene) derivatives have been major candidates for the active layer
in pilot production of electroluminescent displays (mobile telephone displays).
Poly(dialkylfluorene) derivatives are used as the emissive layer in full-colour video
matrix displays.

April 2018 Entire Research, Volume-X, Issue-II 55
ISSN 0975-5020
Poly(thiophene) derivatives are promising for field-effect transistors: They may
possibly find a use in supermarket checkouts.
Poly(pyrrole) has been tested as microwave-absorbing ―stealth‖ (radar-invisible)
screen coatings and also as the active thin layer of various sensing devices.
Other possible applications of conductive polymers include supercapacitors and
electrolytic-type capacitors. Their electrochromic properties of polyaniline can be used to
produce, e.g. ―smart
windows‖ that absorb sunlight in summer. An advantage over liquid crystals is that
polymers can be fabricated in large sheets and unlimited visual angles.
Why Organics?
Conductive polymers are lighter, more flexible, and less expensive than inorganic
conductors. They can be synthesized at temperatures much lower than what are required for
Silicon processin. The availability of raw materials is practically unlimited. Organic
semiconductors can be mass-produced at a low cost. It is even possible to produce coatings
with ink-jet printers using electronic ink or with classic printing methods. It is possible to
print transistors, LEDs, solar cells, sensors, batteries and displays. Another option is to
integrate barely visible electronic circuits into fabrics and wallpapers.
Since very thin layers (below 1µm) of material only are needed, the electrical
components are inherently flexible and bendable, just like a plastic foil. Additionally, organic
materials are soft rather than porous, which means that they can be bent without breaking.
This advantage can be utilized when e.g. printing an organic solar cell onto a plastic foil so
that it can be rolled up as needed. This is particularly advantageous in production and
processing of such components, e.g. they can be transported on rolls rather than large, easily
breakable glass surfaces and installed on curved surfaces.
While the advantages are numerous, the disadvantages are few but seriously limit their
use in practical applications. In general organic materials have a higher resistance and low
carrier mobility and therefore conduct electricity poorly and inefficiently, as compared to
inorganic conductors. There is also too little detailed evidence on long-term durability –
raising questions on its electronic and optical stability.
Conclusion
Understanding History of scientific concepts and devices can actually help put things
in their proper perspective. History also reveals interesting facts: Einstein predicted laser
almost 50 years before it was discovered. The phenomenon of Superconductivity and
discovery of X-rays was a matter of serendipity. Marie Curie‘s work on radioactivity was an
example of how the human qualities of patience, hardwork and ingenuity were pushed to the
limits. Maxwell‘s equations of electromagnetic radiation were the greatest discovery of 19th
century. They already conformed to relativity which was put forward by Einstein a few years
later. Michael Faradays‘discovery that magnetism can make electricity and vice versa opened
up a world of transformers and generators. Faraday was the first scientist to prepare a
nanosolution of gold and introduce us to the realm of nanochemistry.
Conductivity in organic materials was demonstrated several times before
polyacetylene was synthesized in Shirakawa‘s lab. But the fact that polyacetylene can show
conductivity on par with metals was path-breaking. The previous paragraphs show some of
the applications of these polymers. Some of the serious challenges faced by the organic
materials are discussed. If and when these challenges are met, low-cost alternatives to silicon-
electronics will be the mainstay of our technological existence.

April 2018 Entire Research, Volume-X, Issue-II 56
ISSN 0975-5020
References
1. Inzelt,György (2008). "Chapter 8: Historical Background (Or: There Is Nothing New
Under the Sun)". In Scholz, F. Conducting Polymers: A New Era in Electrochemistry.
Monographs in Electrochemistry.Springer. pp. 265–267. ISBN 978-3-540-75929-4.
2. Naarmann, Herbert (2000). "Polymers, Electrically Conducting".Ullmann's Encyclopedia
of Industrial Chemistry..ISBN 3527306730.
3. H. Akamatsu, H. Inokuchi, and Y.Matsunaga (1954)."Electrical Conductivity of the
Perylene–Bromine Complex".Nature173 (4395): 168
4. Ferraris, JohnS.; Cowan, D. O.; Walatka, V.; Perlstein, J. H. (1973). "Electron transfer in
a new highly conducting donor-acceptor complex". Journal of the American Chemical
Society95 (3): 948–949.
5. Little, W. A. (1964). "Possibility of Synthesizing an Organic Superconductor".Physical
Review134 (6A): A1416
6. Silva, V.M. and Pereira, L. (2006) The nature of the electricalconduction and light
emitting efficiency in organicsemiconductors layers: The case of [m-MTDATA] –[NPB]
– Alq3 OLED. Journal of Non-Crystalline Solids,352(50-51), 5429-5436.
7. B.A. Bolto, R. McNeill and D.E. Weiss "Electronic Conduction in Polymers.III.
Electronic Properties of Polypyrrole" Australian Journal of Chemistry 16(6) 1090, 1963.
8. Shirakawa, Hideki; Louis, Edwin J.; MacDiarmid, Alan G.; Chiang, Chwan K.; Heeger,
Alan J. (1977). "Synthesis of electrically conducting organic polymers: Halogen
derivatives of polyacetylene, (CH) x".Journal of the Chemical Society, Chemical
Communications (16): 578.
9. Bernanose, A. and Vouaux, P. (1953). J. Chim. Phys.50: 261.
10. Kallmann, H.; Pope, M. (1960). "Bulk Conductivity in Organic Crystals".Nature186
(4718): 31.
11. Partridge, R (1983). "Electroluminescence from polyvinylcarbazole films: 4.
Electroluminescence using higher work function cathodes". Polymer24 (6): 755.
12. Burroughes, J. H.; Bradley, D. D. C.; Brown, A. R.; Marks, R. N.; MacKay, K.; Friend,
R. H.; Burns, P. L.; Holmes, A. B. (1990). "Light-emitting diodes based on conjugated
polymers". Nature347 (6293): 539.
* * *
April 2018 Entire Research, Volume-X, Issue-II 57
ISSN 0975-5020
A Study of Problems Faced by Customers While Using ATMs and
Internet Banking Products in Public Sector V/S Private Sector
Banks in Thane Region
Vrushali Ravindra Alve: Student, TY-Accounting and Finance, Satish Pradhan
Dnyanasadhana College, Thane-400601
Shreya Mohan Pandit: Student, FY- Accounting and Finance, Satish Pradhan
Dnyanasadhana College, Thane-400601
Sanchit Sanjay Agarwal: Student, FY- Accounting and Finance, Satish Pradhan
Dnyanasadhana College, Thane-400601
Dr. Shraddha M. Bhome: Asst. Professor and Co-ordinator, BAF, Satish Pradhan
Dnyansadhana College, Thane
Abstract:
Internet banking is regarded as a delivery channel, which over a period of time has
gained recognition. It in fact has experienced growth in many countries and has changed the
traditional way of banking. This channel has provided competitive advantage to the banks.
With the help of internet banking the consumer has an access to number of services just at the
click of a mouse.In Today‘s scenario, role of internet banking is very valuable. Without
internet banking no banks can work. In this we analysis, how much internet banking is used in
Public and Private sectors bank. Objective of the study is to find the customer satisfaction in
respect of internet banking in Public and Private sectors banks. The method of the study is
Primary and Secondary both.ATM is the most acknowledged than any other e-channels. The
Indian ATM industry has seen explosive growth in recent times. The present study has made
an attempt to find out the perception of customers regarding various issues related to
ATM/Debit cards. The study concludes that ATM is very convenient mode of electronic
banking.
Keywords: Internet Banking, ATM‘s, Public Sector Banks, Private Sector Banks.
1. Introduction-
The banking industry is expected to be a leading player in e-business. While the
banks in developed countries are working primarily via internet as non-branch banks, banks in
the developing countries use the Internet as an information delivery tool to improve
relationship with customers. Banks have traditionally been in the forefront for utilizing
technology to improve their services and efficiency. They have, over a longer period of time,
been using electronic and telecommunication networks for delivering a wide range of value
added products and services. The delivery channels of banks include direct dial – up
connections, private and public networks etc. and the devices include telephone, personal
computers including ATMs etc.
In a nut shell, Electronic banking (E-banking) is a generic term encompassing internet
banking, mobile banking etc. In other words, it is a process of delivery of banking services
and products through electronic channels such as telephone, internet, cell phone etc. The
concept and scope of e-banking is still evolving.
The Indian E-Banking Scenario: In 2001, the Reserve Bank of India survey revealed that of 46 major banks operating

April 2018 Entire Research, Volume-X, Issue-II 58
ISSN 0975-5020
in India, around 50% were either offering e-banking services at various levels or planned to in the near future.According to a research report, while in 2001, India‘s Internet user base was an estimated 9 lakh; it was expected to reach 90 lakh by 2003. Also while only 1 percent of these Internet users utilized the e-banking services in 1998, the e-banking user base increased to 16.7 percent by mid – 2000. 2. Objectives- 1) To study the e-banking services provided by the public and private banks. 2) To identify the problems faced by customers in accessing e-banking services w.r.t. ATMs and Internet banking. 3. Hypothesis-
H0: There is no significant difference between the average scores for each of the problems related to internet banking, ATMs with respect to type of bank as private and public.
H1: There is significant difference between the average scores for each of the problems related to internet banking, ATMs with respect to type of bank as private and public. 4. Review of literature- A. Mittal R. K. and Dhingra Sanjay(2006-07), in their article ―Technology in Banking
Sector: Issues and Challenges‖, discussed the issue that the transaction through technology channels cost much less to the banks than the customers reaching the bank and doing the transactions. In the last decade banks have invested heavily in the technology. In the use of information technology, the new private and foreign sector banks have taken lead over the public and old private sector banks. Today public sector banks are also investing heavily in technology to compete with the new private and foreign sector banks. In the study authors have identified the different technology issues and challenges such as choice of right channel, justification of IT investment in terms of ROI (Rate of Interest), e-governance, customer relationship management, security concerns, penetration of IT in rural areas etc. Banks are required to address these issues and challenges effectively to stay in business and grow.
B. Agarwal R., Rastogi S., Mehrotra A., (2009), in their article ―Customers perspectives regarding e-banking in an emerging economy‖ determined factors affecting customer perception and attitude towards and satisfactionwith e-banking is an essential part of a bank's strategy formulation process in anemerging economy like India. To gain this understanding in respect of Indian customers,the study was conducted on respondents taken from the northern part of India. The majorfindings depict that customers are influenced in their usage of e-banking services by thekind of account they hold, their age and profession, attach highest degree of usefulness tobalance enquiry service among e-banking services, consider security & trust mostimportant in affecting their satisfaction level and find slow transaction speed the mostfrequently faced problem while using e-banking.
C. Sudhakar A. M., Suryanarayana, (2011),in their article ―Emerging mobile banking scenario and its adoption in India: a study‖, explained that with broadband communication technological developments and mobile phonespenetration(481 million by June 2009) into common man's life have triggered majorthrust in the Banking service sector of India. With Mobile Banking- a revolutionaryapproach to banking transactions has created a strong connectivity between customersand the banks as both will transact with minimum cost and in minimum time. It is atimely and its cost effective services can deliver mobile money to non-banked poorpeople and will induce economic growth of the country. This article discusses the statusof Mobile Banking in India and other countries with emphasis on data security andstandards and its implication on banking sector.

April 2018 Entire Research, Volume-X, Issue-II 59
ISSN 0975-5020
D. Rimpi Kaur (2013),in her article ―The impact of electronic banking on banking transactions: A cost-benefit‖ explained that banks are shifting focus from paper-based to electronic transactions. This paper analyses the computerization, expenditure on electronic banking and cost-benefit analysis of paper-based and electronic transactions. There is a swing from paper-based transactions to electronic transactions, with electronic transactions escalating drastically and earning business value at a triple rate. Per transaction value is 168 times per transaction cost which shows sound returns. The paper evaluates the effect of transactions on cost and value through correlation-coefficient and concludes that electronic banking has significant impact on the cost and value of each transaction.
5. Research Methodology- In order to understand the problems faced by the customers while using ATMs and Internet banking services, the researcher has used Thane region. Researcher has studied 3 public sector banks and 3 private sector banks for the study. The researcher has chosen State bank of India, Bank of India and Bank of Baroda in public sector for the present study. ICICI bank. Axis Bank and HDFC bank are chosen by the researcher in a group of private sector banks. The sample taken by the researcher is 556 customer respondents. The data is collected through convenience sampling method with the help of pre-structured and pre-coded questionnaire method of data collection.
6. Analysis and Interpretation of Data-
TABLE 1: PROBLEMS RELATED TO ATM
MEAN RANK TABLE
BANK N Mean Rank Sum of Ranks
PTUA1 Nationalised Bank 273 271.87 74220.00
Private Bank 283 284.90 80626.00
Total 556
PTUA2 Nationalised Bank 273 283.74 77460.00
Private Bank 283 273.45 77386.00
Total 556
PTUA3 Nationalised Bank 273 281.48 76844.50
Private Bank 283 275.62 78001.50
Total 556
PTUA4 Nationalised Bank 273 281.18 76763.50
Private Bank 283 275.91 78082.50
Total 556
PTUA5 Nationalised Bank 273 279.92 76419.50
Private Bank 283 277.13 78426.50
Total 556
PTUA6 Nationalised Bank 273 274.14 74839.50
Private Bank 283 282.71 80006.50
Total 556
Source: By Researcher
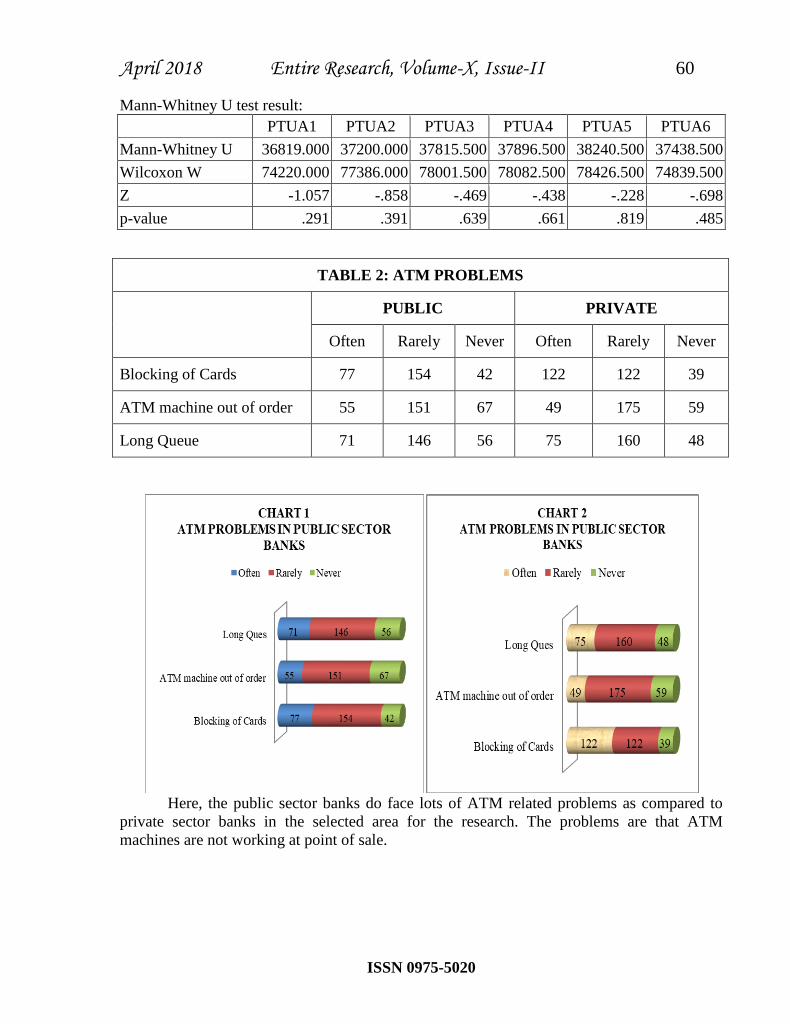
April 2018 Entire Research, Volume-X, Issue-II 60
ISSN 0975-5020
Mann-Whitney U test result:
PTUA1 PTUA2 PTUA3 PTUA4 PTUA5 PTUA6
Mann-Whitney U 36819.000 37200.000 37815.500 37896.500 38240.500 37438.500
Wilcoxon W 74220.000 77386.000 78001.500 78082.500 78426.500 74839.500
Z -1.057 -.858 -.469 -.438 -.228 -.698
p-value .291 .391 .639 .661 .819 .485
TABLE 2: ATM PROBLEMS
PUBLIC PRIVATE
Often Rarely Never Often Rarely Never
Blocking of Cards 77 154 42 122 122 39
ATM machine out of order 55 151 67 49 175 59
Long Queue 71 146 56 75 160 48
Here, the public sector banks do face lots of ATM related problems as compared to
private sector banks in the selected area for the research. The problems are that ATM
machines are not working at point of sale.

April 2018 Entire Research, Volume-X, Issue-II 61
ISSN 0975-5020
TABLE 3: INTERNET BANKING PROBLEMS
MEAN RANK TABLE
BANK N Mean Rank Sum of Ranks
PTUB1 Nationalised Bank 273 267.85 73123.00
Private Bank 283 288.77 81723.00
Total 556
PTUB2 Nationalised Bank 273 290.11 79200.00
Private Bank 283 267.30 75646.00
Total 556
PTUB3 Nationalised Bank 273 280.58 76598.00
Private Bank 283 276.49 78248.00
Total 556
PTUB4 Nationalised Bank 273 285.55 77955.50
Private Bank 283 271.70 76890.50
Total 556
PTUB5 Nationalised Bank 273 279.08 76189.00
Private Bank 283 277.94 78657.00
Total 556
PTUB6 Nationalised Bank 273 296.61 80974.50
Private Bank 283 261.03 73871.50
Total 556
PTUB7 Nationalised Bank 273 285.40 77915.00
Private Bank 283 271.84 76931.00
Total 556
Source: By Researcher
Mann-Whitney U test result:
PTUB1 PTUB2 PTUB3 PTUB4 PTUB5 PTUB6 PTUB7
Mann-Whitney
U 35722.000 35460.000 38062.000 36704.500 38471.000 33685.500 36745.000
Wilcoxon W 73123.000 75646.000 78248.000 76890.500 78657.000 73871.500 76931.000
Z -1.779 -1.878 -.337 -1.142 -.093 -2.939 -1.079
p-value .075 .060 .736 .254 .926 .003 .281

April 2018 Entire Research, Volume-X, Issue-II 62
ISSN 0975-5020
TABLE 4: INTERNET PROBLEMS
PUBLIC PRIVATE
Often Rarely Never Often Rarely Never
54 156 63 59 161 63
54 145 74 44 172 67
104 122 47 109 125 49
51 147 65 57 174 56
Respondent finds more problems with private sector banks than that of public
sector banks for this particular problem.
7. Findings and conclusion-
Here, the public sector banks do face lots of ATM related problems as compared to
private sector banks in the selected area for the research.
The problems are that ATM machines are not working at point of sale. There is also
less availability of POS terminals.
In case of internet banking transactions private sector bank customers face lots of
problems like security aspects while handling transactions, no fast response as public
sector banks do give.
Also people do face problem of too many steps in processing of transactions while
handling internet banking services.
The proportion of facing internet problems due to insufficient information provided by
banks is more in SBI. The ICICI keep on updating and providing information to the
customers which helps them to solve internet problems.
It has been found that even after taking care of internet problems by all banks they
fails to maintain the security of internet banking.
April 2018 Entire Research, Volume-X, Issue-II 63
ISSN 0975-5020
As per customer survey in BOI& ICICI the proportion of not being able to maintain
security is more as compared to others.
8. Suggestions-
Banks should reduce the formalities while operating internet banking transactions.
Banking activities must be inculcated right from school studies. The basic knowledge
of e-banking transactions should be given to the student so that they can go well with
this modern banking.
In an e-banking, especially net banking, Banks are not offering online income tax
returns system. Banks must start or include this facility to get more and more database.
Customer should take at most care that they should not disclose their personal details
over phone or by e-mail as banks never asks for this.
9. Scope for further research-
Here, the researcher will try to find out what effective measures have been
taken by the public sectors and private sectors in order to solve the problems and
satisfy the customers.
10. References-
1. E-banking Global Perspectives, Edited by Vivek Gupta, Published by ICFAI PRESS,
Year 2002, ISBN 81-7881-064-6 Pg. 5
2. India Research, Kotak Securities, May 2000.
3. Mittal R. K. and Dhingra Sanjay, ―Technology in Banking Sector: Issues and
Challenges‖, Vinimay, Vol.XXVII, No.4, 2006-07.
4. Agarwal R., Rastogi S., Mehrotra A., (2009), ―Customers‟ perspectives regarding e-
banking in an emerging economy‖, Journal of Retailing and Consumer Services, Vol.
16 (5), pp. 340 - 351.
5. Sudhakar A. M., Suryanarayana, (2011), ―Emerging mobile banking scenario and its
adoption in India: a study‖, SRELS Journal of Information Management, Vol. 48 (1),
pp. 41 - 50.
6. Poonam Sawant, RV Kulkarni, SD Mundhe, (2013), ―Customer satisfaction with e-
banking: A comparative study of public & private sector banks‖, The IUP Journal of
Bank Management, Vol.XII No.4, pp. 29-44.
7. Rimpi Kaur, 2013, ―The impact of electronic banking on banking transactions: A cost-
benefit‖, The IUP Journal of Bank Management, Vol. XII No. 2, p.p.62-71.
8. Ashima Tandon, Manisha Goel and Sunita Bishnoi (2016), ―Consumer Awareness
towards Internet Banking: A Comparative Study of Public, Private and Foreign
Banks‖, International Journal of Hybrid Information Technology.
9. Prof. (Dr.) Dinesh C. Agrawal & Sakshi Chauhan (2017), ―A Comparative Study of E-
Banking in Public and Private Sectors Banks (with special reference to SBI and HDFC
bank in haridwar)‖, Motherhood International Journal of Multidisciplinary Research &
Development.
10. Sunita Bishnoi (2013), ―AN EMPIRICAL STUDY OF CUSTOMERS' PERCEPTION
REGARDING AUTOMATED TELLER MACHINE IN DELHI AND NCR‖ Integral
Review- A Journal of Management.
* * *

April 2018 Entire Research, Volume-X, Issue-II 64
ISSN 0975-5020
A Study of Green Banking as Innovative Ethical Banking WRT
State Bank of India
Anita Nallamuthu Konar: Student, TY.Accounting and Finance, Satish Pradhan
Dnyanasadhana College, Thane- 400604
Pooja Jagannath Kharat: Student, FY.Accounting and Finance, Satish Pradhan
Dnyanasadhana College, Thane- 400604
Jyoti Vithoba Dhavan: Student, SY.Accounting and Finance, Satish Pradhan
Dnyanasadhana College, Thane- 400604
Dr. Shraddha Mayuresh Bhome, Asst. Professor and Co-ordinator, BAF, Satish Pradhan
Dnyanasadhana College, Thane
Abstract:
Change is the need of hour to for survival in all spheres .The world has seen much
focus on economic progress and mankind has made giant steps in its journey through time.
The side effects of the development process have, however, also been equally enormous loss
of biodiversity, climatic change, environmental damage, etc. Bank is also not the exception
for this. This paper tries to find out the ways to Go Green through ‗Green Banking‘.
Generally, the banks are using 1. Online banking instead of branch banking. 2. Paying bills
online instead of mailing them. 3. Opening up accounts at online banks, instead of large
multi-branch banks 4. Finding the local bank in your area that is taking the biggest steps to
support local green initiatives. The researcher will collect the data on green banking through
interview and questionnaire w.r.t. State Bank of India.
Key Words: CEO, Green Banking, Green House Effect Online - Banking, RBI, Global
Warming.
Introduction:
Environmentalism is a broad philosophy and social movement regarding concerns for
environmental conservation and improvement of the state of the environment.
Environmentalism and environmental concerns are often represented by the color ‗green‘.
Global warming, also called as ―Green House Effect‖ is a global issue that calls for a global
response. The warming effect of certain man-made gas emission such as carbon-dioxide,
methane, nitrous oxide and hydro-fluro carbon is found responsible for distortion in climate
changes. The rapid change in climate will probably be too great to allow many eco systems to
suitably adapt, since the changes have direct impact on bio diversity, agriculture, forestry, dry
land, water resources and human health. However, there is general lack of adequate awareness
on the above issues and hence there is urgent need to promote certain urgent measures for
sustainable development and corporate social responsibility.
―The supreme reality of our time is… the vulnerability of our Planet.‖
- John F. Kennedy
To avoid falling into similar trap, the impulse of ‗going green‘ is running faster than
blood in Indian Incorporations veins. From IT giants to luxurious hotels, from Automobiles to
Aviations, from Mutual Funds to Banks corporate India is moving fanatically ahead with
green initiatives.

April 2018 Entire Research, Volume-X, Issue-II 65
ISSN 0975-5020
As a responsible financial organization of the country with its crucial role in financing
the economic and developmental activities of the country, banks have to play in addressing
the above issues, both in terms of its obligations and opportunities by virtue as a responsible
corporate citizen and as a financier.
Definition: Green Banking is like a normal bank, which considers all the social and environmental
factors; it is also called as an ethical bank. Ethical banks have started with the aim of
protecting the environment. These banks are like a normal bank which aims to protect the
environment and it is controlled by same authorities as what a traditional bank do. Green
banking is like a normal bank, which considers all the social and environmental/ecological
factors with an aim to protect the environment and conserve natural resources. It is also called
as an ethical bank or a sustainable bank. They are controlled by the same authorities but with
an additional agenda toward taking care of the Earth's environment/habitats/resources. For
banking professionals green banking involves the tenets of sustainability, ethical lending,
conservation and energy efficiency.
There are many differences compared with normal banking, Green Banks give more
weight to environmental factors, their aim is to provide good environmental and social
business practice, they check all the factors before lending a loan, whether the project is
environmental friendly and has any implications in the future, you will awarded a loan only
when you follow all the environmental safety standards.
Defining green banking is relatively easy. Green Banking means promoting
environmental – friendly practices and reducing your carbon footprint from your banking
activities. This comes in many forms
1. Using online banking instead of branch banking.
2. Paying bills online instead of mailing them.
3. Opening up accounts at online banks, instead of large multi-branch banks
4. Finding the local bank in your area that is taking the biggest steps to support local green
initiatives.
Green banking can benefit the environment either by reducing the carbon footprint of
consumers or banks. Either a bank or a consumer can conserve paper and benefit the
environment. Ideally, a green banking initiative will involve both. Online banking is an
example of this. When a bank‘s customer goes online, the environmental benefits work both
ways. Green banking means combining operational improvements and technology, and
changing client habits.
Objectives of the Study: 1) To study concept of ‗Green Bank‘
2) To identify the steps necessary to adopt Green Banking
3) To check the awareness of green banking among bank employees, associates and general
public.
4) To create awareness about green banking among the general public and consumers and
bank employees.
5) To reduce CO2 emissions from electricity consumption and transportation, increase
recycling (paper, toners, cartridges and batteries), increase the use of green products by
bank branches.

April 2018 Entire Research, Volume-X, Issue-II 66
ISSN 0975-5020
Research Methodology:
The research methodology used in this study is based on primary as well as secondary
data. The primary data was collected from the study conducted through telephonic
interactions and personal interviews. The study examines major aspects concerned with the
Green Banking. Specially structured questionnaires and interviews with employees, of well
established banks and general public have been used for survey purpose.
RESEARCH UNIVERSE : STATE BANK OF INDIA (THANE BRANCHES)
SAMPLE SIZE: 12 BANK MANAGERS AND 50 BANK EMPLOYEES.
SAMPLING METHOD : CONVENIENCE SAMPLING
METHOD OF SAMPLE COLLECTION: INTERVIEW
Steps in Green Banking: From the empirical study, it is found that following are some of the steps that can be
taken for going green in banking:
1. Go Online:- Online banking is the developing concept in young and corporate India.
Online banking helps in additional conservation of energy and natural resources. Online
Banking includes: a. Paying bills online, b. Remote deposit, c. Online fund transfers and
d. Online statements. It creates savings from less paper, less energy, and less expenditure
of natural resources from banking activities. Customers can save money be avoiding late
payments of fees and save time by avoiding standing to queues and paying the bill from
home online.
2. Use Green Checking Accounts:- Customers can check their accounts on ATM or
special touch screens in the banks. This can be called as green checking of account.
Using a green checking account helps the environment by utilizing more online banking
services including online bill payment, debit cards, and online statements. Banks should
promote green checking by giving some incentives to customers by giving higher rate of
interests, waiver or discount in fees etc.
3. Use Green Loans for Home Improvements:- The Ministry of Non-renewable Resource
in association with some nationalized and scheduled banks undertook an initiative to go
green by paying low interest loans to the customers who would like to buy solar
equipments. The rate of interest is as low as 4% p.a. Before you undertake a major home
improvement project, study if the project can be done in an eco-friendly manner and if
you might qualify for a green loan from a bank Green loan are perfect for energy-saving
project around the house.
The new Green Home Loan Scheme from SBI, for instance, will support environmentally
friendly residential projects and offer various concessions. These loans will be sanctioned
for projects rated by the Indian Green Building Council (IGBC) and offer several
financial benefits –a 5 percent concession in margin, 0.25 percent concession in interest
rate and processing fee waiver.
4. Power Savings Equipments:- Banks can directly contribute to controlling climate
change and as an initial step they intend to start a campaign to replace all fused GSL
bulbs, in all owned premises offices and residential. Banks can also make a feasibility
study to make rain water harvesting mandatory in all the Bank‘s owned premises. In
December 2009 Indusind Bank inaugurated Mumbai‘s first solar-powered ATM as part
of its ‗Green Office Project‘ campaign titled ‗Hum aur Hariyali‘.
5. Use Green Credit Cards:- Some of the banks introduced Green Credit Card. The

April 2018 Entire Research, Volume-X, Issue-II 67
ISSN 0975-5020
benefit of using a green credit card is that banks will donate funds to an environment-
friendly non-profit organization from every rupee you spend on your credit card to a
worthwhile cause of environment protection.
6. Save Paper:- Bank should purchase recycled paper products with the highest post-
consumer waste content possible. This includes monthly statements, brochures, ATM
receipts, annual reports, newsletters, copy paper, envelopes etc. Whenever available,
vegetable-based inks are used instead of less environmentally friendly oil-based inks.
7. Use of Solar and Wind Energy:- Using solar and wind energy is one of the noble cause
for going green. State Bank of India (SBI) has become the first bank in the country to
venture into generation of green power by installing windmills for captive use. As part of
its green banking initiative, SBI has installed 10 windmills with an aggregate capacity of
15 MW in the states of Tamil Nadu, Maharashtra and Gujarat.
8. Mobile Banking:- Mobile banking is tricky. On the one hand, it is great to have the
ability to check balances, transfer funds or pay bills from you phone. One the other hand,
it saves time and energy of the customers. It also helps in reducing use of energy and
paper of the bank. Most of the Indian banks introduced this paper-less facility.
Findings:
1. Basically Green banking avoids as much paper work as possible and rely on online/
electronic transactions for processing so that we get green credit cards and green
mortgages. Less paperwork means less cutting of trees. It also involves creating awareness
to banking business people about environmental and social responsibility enabling them to
do an environmental friendly business practice.
2. Green Ethical banks adopt and implement environmental standards for lending, which is
really a proactive idea that would enable eco-friendly business practices which would
benefit our future generations.
3. When we are awarded with a loan, the interest of that loan is comparatively less with
normal banks because green banks give more importance to environmental friendly
factors - ecological gains.
4. Natural resources conservation is also one of the underlying principles in a green bank
while assessing capital/operating loans to extracting/industrial business sector.
5. Green Banking as a concept is a proactive and smart way of thinking with a vision for
future sustainability of our only Spaceship Earth - as design science explorer Richard
Buckminster Fuller called our Earth.
6. The value proposition for corporations to go green includes many of the same issues as
that for individual consumers but on a much large scope and with additional concerns.
Corporations may share a desire to reduce carbon footprint and enhance security by
eliminating paper waste, but they are also extremely concerned with eliminating or
decreasing errors due to manual processing and with creating a profitable bottom line. For
these reasons and more, corporations are actively pursuing green programs, many
companies are taking active steps to reduce waste, implement sustainability measures and
increase profitability by going green.
Conclusion: Banks are responsible corporate citizens. Banks believe that every small ‗GREEN‘
step taken today would go a long way in building a greener future and that each one of them
can work towards to better global environment. ‗Go Green‘ is an organization wide initiative
that moving banks, their processes and their customers to cost efficient automated channels to

April 2018 Entire Research, Volume-X, Issue-II 68
ISSN 0975-5020
build awareness and consciousness of environment, nation and society Green Banking can
give following benefits.
1. Basically Ethical banking avoids as much as paper work, you get go green credit cards, go
green mortgages and also all the transactions done through online Banking.
2. Creating awareness to business people about environmental and social responsibility
enabling them to do an environmental friendly business practice.
3. They follow environmental standards for lending, which is really a good idea and it will
make business owners to change their business to environmental friendly which is good
for our future generations.
Overall Green banking is really a good way for people to get more awareness about
global warming; each businessman will contribute a lot to the environment and make this
earth a better place to live. Thanks to green banking. Until a few years ago, most traditional
banks did not practice green banking or actively seek investment opportunities in
environmentally-friendly sectors or businesses. Only recently have these strategies become
more prevalent, not only among smaller alternative and cooperative banks, but also among
diversified financial service providers, asset management firms and insurance companies.
Although these companies may differ with regard to their stated motivations for increasing
green products and services (e.g. to enhance long-term growth prospects, or sustainability
principles on which a firm is based), the growth, variation and innovation behind such
developments indicate that we are in the midst of a promising drive towards integrating green
financial products into mainstream banking.
This concept of ―Green Banking‖ will be mutually beneficial to the banks, industries
and the economy. Not only ―Green Banking‖ will ensure the greening of the industries but it
will also facilitate in improving the asset quality of the banks in future.
References: 1. Ray Vareen, ‗A Green Dream‘, 4P‘s Business and Marketing, 21 Nov to 4 Dec 2008.
2. Leslie D Monte, ‗It‘s Times for Green Banking‘, Business Standard, May 21, 2010.
3. Ritwik Mukherjee, ‗SBI launches green policy for paperless banking‘, Financial
Chronicle, August 27, 2010.
4. Banking and Financial Markets in Maharashtra 1947 to 2007 by Niti Bhasin New Century
publication, New Delhi, June 2007 edition.
5. Jeucken, M (2001) ―Sustainable Finance and Banking, The finance Sector and The Future
of the Planet‖. London, Earthscan.
6. Starogiannis, D (2006) ―What is Environmental Responsibility of Banks‖ UNEP FI
Conference, June.
7. Thompson,-Hilary-J, (1995) ―The Role of Financial Institutions in Encouraging Improved
Environmental
8. Green, C. F. "Business Ethics in Banking." Journal of Business Ethics 8.8 (1989): 631–
634
* * *

April 2018 Entire Research, Volume-X, Issue-II 69
ISSN 0975-5020
Analysis of Customer’s Opinion about Mobile Banking WRT
Mumbai Region
Shreya Mahesh Newaskar: Student of S.Y. Accounting and Finance, Satish Pradhan
Dyansadhana College Thane (W)
Jewelson Wilson Fernandes: Student of S.Y. Accounting and Finance, Satish Pradhan
Dyansadhana College Thane (W)
Dr. Shraddha Mayuresh Bhome: Asst. Professor and Co-ordinator of BAF
Abstract: Mobile Banking (MB) means a financial transaction conducted by logging on to a bank‘s
website using a cell phone, such as viewing account balances, making transfers between
accounts, or paying bills. It is a term used for performing balance checks, account
transactions, payments etc. via a mobile device such as a mobile phone. Here, the researcher
has carried out a survey of 250 customers on a random sampling method. The questionnaire is
divided into five aspects. They are
1. Customer‘s opinion about usefulness of the MB
2. Customer‘s opinion about use of the MB
3. Customer‘s trust on their bank while using MB
4. Customer‘s opinion about security provided by the bank for MB users
5. Precautions taken by the customers while using MB.
It will be analysed through standard deviation, percentage and graphical representation.
Key Words: Mobile Banking, Customer‘s Opinion, Standard Deviation
Introduction: Mobile Banking (MB) means a financial transaction conducted by logging on to a bank‘s
website using a cell phone, such as viewing account balances, making transfers between
accounts, or paying bills. It is a term used for performing balance checks, account
transactions, payments etc. via a mobile device such as a mobile phone. In recent time Mobile
banking is most often performed via SMS or the Mobile Internet but can also use special
programs called clients downloaded to the mobile device.
In general term we can categorized the mobile banking below – * Mobile Accounting
* Mobile Brokerage
* Mobile Financial Information Services
Objectives of the Study
14.1 To study the opinion of the customer about mobile banking.
Scope of the Study This study is conducted to find out the correlation between
19.1 Age and MB
19.2 Gender and MB
19.3 Qualification and MB
19.4 Socio economic status and MB

April 2018 Entire Research, Volume-X, Issue-II 70
ISSN 0975-5020
Review of Literature 1. Sudhakar A. M., Suryanarayana, (2011), ―Emerging mobile banking scenario and its
adoption in India: a study‖, With broadband communication technological developments
and mobile phones penetration(481 million by June 2009) into common man's life have
triggered major thrust in the Banking service sector of India. With Mobile Banking- a
revolutionary approach to banking transactions has created a strong connectivity between
customers and the banks as both will transact with minimum cost and in minimum time. It
is a timely and its cost effective services can deliver mobile money to non-banked poor
people and will induce economic growth of the country. This article discusses the status of
Mobile Banking in India and other countries with emphasis on data security and standards
and its implication on banking sector.
2. Datta S. K. (2010), ―Acceptance of E-banking among Adult Customers: An Empirical
Investigation in India‖, revealed that Internet banking is a form of self service technology.
The finding depicts many factors like security & privacy, trust, innovativeness,
familiarity, awareness level increase the acceptance of e-banking services among Indian
customers. The finding shows that in spite of their security and privacy concern, adult
customers are willing to adopt online banking if banks provide him necessary guidance.
Based on the results of current study, Bank‘s managers would segment the market on the
basis of age group and take their opinion and will provide them necessary guidance
regarding use of online banking.
3. Laukknen T., Lauronen J. (2005), ―Consumer value creation in mobile banking services‖
The paper presents findings of the study that explored consumer value creation in various
mobile banking services. New electronic channels are replacing the more traditional ones.
Mobile devices represent the recent development in electronic service distribution. An
exploratory study was conducted on experienced electronic banking customers by using a
qualitative in-depth interviewing method. The findings increase the understanding of
customer-perceived value and value creation on the basis of attributes of mobile services
and customer-perceived disadvantages of mobile phones in electronic banking context.
The findings allow practitioners to improve their services and marketing strategies and
pass on information to the academics about interesting future research areas.
4. Suoranta M., Mattila M. (2004), ―Mobile banking and consumer behaviour: New insights
into the diffusion pattern‖, provided an indication of the characteristics of potential
subsequent adopters of mobile banking, and of differences between user segments.
Consequently, the authors are able to comment on the influence of certain demographic
characteristics and the preferred communication mode of customers on the adoption and
future usage of mobile banking services. The quantitative survey that sheds more light on
this researched issue employed a traditional method of postal questionnaire. The data were
collected in Finland during May–July 2002 and include 1,253 survey responses.
5. Sarel D., Howard M. (2003), ―Marketing online banking services: The voice of the
customer‖, revealed significant differences in attitudes and opinions between early users
and those that banks hope will adopt next. Most importantly, future prospects could be
characterised as indifferent about online banking; many were not convinced about its
benefits and the value it provides. While the potential to expand the market for online
banking services exists, banks need to re-examine their marketing approach.
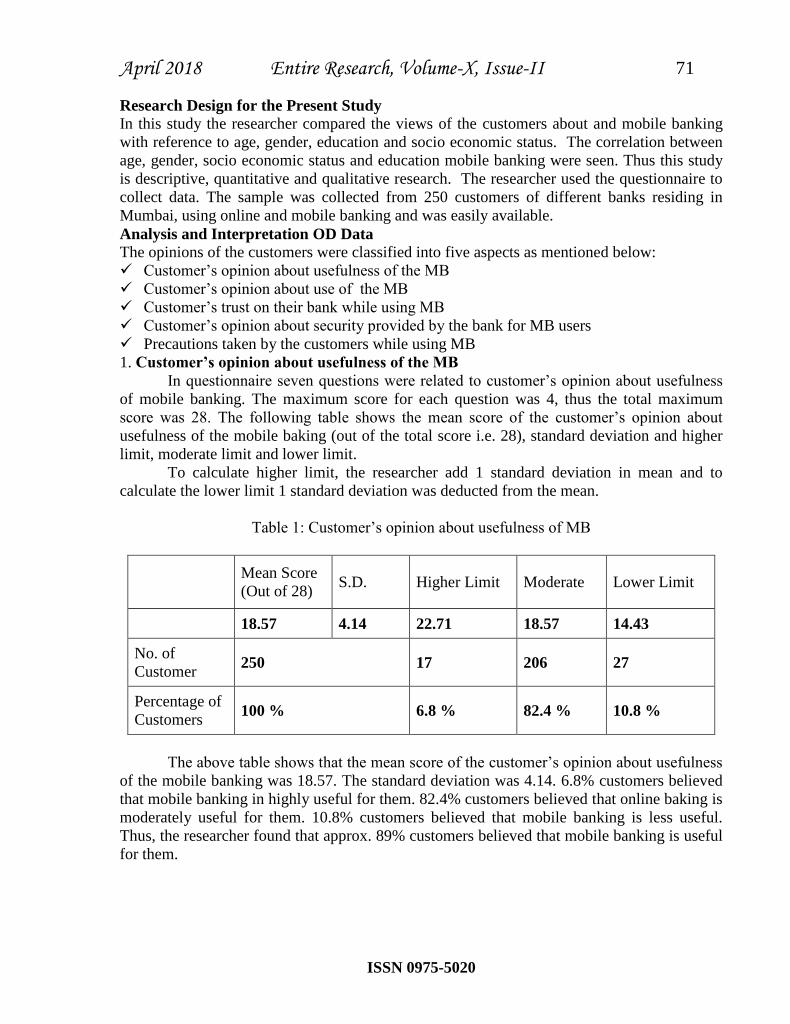
April 2018 Entire Research, Volume-X, Issue-II 71
ISSN 0975-5020
Research Design for the Present Study In this study the researcher compared the views of the customers about and mobile banking
with reference to age, gender, education and socio economic status. The correlation between
age, gender, socio economic status and education mobile banking were seen. Thus this study
is descriptive, quantitative and qualitative research. The researcher used the questionnaire to
collect data. The sample was collected from 250 customers of different banks residing in
Mumbai, using online and mobile banking and was easily available.
Analysis and Interpretation OD Data The opinions of the customers were classified into five aspects as mentioned below:
Customer‘s opinion about usefulness of the MB
Customer‘s opinion about use of the MB
Customer‘s trust on their bank while using MB
Customer‘s opinion about security provided by the bank for MB users
Precautions taken by the customers while using MB
1. Customer’s opinion about usefulness of the MB
In questionnaire seven questions were related to customer‘s opinion about usefulness
of mobile banking. The maximum score for each question was 4, thus the total maximum
score was 28. The following table shows the mean score of the customer‘s opinion about
usefulness of the mobile baking (out of the total score i.e. 28), standard deviation and higher
limit, moderate limit and lower limit.
To calculate higher limit, the researcher add 1 standard deviation in mean and to
calculate the lower limit 1 standard deviation was deducted from the mean.
Table 1: Customer‘s opinion about usefulness of MB
Mean Score
(Out of 28) S.D. Higher Limit Moderate Lower Limit
18.57 4.14 22.71 18.57 14.43
No. of
Customer 250 17 206 27
Percentage of
Customers 100 % 6.8 % 82.4 % 10.8 %
The above table shows that the mean score of the customer‘s opinion about usefulness
of the mobile banking was 18.57. The standard deviation was 4.14. 6.8% customers believed
that mobile banking in highly useful for them. 82.4% customers believed that online baking is
moderately useful for them. 10.8% customers believed that mobile banking is less useful.
Thus, the researcher found that approx. 89% customers believed that mobile banking is useful
for them.

April 2018 Entire Research, Volume-X, Issue-II 72
ISSN 0975-5020
Chart 1: Customer‘s opinion about usefulness of MB
2. Customer’s opinion about use of the MB In questionnaire four questions were related to customer‘s opinion about the using of
mobile banking. The maximum score for each question was 4, thus the total maximum score
was 16. The following table shows the mean score of the customer‘s opinion about the using
of online baking (out of the total score i.e. 12), standard deviation and higher limit, moderate
limit and lower limit.
Table 2: Customer‘s opinion about the use of MB
Mean Score
(Out of 16) S.D. Higher Limit Moderate Lower Limit
8.80 2.21 11.01 8.80 6.59
No. of
Customer 250 50 197 3
Percentage of
Customers 100 % 20 % 78.8 % 1.2 %
The above table shows that the mean score of the customer‘s opinion about the using
of mobile banking was 8.80. The standard deviation was 2.21. 20% customers believed that
mobile banking is very easy to use and they were using it without any worries. 78.8%
customers believed that mobile banking is fairly easy to use and they were using it without
worries. 1.2% customers believed that mobile banking is not easy to use and they were little
worried as there was no personal relation with the bank.
6.80%
82.40%
10.80%
0.00%
10.00%
20.00%
30.00%
40.00%
50.00%
60.00%
70.00%
80.00%
90.00%
Higher Limit Moderate Lower Limit
Pe
rce
nta
ge
Level
Percentage of Customers

April 2018 Entire Research, Volume-X, Issue-II 73
ISSN 0975-5020
The following is the graphical presentation of the above facts.
Chart 2: Customer‘s opinion about the use of MB
3. Customer’s trust on their bank while using MB In questionnaire five questions were related to customer‘s trust on their bank. The
maximum score for each question was 4, thus the total maximum score was 28. The following
table shows the mean score of the customer‘s trust on their bank (out of the total score i.e. 20),
standard deviation and higher limit, moderate limit and lower limit.
Table 3: Customer‘s trust on their bank
Mean Score
(Out of 20) S.D. Higher Limit Moderate Lower Limit
15.18 3.89 19.07 15.18 11.29
No. of
Customer 250 22 199 29
Percentage of
Customers 100 % 8.8 % 79.6 % 11.6 %
The above table shows that the mean score of the customer‘s trust on their bank was
15.18. The standard deviation was 3.89.
8.8% customers were having full trust on their banks while using MB. 79.6%
customers were having moderate trust on their banks while using MB. 15.2% customers were
having less trust or no trust on their bank while using MB.
20.00%
78.80%
1.20%0.00%
10.00%
20.00%
30.00%
40.00%
50.00%
60.00%
70.00%
80.00%
90.00%
Higher Limit Moderate Lower Limit
Perc
enta
ge
Level
Percentage of Customers

April 2018 Entire Research, Volume-X, Issue-II 74
ISSN 0975-5020
Chart 3: Customer‘s trust on their bank
4. Customer’s opinion about security provided by the bank to MB users In questionnaire three questions were related to customer‘s opinion about the security
provided by the bank. The maximum score for each question was 4, thus the total maximum
score was 12. The following table shows the mean score of the customer‘s opinion about the
security provided by the bank (out of the total score i.e. 12), standard deviation and higher
limit, moderate limit and lower limit.
Table 4: Customer‘s opinion about the security provided by the bank
Mean Score
(Out of 12) S.D. Higher Limit Moderate Lower Limit
1.78 1.24 3.01 1.78 0.54
No. of
Customer 250 56 69 125
Percentage of
Customers 100 % 22.4 % 27.6 % 50 %
The above table shows that the mean score of the customer‘s opinion about the security
provided by the bank was 1.78. The standard deviation was 1.24.
22.4 % customers believed that there are high chances of misuse their accounts if they use
MB due to weak security provided by the banks. 27.6% customers believed that there are
moderate chances of misuse their accounts if they use MB. 50% customers believed that there
is less chance or no chance of misusing their accounts by other persons if they use MB. The
study clearly shows that approximately 50% customers were satisfied with the security
measures taken by the banks for MB users.
8.80%
79.60%
11.60%
0.00%
10.00%
20.00%
30.00%
40.00%
50.00%
60.00%
70.00%
80.00%
90.00%
Higher Limit Moderate Lower Limit
Pe
rce
nta
ge
Level
Percentage of Customers

April 2018 Entire Research, Volume-X, Issue-II 75
ISSN 0975-5020
Chart 4: Customer‘s opinion about the security provided by the bank
5. Precautions taken by the customers In questionnaire five questions were related to the precautions taken by the customers.
The maximum score for each question was 4, thus the total maximum score was 20. The
following table shows the mean score of the precautions taken by the customers (out of the
total score i.e. 20), standard deviation and higher limit, moderate limit and lower limit.
Table 5: Precautions taken by the customers
Mean Score
(Out of 20) S.D. Higher Limit Moderate Lower Limit
11.97 2.11 14.08 11.97 9.86
No. of
Customer 250 33 191 26
Percentage of
Customers 100 % 13.2 % 76.4 % 10.4 %
The above table shows that the mean score of the precautions taken by the customer
was 11.97. The standard deviation was 2.11. 13.2% customers were taken high precautions,
76.4 % customers taken moderate precaution while 10.4% had not taken precautions or were
taken less precautions.
22.40%27.60%
50.00%
0.00%
10.00%
20.00%
30.00%
40.00%
50.00%
60.00%
Higher Limit Moderate Lower Limit
Pe
rce
nta
ge
Level
Percentage of Customers

April 2018 Entire Research, Volume-X, Issue-II 76
ISSN 0975-5020
Chart 5: Precautions taken by the customers
Findings and Conclusion: The study showed that approximately 89% customers believed that MB is useful for
them. 1.2% customers felt that the use of mobile banking is not very easy while 98.8%
customers found it easy to operate mobile banking. 11.2 % customers were highly encouraged
by the bank for MB, 20% were highly encouraged by the bank officials while 19.6% were
highly encouraged by their friends or colleagues. More than 50% of the customers were
highly encouraged by banks, banks officials and friends or colleagues to use MB. 8.4%
customers also believed that they were highly discouraged by their friends or colleagues for
MB. 78% customers were having more than 75% trusts on their banks. 50% customers were
fully satisfied with the security provided by their banks and they were sure that no one is
ambled to stolen their money. 89.60% customers took precautionary measures by themselves.
The findings of the study show that maximum customers have positive attitude towards
mobile banking.
References 1. Datta S. K. (2010), ―Acceptance of E-banking among Adult Customers: An Empirical
Investigation in India‖, Journal of Internet Banking and Commerce, Vol. 15 (2).
2. Sudhakar A. M., Suryanarayana, (2011), ―Emerging mobile banking scenario and its
adoption in India: a study‖, SRELS Journal of Information Management, Vol. 48 (1), pp.
41 - 50.
3. Suoranta M., Mattila M. (2004), ―Mobile banking and consumer behaviour: New insights
into the diffusion pattern‖, Journal of Financial Services Marketing, Vol.8, pp. 354 -366.
4. Sarel D., Howard M. (2003), ―Marketing online banking services: The voice of the
customer‖, Journal of Financial Services Marketing, Vol. 8, pp. 106 - 118.
5. Laukknen T., Lauronen J. (2005), ―Consumer value creation in mobile banking services‖,
International Journal of Mobile Communications, Vol. 3 (4), pp. 325 – 338.
* * *
13.20%
76.40%
10.40%
0.00%
10.00%
20.00%
30.00%
40.00%
50.00%
60.00%
70.00%
80.00%
90.00%
Higher Limit Moderate Lower Limit
Pe
rce
nta
ge
Level
Percentage of Customers
April 2018 Entire Research, Volume-X, Issue-II 77
ISSN 0975-5020
Effect of Yoga on Muscular Endurance of Slum Area Girls of
Mumbai
Dr. Rohini Chandrakant Kawade (Astt. Prof.): BPCAS College of Physical Education,
Wadala, Mumbai-31.
Abstract:
The slum-dwelling population of India has raised from 27.9 million in 1981 to 61.8
million in 2001. According to recent estimates, Maharashtra, Uttar Pradesh, Andhra Pradesh
and Madhya Pradesh will be having largest share of slum population in India by 2017. It was
therefore felt necessary to undertake a research project in the area of health and fitness of
slum area students to improve the decline status of health through ‗Yoga‘. The present
experiment was conducted by using ‘non equivalent group design’. Hundred (n=100) girls
students, age ranged from 13 to 15 years, from Maharashtra Education Society‘s
ChhatrapatiShivajiVidyalaya, Dharavi, Sion, Mumbai were selected as samples for this study.
Yogic Practices were selected as Independent Variable for the experiment whereas,Health
Related Physical Fitness Component ‗Muscular Endurance‘ was selected as Dependent
Variable. There were two groups for this Experimental Study Viz. Experimental Group and
Control Group. Experimental Group (n=50) and one Control Group (n= 50). Experimental
group was received training of ‗Yogic Practices’ for the period of 12 weeks daily in the
morning for one hour except Sundays. Result of the study was seen that the adjusted f-value is
25.66 which is significant at 0.01 level with df=1/97 when pre Bent Knee Sit Ups of Muscular
Endurance of slum area school girls was taken as covariant. It shows that adjusted mean
scores of Bent Knee Sit Ups Test of Muscular Endurance of slum area school girls of
experimental and control groups differs significantly where pre Bent Knee Sit Ups Test of
Muscular Endurance of slum area school girls was taken as covariant.Conclusion of this study
was, ‘12 Weeks Yoga Training Program’ is effective to improve Muscular Endurance of
slum area school girls.
Introduction:
Slum Population in India simply refers to people living in slum areas below the
poverty line. As India is still on the path of development, there is large number of people
living below the poverty line.According to census in 2001 (India Guide, 2015), the slum-
dwelling population of India has raised from 27.9 million in 1981 to 61.8 million in 2001.
According to recent estimates, Maharashtra, Uttar Pradesh, Andhra Pradesh and Madhya
Pradesh will be having largest share of slum population in India by 2017 (The Hindu,
October 2013 ).
The children residing in the slum area pose a serious threat to their current health and
future prospects (Thomas, 2010). As the most fragile members of society, they are most
vulnerable to disease and environmental stress; their long-term well-being depends on the
sustained ability of the Earth's resources to support this still expanding population.
This indicates that the gravity of health condition of the children living in slum areas.
It was therefore felt necessary to undertake a research project in the area of health and fitness
of slum area students to improve the decline status of health through ‗Yoga‘.

April 2018 Entire Research, Volume-X, Issue-II 78
ISSN 0975-5020
Objective of the Study
To compare adjusted mean scores of Muscular Endurance of girls of the experimental
group and control group by taking pre Muscular Endurance as covariate.
Hypothesis of the study
H01: There is no significant difference in adjusted mean scores ofMuscularEndurance
as measured by Bent Knee Sit Ups test of slum area school girls of experimental and control
group by taking pre Muscular Endurance of slum area school girls as covariate
Method
Design of the study
The present experiment was conducted by using NON EQUIVALENT GROUP
design
Sample
Hundred (n=100) girls students, age ranged from 13 to 15 years, from Maharashtra
Education Society‘s ChhatrapatiShivajiVidyalaya, Dharavi, Sion, Mumbai were selected as
samples for this study.
Independent Variable
The following Yogic Practices presented in Table 1 were selected as Independent
Variable for the experiment.
Table 1
Independent Variablesi.e.Asana, Pranayama and Kriya
Seating Position Asana KRIYA
Vajrasana Kapalabhati
Padmasana
Vakrasana
Paschimottanasana
Prone Position Asana Pranayama
Bhujangasana Anulom-Vilom
Ardhsalbhasana Ujjayi
Shalbhasana
Makrasana
Supine Position Asana
Shavasana
Pawanmuktasana
Halasana
Naukasana
Standing Position Asana
Tadasana
Vrikshasana
Utkatasana
Padhastasana
Dependent Variable
Health Related Physical Fitness Component ‗MUSCULAR ENDURANCE’ was
selected as Dependent Variable.

April 2018 Entire Research, Volume-X, Issue-II 79
ISSN 0975-5020
Procedure of the Study
There were two groups for this Experimental Study Viz. Experimental Group and
Control Group with Pretest and Posttest, the selected sample were randomly assigned into two
equal groups viz., one Experimental Group (n=50) and one Control Group (n= 50).
Experimental group was received training of ‗Yogic Practices’ for the period of 12 weeks
daily in the morning for one hour except Sundays.
Result
To compare adjusted mean scores of Muscular endurance of girls of the experimental
group and control group by taking pre Muscular Endurance as covariate.Result of the study
was seen that the adjusted f-value is 25.66 which is significant at 0.01 level with df=1/97
when pre Bent Knee Sit Ups Test of Muscular Endurance of slum area school girls was taken
as covariant. It shows that adjusted mean scores of Bent Knee Sit Ups Test of Muscular
Endurance of slum area school girls of experimental and control groups differs significantly
where pre Bent Knee Test of Muscular Endurance of slum area school girls was taken as
covariate.
TABLE 2
Summary of One Way ANCOVA of Muscular Endurance of Slum Area School Girls
Source of
Variance
df SS MS F Remark
Group 1 638.79 638.79 25.66 p<0.01
Error 97 2414.31 24.89
Total 100
Thus, the null hypothesis that there is no significant difference in adjusted mean score
of Bent Knee Sit UpsTest of Cardiovascular Endurance of slum area school girls of
experimental and control groups by taking pre Bent Knee Sit Ups Test of Muscular
Endurance of slum area school girls as covariate is rejected.Therefore the adjusted mean score
of Bent Knee Sit Ups Test of Muscular Endurance of slum area school girls of experiment
group is 23.80 which is significantly higher than of control group where adjusted mean score
of Bent Knee Sit Ups Test of Muscular Endurance of slum area school girls is 18.14
Discussion
The purpose of the present study was to study the efficacy of yoga practices for the
promotion ofMuscular Endurance of slum area school girls. It is appeared from the result of
the present study that, the twelve weeks‘ yoga training programme has brought significant
improvement in case of Muscular Endurance of slum area school girls. Though the results of
the studies conducted by other researcher (Vinekar, 1957; Gharote, 1977, Bera&Rajapurkar,
1993, Moorthy, 1988; Hagins, Moore, & Rundle, 2007; Tracy & Hart, 2012; Madanmohan, et
al, 2008; Chen, et al, 2009; Bera, T. K., 1999; Shrikrishna, 1990; Lagerberg., 2005; Bhole M.
V.,1977; Hanumanthaiah, Nagarathna, &Nagendra, 1994; Gharote M. M., 2000;
Gharote&Ganguly, 1989; Clay, et al, 2005; Sinha, Ray, Pathak, &Selvamurthy, 2004;
Bussing, et al, 2012; Gruebner, et al, 2012; Kafle, et al 2010 and Goldfine&Nahas, 1993) are
supporting up to some extent to the above stated findings of the present study.The probable
reason for the significant improvement in case of Muscular Endurance is nothing but twelve
weeks‘ intervention of yogic practices. To summarize, the results of the study proved beyond
doubt that regular practice of yoga for one hour daily for ‗Twelve Weeks’ is beneficial in
maintaining Heath Related Physical Fitness of the Slum Area School girls.

April 2018 Entire Research, Volume-X, Issue-II 80
ISSN 0975-5020
Conclusion
‘12 Weeks Yoga Training Program’ is helpful to improve Muscular Endurance of
slum area school girls.
References
Bera, T. K., Jolly, S. R. Ganguly, S. K. and Gharote, M. L. (1999). Effect of three years
yogic exercises progamme on motor function in school boys. Yoga-Mimamsa, 33, 1, pp.
1-12.
Bera, T. K., & Rajapurkar, M. V. (1993). Body composition cardiovascular endurance and
anaerobic power of yogic practitioner. Indian Journal of Physiol. Pharmacol, 37, 3 ,
pp.225-228.
Chen, T. L., Mao, H. C., Lai, C. H., Li, C. Y., & Kuo, C. H. ( 2009). The effect of yoga
exercise intervention on health related physical fitness in school-age asthmatic children.
Hu Li Za Zhi, , 56, 2, pp. 42-52.
Ganguly S. K. and Gharote M. L. (1989). Effect of yogic training on endurance and
flexibility level. Yoga Mimamsa, 24, 3, pp. 29-39.
Gharote, M. L. (1970). Effect of yogic exercises on the strength and endurance of the
abdominal muscles of the female, VyayamVidnyan, 4, 11 & 13.
Gharote, M.L. (1976). Effects of short term Yogic training programme on the Physical
Fitness of School boys. Avagahana, 1, 1, p. 13.
Gharote, M. L. (1977). An evaluation of the effects of yogic treatment on obesity: A
report. Yoga Mimamsa, 19, 1, pp. 13-37.
Gharote, M.M. (2000). Minimum muscular fitness in school children. Indian Journal of
Physiology and Pharmacology, 44, 4, pp. 479-484.
Hagins, M., Moore, W., & Rundle, A. (2007). ―Does practicing hatha yoga satisfy
recommendations for intensity of physical activity which improves and maintains health
and cardiovascular fitness. BMC Complement Altern Med, 30, pp.40-48.
India Guide. (2015, March 10). Slum Population in India. Retrieved August 23, 2015,
from Population of India: http://www.indiaonlinepages.com/population/slum-population-
in-india.html
M. M. Gharote, ―Minimum muscular fitness in school children‖. Indian Journal of
Physiology and Pharmacology, 44, 4, 2000, pp. 479-484.
Madanmohan, L. Jatiya, K. Udupa, and A. Bhavanani, ―Effect of yoga training on
handgrip, respiratory pressures and pulmonary function.‖ Indian Journal of Physiology
and Pharmacology, 47, 4, 2003, pp. 387-392.
Moorthy, A. M. (1988). , ―The effect of selected yogic practices on cardiovascular fitness
level of college men and women. Yoga-Mimamsa, 27, l & 2, p.9.
Rikli, R., & Jones, C. (1998). The reliability and validity of a 6-minute walk test as a
measure of physical endurance in older adults. Journal of Aging and Physical Activity, 6:
363–375.
The Hindu. (October 2013 ). Slum population. NEW DELHI:
http://www.thehindu.com/news/national/slum-population-up-from-52-million-to-65-
million/article5187166.ece.
Thomas, L. T. (2010). When the Bough Breaks...Our Children, Our Environment.
London: Earthscan Publications.
* * *