Embed Size (px)
Citation preview

AIRPORT FINANCE
Information on Funding Sources and Planned Capital Development
Report to Congressional Committees
April 2015
GAO-15-306
United States Government Accountability Office

United States Government Accountability Office
Highlights of GAO-15-306, a report to congressional committees
April 2015
AIRPORT FINANCE Information on Funding Sources and Planned Capital Development
Why GAO Did This Study Roughly 3,300 of the public-use airports across the United States have been determined by FAA to be significant to national air transportation. These airports form a national airport system intended to provide convenient access to air transportation and support important national functions, such as defense, emergency readiness, and postal delivery. These airports are eligible to receive federal AIP grants to help fund their capital development. Commercial service airports—if they choose and subject to federal approval—are also authorized to collect local PFCs from passengers, which are also used to fund capital development projects.
GAO was asked to provide information about airport infrastructure plans and funding. This report discusses (1) how much national system airports received in funding for capital development projects from 2009 through 2013 and from which sources, (2) the estimated costs of airports’ planned capital development from 2015 through 2019, (3) how past funding levels compare with planned development costs, and (4) how changes to AIP funding and the maximum allowable PFC might affect airport funding. GAO analyzed funding data and conducted a survey of state aviation officials, examined reports on airports’ development plans, assessed changes included in the President’s fiscal year 2016 budget proposal, and interviewed FAA officials, industry representatives, airport financial-consulting firms, and bond-rating agencies.
GAO is not making any recommendations in this report. FAA reviewed a draft of this report and provided technical comments.
What GAO Found From 2009 through 2013, national system airports had available an average of $10 billion annually for capital development from the following funding sources:
• airport-generated net income ($3.8 billion), • federal Airport Improvement Program (AIP) grants ($3.3 billion), • local passenger facility charges (PFC) ($1.8 billion), • airport sponsor or owner capital contributions ($644 million), and • state grants ($477 million).
Larger airports (large and medium hubs) obtained more than half of their capital development funding from airport-generated net income, while smaller airports (small and non hubs and general aviation airports) relied on AIP grants for 69 percent of their funding.
Airports’ planned capital development costs for fiscal years 2015 through 2019 are estimated at $13 billion annually (in 2013 dollars). Larger airports account for 65 percent of the planned development. For AIP-eligible projects, the largest shares of planned development costs are for projects to reconstruct facilities ($2.2 billion), meet the Federal Aviation Administration’s (FAA) airport design standards ($2.1 billion), and enhance airfield capacity ($977 million).
Airports’ planned capital development exceeds past funding levels, but airports have some options in how they choose to fund capital projects. GAO adjusted past funding amounts to 2013 dollars to make them comparable with planned development costs. This inflation-adjusted amount of funding—$10.3 billion per year—would still fall short of the $13 billion in planned capital development costs by $2.7 billion per year. Airports have several options for trying to align capital funding and the costs of planned development, including prioritizing projects, increasing airport-generated net income, and borrowing money to fund capital projects. Borrowing is generally accomplished by issuing bonds; bonds entail leveraging future funding to pay for projects. Two airport financial consulting firms with whom GAO spoke noted that some airports are already highly leveraged. Consistent with this, analysis of data from PFC applications for projects with start dates from 2009 through 2013 indicates that airports plan to spend 74 percent of their PFC revenues on debt service—38 percent on principal payments and 36 percent on interest payments. Nonetheless, three bond rating agencies that GAO spoke with continued to give airports high or stable ratings and one stated that access to capital markets for larger airports remains strong.
Federal funding for national system airports involves policy decisions, such as choices about the overall amount of AIP grant funding to make available annually, which airports should be included in the national system and thus be eligible for AIP grants, the maximum allowable PFC, and how, if at all, AIP and PFCs should be interrelated. The President’s fiscal year 2016 budget proposal includes some possible changes to AIP and PFCs. The proposal seeks to lower the overall amount of AIP funding to $2.9 billion, but simultaneously increase the maximum allowable PFC. Specific provisions in the proposal would operate to increase AIP funding for small airports and decrease AIP funding for larger airports, presuming that larger airports would generally opt for higher PFCs and that doing so would offset, or more than offset, their AIP decreases.
View GAO-15-306. For more information, contact Gerald L. Dillingham, Ph.D., at (202) 512-2834 or [email protected].

Page i GAO-15-306 Airport Finance
Letter 1
Background 4 Airports Averaged $10 Billion Annually in Capital Project Funding
for Fiscal Years 2009 through 2013, from a Variety of Sources 9 Estimated Costs of Planned Airport Capital Development for
Fiscal Years 2015 through 2019 Average $13 Billion Annually 27 Airports’ Planned Development Exceeds Past Funding Levels, but
Several Considerations Affect the Comparison and How Airports Choose to Fund Capital Projects 30
Several Factors Influence How Changes to AIP and PFCs Could Affect Airports, Including Amounts Required for and the Interrelation between AIP and PFCs 37
Agency and Third Party Comments 44
Appendix I Objectives, Scope, and Methodology 46
Appendix II GAO Survey Instrument 55
Appendix III Comparison of Past Funding and Planned Development Costs by Type of Airport 65
Appendix IV Comparison of Airport Improvement Program’s Funding Distributions When Amount Made Available—$2.9 Billion—is At or Above versus Below Trigger Mechanism 69
Appendix V GAO Contact and Staff Acknowledgments 72
Tables
Table 1: Sources of Airport Funding Available for Capital Projects, Annual Averages for Fiscal Years 2009-2013 10
Contents

Page ii GAO-15-306 Airport Finance
Table 2: Airport Improvement Program (AIP) Grants by Airport Size and Purpose, Annual Averages for Fiscal Years 2009-2013 18
Table 3: Estimated Cost of Planned Airport Capital Development, Annual Average for Fiscal Years 2015-2019Fiscal year 2013 28
Table 4: Estimated Costs of Planned Airport Capital Development by Airport Size, Annual Averages for Fiscal Years 2015-2019Fiscal year 2013 29
Table 5: Comparison of Airport Improvement Program (AIP) Funding Distributions above and below the Trigger Mechanism 38
Table 6: Estimated Passenger Facility Charge (PFC) Collections Available to PFC Approved Airports, 2016-2024 43
Table 7: Aviation Industry Stakeholders and Observers Interviewed by GAO 53
Table 8. Comparison of Airport Improvement Program’s Funding Distributions When Amount Made Available—$2.9 Billion—Is At or Above versus Below Trigger Mechanism 69
Figures
Figure 1: Categories and Numbers of U.S. Airports (as of September 2014) 5
Figure 2: Sources of Airport Funding Available for Capital Projects, Annual Averages by Size of Airport for Fiscal Years 2009-2013 12
Figure 3: Airport-Generated Net Income, Fiscal Years 2009-2013 13 Figure 4: Sources of Aeronautical and Non-Aeronautical Revenue
for All Commercial Airports (Based on Average Annual Airport Operating Revenues for Fiscal Years 2009-2013) 15
Figure 5: Airport Improvement Program (AIP) Grants to Airports, Fiscal Years 2009-2013 17
Figure 6. Passenger Facility Charge (PFC) Collections Available for Airport Capital Development, Fiscal Years 2009-2013 20
Figure 7: Federal Aviation Administration-Approved Passenger Facility Charges by Type of Project, 1990 through February 2014 22
Figure 8: State Grants to Airports, Fiscal Years 2009-2013 24 Figure 9: Airport Bond Proceeds for New Capital Development
Projects, 2009-2013 26

Page iii GAO-15-306 Airport Finance
Figure 10: Comparison of Past Airport Funding and Planned Development Costs 31
Figure 11: Examples of Expanded Services Offered in Some Airport Terminals 35
Figure 12: Comparison of Past Funding Available for Capital Development and Planned Development Costs – Large Hub Airports 65
Figure 13: Comparison of Past Funding Available for Capital Development and Planned Development Costs – Medium Hub Airports 66
Figure 14: Comparison of Past Funding Available for Capital Development and Planned Development Costs – Small Hub Airports 67
Figure 15: Comparison of Past Funding Available for Capital Development and Planned Development Costs – Nonhub, Nonprimary Commercial Service, Reliever, and General Aviation Airports 68

Page iv GAO-15-306 Airport Finance
Abbreviations AAAE American Association of Airport Executives ACI-NA Airports Council International – North America AIP Airport Improvement Program AMT alternative minimum tax AOPA Aircraft Owners and Pilots Association APPP Airport Privatization Pilot Program CATS Compliance Activity Tracking System DOT Department of Transportation FAA Federal Aviation Administration FBO fixed-base operations NASAO National Association of State Aviation Officials NPIAS National Plan of Integrated Airport Systems PANYNJ Port Authority of New York and New Jersey PFC passenger facility charge SOAR System of Airports Reporting
This is a work of the U.S. government and is not subject to copyright protection in the United States. The published product may be reproduced and distributed in its entirety without further permission from GAO. However, because this work may contain copyrighted images or other material, permission from the copyright holder may be necessary if you wish to reproduce this material separately.

Page 1 GAO-15-306 Airport Finance
441 G St. N.W. Washington, DC 20548
April 28, 2015
The Honorable Bill Shuster Chairman The Honorable Peter DeFazio Ranking Member Committee on Transportation and Infrastructure House of Representatives
The Honorable Frank LoBiondo Chairman The Honorable Rick Larsen Ranking Member Subcommittee on Aviation Committee on Transportation and Infrastructure House of Representatives
Airports across the United States fulfill a variety of vital roles, from supporting scheduled commercial air service for the traveling public, to supporting freight transportation, medical flights, aerial firefighting, disaster relief, pilot training, and more. The United States has the largest, most diverse system of airports in the world, with over 19,000 airports across the country. Of these, more than 5,000 are available for public use. The Federal Aviation Administration (FAA), in concert with state aviation agencies and local planning organizations, has determined that roughly 3,300 of these public-use airports are significant to national air transportation and together form a national airport system. Among other objectives, the national airport system is intended to provide the U.S. population with convenient access to air transportation and to support important national functions, such as defense, emergency readiness, and postal delivery.
National system airports are eligible to receive federal Airport Improvement Program (AIP) grants to help fund airport infrastructure projects. AIP grants can, for example, help fund airport projects to rehabilitate aging infrastructure, meet FAA standards for airport design, or accommodate larger aircraft or growth in passenger activity. Commercial service airports—if they choose and subject to federal approval—are also authorized to collect a local passenger facility charge (PFC) from each passenger. PFC revenues can be used for many of the same types of projects as AIP grants, but can also be used for debt service to finance
Letter

Page 2 GAO-15-306 Airport Finance
infrastructure projects. PFCs are seen as a complementary funding source to AIP grants.
FAA’s current authorization, which includes authorized amounts for the AIP, is set to expire in September 2015. The PFC cap, which currently stands at $4.50 per flight segment, has been permanently established under the U.S. Code.1 As Congress prepares to reauthorize FAA, it will be considering how much federal support to give to national system airports, and through which funding mechanisms. In preparation for reauthorization discussions, you asked us to provide information about airport capital infrastructure and funding. We provided similar information in 2003 and 2007 for prior FAA reauthorization discussions.2
To determine how much airports received for capital development for fiscal years 2009 through 2013 and from what sources, we obtained and analyzed information on the five main sources of airport funding: airport-generated net income, AIP grants, PFCs, capital contributions, and state grants. We framed our research objective to examine funding received rather than actual capital expenditures because comprehensive data on airport capital spending are limited; thus, we sought data on airports’ available capital funding, which, over time, should roughly equate to spending. For AIP, we analyzed information from FAA’s System of Airports Reporting (SOAR) database. For PFCs, we obtained PFC collection data and analyzed PFC project information from airports’ PFC applications. For airport-generated net income and capital contributions, we obtained information from FAA’s airport financial-reporting database. We spoke with FAA officials about these data and determined that the
For this report, we addressed the following questions: (1) How much did airports receive for capital development for fiscal years 2009 through 2013, and from what sources? (2) What is the estimated cost of airports’ planned capital development for fiscal years 2015 through 2019? (3) How do past funding levels compare with planned capital development costs? (4) How might changes to AIP funding levels and the maximum allowable PFC affect airport funding?
149 U.S.C. § 40117(b)(4). 2See GAO, Airport Finance: Past Funding Levels May Not Be Sufficient to Cover Airports’ Planned Capital Development, GAO-03-497T (Washington, D.C.: Feb. 25, 2003) and Airport Finance: Observations on Planned Airport Development Costs and Funding Levels and the Administration’s Proposed Changes in the Airport Improvement Program, GAO-07-885 (Washington, D.C.: June 29, 2007).

Page 3 GAO-15-306 Airport Finance
data were sufficiently reliable for estimating funding amounts. To obtain information about state airport funding, we surveyed, with the assistance of the National Association of State Aviation Officials (NASAO), the state aviation official in each state as well as the U.S. territory of Guam. We received responses from 46 of 51 state aviation officials (a 90 percent response rate). In addition to these sources of airport funding, this report also separately discusses information on airport bond proceeds—a common financing mechanism for some airports—based on data from Thomson Reuters, a financial information services firm. We assessed the reliability of Thomson Reuter’s SDC Platinum data on airport bond issuances by corroborating the data with another source and discussing any limitations of the data with some of its users. We determined that the data were sufficiently reliable for estimating bond proceeds. To obtain information on the cost of airports’ planned capital development for fiscal years 2015 through 2019, we examined FAA’s National Plan of Integrated Airport Systems (NPIAS) report for these fiscal years, which was released in September 2014. We also examined a March 2015 report, Airport Capital Development Needs 2015-2019, released by the Airports Council International – North America (ACI-NA), a leading industry association. For both reports, we assessed the methodologies for estimating the costs of airport planned development and found them to be sufficiently reliable for estimating planned capital development. Using the sources described above, we compared past funding to the costs of planned development and assessed how a lower AIP funding level, as put forth in the President’s fiscal year 2016 proposed budget, would affect the funding received by airports.3 With regard to PFC levels, we incorporated analysis contained in our December 2014 report examining PFCs and PFC collection methods.4
3U.S. Department of Transportation, Budget Estimates Fiscal Year 2016 Federal Aviation Administration.
In addition, we interviewed a variety of aviation stakeholders and aviation industry observers to gain their perspectives about airport funding issues, including representatives of FAA; six associations representing airports, airlines, or airport users; three airport financial-consulting firms; and three bond-rating agencies. We also used our survey of state aviation officials to obtain their views about airport
4See Commercial Aviation: Raising Passenger Facility Charges Would Increase Airport Funding, but Other Effects Less Certain, GAO-15-107 (Washington, D.C.: Dec. 11, 2014). In this report, we analyzed the potential effects of various PFC increases on passenger demand and on revenues into the Airport and Airway Trust Fund. We also discussed the current PFC collection process and possible alternative PFC collection methods.

Page 4 GAO-15-306 Airport Finance
funding issues. A complete listing of those we interviewed and additional information on our scope and methodology can be found in appendix I. A copy of our survey instrument can be found in appendix II.
We conducted this performance audit from April 2014 to April 2015, in accordance with generally accepted government auditing standards. Those standards require that we plan and perform the audit to obtain sufficient, appropriate evidence to provide a reasonable basis for our findings and conclusions based on our audit objectives. We believe that the evidence obtained provides a reasonable basis for our findings and conclusions based on our audit objectives.
The United States has more than 19,000 airports, ranging from busy commercial service airports such as the Hartsfield-Jackson Atlanta International Airport that enplanes millions of passengers annually, to small grass airstrips that serve only a few aircraft each year. As of September 2014, 3,345 of the public-use airports were designated as part of the national airport system and were therefore eligible for federal assistance in the form of AIP grants. (This number includes 14 proposed airports anticipated to open by the end of 2019.) The criteria for projects to receive federal assistance are crafted around national airport system goals for safety, capacity, security, efficiency, accessibility, and environmental sustainability.
All of the nation’s roughly 500 commercial service airports are part of the national airport system. FAA groups national system airports into two major categories: primary and non-primary. (See fig. 1.) The primary airports all offer scheduled commercial service and are further divided by hub size.5
5Passenger traffic in the United States is highly concentrated, with the large- and medium-hub airports accounting for 88 percent of commercial passenger boardings in 2013.
The nonprimary airports include nonprimary commercial service airports, reliever airports, and general aviation airports. Nonprimary commercial service airports have some scheduled air carrier service but are used mainly by general aviation. Reliever airports are high-capacity general aviation airports in major metropolitan areas that are intended to provide pilots with alternatives to using congested hub airports. Finally, more than 2,500 of the nation’s general aviation airports are included in the national airport system. General aviation airports may
Background

Page 5 GAO-15-306 Airport Finance
be included in the national airport system if they account for enough activity (having usually at least 10 based aircraft) and are at least 20 miles from the nearest national system airport. These general aviation airports can be particularly important to rural areas and can support critical functions, including pilot training and emergency preparedness.
Figure 1: Categories and Numbers of U.S. Airports (as of September 2014)
Note: The term “airport” includes landing areas developed for conventional fixed-wing aircraft, helicopters, and seaplanes. aNumber of airports includes 14 proposed airports that are anticipated to open by the end of 2019. Of the 14, 1 is a primary airport, 2 are nonprimary commercial service, and 11 are general aviation. bWhile commercial service airports handle regularly scheduled commercial airline traffic, “general aviation” airports support noncommercial flights.

Page 6 GAO-15-306 Airport Finance
Funding for capital development for national system airports comes from five main sources: airport-generated net income, federal AIP grants, PFCs, capital contributions, and state grants.6
• Airport-generated net income: Airports generate both aeronautical revenues, such as revenues earned from leases with airlines and landing fees, and non-aeronautical revenues, such as earnings from terminal concessions and parking fees. For purposes of this report, we are defining “airport-generated net income” as revenue available for capital development after airports pay operating expenses, such as personnel and utility costs, but prior to subtracting depreciation expense. Airport-generated net income also includes revenue available for debt service on the principal for bonds issued to fund capital projects.
• AIP grants: Congress determines, in appropriations acts, the total amount of annual AIP funding to make available from the Airport and Airway Trust Fund,7 which is itself funded by a variety of aviation-related taxes, such as taxes on tickets, cargo, general aviation gasoline, and jet fuel.8
6In addition to these funding sources, private investment is another option for funding airport development. While privatization of an entire airport has seldom been used in the United States, many public-sector airport owners have engaged the private sector through a variety of partnerships ranging from management contracts to development agreements to reduce costs, improve services, and obtain capital investment without transferring airport control. See GAO, Airport Privatization: Limited Interest despite FAA’s Pilot Program,
AIP grants must be used for eligible and justified projects, which are planned and prioritized by airports, included in their capital improvement plans, and reviewed and approved by FAA staff and the Secretary of Transportation. The distribution system for AIP grants is complex. It is based on a combination of formula grants—which are often referred to as “entitlement grants” in this program—that go to all national system airports, and discretionary grants that FAA awards for selected eligible
GAO-15-42 (Washington, D.C.: Nov. 19, 2014). 7AIP is funded through a combination of contract authority authorized in the FAA authorization legislation as well as discretionary funding. Contract authority is the authority to incur obligations in advance or in excess of an appropriation. The obligation is paid through a subsequent appropriation. Congress sets an amount FAA can obligate during a fiscal year in appropriations acts. 8According to FAA, at the end of fiscal year 2014, the trust fund had an uncommitted balance of $5.7 billion.

Page 7 GAO-15-306 Airport Finance
projects.9 Importantly, under current law, the AIP includes what is referred to as a “trigger” mechanism—that is, whenever the annual amount made available in appropriations acts for AIP is $3.2 billion or more, the amount of entitlement grant funding distributed to all airports is doubled.10 For all AIP-funded projects, the airport must provide a share of matching funds. The federal share is from 75 to 90 percent depending on the size of the airport or type of project.11
• PFC collections: The PFC is a federally authorized fee that commercial airport sponsors can levy on passengers to help pay for capital development. Commercial airports must designate which projects PFCs will fund and must seek and obtain FAA’s approval to charge a PFC. On behalf of the airports, airlines collect the PFC at the time of the ticket purchase and remit the PFC, minus an administrative fee, to the airport. Legislation in 2000 raised the PFC cap to $4.50 per flight segment, with an $18 limit on the total PFCs that a passenger can be charged per round trip.
12 Large and medium hub airports that collect PFCs of $3 or less per flight segment have their AIP entitlement funding reduced by 50 percent; such airports that collect PFCs of more than $3 have their AIP entitlement funding reduced by 75 percent. Most of these reductions are then distributed to smaller airports through the AIP.13
• Capital contributions: Capital contributions are funds contributed for infrastructure projects by the airport sponsor or entities that use the airport, such as airlines or tenants.
9For commercial airports, entitlements are determined based on a formula that includes the number of passengers. For general aviation airports, the entitlement amount is the lesser of $150,000 or 1/5 of an airport’s 5-year development cost listed in the biennial NPIAS report when the $3.2 billion trigger is activated per 49 U.S.C. § 47114(d)(3)(A). 10Specifically, when the trigger is met, two types of entitlements are doubled (primary and Alaska supplemental). Another category of entitlements, nonprimary entitlements, is created with funds from state apportionment when the trigger is met. 11There are two exceptions: the federal share is 95 percent of the project cost for smaller airports in areas that receive Essential Air Service and are designated as Economically Distressed Areas, and 70 percent for airports that have been privatized under the Airport Privatization Pilot Program. The Essential Air Service program maintains a minimal level of scheduled air service to small communities that otherwise would not be profitable. 1249 U.S.C. § 40117(b)(4). 13AIP reductions for large and medium hubs (often referred to as the “AIP turnback”) are allocated to the AIP Small Airport Fund (87.5 percent) and to AIP discretionary grants (12.5 percent).

Page 8 GAO-15-306 Airport Finance
• State grants: Airports can also obtain infrastructure funding from state grants. This money is often used to provide the airport’s share of matching funds required for AIP-funded projects.
In addition to these funding sources, some airports also issue bonds—a financing mechanism—to fund infrastructure projects. Bonds allow an airport to fund a project up front and pay for its cost, plus interest, over a much longer time frame compared to the construction of the project. Because many U.S. airports are owned by states, counties, cities, or public authorities, bonds issued by these entities to support airport projects may qualify as tax-exempt bonds for federal tax purposes. The tax-exempt status enables airports to issue bonds at lower interest rates than taxable bonds, thus reducing a project’s financing costs. Tax-exempt bonds can be issued at lower rates because the federal income tax exclusion on the interest paid by the purchasers can make these investments more attractive to investors than taxable bonds.14
From the perspective of the federal government, the foregone tax revenue from these bonds is effectively another form of federal assistance to airports.
14However, the interest income from most airport bonds is included as income when calculating the alternative minimum tax—a separate income-tax calculation intended to ensure that higher-income taxpayers pay at least a minimum tax. Individuals with high levels of exemptions, deductions, and credits relative to income may be subject to the alternative minimum tax.

Page 9 GAO-15-306 Airport Finance
For fiscal years 2009 through 2013, airports had an average of $10 billion annually available for capital development from the following combined funding sources: airport-generated net income, AIP grants, PFC collections, capital contributions, and state grants.15 As shown in table 1, although the gross amount of funding received by airports was $13.3 billion, $3.3 billion from airport-generated net income and PFC collections was used to pay interest on debt, thus leaving $10 billion available for capital development. Of this $10 billion, the largest sources of available funding were airport-generated net income ($3.8 billion), AIP grants ($3.3 billion), and PFCs ($1.8 billion).16
In addition to these sources of funding, some airport authorities and state or local governments also issue bonds to pay for capital development projects. However, bonds are used by airports to pay for projects within a certain time frame, with the payback of the bond generally taking place over a much longer period of time and paid back with other sources of funding such as airport-generated net income and PFCs. As such, we do not view bond issuances as a direct source of funds available for capital development, but rather as a financing mechanism; we will discuss bonds separately following our discussion of funding sources.
15For this section of the report on capital-project funding sources, we report all amounts in nominal dollars. Throughout the report, all dollar amounts and percentages cited in the text are approximate. See the tables for more precise numbers. 16These amounts represent net amounts available for capital development. For airport-generated net income and PFCs, gross amounts were $6.1 billion and $2.7 billion, respectively. For these two funding sources, we subtracted payments on bond interest because these costs are financing rather than project costs, and the estimated planned development costs largely exclude financing costs. (See app. I on our scope and methodology for additional details about the treatment of financing costs in cost estimates of planned development projects.) Although airport-generated net income and PFCs are used to pay bond principal, we did not subtract principal payments from airport-generated income and PFCs because we are not including bond proceeds as a source of funding. Also, we did not subtract depreciation expense from airport-generated net income.
Airports Averaged $10 Billion Annually in Capital Project Funding for Fiscal Years 2009 through 2013, from a Variety of Sources

Page 10 GAO-15-306 Airport Finance
Table 1: Sources of Airport Funding Available for Capital Projects, Annual Averages for Fiscal Years 2009-2013
Dollars (in millions)a
Funding source
Gross average annual
funding
Average annual interest
expense paid with funding
sourceb
Net average annual funding
available for capital projects Description
Airport–generated net income
$6,083 ($2,264) $3,818 Airport operating revenues and interest income in excess of airport operating expenses, prior to subtracting depreciation expense.c Revenues consist of (1) “airside” revenues derived from the operation and landing of aircraft, passengers, or freight and (2) “landside” revenues derived from concessions and leases.
Airport Improvement Program grants
3,304 NA 3,304 Congress makes funds available from the Airport and Airway Trust Fund, which receives revenue from various aviation-related taxes.
Passenger facility charge (PFC) collections
2,744 (986) 1,757 Funds come from passenger fees of up to $4.50 per trip segment at commercial airports.c
Capital contributions 644 NA 644 Funds contributed by the airport’s sponsor, which is often a state or municipality, or by other sources, such as an airline.
State grants
477 NA 477 Funds include state grants and matching funds for Airport Improvement Program grants.
Total $13,251 ($3,251) $10,000
Sources: GAO analysis of Federal Aviation Administration (FAA) data and data obtained from GAO’s survey of state aviation officials. | GAO-15-306
Note: Dollar amounts may not sum to totals because of rounding. aDollar amounts are in nominal dollars. bWe subtract interest payments from airport-generated income and PFC collections because these costs are financing rather than project costs, and the estimated costs of planned development projects largely exclude financing costs. (See app. I on our scope and methodology for additional details about the treatment of financing costs in cost estimates of planned development projects.) To subtract interest payments, we obtained data on total interest expenses from FAA’s airport financial reports database. We estimated the percentage of PFC collections used to pay interest expenses—36 percent—based on FAA data on PFC application approvals. We assumed that the remaining interest expenses were paid with airport-generated net income. cEven though airport-generated net income and PFC collections are used to pay bond principal, we do not subtract bond principal payments because we do not include bond proceeds as a source of funding.
The total amounts as well as the shares of funding by source differ between larger and smaller airports. Of the annual average of $10 billion in funding available for capital projects, larger airports accounted for 66

Page 11 GAO-15-306 Airport Finance
percent ($6.6 billion), while smaller airports accounted for the other 34 percent ($3.4 billion).17
Furthermore, as shown in figure 2, larger airports are more dependent than are smaller airports on airport-generated net income, which contributed 53 percent of larger airports’ total funding compared to 9 percent of smaller airports’ total funding. In contrast, larger airports are less dependent than are smaller airports on AIP grants, which contributed 15 percent of larger airports’ total funding compared to 69 percent of smaller airports’ total funding.
17We follow the convention used in GAO’s prior report on airport finance in differentiating between “larger” airports (all large and medium hubs) and “smaller” airports (all other categories of commercial and general aviation airports in the national airport system). See GAO-07-885. The number of airports in the NPIAS varies over time. Based on prior NPIAS reports that provide data on the number of existing airports for dates that fall within the time frame of our analysis (fiscal years 2009 to 2013), there were 66 larger airports and 3,266 smaller airports as of February 2010, and there were 65 larger airports and 3,265 smaller airports as of February 2012.

Page 12 GAO-15-306 Airport Finance
Figure 2: Sources of Airport Funding Available for Capital Projects, Annual Averages by Size of Airport for Fiscal Years 2009-2013
Note: Dollar amounts may not sum to totals because of rounding. aLarger airports include large and medium hubs. The number of airports in FAA’s National Plan of Integrated Airport Systems (NPIAS) varies over time. Based on prior NPIAS reports that provide data on the number of existing airports as of dates that fall within the time frame of our analysis (fiscal years 2009 to 2013), there were 66 larger airports as of February 2010, and there were 65 larger airports as of February 2012. However, each of these airports may not have received funding from every source. bSmaller airports include small hubs, non-hubs, nonprimary commercial service airports, relievers, and general aviation airports. The number of airports in the NPIAS varies over time. Based on prior NPIAS reports that provide data on the number of existing airports as of dates that fall within the time frame of our analysis (fiscal years 2009 to 2013), there were 3,266 smaller airports as of February 2010, and there were 3,265 smaller airports as of February 2012. However, each of these airports may not have received funding from every source. cDollar amounts are in nominal dollars. dEven though airport-generated net income and passenger facility charge (PFC) collections are used to pay bond principal, we do not subtract bond principal payments because we do not include bond proceeds as a source of funding. We do, however, subtract payments on bond interest from airport-generated net income and PFC collections because these costs are financing rather than project costs, and the estimated costs of planned development projects largely exclude financing costs (see appendix I on our scope and methodology for additional details about the treatment of financing costs in cost estimates of planned development projects). The gross average annual amounts of airport-generated net income for larger and smaller airports were $5,665 million and $418 million, respectively; the gross average annual amounts of PFCs for larger and smaller airports were $2,456 million and $288 million, respectively.

Page 13 GAO-15-306 Airport Finance
For fiscal years 2009 through 2013, airport-generated net income available for capital development projects averaged $3.8 billion annually. As shown in figure 3, this type of income increased fairly steadily over the time period, from $3.4 billion to $4.2 billion (an increase of 24 percent).18
Figure 3: Airport-Generated Net Income, Fiscal Years 2009-2013
Notes: Even though airport-generated net income is used to pay bond principal, we do not subtract bond principal payments from airport-generated net income because we do not include bond proceeds as a source of funding. We do, however, subtract payments on bond interest from airport-generated income because these costs are financing rather than project costs, and the estimated costs of planned development projects largely exclude financing costs (see appendix I on our scope and methodology for additional details about the treatment of financing costs in cost estimates of planned development projects). To estimate the amount of airport-generated income used to pay bond interest, we first estimated the amount of passenger facility charge (PFC) collections used to pay bond interest—36 percent, or an annual average of $986 million—based on FAA data on PFC application approvals. We then assumed that the remaining interest expenses—an annual average of $2,264 million—were paid with airport-generated net income.
18Inflation during the time period totaled 6.5 percent.
Airport-Generated Net Income
Page 14 GAO-15-306 Airport Finance
aAmounts are in nominal dollars. Inflation during the time period totaled 6.5 percent. bSmaller airports include predominantly small hubs, non-hubs, and non-primary commercial service airports, as well as a few relievers and general aviation airports. For fiscal years 2009 through 2013, the number of smaller airports reporting annual financial data to FAA ranged from to 401 to 449. cLarger airports include large and medium hubs. For fiscal years 2009 to 2013, the number of larger airports reporting annual financial data to FAA ranged from 64 to 72.
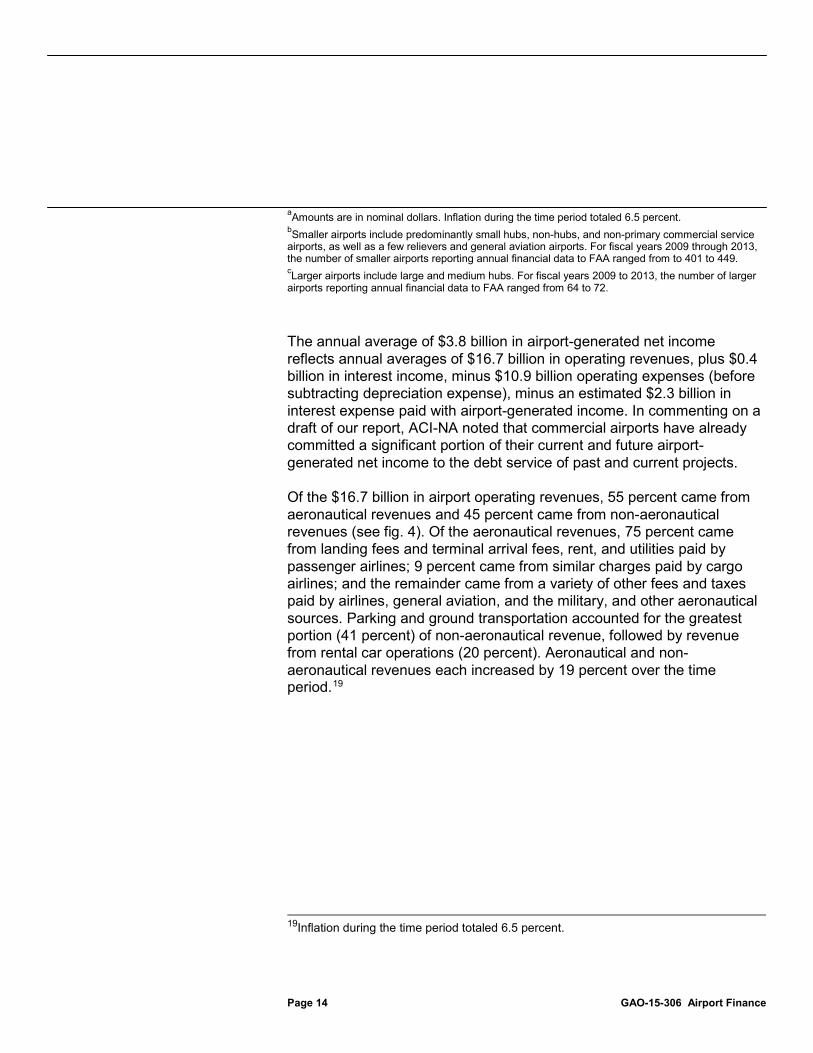
The annual average of $3.8 billion in airport-generated net income reflects annual averages of $16.7 billion in operating revenues, plus $0.4 billion in interest income, minus $10.9 billion operating expenses (before subtracting depreciation expense), minus an estimated $2.3 billion in interest expense paid with airport-generated income. In commenting on a draft of our report, ACI-NA noted that commercial airports have already committed a significant portion of their current and future airport-generated net income to the debt service of past and current projects.
Of the $16.7 billion in airport operating revenues, 55 percent came from aeronautical revenues and 45 percent came from non-aeronautical revenues (see fig. 4). Of the aeronautical revenues, 75 percent came from landing fees and terminal arrival fees, rent, and utilities paid by passenger airlines; 9 percent came from similar charges paid by cargo airlines; and the remainder came from a variety of other fees and taxes paid by airlines, general aviation, and the military, and other aeronautical sources. Parking and ground transportation accounted for the greatest portion (41 percent) of non-aeronautical revenue, followed by revenue from rental car operations (20 percent). Aeronautical and non-aeronautical revenues each increased by 19 percent over the time period.19
19Inflation during the time period totaled 6.5 percent.

Page 15 GAO-15-306 Airport Finance
Figure 4: Sources of Aeronautical and Non-Aeronautical Revenue for All Commercial Airports (Based on Average Annual Airport Operating Revenues for Fiscal Years 2009-2013)
Dollars (in millions)a
Note: Percentages may not sum to 100 percent because of rounding. aDollar amounts are in nominal dollars. bFees charged to fixed-base operations (FBO) are for the use of airport facilities and land. FBOs are typically privately owned businesses that provide flight and aircraft support services to aeronautical users of the airport, such as the sale of aircraft fuel, aircraft maintenance, and hangar facilities. cOther aeronautical revenue includes other fees paid by passenger airlines for aeronautical services or use of terminals and nearby areas, such as security fees, fees for federal inspections of international passengers, and fees for parking or tying down aircraft near terminals; landing fees paid by general aviation users and the military; non-passenger aviation fuel tax retained for airport use; non-passenger aviation security reimbursement from the federal government; and other non-passenger aeronautical uses. dOther non-aeronautical revenue includes revenue from all other non-aeronautical use of the airport.

Page 16 GAO-15-306 Airport Finance
For fiscal years 2009 through 2013, national system airports received an average of $3.3 billion annually in AIP grant funding.20 As shown in figure 5, the amount of AIP grants received was fairly steady at $3.3 billion to $3.4 billion from fiscal year 2009 to fiscal year 2012 and then decreased to $3 billion in fiscal year 2013, representing a decrease of 11 percent from fiscal year 2009.21 According to an FAA airports official, this decrease was due in part to slightly lower appropriations in fiscal years 2012 and 2013 and the congressionally authorized transfer of $253 million in unobligated funds from AIP to FAA operations to reduce furloughs of air traffic controllers in fiscal year 2013.22
20This average amount does not include $1,060 million in grants awarded in fiscal year 2009 and $13 million in grants awarded in fiscal year 2010. Both of these excluded amounts were not part of FAA’s regular appropriations, but rather were included in a $1.1 billion supplemental appropriation under the American Recovery and Reinvestment Act of 2009.
21Inflation during the time period totaled 6.5 percent. 22Pub. L. No. 113-9, § 2(c), 127 Stat. 443 (2013).
Airport Improvement Program Grants

Page 17 GAO-15-306 Airport Finance
Figure 5: Airport Improvement Program (AIP) Grants to Airports, Fiscal Years 2009-2013
aDollar amounts are in nominal dollars. Inflation during the time period totaled 6.5 percent. bFiscal year 2009 amount does not include $1,060 million in grants awarded from a $1.1-billion supplemental appropriation under the American Recovery and Reinvestment Act of 2009. cFiscal year 2010 amount does not include $13 million in grants awarded from a $1.1-billion supplemental appropriation under the American Recovery and Reinvestment Act of 2009. dSmaller airports include small hubs, non-hubs, non-primary commercial service airports, relievers, and general aviation airports. Also included under smaller airports are some grants to proposed airports and planning agencies as well as state block grants. For fiscal years 2009 through 2013, the annual number of smaller airports that received AIP grants ranged from 1,323 to 1,618. eLarger airports include large and medium hubs. For fiscal years 2009 through 2013, the annual number of larger airports that received AIP grants ranged from 60 to 67.
In fiscal years 2009 to 2013, smaller airports received 71 percent of AIP grants (an annual average of $2.3 billion), compared to 29 percent received by larger airports (an annual average of $961 million). Also, as noted above, smaller airports are more reliant on AIP grants for capital funding, with 69 percent of their available funding coming from these grants, compared to 15 percent for larger airports. As shown in table 2, for both larger and smaller airports, the largest share of AIP grants went

Page 18 GAO-15-306 Airport Finance
toward reconstruction projects (33 percent and 34 percent, respectively). The next largest share for larger airports was for projects to enhance airfield capacity (29 percent), while for smaller airports the next largest share was for projects to meet FAA’s airport design standards (23 percent).
Table 2: Airport Improvement Program (AIP) Grants by Airport Size and Purpose, Annual Averages for Fiscal Years 2009-2013
Dollars (in millions)a
Purpose Description All airports Larger
airportsb Smaller
airportsc Reconstruction Replace or rehabilitate airport facilities, primarily airfield
pavement and lighting $1,100 (33%) $313 (33%) $786 (34%)
Standards Accommodate new or different aircraft by bringing runways, taxiways, and aprons up to Federal Aviation Administration (FAA) design standards
618 (19) 76 (8) 542 (23)
Capacity Reduce delay or accommodate more passengers, cargo, aircraft operations, or based aircraft with, for example, new or extended runways, taxiways, and aprons
383 (12) 279 (29) 104 (4)
Safety Enhance safety by, for example, lighting or removing obstructions, acquiring fire and rescue equipment, and improving runway safety areas
316 (10) 83 (9) 234 (10)
Block grants Block grants to 10 FAA-designated states; states administer the grants and determine how to apportion funds among development projects at nonprimary airports
232 (7) 0 (0) 232 (10)
Noise Mitigate noise by, for example, relocating households and sound insulation of residences and public buildings
217 (7) 153 (16) 64 (3)
Terminal Accommodate more passengers, larger aircraft, new security requirements, and increased competition among airlines by modifying, replacing, and constructing passenger terminal buildings
164 (5) 18 (2) 146 (6)
New airports Proposed new airports for communities that do not have an airport, or with an airport that can neither be expanded to meet forecasted demand nor improved to meet minimum standards of safety and efficiency
80 (2) 0 (0) 80 (3)
Planning Studies to define and prioritize specific airport development needs, including airport master planning and system planning
64 (2) 9 (1) 55 (2)
Security Enhance security by, for example, installing perimeter fencing and security devices
44 (1) 8 (1) 36 (2)
Other Examples include fuel farms, navigational aids, utilities, and parking lots
33 (1) 4 (0.4) 28 (1)
Environment Mitigate environmental impacts by, for example, constructing deicing handling and recycling facilities, replacing impacted wetlands, and investing in low-emission airport technologies
30 (1) 12 (1) 18 (1)

Page 19 GAO-15-306 Airport Finance
Dollars (in millions)a
Purpose Description All airports Larger
airportsb Smaller
airportsc Access Highway and transit access to the airport (within the airport
property line) 22 (1) 4 (0.4) 19 (1)
Total $3,304 (100%) $961 (100%) $2,343 (100%)
Source: GAO analysis of Federal Aviation Administration data. | GAO-15-306
Note: Dollar amounts and percentages may not sum to totals because of rounding. aDollar amounts are in nominal dollars. bLarger airports include large and medium hubs. For fiscal years 2009 through 2009 to 2013, the annual number of larger airports that received AIP grants ranged from 60 to 67. cSmaller airports include small hubs, non-hubs, non-primary commercial service airports, relievers, and general aviation airports. Also included under smaller airports are some grants to proposed airports and planning agencies as well as state block grants. For fiscal years 2009 through 2009 to 2013, the annual number of smaller airports that received AIP grants ranged from 1,323 to 1,618.
For fiscal years 2009 through 2013, commercial airports had an annual average of $1.8 billion of their PFC collections available for capital projects.23 Ninety percent of that amount was collected by larger airports. As shown in figure 6, the annual amount of PFC collections increased slightly over the time period, from $1.7 billion to $1.8 billon (an increase of 8 percent).24
23General aviation airports had an annual average of $125,000 of their PFC collections available for capital projects. FAA approved these airports for PFC collections while they were commercial service airports. As the industry has consolidated, these airports lost carriers and traffic, and are no longer commercial service airports. FAA allows these airports to continue collecting PFCs until they have collected the approved amounts and to use any PFC revenue that they collect.
24Inflation during the time period totaled 6.5 percent.
Passenger Facility Charge Collections

Page 20 GAO-15-306 Airport Finance
Figure 6. Passenger Facility Charge (PFC) Collections Available for Airport Capital Development, Fiscal Years 2009-2013
Note: Even though PFC collections are used to pay bond principal, we do not subtract bond principal payments from PFC collections because we do not include bond proceeds as a source of funding. We do, however, subtract payments on bond interest from PFC collections because these costs are financing rather than project costs, and the estimated costs of planned development projects (as presented in the National Plan of Integrated Airport Systems) do not include financing costs. We estimated the amount of PFC collections used to pay bond interest—36 percent, or an annual average of $986 million—based on FAA data on PFC application approvals. aDollar amounts are in nominal dollars. Inflation during the time period totaled 6.5 percent. bSmaller airports include small hubs, non-hubs, non-primary commercial service airports, and general aviation airports. For fiscal years 2009 through 2013, the annual number of smaller airports that collected PFCs ranged from 295 to 304. cLarger airports include large and medium hubs. For fiscal years 2009 through 2013, the annual number of larger airports that collected PFCs ranged from 60 to 65.
Although we did not analyze data on airports’ expenditures of PFC revenues by project type from 2009 through 2013, we did obtain data on airports’ FAA-approved applications showing the types of projects for

Page 21 GAO-15-306 Airport Finance
which airports intended to spend their PFC revenue.25
FAA’s data on airports’ PFC applications show that from 1990 through August 2014, FAA approved airports’ applications to collect a total of $90 billion in PFCs. Of the $90 billion in approved collections, 34 percent has been committed for landside projects, such as terminals; 34 percent for the interest payments on debt used to pay for capital projects; and 18 percent for airside projects, such as runways and taxiways. (See fig. 7.) The $90 billion includes future approved PFC collections; in December 2014, we reported that about a third of collecting airports had been approved to collect PFCs to 2024 or later.
25Although airports are required to report PFC expenditures against the various applications and projects, we could not draw any particular conclusions from data on how PFCs were spent from 2009 to 2013, mainly because airports can spend collected PFC revenues on any approved PFC project in whatever order they choose. In addition, applications and associated approvals are not constrained to particular outlay rates.

Page 22 GAO-15-306 Airport Finance
Figure 7: Federal Aviation Administration-Approved Passenger Facility Charges by Type of Project, 1990 through February 2014
Dollars (in millions)a
Notes: Dollar amounts may not sum to totals and percentages may not sum to 100 percent because of rounding. Dollar amounts are in nominal dollars. Dates in figure title apply to the approval of PFC applications. Some PFC collections will occur in the future and some of these approvals are to reimburse airports for PFC-eligible projects that occurred prior to this timeframe. aDollar amounts are in nominal dollars. bFAA reported 3.5 percent of PFCs separately for the new Denver International Airport because it was a large stand-alone project and the FAA approval did not delineate how the PFCs would be applied to the various categories of costs within the overall new airport project.
As noted above, roughly a third of all past PFC collections were committed to the interest payments on debt used to pay for capital projects. When PFCs going toward the principal payments on debt are considered along with the interest payments, airports can be in a position of having committed large portions of future PFCs to debt service. We found that data from PFC applications for projects with start dates from 2009 through 2013 indicate that airports plan to spend 74 percent of their PFC revenues on debt service—38 percent on principal payments and 36 percent on interest payments. Airport association representatives and two airport consultants with whom we spoke pointed out that commercial
Page 23 GAO-15-306 Airport Finance
airports have already committed a significant portion of their current and future PFCs to the debt service of past and current projects and therefore have, and will continue to have, correspondingly less PFC funding available for new projects at current PFC rates.
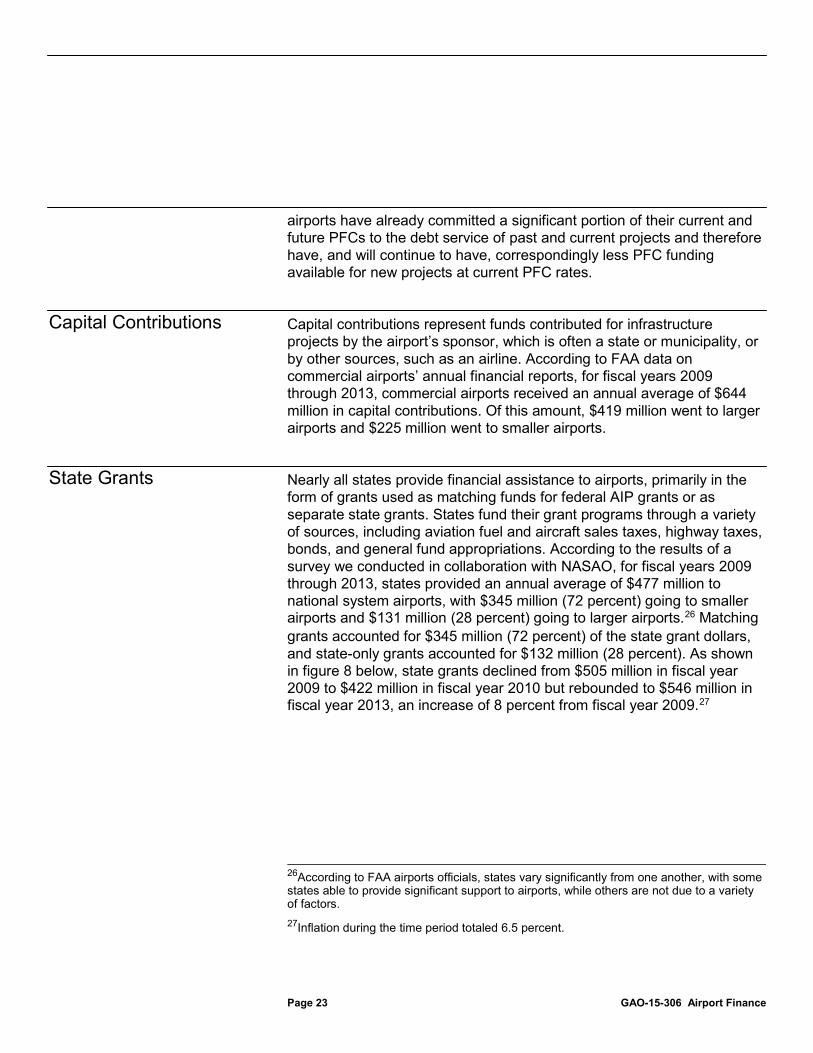
Capital contributions represent funds contributed for infrastructure projects by the airport’s sponsor, which is often a state or municipality, or by other sources, such as an airline. According to FAA data on commercial airports’ annual financial reports, for fiscal years 2009 through 2013, commercial airports received an annual average of $644 million in capital contributions. Of this amount, $419 million went to larger airports and $225 million went to smaller airports.
Nearly all states provide financial assistance to airports, primarily in the form of grants used as matching funds for federal AIP grants or as separate state grants. States fund their grant programs through a variety of sources, including aviation fuel and aircraft sales taxes, highway taxes, bonds, and general fund appropriations. According to the results of a survey we conducted in collaboration with NASAO, for fiscal years 2009 through 2013, states provided an annual average of $477 million to national system airports, with $345 million (72 percent) going to smaller airports and $131 million (28 percent) going to larger airports.26 Matching grants accounted for $345 million (72 percent) of the state grant dollars, and state-only grants accounted for $132 million (28 percent). As shown in figure 8 below, state grants declined from $505 million in fiscal year 2009 to $422 million in fiscal year 2010 but rebounded to $546 million in fiscal year 2013, an increase of 8 percent from fiscal year 2009.27
26According to FAA airports officials, states vary significantly from one another, with some states able to provide significant support to airports, while others are not due to a variety of factors.
27Inflation during the time period totaled 6.5 percent.
Capital Contributions
State Grants

Page 24 GAO-15-306 Airport Finance
Figure 8: State Grants to Airports, Fiscal Years 2009-2013
aDollar amounts are in nominal dollars. Inflation during the time period totaled 6.5 percent. bSmaller airports include small hubs, non-hubs, non-primary commercial service airports, relievers, and general aviation airports. Our survey of state aviation officials did not request data on the number of airports receiving state grants. The number of airports in the NPIAS varies over time. Based on prior NPIAS reports that provide data on the number of existing airports as of dates that fall within the time frame of our analysis (fiscal years 2009 to 2013), there were 3,266 smaller airports as of February 2010, and there were 3,265 smaller airports as of February 2012. However, each of these airports may not have received a state grant each year. cLarger airports include large and medium hubs. Our survey of state aviation officials did not request data on the number of airports receiving state grants. Based on prior NPIAS reports that provide data on the number of existing airports as of dates that fall within the time frame of our analysis (fiscal years 2009 to 2013), there were 66 larger airports as of February 2010, and there were 65 larger airports as of February 2012. However, each of these airports may not have received a state grant each year.
Some airport sponsors obtain financing for capital development projects by issuing bonds or accessing various types of short-term debt. However, as previously discussed, bonds represent a financing mechanism whereby airport authorities and sponsors borrow to finance investments up front that they then pay back with other funds that are earned and obtained over a much longer time frame, such as airport-generated net
Bonds

Page 25 GAO-15-306 Airport Finance
income and PFCs. We therefore did not include bond proceeds in our calculation of funds available for airport capital development.28
Based on our analysis of data from Thomson Reuters on airport bond issuances, from 2009 to 2013, airports obtained an average of $6.3 billion per year for new projects by issuing bonds. Bond financing has traditionally been an option exercised by larger airports because they are more likely to have a greater and more certain revenue stream to support repayment of debt. Smaller airports tend to be less reliant on bonds and, to the extent that they do issue bonds, make greater use of general obligation bonds that are backed by the tax revenues of the airport sponsor, which is often a state or municipal government. Data from FAA’s airport financial-reporting system indicate that from fiscal year 2009 to fiscal year 2013, 94 percent of bond proceeds—including both new bonds and refinancing—went to larger airports and 6 percent went to smaller airports.
Doing so would have led to double counting sources of funds.
29
28Because we did not include bond proceeds as an available source of funding, we did not exclude payments on bond principal (i.e., we did not subtract such payments from total available funding). We did, however, subtract payments on bond interest, because these are financing costs rather than project costs, and the estimated costs of planned development projects generally do not include financing costs. (See app. I on our scope and methodology for additional details about the treatment of financing costs in cost estimates of planned development projects.)
As shown in figure 9 below, the total amount of bond proceeds for new projects varied from year to year, with a much larger amount in fiscal year 2010. The total amount of debt carried by airports has grown since fiscal year 2009, from over $71 billion to over $83 billion in fiscal year 2013, according to FAA data on airports’ annual financial reports. Consistent with the larger amount of bond proceeds in fiscal year 2010, most of the increase in airport debt occurred in fiscal year 2010.
29The Thomson Reuters data that we analyzed to estimate proceeds from new bonds does not include complete information on which airports benefitted from those bond proceeds, and therefore, we did not determine the amounts of those proceeds that went to larger versus smaller airports.

Page 26 GAO-15-306 Airport Finance
Figure 9: Airport Bond Proceeds for New Capital Development Projects, 2009-2013
aDollar amounts are in nominal dollars. Inflation during the time period totaled 6.5 percent.
According to an airport association, the larger amount of bond proceeds in 2010 was due to low interest rates and to airport sponsors seeking to take advantage of a provision of the American Recovery and Reinvestment Act of 2009 that exempted interest income on new issuances of private activity bonds from the alternative minimum tax (AMT) in 2009 and 2010.30
30Pub. L. No. 111-5, § 1503, 123 Stat. 115, 354 (2009), amending 26 U.S.C. §§ 56, 57.
In 2011, the Department of Transportation’s (DOT) Federal Aviation Advisory Committee recommended that DOT support extending the AMT exemption, and airport associations have supported a permanent exemption. In May 2012, DOT sent a letter to Congress supporting inclusion of an extension of the AMT exemption for all private activity bonds, including airport private activity bonds, in the
Page 27 GAO-15-306 Airport Finance
Moving Ahead for Progress in the 21st Century Act.31 However, the AMT exemption was not included in the final legislation.32
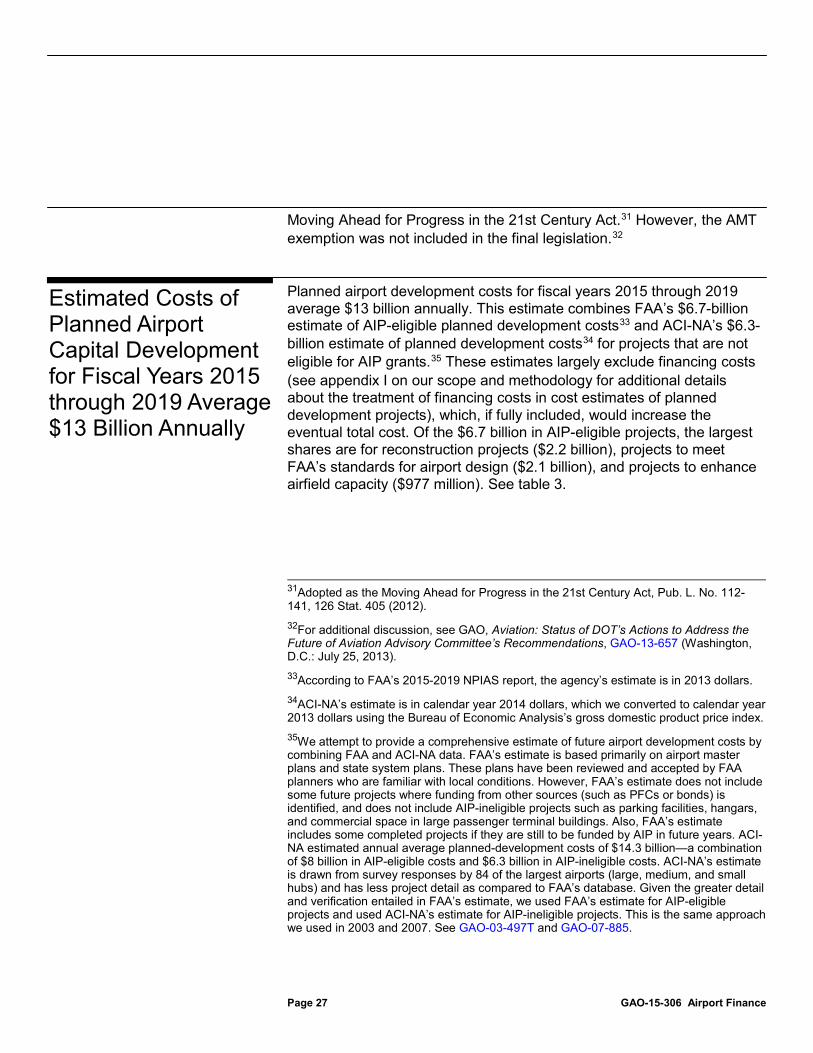
Planned airport development costs for fiscal years 2015 through 2019 average $13 billion annually. This estimate combines FAA’s $6.7-billion estimate of AIP-eligible planned development costs33 and ACI-NA’s $6.3-billion estimate of planned development costs34 for projects that are not eligible for AIP grants.35
31Adopted as the Moving Ahead for Progress in the 21st Century Act, Pub. L. No. 112-141, 126 Stat. 405 (2012).
These estimates largely exclude financing costs (see appendix I on our scope and methodology for additional details about the treatment of financing costs in cost estimates of planned development projects), which, if fully included, would increase the eventual total cost. Of the $6.7 billion in AIP-eligible projects, the largest shares are for reconstruction projects ($2.2 billion), projects to meet FAA’s standards for airport design ($2.1 billion), and projects to enhance airfield capacity ($977 million). See table 3.
32For additional discussion, see GAO, Aviation: Status of DOT’s Actions to Address the Future of Aviation Advisory Committee’s Recommendations, GAO-13-657 (Washington, D.C.: July 25, 2013). 33According to FAA’s 2015-2019 NPIAS report, the agency’s estimate is in 2013 dollars. 34ACI-NA’s estimate is in calendar year 2014 dollars, which we converted to calendar year 2013 dollars using the Bureau of Economic Analysis’s gross domestic product price index. 35We attempt to provide a comprehensive estimate of future airport development costs by combining FAA and ACI-NA data. FAA’s estimate is based primarily on airport master plans and state system plans. These plans have been reviewed and accepted by FAA planners who are familiar with local conditions. However, FAA’s estimate does not include some future projects where funding from other sources (such as PFCs or bonds) is identified, and does not include AIP-ineligible projects such as parking facilities, hangars, and commercial space in large passenger terminal buildings. Also, FAA’s estimate includes some completed projects if they are still to be funded by AIP in future years. ACI-NA estimated annual average planned-development costs of $14.3 billion—a combination of $8 billion in AIP-eligible costs and $6.3 billion in AIP-ineligible costs. ACI-NA’s estimate is drawn from survey responses by 84 of the largest airports (large, medium, and small hubs) and has less project detail as compared to FAA’s database. Given the greater detail and verification entailed in FAA’s estimate, we used FAA’s estimate for AIP-eligible projects and used ACI-NA’s estimate for AIP-ineligible projects. This is the same approach we used in 2003 and 2007. See GAO-03-497T and GAO-07-885.
Estimated Costs of Planned Airport Capital Development for Fiscal Years 2015 through 2019 Average $13 Billion Annually

Page 28 GAO-15-306 Airport Finance
Table 3: Estimated Cost of Planned Airport Capital Development, Annual Average for Fiscal Years 2015-2019
2013 dollars (in millions)
Project type Estimated average
annual costs Percentage of total Eligible for Airport Improvement Program grants (Federal Aviation Administration’s estimates)
Reconstruction $2,212 17.0 Standards 2,103 16.2 Capacity 977 7.5 Terminal 391 3.0 Safety 238 1.8 Noise 227 1.7 Access 182 1.4 Security 151 1.2 Environmental 114 0.9 New airports 59 0.5 Other 51 0.4 Subtotal $6,703 51.5 Ineligible for Airport Improvement Program grants (Airports Council International-North America’s estimates)
$6,312 48.5
Total $13,016 100.0
Source: GAO analysis of Federal Aviation Administration and Airports Council International-North America data. | GAO-15-306
Note: Dollar amounts and percentages may not sum to subtotals or totals because of rounding.
The amount and purpose of planned development differs between larger and smaller airports. Of the annual average $13 billion in planned development, larger airports, which handled 88 percent of the passenger traffic in 2013, accounted for $8.4 billion (65 percent) and smaller airports accounted for $4.6 billion (35 percent). As shown in table 4, the greatest shares of larger airports’ AIP-eligible planned development are for reconstruction projects ($771 million) and projects to enhance airfield capacity ($765 million). The greatest shares of smaller airports’ planned development are for projects to meet FAA’s airport design standards ($1.9 billion) and reconstruction projects ($1.4 billion).

Page 29 GAO-15-306 Airport Finance
Table 4: Estimated Costs of Planned Airport Capital Development by Airport Size, Annual Averages for Fiscal Years 2015-2019
2013 dollars (in millions) Project Type Larger airportsa Smaller airportsb Eligible for Airport Improvement Program grants (Federal Aviation Administration’s estimates)
Reconstruction $771 (9.1%) $1,440 (31.5%) Standards 245 (2.9%) 1,858 (40.7%) Capacity 765 (9.1%) 213 (4.7%) Terminal 120 (1.4%) 271 (5.9%) Safety 84 (1.0%) 154 (3.4%) Noise 174 (2.1%) 53 (1.2%) Access 75 (0.9%) 106 (2.3%) Security 69 (0.8%) 81 (1.8%) Environmental 75 (0.9%) 39 (0.9%) New airports 0 (0.0%) 59 (1.3%) Other 16 (0.2%) 36 (0.8%) Subtotal $2,394 (28.3%) $4,309 (94.3%) Ineligible for Airport Improvement Program grants (Airports Council International-North America’s estimates)
$6,054 (71.7%) $258 (5.7%)
Total $8,449 (100.0%) $4,567 (100.0%)
Source: GAO analysis of Federal Aviation Administration and Airports Council International-North America data. | GAO-15-306
Note: Dollar amounts and percentages may not sum to subtotals or totals because of rounding. aLarger airports include large and medium hubs. bSmaller airports include small hubs, non-hubs, non-primary commercial service airports, relievers, and general aviation airports.
FAA’s estimate of an annual average of $6.7 billion of AIP-eligible development for fiscal years 2015 to 2019 is 24 percent less than FAA’s estimate of $8.8 billion for fiscal years 2013 to 2017. Moreover, FAA’s 2013-2017 estimate was 21 percent less than FAA’s 2011-2015 estimate of $11.1 billion in planned AIP-eligible projects. In the 2015-2019 NPIAS report, FAA attributes the most recent decline to several factors, including the current economic situation and reduced aviation activity levels. In contrast to FAA’s estimate for AIP-eligible development, ACI-NA’s estimate of an annual average of $6.3 billion of AIP-ineligible development for fiscal years 2015 to 2019 represents a 51-percent

Page 30 GAO-15-306 Airport Finance
increase from its 2013-2017 estimate of $4.2 billion.36
An ACI-NA official, as well as FAA officials, told us that this increase partly reflects airports’ increased emphasis on revenue-generating projects, which are generally not eligible for AIP funding. The ACI-NA official also said that they believe that some large airports that responded to ACI-NA’s survey may have classified terminal and other landside projects as fully AIP-ineligible when some portion of these projects may actually have been AIP-eligible; such misclassifications would tend to overstate ACI-NA’s estimate of AIP non-eligible development. Although this could affect the proportion of AIP-eligible to AIP-ineligible planned-development costs, to the extent that airports that reported AIP-eligible costs as ineligible to ACI-NA also did not report those same costs to FAA, our estimate of total planned-development costs is not affected.
After adjusting past funding amounts for inflation, planned airport development for 2015 through 2019 exceeds prior airport funding for 2009 through 2013 by an average of $2.7 billion annually. As discussed above, the funding available from various sources for national system airports’ capital development projects from 2009 through 2013 averaged $10 billion annually, in nominal dollars. Also as discussed above, the national system airports have plans to spend an annual average of $13 billion, in 2013 dollars, on airport capital-development projects from 2015 through 2019. However, these amounts are not comparable because the available funding was reported in nominal dollars—that is, the dollar values in the years these funds were received—and the planned development was reported in 2013 dollars. To make these data comparable, we adjusted the past funding amount to the level that it would be in fiscal year 2013 dollars, assuming that the amount of funding across the various sources would grow, on average, at the general rate of economy-wide inflation.37
36As mentioned previously, ACI-NA estimated total costs of planned development (both AIP eligible and non-eligible) for fiscal years 2015-2019 to be an annual average of $14.3 billion. This is a 3-percent increase from ACI-NA’s prior estimate of $13.9 billion for fiscal years 2013-2017.
The annual average funding level after the inflation adjustment—$10.3 billion per year—is slightly higher than the nominal value of $10 billion. Nonetheless, as shown in figure 10 below,
37Specifically, we used fiscal year-based annual averages of quarterly indexes from the Bureau of Economic Analysis’s gross domestic product price index, as it reflects the general level of inflation for the U.S. economy.
Airports’ Planned Development Exceeds Past Funding Levels, but Several Considerations Affect the Comparison and How Airports Choose to Fund Capital Projects

Page 31 GAO-15-306 Airport Finance
the inflation-adjusted average annual funding level is still $2.7 billion per year (in 2013 dollars) less than planned development.38
Figure 10: Comparison of Past Airport Funding and Planned Development Costs
While this difference is not an absolute predictor of future funding shortfalls—both funding and planned development may change in the future—it is a useful indicator of potential future funding shortfalls that, as discussed below, airports, the states, and Congress can choose to address in a variety of ways.
aAverage annual funding is in fiscal year 2013 dollars and planned development is in calendar year 2013 dollars; the difference between these dollar bases likely has a minimal impact on the comparison of average annual funding and planned development.
The difference between past funding and planned development costs for larger airports is $1.6 billion and for smaller airports is $1.1 billion;
38Average annual funding is in fiscal year 2013 dollars and planned development is in calendar year 2013 dollars; the difference between these dollar bases likely has a minimal impact on the comparison of average annual funding and planned development.

Page 32 GAO-15-306 Airport Finance
however, the difference is proportionately greater for smaller airports. More specifically, planned development is 24 percent greater than past funding for larger airports but is 30 percent greater for smaller airports.39
Airports have a number of options for addressing any shortfall in funding airports’ capital development, including prioritizing capital development projects, financing projects, attempting to increase airport revenues, or entering into public private partnerships. States can also choose to increase state grant funding. Congress also has options in how it chooses to fund AIP or set PFCs, which we will discuss in the next section. For individual airports, a common method for aligning funding with planned development is to prioritize projects. This generally entails decisions about which projects to move forward with and which to defer, but could also include scheduling a project in phases, or reducing the scope of or cancelling a planned project. As mentioned, airports’ AIP-eligible planned development costs declined in the two most recent NPIAS reports. FAA stated in the 2015-2019 NPIAS report that the decline reflected a decrease in planned development for all airport type categories. With regard to the project type categories, FAA noted large decreases in capacity-related and terminal-related projects. At the same time, however, the 2015-2019 NPIAS reported small increases in projects to reconstruct or rehabilitate airport facilities, mostly at large hub airports, and in
We asked state aviation officials—whose primary focus is on smaller airports—if they anticipated that the costs of airports’ planned development would exceed available funding through 2017; a majority of respondents (31 of 45, or 69 percent) said that they thought planned development would exceed funding. These respondents tended to indicate that smaller airports are more likely to be affected by a funding shortfall than larger airports. For example, when asked which types of airports are likely to be particularly affected by the shortfall, 29 respondents (94 percent) indicated general aviation airports, compared to 6 respondents (19 percent) who indicated large hubs. Appendix III compares past funding with planned development for large hub airports; medium hub airports; small hub airports; and the combination of nonhub, nonprimary commercial service, reliever, and general aviation airports.
39Larger airports’ average annual funding was $6.8 billion, compared to an annual average of $8.4 billion in planned development costs. Smaller airports’ average annual funding was $3.5 billion, compared to an annual average of $4.6 billion in planned development.

Page 33 GAO-15-306 Airport Finance
security-related infrastructure projects including perimeter and security fencing and access control systems, mostly at small hub airports.
Stakeholders we spoke with and surveyed discussed the prioritizing of different types of projects. For example, representatives of FAA, three industry associations, and one financial-consulting firm stated that infrastructure projects that affect safety are of the highest priority for airports. In addition to safety, most of these stakeholders also stated that many airports are currently focused on projects to rehabilitate aging physical infrastructure. Similarly, in our survey of state aviation officials, among respondents who anticipated unmet funding needs, safety-related projects were the most often identified type of project (14 respondents) that would be unlikely or very unlikely to be unfunded or delayed. However, 10 respondents reported the converse (i.e., that safety-related projects would be likely or very likely to be unfunded or delayed). Four respondents specifically cited unsafe conditions that would result from unfunded or delayed runway pavement projects. Six respondents cited a potential adverse impact on economic growth or on communities served by airports from a reduction or delay in funding, and 5 respondents noted that project delays would increase future costs, such as repair and maintenance costs.
Another method that airports can use to align funding with capital development is to borrow money to fund a project. Most commonly, this consists of issuing a bond. However, as previously discussed, borrowing has traditionally been an option exercised by larger airports. To be able to finance projects, an airport’s financial situation must be viewed positively enough to be able to borrow money at affordable rates in the bond market. Two of the airport financial-consulting firms with whom we spoke noted that some airports are already leveraged to a large extent and one bond-rating agency stated that taking on additional debt is always a risk. In a December 2013 report, one bond-rating agency noted that the rate of growth in long-term debt for primary airports over the past decade significantly outpaced that of passengers, and that leverage and execution of capital programs would remain key rating factors for many airports, particularly the large hubs. In an August 2014 report, another bond-rating agency noted that increasing leverage was a key consideration in the agency’s downgrading the credit rating of four large hub airports in the previous 3 years. On the other hand, in a February 2015 report, a third rating agency noted that leverage fell for more than half of the 73 airports rated by the agency, due to either paying down debt or limited issuance of new general airport-revenue bonds. Overall, these three bond-rating agencies told us that they continue to give most airports

Page 34 GAO-15-306 Airport Finance
high or stable ratings, and one rating agency representative stated that access to capital markets for larger U.S. airports remains strong.
Another method for airports to fund capital development is to try to increase airport-generated net income. As mentioned, both FAA and ACI-NA officials attributed some of the increase in ACI-NA’s estimate of non-AIP-eligible planned projects to efforts by airports to add revenue-generating infrastructure. We have found in recent prior work that in addition to traditional commercial activities to generate non-aeronautical revenue, such as parking fees or terminal concessions, some airports have developed commercial activities with stakeholders from local jurisdictions and the private sector to help develop airport properties into retail, business, and leisure destinations.40
40For information on factors that may support airport-centric development (i.e., development at and around airports), see GAO, National Airspace System: Airport-Centric Development,
An increasing range of developments on airport property have contributed to non-aeronautical revenues, including hotels and business centers meant to attract and retain business travelers who might otherwise stay off airport property, high-end commercial retail and leisure activities, medical facilities, and specialized cargo handling and refrigerated storage facilities, among other developments (see fig. 11). For example, Dallas/Fort Worth International Airport owns a Grand Hyatt hotel inside Terminal D, Denver International Airport is building an attached Westin Hotel, and Hartsfield-Jackson Atlanta International Airport is considering an airport hotel inside or connected to its domestic terminal. Airports in Denver, Miami, and Indianapolis have built—or plan to build—cold storage facilities on airport property in an effort to generate revenue from freight forwarders and businesses that transport produce, pharmaceuticals, and other time-sensitive or perishable items.
GAO-13-261 (Washington, D.C.: Mar. 28, 2013).

Page 35 GAO-15-306 Airport Finance
Figure 11: Examples of Expanded Services Offered in Some Airport Terminals
Yet another option for funding airport improvements involves private sector participation. We found in our recent study of airport privatization that public-sector airport owners have found ways to raise private sector investment in their airports.41
41See GAO, Airport Privatization: Limited Interest despite FAA’s Pilot Program,
We found that public-private partnerships could achieve many of the same goals as full privatization. For example, the Port Authority of New York and New Jersey (PANYNJ) sought bids from late 2012 through early 2013 for the redevelopment of LaGuardia
GAO-15-42 (Washington, D.C.: Nov. 19, 2014). In this report, we found that airport privatization has the potential to provide additional investment in airports, ease constrained local budgets, and share with the private sector the financial and operational risks of running an airport. However, the current structure and financing of airports in the United States, in conjunction with the current privatization process of the Airport Privatization Pilot Program (APPP), reduce the incentives and value of privatization while increasing costs and risks for both public-sector airport owners and private-sector investors.

Page 36 GAO-15-306 Airport Finance
International Airport’s current central terminal, a project valued at $3.6 billion. According to a Port Authority official, the PANYNJ lacked sufficient financing to undertake the project on its own as it would have taken too much time to accumulate the funds to do so. According to the PANYNJ, the terminal project calls for a new 1.3-million-square-foot terminal with 35 gates and will include the replacement and financing of the central terminal building, including roads, utilities, a central heating and refrigeration plant, and other support facilities. The winning bidder must also work with the PANYNJ in operating the existing central terminal during construction, manage the transition of airline and non-airline tenants to the new facility, and operate and maintain the plant and terminal building for a specified term. The private sector investors will receive a portion of the central terminal building’s revenue in return for their investment.42
Another option for addressing airports’ capital-project funding shortfalls is for states to choose to increase the amount of state grant funding provided. Regarding the outlook for such an increase, of 46 state officials who responded to the question, 11 respondents indicated that they anticipated their states will provide more funding through 2017 than was provided in recent years; 25 respondents indicated that they anticipated about the same level of funding; 9 respondents indicated that they anticipated less funding; 1 respondent indicated that they did not know. Among 11 respondents who anticipated increased funding for capital development from their states, one respondent cited increases in state revenues as a contributing factor; another cited the reduction in federal participation; another cited restoration of the state’s aviation budget due to an improved economy. Among the 9 respondents who anticipated reduced funding, 3 respondents cited decreases in revenues from fuel taxes while another respondent cited a reduction in the balance of the state’s aviation fund, which is funded entirely through aviation fuel taxes.
42As of November 2014, the PANYNJ had narrowed the bidder to three prequalified teams.

Page 37 GAO-15-306 Airport Finance
Federal funding for national system airports involves policy decisions such as choices about the overall amount of AIP grant funding to authorize and appropriate annually and how to distribute it, which airports should be included in the national system and thus be eligible for federal grants, the criteria used to target AIP grants to particular types of projects, the federal share for AIP-funded projects, what cap to place on PFCs, and how, if at all, AIP and PFCs should be interrelated.
A fundamental decision related to AIP is the amount appropriated annually for the program. Since 2012, Congress has made available annually in appropriations acts $3.35 billion in AIP funding. The President’s fiscal year 2016 budget proposal would lower AIP funding to $2.9 billion. This amount would reduce the total AIP funding available to all airports but, more importantly, would bring the total funding below the “trigger” mechanism in current law that doubles entitlement grant funding for all airports when the appropriated amount is at least $3.2 billion. The President’s budget proposal assumes that the trigger would remain at its current level and, by funding AIP at an amount below the trigger, seeks to decrease the amount of entitlement funding and increase the amount of discretionary funding. Because airports must apply for discretionary grants, this aspect of the proposal would give FAA and states greater ability to select the projects to be funded. The proposal states that lowering the trigger to keep the doubling of entitlements in place would “hinder FAA’s ability to fund the highest priority needs” of the national airport system. Appendix IV compares a scenario of $2.9 billion made available for AIP under the current trigger to an alternative notional scenario of $2.9 billion made available for AIP where the trigger is reduced to $2.9 billion or less. According to FAA officials, the resulting level of discretionary funds would be severely curtailed under that alternative scenario, and would be insufficient to support even the highest-priority projects.
Table 5 illustrates, according to FAA information and analysis, how AIP funding was distributed in 2014 when the amount made available was above the trigger, and how it would likely be distributed under a scenario of $2.9 billion, assuming the current trigger remains in place. As can be
Several Factors Influence How Changes to AIP and PFCs Could Affect Airports, Including Amounts Required for and the Interrelation between AIP and PFCs
Possible Changes to AIP

Page 38 GAO-15-306 Airport Finance
seen, the President’s budget proposal would reduce the amount available for entitlement and non-discretionary grants from $2.8 billion to less than $2 billion, while increasing the amount available for discretionary grants from $376 million to $755 million. The proposal eliminates funding for large hub airports (with most of this money flowing into the Small Airport Fund) and nonprimary entitlements (with those funds flowing instead into state apportionment). According to FAA officials, state apportionment funding is available only to nonprimary airports. The fiscal year 2016 budget proposal pairs the AIP reduction with an increase in the maximum allowable PFC from $4.50 to $8.00 per flight segment. According to the budget proposal, the combination of these changes would allow airports to effectively transition to a reduced AIP level without hindering their ability to meet the existing capital needs of the national airport system. That is, larger airports would benefit from the higher PFC limit, and smaller airports could gain additional AIP funding because of the increased amounts in state apportionment and discretionary funds. In addition, FAA would have more discretionary funding for the capital projects that it determines (in coordination and consultation with the state aviation agencies) to be of greatest benefit to the national airport system overall.
Table 5: Comparison of Airport Improvement Program (AIP) Funding Distributions above and below the Trigger Mechanism
Dollars in millionsa
Fiscal year 2014 AIP funding
(amount made available was
above trigger)b
President’s fiscal year 2016 budget proposal (amount made available is
below trigger)c Total AIP funding made available $3,350 $2,900 AIP funding available for grants (after administrative and other costs)
3,194 2,747
Entitlements and non-discretionary Primary airports
Large-hub 153 0 Medium-hub 75 36 Small-hub 282 141 Non-hub 327 188
Cargo 112 96 Alaska supplemental 21 11 Nonprimary entitlements 406 0

Page 39 GAO-15-306 Airport Finance
Dollars in millionsa
Fiscal year 2014 AIP funding
(amount made available was
above trigger)b
President’s fiscal year 2016 budget proposal (amount made available is
below trigger)c State apportionment 233 508 Carryover entitlements 726 637 Small airport fund
Nonhub commercial service 276 214 Nonprimary airports 138 107 Small hub 69 54
Subtotal entitlements and non-discretionary
2,818 1,992
Discretionary Noise and environmental set-aside 131 264 Reliever set-aside 2 0 Military Airport Program set-aside 15 30 Remaining discretionary
Capacity, safety, security, noise 170 345 “Pure” discretionary 57 115
Subtotal discretionary 376 755 Total entitlements, non-discretionary, and discretionary
3,194 2,747
Source: GAO presentation of Federal Aviation Administration data and analysis. | GAO-15-306
Notes: Amounts may not sum to subtotals because of rounding. Under current law, the AIP includes what is referred to as a “trigger” mechanism—that is, whenever the annual amount made available in appropriations acts for the program is $3.2 billion or more, the amount of entitlement grant funding distributed to all airports is doubled. Specifically, when the trigger is met, two types of entitlements are doubled (primary and Alaska supplemental). Another category of entitlements, nonprimary entitlements, is created with funds from state apportionment when the trigger is met. aDollar amounts are in nominal dollars. bFiscal year 2014 AIP funding amounts for entitlements for primary airports were estimated based on data on passenger enplanements in 2012. cPresident’s fiscal year 2016 budget proposal funding amounts for entitlements for primary airports were estimated based on data on passenger enplanements in 2013.
Other possible ways to change the AIP include decisions about which airports should be included in the national system and thus be eligible for federal grants, the criteria used to target AIP grants to particular types of projects, and the federal share for AIP-funded projects. Stakeholders and industry observers we spoke with discussed each of these options:

Page 40 GAO-15-306 Airport Finance
• One option for changing the AIP is to alter the types or number of airports that are included in the national airport system and are therefore eligible to receive federal AIP grants. In 2010, FAA began its efforts on two related studies to review activity at general aviation airports and the aeronautical functions they provide in order to better describe their current role in the national airport system.43 As part of the studies, FAA divided the national airport system’s general aviation airports into four new categories based on existing activity measures.44
• Another option for changing the AIP is to alter the project criteria for AIP grants; however, officials from FAA and three of the industry associations we spoke with noted that the current project criteria—designed to promote system safety, security, efficiency, access, and environmental sustainability—were focused on the right things. As previously mentioned, several stakeholders mentioned the importance
General aviation airports falling within one of the four categories remained eligible for AIP entitlement and discretionary funding. However, at the end of the second study, 281 airports remained unclassified because they did not meet the criteria for inclusion in any of the new categories, thus having no clearly defined federal role. This included 227 publicly owned airports with few or no based aircraft. According to an FAA official, starting in fiscal year 2015, these unclassified airports are no longer accruing nonprimary entitlement grants. The FAA official pointed out that being unclassified is a clear indication that, despite extensive review, these airports have such low levels of activity that most development projects cannot be justified based on aeronautical demand. Nonetheless, if an unclassified airport had a safety-related project (e.g., clearing approaches or fixing a runway in poor condition), FAA would work with the state aeronautical agency and the airport to consider whether AIP state apportionment or discretionary funds might be justified. According to FAA, these airports will remain in the national airport system as unclassified and have the opportunity to move into one of the four categories if they reach the minimum thresholds for classification.
43See FAA, General Aviation Airports: A National Asset (Washington, D.C.: May 2012) (known as the ASSET report) and FAA, ASSET 2: In-Depth Review of the 497 Unclassified Airports (Washington, D.C.: March 2014). 44FAA divided the general aviation airports into four categories: national, regional, local, and basic.
Page 41 GAO-15-306 Airport Finance
of safety and rehabilitation projects, both supported under the current AIP project criteria.45
• Another option for changing the AIP—adjusting the federal share—was mentioned by officials of three industry associations with whom we spoke. The federal share of AIP project costs for small airports reverted from 95 percent to 90 percent in 2012.
46
Conversely, the match for small airports reverted from 5 percent to 10 percent. Officials from the Aircraft Owners and Pilots Association (AOPA), which represents users of general aviation airports, discussed how this doubling of the airport match, in their opinion, was a barrier for small airports, which can sometimes struggle to fund the matching share of infrastructure projects. They said that small airports would like to see the airport match amount returned to 5 percent, a change that was also supported by ACI-NA. FAA pointed out, however, that the matching requirement has historically been 10 percent and the lowering to 5 percent was meant to provide temporary relief to small airports during the economic downturn. The return to 10 percent was, in FAA’s opinion, a return to the program norm.
A fundamental element of the PFC is the maximum allowable charge. The current $4.50 per segment cap has been in place since 2000, leading representatives of the airport industry to assert that PFCs have not kept pace with inflation, severely diluting the purchasing power of PFCs. Airline representatives, however, assert that higher PFCs could lead to higher cost of travel, which would reduce passenger demand and airline revenues, and that airports have adequate access to other funding sources.
In our recent report examining PFCs, we developed an economic demand model to show the potential effects of PFC changes on the amount of
45One industry financial consultant believed that the criteria should be expanded to allow maintenance projects to be funded. FAA officials, however, stated that doing so would expand the use of AIP money too much and dilute the focus on infrastructure development. Rehabilitation projects, which are AIP eligible, are much more extensive than routine maintenance projects, which are not AIP eligible. 46In 2003, Congress temporarily increased the federal share to 95 percent at smaller airports under the Vision 100 FAA reauthorization. Pub.L. No. 108-176, § 161, 117 Stat. 2490, 2513 (2003). This change was extended until February 18, 2012, by various legislation. The FAA Modernization and Reform Act of 2012 did not continue the increased federal share provision beyond the sunset date in fiscal year 2012.
Possible Changes to PFC

Page 42 GAO-15-306 Airport Finance
funding available to airports, passenger demand, and ticket tax revenues.47
• a PFC cap of $6.47 (the 2016 equivalent of the current cap of $4.50 when indexed to the Consumer Price Index starting in 2000 when the cap was first instituted),
We modeled three different increases in the PFC cap, each starting in 2016:
• a PFC cap of $8.00 (the amount proposed in the President’s fiscal year 2015 budget proposal),48
• a PFC cap of $8.50 that would be indexed to inflation going forward (as put forth in a legislative proposed by ACI-NA and the American Association of Airport Executives (AAAE)).
and
49
For our base model analysis, we assumed a demand price elasticity of -0.8.
50
47See
Our model also assumed a range of demand price elasticities based on economic literature. (The more elastic the demand, the more passenger traffic is reduced by increases in price.) We assumed that the full amount of the PFC increase would be passed on to consumers rather than being absorbed, in whole or in part, by the airlines through downward adjustment of their base fares. We also assumed that airports would adopt the maximum PFC cap at the start of 2016; in reality, adoption of higher PFCs would likely be gradual. Accordingly, our model
GAO-15-107. 48Because our PFC report was released in December 2014, it used the President’s fiscal year 2015 budget proposal rather than the President’s fiscal year 2016 budget proposal, which was not released until February 2015. Both proposals included a PFC cap of $8.00. 49ACI-NA and AAAE used construction cost indices to calculate their proposed cap amount of $8.50. ACI-NA officials told us they used this index because planned development costs are aligned with construction costs. The trade associations have not proposed an inflation rate so we used the Consumer Price Index to adjust for inflation going forward as this is a federal inflation index standard. 50In air travel, demand elasticity measures the percentage change in tickets sold as a result of percentage change in price of the tickets. For example, an elasticity of minus one would imply that a 10-percent increase in price of the ticket would lead to a 10-percent reduction in the number of tickets sold. The higher the elasticity, the more responsive or sensitive the demand is to a change in price.

Page 43 GAO-15-306 Airport Finance
results should be considered upper bound estimates of the PFC funds available to the airports.51
Increasing the PFC cap under the three different scenarios that we modeled would significantly increase the potential amount of PFC collections in comparison to what would be available without a PFC increase, as shown in table 6.
52
Table 6: Estimated Passenger Facility Charge (PFC) Collections Available to PFC Approved Airports, 2016-2024
Dollars in millions
Scenario 2016 2017 2018 2019 2020 2021 2022 2023 2024 Current baseline estimate for PFC collections available to PFC approved airports
$4.50 capa 3,073 3,149 3,225 3,301 3,373 3,437 3,498 3,561 3,628 Estimated changes to the baseline estimate for PFC collections available to PFC approved airports under various cap scenarios
$6.47 capb ($4.50 cap adjusted for CPI)
+1,341 +1,375 +1,409 +1,444 +1,476 +1,505 +1,533 +1,561 +1,592
$8.00 capc (President’s budget)
+2,364 +2,424 +2,485 +2,546 +2,604 +2,655 +2,705 +2,756 +2,810
$8.50 cap, CPI adjustedd (ACI-NA/AAAE proposal)
+2,696 +2,886 +3,093 +3,316 +3,551 +3,787 +4,033 +4,291 +4,562
Source: GAO analysis using DOT data. / GAO-15-306
Notes: These projections assume: 1) 100% adoption of maximum allowable PFCs in 2016 by airports approved to collect a PFC as of July 31, 2014; 2) a -0.8 elasticity rate and 3) 100% pass through of the cost of the PFC increase to passengers. Results are reported in nominal dollars. aBaseline PFC revenues under current cap ($4.50). bChange in PFC revenues relative to baseline under $6.47 PFC cap. This cap was developed by using CPI to adjust for inflation between 2000 and 2016.
51Our estimates of PFC amounts are for those airports that were approved to collect PFCs as of July 31, 2014. 52Our PFC report also includes an analysis of how increasing the PFC cap could affect the revenues into the Airport and Airway Trust Fund. We found that, under all three of our cap scenarios, growth of Airport and Airway Trust Fund revenues could be slowed compared to what it could have been without a PFC increase. The extent to which the Trust Fund is affected will depend on the extent of reduced passenger traffic (elasticity assumption) as well as the extent to which the airlines pass on the PFC increase to consumers under each scenario (pass-through rate). See GAO-15-107 for a more complete discussion of the Trust Fund implications.

Page 44 GAO-15-306 Airport Finance
cChange in PFC revenues relative to baseline under $8 PFC cap. This cap was proposed in the President’s fiscal year 2015 budget. dChange in PFC revenues relative to baseline under $8.50 PFC cap which is adjusted for inflation using the Congressional Budget Office’s projected CPI for each calendar year in our analysis. This amount was proposed by Airports Council International-North America (ACI-NA) and American Association of Airport Executives (AAAE). The trade associations have not proposed an inflation rate so GAO has used the CPI to adjust for inflation as this is a federal inflation index standard.
We also found that increasing the cap on PFCs could benefit airports, but that the effects would likely differ based on airport size. Because passenger traffic is highly concentrated at larger airports, PFC collections are similarly concentrated. Thus, larger airports could benefit most from an increase in the PFC. A hub level analysis of a PFC cap increase showed that large hub airports could receive nearly three-quarters of all PFCs, while large and medium hubs together could account for nearly 90 percent of total PFCs, similar to what they do now. Nonetheless, smaller airports could still benefit from a PFC increase under the President’s fiscal year 2016 budget proposal. As discussed earlier, under the budget proposal, changes to the distribution of some AIP entitlement grants are paired with an $8 PFC cap so that while larger airports could benefit from the higher PFC limit, smaller airports could gain additional AIP funding because of increased amounts in state apportionment and discretionary funds.
We provided a draft of this report to DOT and ACI-NA for their review and comment. Both DOT and ACI-NA provided technical comments via email which we incorporated as appropriate.
As agreed with your offices, unless you publicly announce the contents of this report earlier, we plan no further distribution until 30 days from the report date. At that time, we will send copies of this report to the appropriate congressional committees, the Secretary of Transportation, the Administrator of FAA, and the President and Chief Executive Officer of ACI-NA. In addition, the report is available at no charge on the GAO website at http://www.gao.gov.
Agency and Third Party Comments

Page 45 GAO-15-306 Airport Finance
If you or members of your staff have questions about this report, please contact me at (202) 512-2834 or [email protected]. Contact points for our Offices of Congressional Relations and Public Affairs may be found on the last page of this report. Key contributors to this report are listed in appendix V.
Gerald L. Dillingham, Ph.D. Director, Physical Infrastructure Issues

Appendix I: Objectives, Scope, and Methodology
Page 46 GAO-15-306 Airport Finance
Our objectives were to answer the following questions: (1) How much did airports receive for capital development for fiscal years 2009 through 2013, and from what sources? (2) What is the estimated cost of airports’ planned capital development for fiscal years 2015 through 2019? (3) How do past funding levels compare with planned capital development costs? (4) How might changes to the Airport Improvement Program (AIP) funding levels and the maximum allowable passenger facility charge (PFC) affect airport funding? Our scope was limited to those airports that the Federal Aviation Administration (FAA) includes in its National Plan of Integrated Airport Systems (NPIAS), which we refer to as national system airports.
To determine how much airports received for capital development from fiscal years 2009 through 2013 and from what sources, we obtained and analyzed information on the five main sources of airport funding: airport-generated net income, AIP grants, PFCs, capital contributions, and state grants. We framed our research objective to examine funding received rather than actual capital expenditures because comprehensive data on airport capital spending are limited; thus, we sought data on airports’ available capital funding, which, over time, should roughly equate to spending. We selected fiscal years 2009 through 2013 to provide 5 years worth of the most recent data available; fiscal year 2013 was the most recent year for which complete data was available for all funding sources as most of our audit work was conducted during fiscal year 2014. For each funding source, we determined average annual funding amounts for fiscal years 2009 through 2013 for all national system airports, as well as separately for larger airports and smaller airports. We defined larger airports to mean large hubs and medium hubs combined, and smaller airports to mean small hubs, non-hubs, nonprimary commercial service, reliever, and general aviation airports combined. We presented all funding amounts in nominal dollars. Below is a description of how we determined amounts for each funding source.
For airport-generated net income, which we defined as revenue available for capital development after airports pay operating expenses (such as personnel and utility costs) but prior to subtracting depreciation expense, we obtained and analyzed airport financial data from FAA’s Compliance Activity Tracking System (CATS).1
1FAA uses CATS to gather and disseminate Congressionally-mandated airport financial information based on annual financial reports filed by commercial airports.
We analyzed the financial data to
Appendix I: Objectives, Scope, and Methodology
Funding Sources for Fiscal Years 2009 through 2013
Airport-Generated Net Income

Appendix I: Objectives, Scope, and Methodology
Page 47 GAO-15-306 Airport Finance
determine the amount of airport-generated net income airports had available for capital development, as well as amounts by airport type, for each fiscal year 2009 through 2013. We included all airports in the CATS database, which consisted of varying numbers of commercial service airports.2
(total operating revenue) – (subtotal of operating expenses, prior to subtracting depreciation) + (interest income, restricted and non-restricted)
We calculated airport-generated net income, prior to paying interest expense, using three CATS line items as follows:
Some airports use a portion of their airport-generated net income, along with a portion of their PFC collections, to pay interest on debt; the amount of airport-generated net income available for capital development is reduced accordingly. In the annual financial reports to FAA, airports report their total interest expense. We estimated the portion of interest expense paid with airport-generated net income by subtracting our estimate of the portion of interest expense paid with PFCs from the total interest expense in CATS. (See below for a discussion of how we estimated the portion of interest expense paid with PFCs.) We then subtracted this estimated amount from the calculated amount of airport-generated net income prior to paying interest expense to obtain the amount of airport-generated net income that airports had available for capital development. We subtracted interest payments from airport-generated net income because these costs are financing rather than
2In addition to commercial service airports, the database also includes data on a small number of reliever and general aviation airports. While comprehensive operating revenue data for general aviation airports were not available, in 1998 we reported that a study for FAA by Gellman Research Associates found that most general aviation airports operate at less than the break-even point, often having to rely on the local municipality for operating subsidies. See Airport Financing: Funding Sources for Airport Development, GAO/RCED-98-71 (Washington, D.C.: Mar. 12, 1998).

Appendix I: Objectives, Scope, and Methodology
Page 48 GAO-15-306 Airport Finance
project costs, and the estimated costs of planned development projects largely exclude financing costs.3
To determine how much funding airports received from AIP grants, we obtained and analyzed data from FAA’s System of Airports Reporting (SOAR) database on AIP grants awarded by FAA during our study period. This database includes detailed information about AIP grants and PFC applications, approvals, and collections. We analyzed the AIP grant data to determine total annual funding by airport type for fiscal years 2009 through 2013, as well as average annual funding by airport type and project type over the same time period. Because SOAR’s categories for AIP grant project types differ somewhat from FAA’s categories for planned development projects in the NPIAS report, we reclassified AIP project types to more closely match the NPIAS categories, using an approach suggested by an FAA airports official. We did not include in our totals for AIP funding $1,060 million in grants awarded in fiscal year 2009 and $13 million in grants awarded in fiscal year 2010; these amounts were not part of FAA’s regular appropriations, but rather were included in a $1.1-billion supplemental appropriation under the American Recovery and Reinvestment Act of 2009.
To determine how much funding airports received from PFCs, we obtained and analyzed data from the SOAR database on PFC collection amounts at all airports that collected PFCs during our study period. As mentioned above, some airports use a portion of their PFC collections, along with a portion of their airport-generated net-income, to pay interest on debt; the amount of PFC collections available for capital development is reduced accordingly. We estimated the portion of interest expense paid with PFC collections based on FAA data on PFC application approvals. Because we were unable to obtain data on airports’ expenditures of PFC revenues by project type from 2009 through 2013, we instead obtained
3More specifically, according to an FAA airports’ official , FAA’s estimates of AIP-eligible planned development costs as presented in the NPIAS report generally do not include financing costs. It is less clear whether Airport Council International-North America’s (ACI-NA) estimates of AIP-noneligible planned development include financing costs. Although the survey instrument that ACI-NA used to collect planned development information from its member airports directs the airports to include financing costs, an ACI-NA official told us that in response to a follow-up survey they conducted and to which 43 of the 87 member airports surveyed responded, only 1 airport indicated that it had included any financing costs in its planned development costs estimates. The official added that the included financing costs were about $4 million, and were for a project that happened to be classified as AIP-eligible by the airport.
AIP Grants
PFCs

Appendix I: Objectives, Scope, and Methodology
Page 49 GAO-15-306 Airport Finance
data on airports’ FAA-approved applications from 1990 through February 2014 showing the types of projects on which airports intended to spend their PFC revenue.4
To determine how much funding airports received from capital contributions, we analyzed the same set of airport financial data from CATS that we used for airport-generated net income, discussed above. We used the line item for capital contributions in CATS.
Because the project type categories in this data differ substantially from the project type categories in NPIAS, we did not reclassify the project types to more closely match the NPIAS categories.
To determine how much funding airports received from state grants, in July 2014 we surveyed via email, with the assistance of the National Association of State Aviation Officials (NASAO), NASAO’s state aviation official point-of-contact in each state as well as the U.S. territory of Guam. We received completed surveys from 46 of 51 state aviation officials (a 90-percent response rate).5
In addition to these sources of airport funding, this report also separately discusses information on airport bonding—a common financing mechanism for some airports. We present the total amount of airport bond proceeds for new projects from 2009 through 2013. To determine these amounts, we obtained and analyzed data on airport bond issuances from Thomson Reuters’ SDC Platinum database.
We analyzed the information provided by survey participants to determine the total amount of funding airports in the 46 responding states received from state grants, as well as amounts by airport type, for fiscal years 2009 through 2013. We used the total amount from these responses as our estimate for the amount of state grants; we did not adjust the amounts to try to account for the states that did not respond to our survey.
6
4Although airports are required to report PFC expenditures against the various applications and projects, we could not draw any particular conclusions from data on how PFCs were spent from 2009 to 2013, mainly because airports can spend collected PFC revenues on any approved PFC project in whatever order they choose. In addition, applications and associated approvals are not constrained to particular outlay rates.
For some of the bond
5We were unable to identify current contact information for a state aviation official in Puerto Rico. We did not receive replies from the officials in Idaho, Iowa, Wisconsin, and Guam. The official from Kansas replied, but was unable to provide the information requested in the survey and therefore did not complete the survey instrument. 6Thomson Reuters is a leading information firm for businesses and professionals.
Airport Capital Contributions
State Grants
Bonds

Appendix I: Objectives, Scope, and Methodology
Page 50 GAO-15-306 Airport Finance
proceeds, the data indicate that the proceeds were a combination of new money (i.e., the proceeds were to be used to finance new projects) and refunding of outstanding debt. For these proceeds, the data provide the total amount of the proceeds but not the component amounts of new money and refunding. Because we were interested in only the new money portion, we estimated the new money portion of the combined new money and refunding proceeds by assuming that their ratio of new money to refunding was the same as the ratio of proceeds that were exclusively new money to proceeds that were exclusively refunding. The proceeds from combined new money and refunding issuances comprised 12 percent of the proceeds from all issuances; for the other issuances, 56 percent of the proceeds was new money and 44 percent was refunding.
We assessed the reliability of FAA’s CATS data on airport financial information by (1) reviewing existing information about the data and the systems that produced them and (2) interviewing agency officials knowledgeable about the data. We assessed the reliability of FAA’s SOAR data on AIP grants and PFC collection amounts and FAA’s CATS data on airport financial information by (1) performing electronic testing of required data elements, (2) reviewing existing information about the data and the systems that produced them, and (3) interviewing agency officials knowledgeable about the data. We assessed the reliability of Thomson Reuter’s SDC Platinum data on airport bond issuances by (1) comparing the total amount of bond proceeds included in the data with the total amounts in independent reports covering the same time period issued by The Bond Buyer, a newspaper that covers the municipal bond industry; and (2) discussing the reliability of the data with the lead finance official at Airports Council International – North America (ACI-NA), a user of the data. We determined that the data were sufficiently reliable for the purposes of this report.
To determine the estimated cost of airports’ planned capital development for fiscal years 2015 through 2019, we combined (1) FAA’s most recent estimate for AIP-eligible development from FAA’s 2015-2019 NPIAS report, released in September 2014, and (2) ACI-NA’s most recent estimate for AIP-ineligible development for the same time period, which we calculated using data from the spreadsheet that ACI-NA used to compile its March 2015 report, Airport Capital Development Needs, 2015-2019. We developed estimates of infrastructure development costs for all national system airports, as well as by airport type. We also presented estimates of AIP-eligible development costs by project type, which we based on estimates in the NPIAS report. We did not, however, present
Data Reliability Assessments
Planned Development Costs for Fiscal Years 2015 through 2019

Appendix I: Objectives, Scope, and Methodology
Page 51 GAO-15-306 Airport Finance
estimates of AIP-ineligible data by project type because ACI-NA’s data do not readily support such a presentation. We presented all dollar amounts in 2013 dollars. FAA’s NPIAS presents estimated planned development costs in 2013 dollars, whereas ACI-NA’s spreadsheet and report present estimated planned development costs in 2014 dollars, as well as in nominal dollars. To be able to combine FAA’s and ACI-NA’s estimates, we converted ACI-NA’s estimates from 2014 dollars to 2013 dollars using the Bureau of Economic Analysis’s gross domestic product price index.
FAA submits the biennial NPIAS to Congress in accordance with title 49 of the U.S. Code.7
ACI-NA estimates the total costs of airport planned development, including AIP-eligible and AIP-ineligible projects; we used only the AIP-ineligible portion of ACI-NA’s estimate. To develop its full estimate, ACI-NA surveyed all of its 128 large-, medium-, and small-hub airport members in the United States. ACI-NA received 84 responses, for an overall response rate of 66 percent. However, the response rate varied by airport size as follows: large hubs, 29 of 30 (97 percent); medium hubs, 28 of 32 (88 percent); and small-hubs, 27 of 66 (41 percent). ACI-NA based its estimates of total capital development costs for large, medium, and small hub airports on the responses it received from airports in those categories.
According to FAA, cost estimates in the NPIAS are obtained primarily from airport master and state system plans prepared by planning and engineering firms for airport sponsors. These plans are usually funded in part by FAA, are consistent with FAA forecasts of aeronautical activity, follow FAA guidelines, and have been reviewed and accepted by FAA planners who are familiar with local conditions. The development reflected in the NPIAS report for fiscal years 2015 through 2019 is based on planning documents available through 2013. The NPIAS only includes projects that are eligible for AIP grants and for which funding has not already been identified. Based on FAA’s methodology for developing the NPIAS from airport planning documents, we determined the information to be reliable for the purposes of our report.
8
749 U.S.C. § 47103.
These members represent 98 percent of all passengers
8Among its other airport members that it surveyed, ACI-NA received 9 responses from non-hub, nonprimary commercial service, reliever, and general aviation airports. Due to this small sample size, ACI-NA chose to rely on FAA’s NPIAS estimates for these airport types.

Appendix I: Objectives, Scope, and Methodology
Page 52 GAO-15-306 Airport Finance
enplaned at large hubs, 87 percent of all passengers enplaned at medium hubs, and 45 percent of all passengers enplaned at small hubs in 2013. ACI-NA then calculated the total capital development costs per 2013 enplanement for the respondent large, medium, and small hub airports, and used these costs per enplanement as the unit costs to estimate the capital development costs for all large, medium, and small hub airports, using the total 2013 enplanements for each of these airport types. We reviewed ACI-NA’s methodology, and determined that ACI-NA’s response rates, as well as the shares of enplanements represented by the airports that responded and ACI-NA’s estimation methodology, were sufficiently reliable for the purposes of presenting an estimate of planned development for AIP-ineligible projects.
To determine how past funding levels compare with airports’ capital development plans, we compared the funding levels for fiscal years 2009 through 2013 with the airports’ planned development for fiscal years 2015 through 2019. We compared funding levels with planned development for all national system airports combined, as well as for larger and smaller airports.
Because we reported funding in nominal dollars and planned development in 2013 dollars, these amounts were not comparable. To make the data comparable, we adjusted the past funding amount to the level that it would be in 2013 dollars, assuming that the amount of funding across the various sources would grow, on average, at the general rate of economy-wide inflation. Specifically, we used the Bureau of Economic Analysis’s gross domestic product price index as it reflects the general level of inflation for the U.S. economy.
To describe how changes to AIP funding levels and the maximum allowable PFC might affect airport funding, we assessed how a lower AIP funding level, as put forth in the President’s 2016 proposed budget, would affect the funding received by airports of different sizes. We based our assessment largely on an analysis performed by officials in FAA’s Office of Airport Planning and Programming. With regard to PFC levels, we incorporated analysis contained in our recent report examining PFCs and
Comparison of Past Funding and Planned Development
Possible Changes to AIP and PFCs

Appendix I: Objectives, Scope, and Methodology
Page 53 GAO-15-306 Airport Finance
PFC collection methods.9
That report contains details on the methodology used to explore the impacts of different maximum PFC levels.
For each of our objectives, we reviewed legislation, regulations, agency guidance, industry and agency publications and reports, and other relevant documents. We also interviewed FAA officials and aviation industry stakeholders and observers to obtain their perspectives on airport funding issues. We selected the major industry associations most involved in airport funding issues. We selected three airport consulting firms that have expertise in airport capital funding. We selected the three largest bond rating agencies. Table 7 lists the entities we interviewed for this report.
Table 7: Aviation Industry Stakeholders and Observers Interviewed by GAO
Aircraft Owners and Pilots Association Airlines for America Airports Council International – North America American Association of Airport Executives Federal Aviation Administration Fitch Ratings ICF International LeighFisher Moody’s Investors Service National Association of State Aviation Officials Regional Airline Association Ricondo & Associates Standard & Poor’s Ratings Services
Source: GAO | GAO-15-306
Lastly, we also conducted a content analysis of the responses to the open-ended questions in our survey of state aviation officials. We
9See Commercial Aviation: Raising Passenger Facility Charges Would Increase Airport Funding, but Other Effects Less Certain, GAO-15-107 (Washington, D.C.: Dec 11, 2014). In this report, we analyzed the effects of various PFC caps on passenger demand. We also discuss alternative PFC collection methods.
Additional Methodology

Appendix I: Objectives, Scope, and Methodology
Page 54 GAO-15-306 Airport Finance
developed a set of categories for coding the responses. A GAO analyst coded the responses and a second GAO analyst reviewed the coding and discussed and resolved any discrepancies with the first analyst.
We conducted this performance audit from April 2014 to April 2015, in accordance with generally accepted government auditing standards. Those standards require that we plan and perform the audit to obtain sufficient, appropriate evidence to provide a reasonable basis for our findings and conclusions based on our audit objectives. We believe that the evidence obtained provides a reasonable basis for our findings and conclusions based on our audit objectives.

Appendix II: GAO Survey Instrument
Page 55 GAO-15-306 Airport Finance
GAO/NASAO Survey of State Aviation Officials on Funding Provided to NPIAS Airports
July 2014
Introduction
The U.S. Government Accountability Office (GAO), the evaluation arm of Congress, has been asked to provide information on airport infrastructure funding, including both planned capital development and the funding capacity of airports (as reflected by funding amounts recently received). Because state grants are a source of airport capital funding, GAO, with assistance from the National Association of State Aviation Officials (NASAO), is conducting this survey of state aviation officials to determine how much funding states have provided to those airports included in the Federal Aviation Administration’s (FAA) National Plan of Integrated Airport Systems (NPIAS).
We plan to report survey results in the aggregate. GAO will not include in its report individually identifiable data from this survey. The results of this survey, along with other information GAO obtains from FAA, airports, and other aviation stakeholders, will help inform a written report to Congress. Your participation is important to providing Congress with a comprehensive understanding of airports’ planned development and funding sources.
Completing and Returning the Survey
To answer the questions, please save this file to your computer and then enter your responses directly into the saved document. Once the questions are completed, please return them by July 31 by attaching the saved document to an email message to xxxxxxxxxxxxxxxxx.
If you have any questions, please email or call xxxxxxxxxxxxxxxxx at xxxxxxxxxxxxxxxxx or xxxxxxxxxxxxxxxxx.
Contact Information
Please provide the name and contact information of the person completing this survey in case GAO needs to follow up on the information provided.
Appendix II: GAO Survey Instrument

Appendix II: GAO Survey Instrument
Page 56 GAO-15-306 Airport Finance
Name:
State:
Email:
Phone:
Survey Questions
Question 1: What is your state’s fiscal year time period?
Question 2: How much funding did your state provide to its NPIAS airports in fiscal years 2009 through 2013? Please provide amounts in the tables below, which are organized by fiscal year, airport size category, and whether the funds were state matching for federal grants or state-only grants.
January 1 - December 31
April 1 - March 31
July 1 - June 30
September 1 - August 31
October 1 - September 30
Other. Please describe:

Appendix II: GAO Survey Instrument
Page 57 GAO-15-306 Airport Finance
2009
NPIAS airport category
State matching for federal grants State-only grants
Large hub
Medium hub
Small hub
Nonhub
Nonprimary commercial
Reliever
General aviation
Total

Appendix II: GAO Survey Instrument
Page 58 GAO-15-306 Airport Finance
2010
NPIAS airport category
State matching for federal grants State-only grants
Large hub
Medium hub
Small hub
Nonhub
Nonprimary commercial
Reliever
General aviation
Total

Appendix II: GAO Survey Instrument
Page 59 GAO-15-306 Airport Finance
2011
NPIAS airport category
State matching for federal grants State-only grants
Large hub
Medium hub
Small hub
Nonhub
Nonprimary commercial
Reliever
General aviation
Total

Appendix II: GAO Survey Instrument
Page 60 GAO-15-306 Airport Finance
2012
NPIAS airport category
State matching for federal grants State-only grants
Large hub
Medium hub
Small hub
Nonhub
Nonprimary commercial
Reliever
General aviation
Total

Appendix II: GAO Survey Instrument
Page 61 GAO-15-306 Airport Finance
2013
NPIAS airport category
State matching for federal grants State-only grants
Large hub
Medium hub
Small hub
Nonhub
Nonprimary commercial
Reliever
General aviation
Total
Question 3:
A. Compared to recent years, how much funding for capital development at NPIAS airports do you anticipate your state will provide through 2017?
Much less
Somewhat less
About the same t
Somewhat more

Appendix II: GAO Survey Instrument
Page 62 GAO-15-306 Airport Finance
B. If your previous answer indicates an anticipated change in your state’s funding levels, what factors contributed to the anticipated change? (If you did not indicate an anticipated change, please go to Question 4.)
C. If you indicated an anticipated change in your state’s funding levels, will the change be fairly consistent across NPIAS airport categories?
D. If you answered “No” to the previous question, describe how the anticipated changes in your state’s funding levels vary by NPIAS airport category.
Question 4:
A. Do you anticipate an overall gap between planned airport development and available funding from all sources (not just state grants) through 2017 for the NPIAS airports in your state?
Much more
Don't know
Yes
No
Don't know
Yes
No (Go to the end of the survey.)

Appendix II: GAO Survey Instrument
Page 63 GAO-15-306 Airport Finance
B. If your previous answer indicates an anticipated gap, what is the likelihood that each of the following infrastructure project types would go unfunded or be delayed?
NPIAS project type Very unlikely Unlikely Neutral Likely Very likely
Don’t know
Airfield capacity
Airfield reconstruction/rehabilitation
Airfield standards
Airport ground access
Environment (other than noise)
New airport
Noise
Safety
Security
Don't know (Go to the end of the survey.)

Appendix II: GAO Survey Instrument
Page 64 GAO-15-306 Airport Finance
NPIAS project type Very unlikely Unlikely Neutral Likely Very likely
Don’t know
Terminal (other than security)
Other:
C. What would be the likely effects, if any, of these projects being unfunded or delayed?
D. If you indicated an anticipated gap, which, if any, of the following NPIAS airport categories are likely to be particularly affected in your state? (Check all that apply.)
GAO and NASAO thank you for completing this survey.
Large hub
Medium hub
Small hub
Nonhub
Nonprimary commercial
Reliever
General aviation

Appendix III: Comparison of Past Funding and Planned Development Costs by Type of Airport
Page 65 GAO-15-306 Airport Finance
This appendix compares airports’ average annual funding for fiscal years 2009 through 2013 with airports’ average annual planned development costs for fiscal years 2015 through 2019, by type of airport. See figure 12 for large hub airports; figure 13 for medium hub airports; figure 14 for small hub airports; and figure 15 for the combination of nonhub, nonprimary commercial service, reliever, and general aviation airports.
Figure 12: Comparison of Past Funding Available for Capital Development and Planned Development Costs – Large Hub Airports
Note: Dollar amounts may not sum to totals because of rounding. aAverage annual funding is in fiscal year 2013 dollars and planned development is in calendar year 2013 dollars; the difference between these dollar bases likely has a minimal impact on the comparison of average annual funding and planned development. bEven though airport-generated net income and passenger facility charge (PFC) collections are used to pay bond principal, we do not subtract bond principal payments because we do not include bond proceeds as a source of funding. We do, however, subtract payments on bond interest from airport-generated income and PFC collections because these costs are financing rather than project costs, and the estimated costs of planned development projects largely exclude financing costs (see appendix I on our scope and methodology for additional details about the treatment of financing costs in cost estimates of planned development projects). The gross average annual amounts of airport-generated net income and PFCs for large hub airports were $4,671 million and $2,043 million, respectively.
Appendix III: Comparison of Past Funding and Planned Development Costs by Type of Airport

Appendix III: Comparison of Past Funding and Planned Development Costs by Type of Airport
Page 66 GAO-15-306 Airport Finance
Figure 13: Comparison of Past Funding Available for Capital Development and Planned Development Costs – Medium Hub Airports
aAverage annual funding is in fiscal year 2013 dollars and planned development is in calendar year 2013 dollars; the difference between these dollar bases likely has a minimal impact on the comparison of average annual funding and planned development.. bEven though airport-generated net income and passenger facility charge (PFC) collections are used to pay bond principal, we do not subtract bond principal payments because we do not include bond proceeds as a source of funding. We do, however, subtract payments on bond interest from airport-generated income and PFC collections because these costs are financing rather than project costs, and the estimated costs of planned development projects largely exclude financing costs (see appendix I on our scope and methodology for additional details about the treatment of financing costs in cost estimates of planned development projects). The gross average annual amounts of airport-generated net income and PFCs for medium hub airports were $1,177 million and $495 million, respectively.

Appendix III: Comparison of Past Funding and Planned Development Costs by Type of Airport
Page 67 GAO-15-306 Airport Finance
Figure 14: Comparison of Past Funding Available for Capital Development and Planned Development Costs – Small Hub Airports
Note: Dollar amounts may not sum to totals because of rounding. aAverage annual funding is in fiscal year 2013 dollars and planned development is in calendar year 2013 dollars; the difference between these dollar bases likely has a minimal impact on the comparison of average annual funding and planned development.. bEven though airport-generated net income and passenger facility charge (PFC) collections are used to pay bond principal, we do not subtract bond principal payments because we do not include bond proceeds as a source of funding. We do, however, subtract payments on bond interest from airport-generated income and PFC collections because these costs are financing rather than project costs, and the estimated costs of planned development projects largely exclude financing costs (see appendix I on our scope and methodology for additional details about the treatment of financing costs in cost estimates of planned development projects). The gross amounts of airport-generated net income and PFCs for small hub airports were $412 million and $219 million, respectively.

Appendix III: Comparison of Past Funding and Planned Development Costs by Type of Airport
Page 68 GAO-15-306 Airport Finance
Figure 15: Comparison of Past Funding Available for Capital Development and Planned Development Costs – Nonhub, Nonprimary Commercial Service, Reliever, and General Aviation Airports
Note: Dollar amounts may not sum to totals because of rounding. aAverage annual funding is in fiscal year 2013 dollars and planned development is in calendar year 2013 dollars; the difference between these dollar bases likely has a minimal impact on the comparison of average annual funding and planned development. bIncludes some grants to proposed airports and planning agencies as well as state block grants. cEven though airport-generated net income and passenger facility charge (PFC) collections are used to pay bond principal, we do not subtract bond principal payments because we do not include bond proceeds as a source of funding. We do, however, subtract payments on bond interest from airport-generated income and PFC collections because these costs are financing rather than project costs, and the estimated costs of planned development projects largely exclude financing costs (see appendix I on our scope and methodology for additional details about the treatment of financing costs in cost estimates of planned development projects). The gross average annual amounts of airport-generated net income and PFCs for the combination of nonhub, nonprimary commercial service, reliever, and general aviation airports were $19 million and $78 million, respectively. dIncludes predominantly non-hubs and non-primary commercial service airports, as well as a few relievers and general aviation airports.

Appendix IV: Comparison of Airport Improvement Program’s Funding Distributions When Amount Made Available—$2.9 Billion—is At or Above versus Below Trigger Mechanism
Page 69 GAO-15-306 Airport Finance
As mentioned above, the President’s fiscal year 2016 budget proposal would lower AIP funding to $2.9 billion. This amount would reduce the total AIP funding available to all airports while bringing the total funding below the “trigger” mechanism in current law that doubles entitlement grant funding for all airports when the appropriated amount is at least $3.2 billion. The President’s budget proposal assumes that the trigger would remain at its current level and, by funding AIP at an amount below the trigger, seeks to decrease the amount of entitlement funding and increase the amount of discretionary funding. Another possible option would be to lower AIP funding to $2.9 billion, as proposed by the President, while also lowering the trigger below $2.9 billion, so that entitlement grant funding for primary airports would still be doubled and the state apportionment funding would still be reduced in order to fund nonprimary entitlements. According to FAA officials, the resulting level of discretionary funds would be severely curtailed under this option, and would be insufficient to support even the highest-priority projects. Table 8 below compares AIP funding distributions under the President’s fiscal year 2016 budget proposal versus the alternative option described above.
Table 8. Comparison of Airport Improvement Program’s Funding Distributions When Amount Made Available—$2.9 Billion—Is At or Above versus Below Trigger Mechanism
Dollars in millionsa
President’s fiscal year 2016 budget proposal (amount made available is
below trigger)b
Alternative to President’s fiscal year 2016 budget proposal (trigger level is reduced so that amount
made available is at or above
trigger)c Total Airport Improvement Program funding made available
$2,900 $2,900
Airport Improvement Program funding available for grants (after administrative and other costs)
2,747 2,747
Entitlements and non-discretionary Primary airports
Large-hub 0 0 Medium-hub 36 75
Appendix IV: Comparison of Airport Improvement Program’s Funding Distributions When Amount Made Available—$2.9 Billion—is At or Above versus Below Trigger Mechanism

Appendix IV: Comparison of Airport Improvement Program’s Funding Distributions When Amount Made Available—$2.9 Billion—is At or Above versus Below Trigger Mechanism
Page 70 GAO-15-306 Airport Finance
Dollars in millionsa
President’s fiscal year 2016 budget proposal (amount made available is
below trigger)b
Alternative to President’s fiscal year 2016 budget proposal (trigger level is reduced so that amount
made available is at or above
trigger)c Small-hub 141 282 Non-hub 188 327
Cargo 96 96 Alaska supplemental 11 21 Nonprimary entitlements 0 406 State apportionment 508 143 Carryover entitlements 637 637 Small airport fund
Nonhub commercial service 214 364 Nonprimary airports 107 182 Small hub 54 91
Subtotal entitlements and non-discretionary
1,992 2,625
Discretionary Noise and environmental set-aside 264 43 Reliever set-aside 0 1 Military Airports set-aside 30 5 Remaining discretionary
Capacity, safety, security, noise 345 55 “Pure” discretionary 115 18
Subtotal discretionary 755 122 Total entitlements, non-discretionary, and discretionary
2,747 2,747
Source: GAO presentation of the Federal Aviation Administration’s data and analysis. | GAO-15-306
Notes: Amounts may not sum to subtotals because of rounding. Under current law, the Airport Improvement Program’s includes what is referred to as a “trigger” mechanism—that is, whenever the annual amount made available in appropriations acts for the program is $3.2 billion or more, the amount of entitlement grant funding distributed to all airports is doubled. Specifically, when the trigger is met, two types of entitlements are doubled (primary and Alaska supplemental). Another category of entitlements, nonprimary entitlements, is created with funds from state apportionment when the trigger is met. aDollar amounts are in nominal dollars. bPresident’s fiscal year 2016 budget proposal funding amounts for entitlements for primary airports were estimated based on data on passenger enplanements in 2012.

Appendix IV: Comparison of Airport Improvement Program’s Funding Distributions When Amount Made Available—$2.9 Billion—is At or Above versus Below Trigger Mechanism
Page 71 GAO-15-306 Airport Finance
cAlternative to President’s fiscal year 2016 budget proposal funding amounts for entitlements for primary airports were estimated based on data on passenger enplanements in 2013.

Appendix V: GAO Contact and Staff Acknowledgments
Page 72 GAO-15-306 Airport Finance
Gerald L. Dillingham, Ph.D, at (202) 512-2834 or [email protected]
In addition to the contact named above, Faye Morrison (Assistant Director), Amy Abramowitz, Paul Aussendorf, Darryl Chang, David Goldstein, Carol Henn, David Hooper, Susan Irving, Delwen Jones, Paul Kinney, Hannah Laufe, Maureen Luna-Long, Grant Mallie, Sara Ann Moessbauer, Joshua Ormond, Eleni Orphanides, Christopher Ross, Kelly Rubin, and Reed Van Beveren made key contributions to this report.
Appendix V: GAO Contact and Staff Acknowledgments
GAO Contact
Staff Acknowledgments
(540275)

The Government Accountability Office, the audit, evaluation, and investigative arm of Congress, exists to support Congress in meeting its constitutional responsibilities and to help improve the performance and accountability of the federal government for the American people. GAO examines the use of public funds; evaluates federal programs and policies; and provides analyses, recommendations, and other assistance to help Congress make informed oversight, policy, and funding decisions. GAO’s commitment to good government is reflected in its core values of accountability, integrity, and reliability.
The fastest and easiest way to obtain copies of GAO documents at no cost is through GAO’s website (http://www.gao.gov). Each weekday afternoon, GAO posts on its website newly released reports, testimony, and correspondence. To have GAO e-mail you a list of newly posted products, go to http://www.gao.gov and select “E-mail Updates.”
The price of each GAO publication reflects GAO’s actual cost of production and distribution and depends on the number of pages in the publication and whether the publication is printed in color or black and white. Pricing and ordering information is posted on GAO’s website, http://www.gao.gov/ordering.htm.
Place orders by calling (202) 512-6000, toll free (866) 801-7077, or TDD (202) 512-2537.
Orders may be paid for using American Express, Discover Card, MasterCard, Visa, check, or money order. Call for additional information.
Connect with GAO on Facebook, Flickr, Twitter, and YouTube. Subscribe to our RSS Feeds or E-mail Updates. Listen to our Podcasts. Visit GAO on the web at www.gao.gov.
Contact:
Website: http://www.gao.gov/fraudnet/fraudnet.htm E-mail: [email protected] Automated answering system: (800) 424-5454 or (202) 512-7470
Katherine Siggerud, Managing Director, [email protected], (202) 512-4400, U.S. Government Accountability Office, 441 G Street NW, Room 7125, Washington, DC 20548
Chuck Young, Managing Director, [email protected], (202) 512-4800 U.S. Government Accountability Office, 441 G Street NW, Room 7149 Washington, DC 20548
GAO’s Mission
Obtaining Copies of GAO Reports and Testimony
Order by Phone
Connect with GAO
To Report Fraud, Waste, and Abuse in Federal Programs
Congressional Relations
Public Affairs
Please Print on Recycled Paper.