Embed Size (px)
Citation preview


2 ALASKA ECONOMIC TRENDS APRIL 2006
Web site: almis.labor.state.ak.us
Frank H. Murkowski, Governor of AlaskaGreg O’Claray, Commissioner
Susan Erben, Editor
Layout and cover design by Sam Dapcevich
Email Trends authors at: [email protected]
April Trends authors are staff with the Research and Analysis Section,
Administrative Services Division,Alaska Department of Labor & Workforce Development
Free Subscriptions:[email protected]
(907) 465-4500
April 2006Volume 26Number 4
ISSN 0160-3345
To contact us for more information, a free
subscription, mailing list changes or back
copies, email us at [email protected]
or call (907) 465-4500.
Alaska Economic Trends is a monthly publication
dealing with a wide variety of economic-related issues in the state. Its purpose is to inform the public about
those issues.
Alaska Economic Trends is funded by the
Employment Security Division and published by
the Alaska Department of Labor & Workforce
Development.
Printed and distributed by Assets, Inc., a vocational training and employment
program, at a cost of $1.16 per copy.
Material in this publication is public
information and, with appropriate credit, may be reproduced without
permission.
Cover: Bob Swenson, an exploration geologist,
works on the North Slope.Photo courtesy of
ConocoPhillips
Alaska EconomicTrends is available
on the Internet.See URL above.
Governor’s Letter 3
The Year 2005 in Review 4Growth streak reaches 18 years
Benchmark 2005 20
Employment Scene 22Job count begins seasonal rebound
Profi le 24Making It in the Big City

3ALASKA ECONOMIC TRENDS APRIL 2006
2005 Review Reveals Our Future is Bright
By Governor Frank H. Murkowski
This Year-in-Review issue of Trends reveals that 2005 was our 18th consecutive year of job growth in Alaska. This is a record that only a handful of states can
match and the longest stretch of growth since Alaska gained statehood.
Our development initiatives are working. My administration has helped create more than 14,800 new jobs in Alaska. We have a state budget surplus. Our fi scal plan is responsible development of our natural resources to provide public funds needed to improve life in Alaska. My goal is to offer more opportunities for our young people to work in jobs that build a strong Alaska for future generations.
The oil and gas pipelines will truly anchor our future. We’re nearing completion of negotiations on a natural gas pipeline. This is a world-class project. New revenues will allow us to continue to build the Permanent Fund, maintain our state savings and provide a long-term revenue source for continued support of essential public services without imposing state income taxes on our citizens. And it will, of course, provide many new good-paying job opportunities for Alaskans.
The engineers, construction and service workers, technicians, mechanics and skilled laborers who will perform gas pipeline, railroad, oil fi eld, mining and other resource jobs in the future are currently in our middle schools. We’re committed to their education and training for these opportunities. Education funding per student has increased by more than 22 percent in three years, and I’ve proposed another $90 million increase this year.
The Alaska Department of Labor & Workforce Development’s Youth First Initiative will place career counselors in schools to help give students a better understanding of the different career paths available to them – either with a four-year college degree or vocational training. The Initiative will also include industry-skills training, apprenticeship training and actual work experiences through internships to help young Alaskans in their career choices.
With continued growth in the mining, energy, transportation, construction and health-care industries, there are ample opportunities for both young Alaskans and those interested in a career change. I’m committed to the prosperous future of all Alaskans.
Also worthy of note, we reported in February that international exports of Alaska goods, including seafood and natural resource products, continue to show record growth. We’ve worked hard to improve Alaska’s business climate and to aggressively market our products abroad. We’ve made considerable gains since 2003, and the results translate into good jobs for Alaskans. Seafood prices continue to rise, the Pogo mine is producing gold and the Kensington project has been permitted. Our prospects for future natural resource development are very strong. All of this will lead to thousands of jobs and millions of dollars in exports in the future.
Alaska’s future is bright. It’s an exciting time for our great state, and I’m honored to share it with all Alaskans.

4 ALASKA ECONOMIC TRENDS APRIL 2006
Growth streak reaches 18 yearsBy Dan Robinson, Economist
ake it 18 in 2005. That’s 18 consecutive years of job growth, a record that only a handful of states can match and the longest stretch
of growth since Alaska gained statehood. The last time the state lost jobs Ronald Reagan was president, Steve Cowper was governor, The Last Emperor won the Academy Award for best
M
picture, and Walk Like an Egyptian topped pop music charts. The year was 1987 and the state was in the second year of a deep recession caused by a collapse in the real estate market and a plunge in oil prices from over $30 a barrel to less than $10.
Hard rock mining, fi shing and the timber industry helped fuel a recovery that began in 1988 and picked up speed in 1989 when the Exxon Valdez clean-up efforts reached their peak. Since 1991, the state has settled into a pattern of generally moderate job growth, averaging 1.8 percent a year. In 2005, growth of 1.9 percent improved slightly on the previous two years, but stayed consistent with the long-running pattern. (See Exhibits 2 and 3.)
Despite what has been relatively tame economic news over most of the last two decades, each year’s growth has come from a different combination of sources and there has often been dynamic change at the industry level. In 2005, two out of the three goods-producing sectors –natural resources and mining, and construction – led the way in growth rates and nearly every industry contributed at least something to the total increase of 5,700 jobs.
A good year for oil and gas and metal mining
Alaska’s mining sector, which includes the oil and gas industry, had an impressive year in 2005, adding 700 jobs for an annualized growth rate of 7.3 percent. (See Exhibit 3.) Oil and gas employment averaged 8,700 jobs in 2005, an increase of 500 over the year. Several consecutive years of high prices have stimulated
1Alaska’s Economic Regions
by Dan Robinson, Neal Fried,Neal Gilbertsen and BrigittaWindisch-Cole, EconomistsThe Year 2005 in Review
Statewide
SouthwestRegion
NorthernRegion
InteriorRegion
SoutheastRegion
Anchorage/Mat-Su Region
Gulf Coast Region
Fairbanks
Anchorage

5ALASKA ECONOMIC TRENDS APRIL 2006
both exploration and development, and employment levels have nearly bounced back to 2002 levels after a steep drop in 2003.
Mineral mining employment also had a good year in 2005, adding 200 jobs. High prices for gold, silver and zinc have made operations at existing mines more profi table and hastened the development of future projects. Alaska’s three biggest operating mines – Red Dog, Fort Knox and Greens Creek – account for nearly 75 percent of all wage and salary mining employment in Alaska. Between them, they added almost 100 jobs in 2005. The state’s next biggest mining operation, the Usibelli coal mine, also grew slightly. Substantially more mining growth is expected soon as both the Pogo mine near Fairbanks and the Kensington mine near Juneau are scheduled to begin operations in the next year or two.
Construction growth strong and steady
The second most robust performance in 2005 came from the construction industry, which added 900 jobs for an annualized growth rate of 5.1 percent. In terms of dollars spent on construction, the oil and gas industry is the dominant contributor, although it is diffi cult to precisely translate dollar expenditures into job creation. Federal construction spending on bases and military installations has also been a major factor and high oil prices have allowed the state to spend a signifi cant amount on capital projects.
Construction’s steady growth over the last two decades stands in distinct contrast to the boom and bust cycles of the pipeline construction days of the 1970s and what proved to be the overheated market of the 1980s. From 1973 to 1976, for example, the state added more than 20,000 construction jobs only to see all but about 2,000 of them disappear when the pipeline was completed. Similarly, from 1980 to 1983, construction employment nearly doubled only to fall back to 1980 levels during the 1986-87 recession.
During the current period, however, growth has been more moderate and the total construction job count – 18,600 in 2005 – is still well below the pipeline peak in 1976 and the pre-crash peak of 1983. More importantly, the growth has come a little at a time, at least compared to the earlier periods mentioned, and there doesn’t appear to be the same risk of a dramatic drop-off.
Seafood processing up 100
Due largely to the third-largest salmon catch ever recorded for Alaska, the seafood processing industry added 100 jobs and grew for the third consecutive year in 2005. The 8,600 jobs in 2005 were the most since 1999. Despite the relatively modest growth in jobs, wages over the fi rst three-quarters of the year were up an impressive 8.1 percent, suggesting that the processors may have paid more in overtime for their existing workers to handle the catch. Other than salmon,
0.6%
2.0%
2.3%
1.1%
2.2%
1.9%2.0%
1.4%
1.6%
1.9%
96 97 98 99 00 01 02 03 04 05
Percent Employment GrowthAlaska, 1996-2005
Source: Alaska Department of Labor & Workforce Development, Research and Analysis Section, in cooperation with the U.S. Bureau of Labor Statistics
2

6 ALASKA ECONOMIC TRENDS APRIL 2006
3 Wage and Salary EmploymentAlaska, 2004-2005
which home improvement came to Alaska in a big way. Three new Home Depot stores and two new Lowe’s stores opened in late 2004 or 2005, adding a combined total of about 300 jobs to the state’s economy. Hope Depot opened a store in Mat-Su and two in Anchorage, and Lowe’s opened a store in Mat-Su and another in Fairbanks. Spenard Builders Supply, still the state’s largest employer in the category, also added a total of about 50 jobs in 2005 across its 14 stores.
Health care jobs grow a little slower
In very few industries could 900 new jobs and an annualized growth rate of 3.6 percent be considered a slowdown. Those numbers for health care in 2005, however, do suggest that after years of dramatic expansion, the industry may be approaching equilibrium and that less heady growth lies ahead.
Leisure and hospitality up again
Historically, most of the growth in the leisure and hospitality sector has come from food services and drinking places (restaurants and bars) and accommodations (hotels, inns and lodges). In 2005, though, those two categories accounted for just 500 of the 1,000 new jobs; the other 500 were generated by employers in the category called arts, entertainment and recreation, which is not separately published. Much of this category’s employment is related to the still-expanding visitor industry. The Point Sophia Development Company’s new cruise ship stop near Hoonah is an example, as are the miscellaneous guiding and touring companies frequented by cruise ship passengers, among others. By most accounts, 2005 was a solid year for the visitor industry, and the growth in the arts, entertainment and recreation category was a direct result.
Government jobs held steady
After trimming 200 government jobs in 2004, the state saw a small increase of 100 in 2005. Federal government employment fell by 200 jobs despite a high level of spending in the state and signifi cant activity at military installations.
2005 2004 Change Percent Change
Total Nonfarm Wage and Salary 1 309,900 304,200 5,700 1.9%Goods Producing 41,700 40,100 1,600 4.0%Service Providing 268,200 264,100 4,100 1.6%Natural Resources and Mining 10,700 10,100 600 5.9% Logging 500 500 0 0.0% Mining 10,300 9,600 700 7.3% Oil and Gas 8,700 8,200 500 6.1%Construction 18,600 17,700 900 5.1%Manufacturing 12,400 12,300 100 0.8% Wood Product Manufacturing 400 300 100 33.3% Seafood Processing 8,600 8,500 100 1.2%Trade, Transportation and Utilities 63,200 62,000 1,200 1.9% Wholesale Trade 6,300 6,200 100 1.6% Retail Trade 35,900 35,000 900 2.6% Food and Beverage Stores 6,300 6,100 200 3.3% General Merchandise Stores 9,100 9,200 -100 -1.1% Transportation, Warehousing and Utilities 21,000 20,800 200 1.0% Air Transportation 6,200 6,400 -200 -3.1% Truck Transportation 3,100 3,000 100 3.3%Information 6,900 6,900 0 0.0% Telecommunications 4,200 4,100 100 2.4%Financial Activities 14,700 14,600 100 0.7%Professional and Business Services 23,800 23,300 500 2.1%Educational 2 and Health Services 35,700 34,700 1,000 2.9% Health Care 25,800 24,900 900 3.6%Leisure and Hospitality 31,100 30,100 1,000 3.3% Accommodation 8,000 8,000 0 0.0% Food Services and Drinking Places 18,800 18,300 500 2.7%Other Services 11,400 11,200 200 1.8%Government 3 81,400 81,300 100 0.1% Federal Government 4 17,000 17,200 -200 -1.2% State Government 24,200 24,100 100 0.4% State Education 7,200 7,100 100 1.4% Local Government 40,200 40,000 200 0.5% Local Government Education 22,400 22,000 400 1.8% Tribal Government 4,100 4,100 0 0.0%
1 Excludes self-employed workers, fi shermen, domestic workers, upaid family workers and nonprofi t volunteers2 Private education only3 Includes employees of public school systems and the University of Alaska4 Excludes uniformed militaryBenchmark: March 2005
Source: Alaska Department of Labor & Workforce Development, Research and Analysis Section, in cooperation with the U.S. Department of Labor, Bureau of Labor Statistics
groundfi sh harvests were similar to 2004 levels. The effects of lower crab prices and the newer individual quota program were uncertain.
Home improvement pushes retail higher
Retail trade added 900 jobs for an annualized growth rate of 2.6 percent in 2005, a year in
7ALASKA ECONOMIC TRENDS APRIL 2006
Uniformed military are not included in the employment numbers published in Alaska Economic Trends, however, and a limited degree of privatization may be occurring in other areas of the federal government.
State and local government both saw modest growth in 2005, and in both cases, the education component accounted for all the new jobs – at the university level for state government and at the local school district level for local governments. Other than the education-related jobs, state government employment didn’t change and local government municipalities recorded a net loss of 200 jobs. Lowest unemployment since 2001
Revised unemployment data for 2005 show an average monthly rate of 6.8 percent, a drop of six-tenths of a percentage point from 2004 and the lowest rate since 2001. The actual number of unemployed people declined by more than 1,700 in 2005, indicating a slightly tighter labor market and a favorable environment for job seekers.
Anchorage
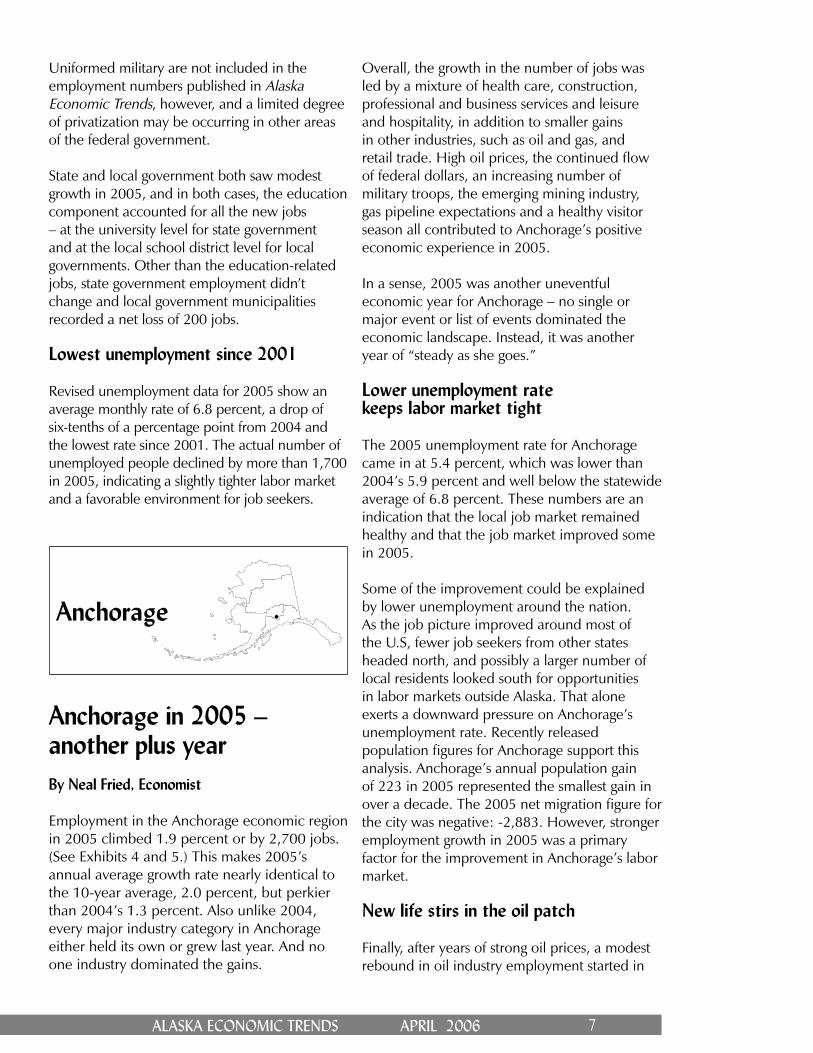
Anchorage in 2005 – another plus yearBy Neal Fried, Economist
Employment in the Anchorage economic region in 2005 climbed 1.9 percent or by 2,700 jobs. (See Exhibits 4 and 5.) This makes 2005’s annual average growth rate nearly identical to the 10-year average, 2.0 percent, but perkier than 2004’s 1.3 percent. Also unlike 2004, every major industry category in Anchorage either held its own or grew last year. And no one industry dominated the gains.
Overall, the growth in the number of jobs was led by a mixture of health care, construction, professional and business services and leisure and hospitality, in addition to smaller gains in other industries, such as oil and gas, and retail trade. High oil prices, the continued fl ow of federal dollars, an increasing number of military troops, the emerging mining industry, gas pipeline expectations and a healthy visitor season all contributed to Anchorage’s positive economic experience in 2005.
In a sense, 2005 was another uneventful economic year for Anchorage – no single or major event or list of events dominated the economic landscape. Instead, it was another year of “steady as she goes.”
Lower unemployment rate keeps labor market tight
The 2005 unemployment rate for Anchorage came in at 5.4 percent, which was lower than 2004’s 5.9 percent and well below the statewide average of 6.8 percent. These numbers are an indication that the local job market remained healthy and that the job market improved some in 2005.
Some of the improvement could be explained by lower unemployment around the nation. As the job picture improved around most of the U.S, fewer job seekers from other states headed north, and possibly a larger number of local residents looked south for opportunities in labor markets outside Alaska. That alone exerts a downward pressure on Anchorage’s unemployment rate. Recently released population fi gures for Anchorage support this analysis. Anchorage’s annual population gain of 223 in 2005 represented the smallest gain in over a decade. The 2005 net migration fi gure for the city was negative: -2,883. However, stronger employment growth in 2005 was a primary factor for the improvement in Anchorage’s labor market.
New life stirs in the oil patch
Finally, after years of strong oil prices, a modest rebound in oil industry employment started in

8 ALASKA ECONOMIC TRENDS APRIL 2006
2005, as Anchorage had 100 more oil industry jobs than it did in 2004. Statewide, the recovery was considerably stronger. British Petroleum offi cials recently announced they would be hiring 250 additional workers, a signifi cant shift from the recent past when they trimmed their work force and closed their Alaska exploration offi ce. The level of exploration and maintenance activity accelerated on the North Slope in 2005 as well. ConocoPhillips was involved in several of the larger projects, and it continued to develop fi elds around Alpine as well as its West Sak heavy oil project.
Construction – another stellar year
Construction has been expanding since 1989 and that growth trend carried through 2005 with more than the usual gusto – 500 jobs more than 2004. Only health care employment grew more. By the end of 2005, permit valuation in Anchorage reached $661 million, the second-highest level since the 1986 economic bust.
Massive military spending, healthy levels of commercial activity, increases in oil- and mining-related work and continued strength in other public spending kept local contractors busy. No one project, nor one segment of the industry, dominated the industry. The elixir of low interest rates continues to provide a
tonic for the construction industry. Moreover, Anchorage is the headquarters for much of the state’s construction industry; local contractors continued to benefi t from strong activity in the Interior, the Matanuska-Susitna Borough and other parts of the state.
Only residential-related construction activity fell in 2005. The number of residential building permits decreased from 1,812 in 2004 to 1,725 in 2005, and nearly 61 percent of the 2005 residential units were multi-family. As land costs in Anchorage continue to rise, an increasing share and possibly most of the region’s residential activity is now shifting to the Mat-Su area.
A moderate year for retail
For an industry that employs more private sector workers than any other industry, the addition of 100 jobs in 2005 is hardly worth mentioning. In 2004, the gains were also miniscule. Although a number of new retail stores opened in Anchorage in 2005, they did not open until late in the year. New Home Depot stores in the Northway Mall and on Abbott Road in South Anchorage opened for business. Other smaller establishments followed suit. Most of the retail growth in the state in 2005 took place in Fairbanks and the Mat-Su Borough. In fact, one explanation for Anchorage’s lackluster performance can be attributed to the dramatic growth in the Mat-Su area’s retail sector. This means that fewer Mat-Su residents fi nd it necessary to shop in Anchorage.
Transportation budges little
Although transportation’s employment numbers only grew modestly this past year, the overall environment for the industry remained positive. An upswing in international air cargo traffi c, a decent visitor season and a strong level of overall economic activity were all pluses for Anchorage’s transportation sector. Cargo landings grew by 8 percent. A growing share of this activity includes the transfer of cargo rather than just being transit. America West 1 and Condor Air both added to their number of
1 US Airways recently purchased America West and the companies are in the process of merging.
0.5%
2.1%
3.9%
1.9%
2.6%2.8%
1.9%
1.1%1.3%
1.9%
96 97 98 99 00 01 02 03 04 05
4 Anchorage Growth a Bit Stronger Employment change from previous year
Source: Alaska Department of Labor & Workforce Development, Research and Analysis Section

9ALASKA ECONOMIC TRENDS APRIL 2006
5Wage and Salary EmploymentAnchorage, 2004-2005
2005 2004 ChangePercentChange
Total Nonfarm Wage and Salary 1 146,800 144,100 2,700 1.9%Goods Producing 13,700 13,000 700 5.4%Service Providing 133,100 131,100 2,000 1.5%Natural Resources and Mining 2,100 2,000 100 5.0% Mining 2,100 2,000 100 5.0% Oil and Gas 2,000 1,900 100 5.3%Construction 9,700 9,200 500 5.4%Manufacturing 1,900 1,800 100 5.6%Trade, Transportation and Utilities 33,200 33,000 200 0.6% Wholesale Trade 4,700 4,700 0 0.0% Retail Trade 17,400 17,300 100 0.6% Food and Beverage Stores 2,400 2,500 -100 -4.0% General Merchandise Stores 4,300 4,200 100 2.4% Transportation, Warehousing and Utilities 11,100 11,000 100 0.9% Air Transportation 3,600 3,700 -100 -2.7%Information 4,400 4,400 0 0.0% Telecommunications 2,700 2,600 100 3.8%Financial Activities 9,100 9,000 100 1.1%Professional and Business Services 16,400 16,000 400 2.5%Educational 2 and Health Services 19,100 18,400 700 3.8% Health Care 14,300 13,700 600 4.4%Leisure and Hospitality 15,100 14,700 400 2.7% Accommodation 3,200 3,100 100 3.2% Food Services and Drinking Places 10,100 9,900 200 2.0%Other Services 5,700 5,600 100 1.8%Government 3 30,100 30,000 100 0.3% Federal Government 4 9,500 9,700 -200 -2.1% State Government 9,700 9,600 100 1.0% State Government Education 2,300 2,300 0 0.0% Local Government 10,900 10,700 200 1.9% Tribal Government 300 300 0 0.0% Local Government Education 7,500 7,400 100 1.4%
1 Excludes self-employed workers, fi shermen, domestic workers, unpaid family workers and nonprofi t volunteers2 Private education only3 Includes employees of public school systems and the University of Alaska4 Excludes uniformed military Benchmark: March 2005
Source: Alaska Department of Labor & Workforce Development, Research and Analysis Section
translated into a good visitor season for Anchorage. The city collected nearly $12 million in bed taxes in 2005, a 3 percent increase over the previous year. Although no new hotels opened their doors in 2005, accommodation employment grew by 100. Stronger growth came from food services and drinking places – an industry that benefi ts from visitors as well as local residents. This modest growth came from the several new restaurants that opened in Anchorage.
fl ights and Northwest Airlines added Anchorage/Hawaii service. Employment at Alaska Airlines, Alaska’s largest air carrier, changed little in 2005, as much-higher fuel prices made it tougher on a number of air carriers.
Health care tops job growth again
Educational and health services created 700 new jobs in Anchorage and 600 of these were in health care – the perennial job machine in Anchorage. Health care has generated the largest number of jobs in Anchorage for at least the past fi ve years. All levels of health care grew in Anchorage, including hospitals, doctors’ offi ces, clinics and just about anything else tied to the industry. The growth in federal monies also continues to bolster health care employment.
Professional and business services adds 400 jobs
Healthy levels of construction, increased oil and mining activity and other broad-based industry growth continued to give professional and business services a big shot in the arm. Architectural, engineering, environmental and other consulting fi rms have thrived with construction. Legal, accounting, computer and other professional-type services have continued to expand more gradually with the rest of the economy.
Interest rates keep the financial industry in the expansion mode
With all the new bank, credit union, insurance, real estate and mortgage buildings popping up around the city, it should not come as a surprise that the fi nancial industry remained in the expansion mode in 2005. Continued low interest rates and a healthy real estate market are keeping the banks, insurance companies, credit unions and other fi nancial companies in good shape. As a result, employment in the fi nancial industry grew by 100 jobs.
New eateries and a healthy visitor season are good for leisure and hospitality
A strong national economy, more hotel and cruise ship capacity and a weak dollar

10 ALASKA ECONOMIC TRENDS APRIL 2006
Uniformed military flexes their muscles
Troop levels at Fort Richardson began to grow in 2003 after many years of decline and stagnation. By 2005, the uniformed military count reached 4,100, more than 1,500 stronger than just two years earlier. Once the current expansion is completed, the number should rise to 4,500, the largest number of troops stationed at the base since 1988. For Anchorage’s economy, it means more soldiers will also be living off-post and more soldiers will be spending dollars in the local economy.
Government inches up
Despite the healthy fl ows of federal dollars to Alaska and big uniformed military personnel increases, federal civilian employment actually fell slightly in 2005. The privatization of military support activities and many Alaska Native Medical Center positions might explain some of the 200-job loss, along with some retrenchment in the Transportation Security Administration work force. Employment gained ground in state and local government, growing by 100 and 200 jobs, respectively. Most of local government’s modest growth came from the Anchorage School District.
Fairbanks
Fairbanks keeps adding jobsBy Brigitta Windisch-Cole, Economist
With 2005, Fairbanks has recorded another year of employment growth, adding to its 16-year trend of expansion and diversifi cation. The local employment gain amounted to 600 new jobs, which translated into a growth rate of 1.6 percent. (See Exhibits 6 and 7.) This performance is somewhat amazing, considering that 2005 not only kept the momentum of
2004’s high growth, it did so even though 3,400 Fairbanks soldiers were deployed overseas in August 2005.
Perhaps the biggest story in 2005 was the initial recommendation by the Department of Defense’s Base Realignment and Closure Commission to withdraw more than 2,800 uniformed personnel and 300 civilian employees over a fi ve-year period from Eielson Air Force Base. After an intense lobbying effort, Eielson was largely spared in the fi nal recommendation, which called for the reassignment of some aircraft to other bases and a reduction of only 600 uniformed personnel. The impact of the military in Fairbanks is hard to overstate; had the initial recommendation been followed, total direct and indirect civilian job losses could have been as much as 1,900, an 8.6 percent drop.
The deployment of Fairbanks’ 3,400 troops in 2005 did not slow the city’s retail expansion, which contributed half the new jobs. Other contributions to job growth came from construction, fi nancial activities, health care services and local government. Most other industries adhered to their previous year employment levels; only transportation and the catch-all industry category of “other services” shed jobs.
Fairbanks’ job market remained tight and a low annual average unemployment rate of 5.8 percent verifi ed positive elements in the local economy. Moreover, the local payroll increased by 7.5 percent during the fi rst nine months of 2005 over the comparable months of 2004. The fourth quarter 2005 payroll reports have not yet been recorded.
Employment growth was particularly strong during the fi rst half of 2005, posting an average growth rate of 2.7 percent over the fi rst half of 2004 and hinting of a strong carry-over of 2004 business activity. Growth did slow some during the second half of the year with the winding-down of two large-scale construction projects, Fort Wainwright’s Bassett Army Community Hospital and the University of Alaska’s Museum of the North in Fairbanks.

11ALASKA ECONOMIC TRENDS APRIL 2006
0.5%
2.2%
2.8%
1.2%
1.8%
2.2% 2.2%
1.6%
3.3%
1.6%
96 97 98 99 00 01 02 03 04 05
Source: Alaska Department of Labor & Workforce Development, Research and Analysis Section, in cooperation with the U.S. Bureau of Labor Statistics
6Growth Continues in FairbanksEmployment change from previous year
Construction employment nears the “boom” level
After 21 years, Fairbanks’ construction reached the employment levels it showed during the build-up of the mid-1980s’ construction boom. Employment in 2005 equaled the 1984 level that led to the 1985 construction bubble, which burst in the 1986-1988 crash.
Although of similar strength, Fairbanks’ fast-paced construction activity in the new millennium does not resemble the memorable boom and bust cycle of the 1980s. Back then, impetus for growth came primarily from public sector construction followed by frenzied residential building. In contrast, the recent building in Fairbanks has been a diversifi ed mix of public sector, commercial, industrial and moderate residential building. The near lack of speculative residential construction has also contributed to industry stability.
During 2005, construction employment increased by 100 jobs, or roughly 4 percent, and public sector construction, particularly military projects, dominated. Several large projects, including Bassett Hospital and the university museum, were near completion at the end of 2005. Commercial and industrial building also remained vibrant and the multi-store retail expansion at the Bentley Trust property became retail’s newest showcase.
Retail contributes the most jobs
The strongest contributor to job growth in 2005 was the retail industry, which added 300 jobs. While construction has built new foundations since 2002 for the industry’s expansion, retail employment started to record substantial gains in 2004 and 2005. The most recent additions to Fairbanks’ retail market were specialty stores such as PETCO, Sportsman’s Warehouse and Old Navy.
Financial industries expand
Financial institutions have expanded their presence in Fairbanks in recent years. A bank, a credit union and an equipment leasing business
were built in 2004. A bank, a credit union and a fi nancial center were built, and a retail credit union branch was moved into an existing store, all in 2005.
The employment numbers, therefore, have gradually increased, producing a gain of 100 jobs in 2005. Locally, the fi nancial sector is a small employer, so this relatively small gain translates into a robust growth rate of more than 7 percent, a deviation from the sector’s traditional slow-growth pattern.
Health care – a perennial creator of jobs
Just like in most other Alaska locations, Fairbanks’ health care industry continued its path of growth. The industry gained 100 health care jobs in 2005, representing a growth rate of 3.3 percent that was more than twice that of overall employment. The expansion of specialized medical services has signifi cantly helped industry growth in the area.
Natural resource employment grows
Fairbanks’ natural resource industry consists primarily of gold mining and oil fi eld services companies. Employment increases in 2005 came primarily from the oil fi eld services industry that

12 ALASKA ECONOMIC TRENDS APRIL 2006
helped install and build technical upgrades for the trans-Alaska oil pipeline. This large scale project created most of the industry’s 100-job gain.
Hard rock mining employment in Fairbanks did not substantially change in 2005, although Teck-Pogo Inc. moved its administrative headquarters to the permanent Pogo mine site northeast of Delta Junction. The mine’s new employees are counted outside Fairbanks, in the Southeast Fairbanks Census Area. Delta Junction is the largest community in that census area.
Public sector employment shows little change
Both state and federal government employment showed no change in 2005. Only local
government added 100 jobs, mostly in the Fairbanks North Star Borough School District. Although enrollment declined slightly, the district hired additional staff with federal grants to tutor students in writing, reading and math.
Transportation and other services lose jobs
Transportation, which includes warehousing and utilities, shed roughly 100 jobs in 2005. The local airline industry during the fi rst half of the year still showed signs of suffering due to the consolidation of bypass mail 2 and regular U.S. mail contracts; however, the low point in employment may have been reached as the number of jobs in this sector during the second half of the year began to show gains. Even with this turnaround, Fairbanks’ air transportation employment toward the end of 2005 remained more than 200 jobs below the 2001 level.
In the past few years, several small freight airlines in Fairbanks closed their doors when the U.S. Postal Service, operating under new rules, began assigning an increasing share of bypass mail to companies that fl y larger passenger-carrying aircraft. The Postal Service also paid lower bypass mail rates to the air carriers. Small operators with small planes found it diffi cult to compete for this type of mail delivery.
In other transportation sectors, employment in trucking for the fi rst part of 2005 was slightly lower than what it was in 2004, although by July employment had exceeded the year-ago level of about 750 jobs. Scenic and sightseeing transportation jobs were up slightly in 2005 compared to a year earlier. Both trucking and scenic and sightseeing employment displayed consistent seasonal employment patterns with summer peaks and winter lows.
Increasing operating costs are likely dampening growth throughout the sector. Fuel costs are a major expense for employers and the fast rises in prices for gasoline, diesel and aviation fuel have been diffi cult to plan for. Insurance coverage,
2 Bypass mail is generally a pallet shipment of groceries which are sent via the mail system to rural villages. Shrink-wrapped pallets generally weigh up to 1,000 pounds and go directly to the air carrier for delivery, bypassing the post offi ce.
7Wage and Salary Employment Fairbanks, 2004-2005
2005 2004 ChangePercentChange
Total Nonfarm Wage and Salary1 37,800 37,200 600 1.6%Goods Producing 4,500 4,300 200 4.7%Services Providing 33,300 32,900 400 1.2%Natural Resources and Mining 1,000 900 100 11.1%Construction 2,900 2,800 100 3.6%Manufacturing 600 600 0 0.0%Trade, Transportation and Utilities 7,600 7,400 200 2.7% Wholesale Trade 600 600 0 0.0% Retail Trade 4,700 4,400 300 6.8% Transportation, Warehousing and Utilities 2,300 2,400 -100 -4.2%Information 600 600 0 0.0%Financial Activities 1,500 1,400 100 7.1%Professional and Business Services 2,200 2,200 0 0.0%Educational2 and Health Services 4,200 4,100 100 2.4% Health Care 3,100 3,000 100 3.3%Leisure and Hospitality 4,200 4,200 0 0.0% Accommodation 1,300 1,200 100 8.3% Food Services and Drinking Places 2,600 2,500 100 4.0%Other Services 1,300 1,400 -100 -7.1%Government3 11,700 11,600 100 0.9% Federal Government4 3,400 3,400 0 0.0% State Government 5,200 5,200 0 0.0% Local Government 3,100 3,000 100 3.3%
1 Excludes self-employed workers, fi shermen, domestic workers, unpaid family workers and nonprofi t volunteers2 Private education only3 Includes employees of public school systems and the University of Alaska4 Excludes uniformed militaryBenchmark: March 2005
Source: Alaska Department of Labor & Workforce Development, Research and Analysis Section, in cooperation with the U.S. Bureau of Labor Statistics

13ALASKA ECONOMIC TRENDS APRIL 2006
a necessity for businesses in transportation, has also become increasingly expensive and sometimes diffi cult to get.
“Other services” are an eclectic group of industries that include all types of repair and maintenance services, personal and laundry services, and religious and social advocacy groups, among others. A drop in employment in this category is hard to identify and may be from technical shifts. Often new businesses are temporarily listed as “other services” until more precise classifi cations can be assigned. The employment decline of 100 jobs in 2005 mostly translated into gains for other industries.
The leisure and hospitality sector shifts within, but growth was flat
Although the leisure and hospitality sector did not show increased employment, the usual churning among restaurant businesses changed the local culinary scene. Late in the summer of 2005, for example, a few Wendy’s establishments shut down but soon after a new Chili’s opened for business.
Tourism is also an important infl uence in the leisure and hospitality sector. Most Fairbanks industry experts agreed that the 2005 visitor season produced satisfactory results even if they did not produce actual employment growth.
SoutheastRegion
Southeast SputtersBy Neal Gilbertsen, Economist
Over the last decade, the Southeast economy has behaved like a sputtering engine: a year of job growth has often been followed by a year of job losses and no momentum has developed in either direction. (See Exhibits 8 and 9.) A solid increase of 600 jobs in 2005 brought the region’s total to 36,550, but fi ve years of gains and fi ve years of losses have resulted in a net gain of just 900 jobs over the 10-year period.
The growth in 2005 came entirely from the private sector and was scattered across a number of industries. Juneau and Sitka enjoyed the largest share, but a good summer visitor season and a relatively good year for fi shing also spread small gains throughout the remainder of the region.
Construction and logging up modestly
The troubled forest products industry added a few jobs in 2005 due to slightly increased activity
Rounding
Statewide, Anchorage/Mat-Su and Fairbanks employment data published in Alaska Economic Trends are produced in cooperation with the U.S. Bureau of Labor Statistics. BLS requires that the employ-ment numbers be rounded to the nearest 100 to avoid giving a false impression about the level of precision represented.
Employment data for other regions of the state are produced with the same methods, but indepen-dently of BLS, and are rounded to the nearest 50 because the numbers are generally smaller.
What this means to the user is that small changes in the numbers should be viewed with caution. For example, the increase of 50 health care jobs in Southeast, from 2,150 to 2,200, may be marginally higher or lower depending on the effects of rounding. Over the longer term, the numbers produced are very effective at tracking employment growth or declines, but from one point in time to another – especially with smaller employment levels – actual economic change can be exaggerated or understated due to rounding.

14 ALASKA ECONOMIC TRENDS APRIL 2006
in the Ketchikan and Prince of Wales areas. Over the longer-term, logging employment has consistently fallen over the decade.
Construction was a mixed bag across the region in 2005. Juneau, Sitka, Haines and the Skagway-Hoonah-Angoon Census Area all reported gains, while Ketchikan, Yakutat, as well as the Wrangell-Petersburg and Prince of Wales-Outer Ketchikan census areas had less construction activity in 2005. The net result for the region was a gain of 100 jobs. Construction employment has been relatively stable since 2001 and has fallen about 150 jobs over the decade.
Mining and seafood processing hold steady
Employment at the Kensington mine near Juneau began to grow in the last few months of 2005 but
the added jobs were not enough to impact the industry’s rounded annual average. The average number of seafood processing jobs in 2005 was unchanged, but the 1,450 processing jobs are up noticeably from the decade-low of 1,300 in 2001.
Fishing
Aside from its direct impact on seafood processing employment, fi shing is a major economic driver in Southeast. Economically, salmon and halibut are the two most important species. The 2005 Southeast salmon season produced an estimated harvest of 298 million pounds with a provisional value of $70.1 million. This compares with a nearly identical 2004 harvest of 298 million pounds worth $83.8 million. The 16 percent drop in value is explained by the fact that trollers caught fewer high-value king and coho salmon than they did in 2004, while driftnetters and seiners harvested fewer sockeye and chum salmon.
There was, however, a dramatic upswing in the lower-priced pink harvest, which increased nearly 27 percent in volume to 208 million pounds. Participation in both the seine and driftnet fi sheries remained low with 235 seine and 375 driftnet vessels fi shing in 2005. This represents a considerable reduction in both fi shing effort and employment opportunities from 2000 when 356 seine and 422 driftnet permit holders harvested salmon.
Halibut landings for Southeast’s Area 2C were strong, approaching 10.5 million pounds. This was up slightly from the 10.1 million pounds taken in 2004, and considerably higher than the 8.2 million pounds in 2003. While the total estimated value was not available at the time of publication, by the end of the season, ex-vessel prices had reached an all-time high in Juneau, in some cases exceeding $4 per pound. Because Juneau has the busiest airport in Southeast, fi shermen and processors have better access to fresh markets, which in a large part explains these higher prices.
A good year for the tourism industry
A signifi cant portion of Southeast’s job growth in 2005 was directly attributable to the tourism
8 Southeast Employment in 2005Employment change from previous year
Source: Alaska Department of Labor & Workforce Development, Research and Analysis Section
-0.1%
0.8%
-1.8%
1.6%
1.1%
-0.8%
-0.4%
1.5%
-1.1%
1.7%
96 97 98 99 00 01 02 03 04 05
0.0%
2.0%
4.0%
-2.0%
-4.0%

15ALASKA ECONOMIC TRENDS APRIL 2006
9Wage and Salary EmploymentSoutheast, 2004-2005
2005 2004 ChangePercentChange
Total Nonfarm Wage and Salary 1 36,550 35,950 600 1.7%Goods Producing 4,100 3,950 150 3.8%Services Providing 32,450 32,000 450 1.4%Natural Resources and Mining 650 600 50 8.3% Logging 350 300 50 16.7% Mining 300 300 0 0.0%Construction 1,600 1,500 100 6.7%Manufacturing 1,850 1,850 0 0.0% Seafood Processing 1,450 1,450 0 0.0%Trade, Transportation and Utilities 7,400 7,200 200 2.8% Retail Trade 4,650 4,550 100 2.2%Information 600 550 50 9.1%Financial Activities 1,300 1,250 50 4.0%Professional and Business Services 1,300 1,350 -50 -3.7%Educational 2 and Health Services 3,550 3,450 100 2.9% Health Care 2,200 2,150 50 2.3%Leisure and Hospitality 3,650 3,450 200 5.8%Other Services 1,200 1,200 0 0.0%Government 3 13,450 13,550 -100 -0.7% Federal Government 4 2,000 2,050 -50 -2.4% State Government 5,500 5,450 50 0.9% Local Government 5,950 6,050 -100 -1.7% Tribal Government 800 850 -50 -5.9%
1 Excludes self-employed workers, fi shermen, domestic workers, unpaid family workers and nonprofi t volunteers2 Private education only3 Includes employees of public school systems and the University of Alaska4 Excludes uniformed militaryBenchmark: March 2005
Source: Alaska Department of Labor & Workforce Development, Research and Analysis Section
employment fell by 100 jobs. From 2001 to 2003, total government employment grew by 550 and then fell by 300 over the next two years.
Unemployment down
All eight of Southeast’s boroughs and census areas registered lower unemployment rates in 2005. The Wrangell-Petersburg Census Area had the largest decline, dropping from 12.6 percent in 2004 to 10.1 percent in 2005.
Juneau’s and Sitka’s rates remained substantially lower than the rest of the region at 5.3 and 5.5 percent, respectively. The Skagway-Hoonah-Angoon and Prince of Wales-Outer Ketchikan census areas shared the region’s highest rate in 2005 at 13.2 percent.
industry. According to the McDowell Group, an Alaska research and consulting fi rm, nearly 948,000 cruise ship passengers passed through Southeast in 2005. This represented a 48 percent increase from the 640,000 passengers who visited the region in 2000. This dramatic expansion seems to account for much of the increased hiring in the leisure and hospitality industry and has also contributed to gains in other industries.
Examples of this tourist-driven growth include a new tour bus company headquartered in Juneau and a new cruise ship stop near Hoonah, the Point Sophia Development Company’s Icy Strait Point project. Juneau also added several new restaurants that contributed to the 5.8 percent job growth in leisure and hospitality.
Ongoing gains for retail and health care
Since 2001, retail trade and health care have generated more than 600 new jobs in Southeast. Both industries grew again in 2005, though at a measured pace. Most of 2005’s new retail jobs were in Juneau, although Sitka, Haines and Wrangell-Petersburg also reported small gains. Ketchikan’s retail industry continued to struggle, losing more than 50 jobs in 2005.
Health care and most other industries categorized as services-providing recorded slight gains in 2005. The one exception was professional and business services, which includes everything from lawyers and accountants to travel agents and security guards. Annual gains and losses of 50 to 100 are too small to be considered signifi cant, however, and a longer-term view is more helpful. In the case of professional and business services, the sector shows a net decline of 50 jobs from 2001 to 2005.
Government declines
Federal and local government registered lower employment levels in 2005. These losses were only partially offset by a slight increase in state government. As a result, overall government

16 ALASKA ECONOMIC TRENDS APRIL 2006
A slower year for construction
Although the three areas of the Gulf Coast region had busy construction seasons, activities did not quite match 2004’s performances. The Kenai Peninsula Borough’s largest projects were the expansion of the Central Peninsula General Hospital in Soldotna and a new Kenai River highway bridge to replace Soldotna’s old one. Seward began to expand its harbor and Homer residential building remained brisk. One of Kodiak Island’s largest projects was the paving of a 16-mile stretch of the Chiniak Highway.
Public sector projects also dominated the construction scene in the Valdez-Cordova Census Area, which includes the Copper River area. The rebuilding of the Million Dollar Bridge in Cordova and the Dayville Road upgrade in Valdez were among the area’s largest infrastructure projects. The new projects that are lining up for the upcoming construction season will likely mean another good construction year.
Enrollment and school employment move in synch
Falling enrollment in the Gulf Coast region has become a common trend. Between the 1999-2000 school year and 2004-2005 school year, the districts in the Valdez-Cordova Census Area had an 8 percent loss in enrollment, and both Kodiak Island and the Kenai Peninsula recorded 5 percent declines. It is therefore not surprising that school employment has also suffered losses. Last year, there were 50 fewer jobs in the Gulf Coast region’s school districts. School district projections hold that additional enrollment declines are likely.
The values of Gulf fish harvests rebound
Gulf fi shermen contributed a large share to the state’s third-biggest salmon catch ever. The Kodiak Island and Prince William Sound salmon fl eets delivered over 75.5 million pink salmon – more than half the state’s largest pink salmon harvest.
Gulf CoastRegion
Gulf Coast region economies hold steadyBy Brigitta Windisch-Cole, Economist
Among the areas of the Gulf Coast region, the Kenai Peninsula Borough is the largest in terms of population and employment. The Kenai Peninsula contributes nearly 64 percent of the regional employment, followed by the Kodiak Island Borough with 19 percent, and the Valdez-Cordova Census Area with the remaining 17 percent.
While employment increased slightly in the Kenai Peninsula Borough in 2005, both the Kodiak Island Borough and the Valdez-Cordova Census Area suffered small declines. Combined, the region posted a small net loss of 50 jobs, confi rming that not much has changed in the Gulf Coast region’s employment scene. (See Exhibit 10.) The lack of growth in job markets, however, did not translate into negative economic trends. The visitor season produced positive results and the salmon season was surprisingly strong.
The small changes in construction, manufacturing, professional services and government indicated job losses but gains in trade, education and health care and information nearly offset those losses. During the fi rst half of 2005, both the Kodiak Island Borough and the Valdez-Cordova Census Area fell short of their 2004 employment levels, but Kodiak Island picked up the pace in the third quarter of 2005. The Kenai Peninsula Borough posted gains in the fi rst nine months of employment records. The fourth quarter 2005 payroll reports have not yet been recorded.

17ALASKA ECONOMIC TRENDS APRIL 2006
Cook Inlet fi shermen did their part with a harvest of over 5.4 million sockeye salmon, their main target species and the species that helped most in earnings. Prices for Cook Inlet sockeye salmon were 34 percent higher in 2005 than in 2004, leading to an overall earnings increase of 33 percent in 2005 compared to 2004.
Earnings also improved for Prince William Sound and Kodiak fi shermen, although the harvest prices paid for pinks remained low. The high volume, however, made up some for depressed prices. Fishermen in these two areas harvest a mixed stock of salmon that consists of fi ve distinct species, so the rebounding sockeye prices benefi ted the fi shermen’s earnings as well. The value of the 2005 Prince William Sound salmon harvest was up 14 percent over the 2004 catch; Kodiak’s was up 10 percent.
Seafood processing employment shows a small decline
Although the salmon harvest was bountiful, average seafood industry employment in 2005 showed a small decline. Slow winter and spring fi shing activity held back regional growth early in the year. Employment started to rise rapidly during the salmon season, and between June and September, Kodiak Island and the Kenai Peninsula recorded job gains over the 2004 season. Seafood processing employment in the Valdez-Cordova Census Area showed little change in 2005.
Big harvests do not necessarily result in parallel employment growth in the seafood processing industry. Often busy harvesting seasons lead to better utilization of the seafood processing work force, which results in more hours and pay for the existing workers. During the third quarter of 2005, in the height of salmon processing, the payrolls in all three areas of the region showed respectable improvement over 2004 earnings. Wages in the Kenai Peninsula Borough, for example, increased by 29 percent, followed by a 24 percent gain on Kodiak Island, and a 13 percent gain in the coastal communities of the Valdez-Cordova Census Area.
NorthernRegion
Employment is up but local governments struggleBy Brigitta Windisch-Cole, Economist
After two years of declining employment, growth returned to the Northern region. The gain of 250 jobs in 2005 translated to a 1.6 percent growth rate. (See Exhibit 11.) Most of the new jobs came
Wage and Salary EmploymentGulf Coast Region, 2004-2005
2005 2004 ChangePercentChange
Total Nonfarm Wage and Salary 1 28,400 28,450 -50 -0.2%Goods Producing 5,700 5,800 -100 -1.7%Services Providing 22,700 22,650 50 0.2%Natural Resources and Mining 1,150 1,150 0 0.0% Oil and Gas 1,000 1,000 0 0.0%Construction 1,550 1,600 -50 -3.1%Manufacturing 3,000 3,050 -50 -1.6% Seafood Processing 2,350 2,400 -50 -2.1%Trade, Transportation and Utilities 5,700 5,600 100 1.8% Retail Trade 3,450 3,350 100 3.0%Information 450 400 50 12.5%Financial Activities 850 850 0 0.0%Professional and Business Services 1,200 1,250 -50 -4.0%Educational 2 and Health Services 2,400 2,350 50 2.1% Health Care 1,600 1,600 0 0.0%Leisure and Hospitality 3,350 3,350 0 0.0%Other Services 1,250 1,250 0 0.0%Government 3 7,500 7,600 -100 -1.3% Federal Government 4 800 850 -50 -5.9% State Government 1,700 1,700 0 0.0% Local Government 5,000 5,050 -50 -1.0% Tribal Government 400 400 0 0.0%
1 Excludes self-employed workers, fi shermen, domestic workers, unpaid family workers and nonprofi t volunteers2 Private education only3 Includes employees of public school systems and the University of Alaska4 Excludes uniformed militaryBenchmark: March 2005
Source: Alaska Department of Labor & Workforce Development, Research and Analysis Section
10

18 ALASKA ECONOMIC TRENDS APRIL 2006
from the oil industry, which added 350 jobs and posted a growth rate of 7.3 percent in 2005.
Public sector employment, though, declined for the fourth year in a row. Job losses were felt most severely in the non-oil producing residential areas of the North Slope Borough. Diminishing public revenues from oil fi eld properties strapped the funding for public services. In the Nome Census Area, employment stayed the same and in the Northwest Arctic Borough, job counts increased a bit. Employment at the Red Dog Mine, the borough’s strongest economic contributor, rebounded and high zinc prices helped make 2005 a profi table year.
Tribal entities and school districts trim jobs
Most of the declines in public sector employment came from tribal organizations and from school districts. Between the 1999-2000 school year and the 2004-2005 school year, school enrollment in the Northern region fell by 550, or 8 percent. The drop was most dramatic in the North Slope Borough, where average attendance counts fell by nearly 320 students, or 16 percent, during the same period. The Northwest Arctic Borough School District lost 150 students, or 7 percent, and the Nome Census Area lost 80, or 3 percent, during the fi ve-year period.
In response, some school districts have reduced staff and a few tribal organizations have also trimmed employment. The losses have been concentrated in Barrow.
Oil industry employment regains ground
The Northern region employment in the oil fi elds themselves grew by 350 jobs. Renewed interest in exploration, large maintenance programs, facility upgrades and infrastructure renewals have helped boost oil services employment. High oil prices gave oil companies an incentive to develop additional satellite fi elds adjacent to the larger producing deposits whose revenues are declining. New players such as Eni Petroleum Company Inc. and Shell Exploration & Production Company have joined the cadre of the traditional producers showing interest in exploration.
SouthwestRegion
High energy costs dampen growth; fishing strongBy Brigitta Windisch-Cole, Economist
The vast Southwest economic region’s combined loss of 100 jobs in 2005 lowered job levels by 0.5 percent. (See Exhibit 12.) Unlike other years, seafood – the region’s principal industry – failed to tilt the employment level. Seafood processing employment in 2005 held par with its 2004 average. Local government’s dwindling money caused most of the job losses.
Rising costs cause big dents in local government
A lack of public sector funding and high transportation and utility costs in 2005 turned problematic for many remote Southwest Alaska communities. Many small communities fought
11Wage and Salary EmploymentNorthern Region, 2004-2005
2005 2004 ChangePercentChange
Total Nonfarm Wage and Salary 1 16,000 15,750 250 1.6%Goods Producing 5,850 5,500 350 6.4%Services Providing 10,150 10,250 -100 -1.0% Oil and Gas 5,150 4,800 350 7.3%Government 2 4,650 4,750 -100 -2.1% Federal Government 3 150 150 0 0.0% State Government 350 350 0 0.0% Local Government 4,150 4,250 -100 -2.4% Tribal Government 450 500 -50 -10.0%
1 Excludes self-employed workers, fi shermen, domestic workers, unpaid family workers and nonprofi t volunteers2 Includes employees of public school systems and the University of Alaska3 Excludes uniformed militaryBenchmark: March 2005
Source: Alaska Department of Labor & Workforce Development, Research and Analysis Section

19ALASKA ECONOMIC TRENDS APRIL 2006
to survive amidst skyrocketing energy prices and persistent high oil prices had a substantial impact on local costs of generating public utilities.
For instance, using the September prices each year, the 2005 price of 55 gallons of heating oil in Bethel, a regional hub, has doubled in fi ve years.3 The price in 2005 was $211, which is 53 percent higher than what it would have cost to buy in Anchorage. The 2005 price of 1,000 kilowatt hours of electricity in Bethel has increased by a third in fi ve years. The 2005 price was $290, which is 138 percent higher than what it would have cost to buy in Anchorage.
The cash squeeze in some cases even led some people to consider disbanding local government entities because they could not meet payrolls for local public services. Local government employment fell by 150 jobs in 2005, mostly in remote communities where people rely on subsistence and where alternative employment barely exists.
Southwest’s commercial fishing areas fare better
Commercial fi shing along the Alaska Peninsula, the Aleutians, in the Bering Sea and in Bristol Bay produced good results in 2005. The salmon fi shery, in particular, was a success. Recovering sockeye salmon prices contributed the most in topping 2004’s harvest values.
In the sockeye capital, Bristol Bay, ex-vessel values were up 20 percent in 2005, although the catch was down by 5 percent over the previous year. Alaska Peninsula and Aleutian fi shermen landed more fi sh in 2005 than in 2004 and their value increased by 24 percent. Chignik’s catch nearly doubled; its value was worth more than twice as much in 2005 than it was the year before.
3 Energy costs are from the University of Fairbanks’ Cooperative Extension Service publication, Costs of Food at Home for a Week in Alaska.
Groundfi sh harvests in 2005 were similar to 2004’s catch. Pollock catches in 2005 were up from the year before, but the Pacifi c cod volume was down. Roughly half of the Southwest region’s harvests are processed at sea on large catcher-processor boats or on anchored mother ships. The other half of the voluminous harvests reach shore in Western Alaska to be processed in large seafood processing plants in Unalaska, Dutch Harbor and Akutan.
The Southwest region’s crab fi sheries did not quite match the 2004 season values because prices for king, tanner and snow crab were down. Harvest volume in the red king crab species increased in 2005 over 2004 numbers, but the golden king crab catch was down substantially. The January through March snow crab harvest came in a bit higher in 2005 than the year before.
12Wage and Salary EmploymentSouthwest Region, 2004-2005
2005 2004 Change PercentChange
Total Nonfarm Wage and Salary 1 19,350 19,450 -100 -0.5%Goods Producing 5,000 5,000 0 0.0%Services Providing 14,350 14,450 -100 -0.7% Seafood Processing 4,700 4,700 0 0.0%Government 2 7,350 7,500 -150 -2.0% Federal Government 3 350 350 0 0.0% State Government 550 550 0 0.0% Local Government 6,450 6,600 -150 -2.3% Tribal Government 1,650 1,650 0 0.0%
1 Excludes self-employed workers, fi shermen, domestic workers, unpaid family workers and nonprofi t volunteers2 Includes employees of public school systems and the University of Alaska3 Excludes uniformed militaryBenchmark: March 2005
Source: Alaska Department of Labor & Workforce Development, Research and Analysis Section
20 ALASKA ECONOMIC TRENDS APRIL 2006
by Dan Robinson,EconomistBenchmark
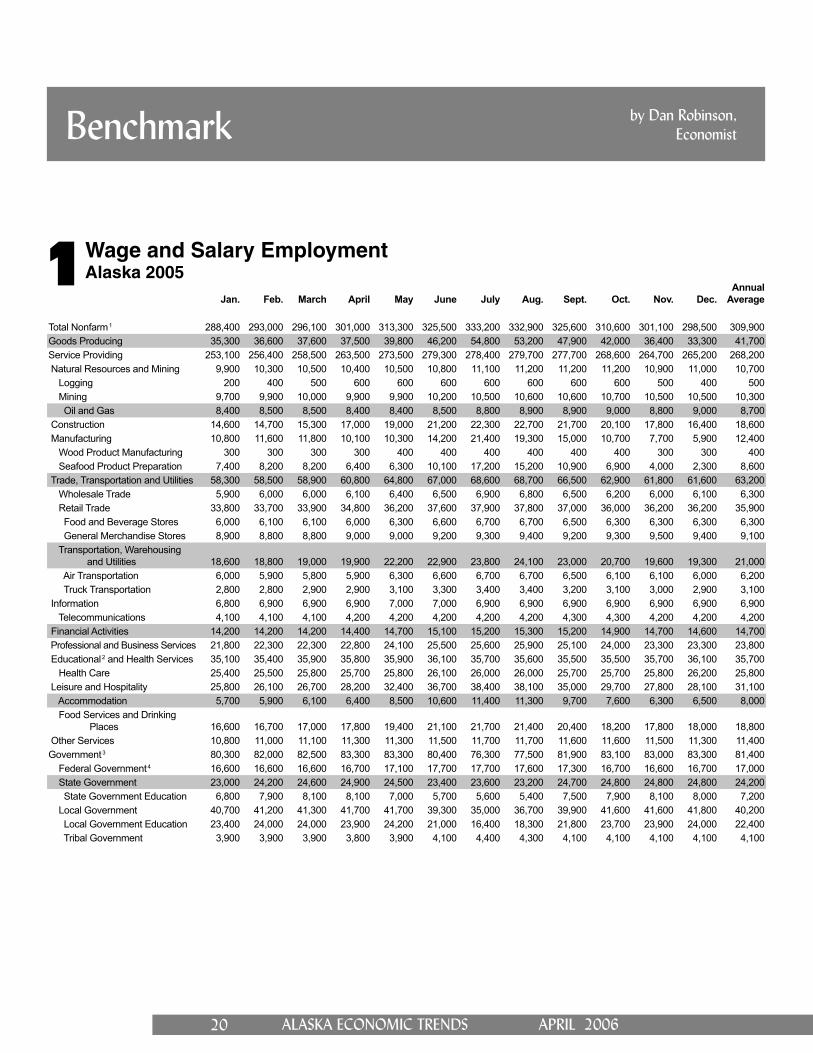
1Wage and Salary EmploymentAlaska 2005
Jan. Feb. March April May June July Aug. Sept. Oct. Nov. Dec.Annual
Average
Total Nonfarm 1 288,400 293,000 296,100 301,000 313,300 325,500 333,200 332,900 325,600 310,600 301,100 298,500 309,900Goods Producing 35,300 36,600 37,600 37,500 39,800 46,200 54,800 53,200 47,900 42,000 36,400 33,300 41,700Service Providing 253,100 256,400 258,500 263,500 273,500 279,300 278,400 279,700 277,700 268,600 264,700 265,200 268,200 Natural Resources and Mining 9,900 10,300 10,500 10,400 10,500 10,800 11,100 11,200 11,200 11,200 10,900 11,000 10,700 Logging 200 400 500 600 600 600 600 600 600 600 500 400 500 Mining 9,700 9,900 10,000 9,900 9,900 10,200 10,500 10,600 10,600 10,700 10,500 10,500 10,300 Oil and Gas 8,400 8,500 8,500 8,400 8,400 8,500 8,800 8,900 8,900 9,000 8,800 9,000 8,700 Construction 14,600 14,700 15,300 17,000 19,000 21,200 22,300 22,700 21,700 20,100 17,800 16,400 18,600 Manufacturing 10,800 11,600 11,800 10,100 10,300 14,200 21,400 19,300 15,000 10,700 7,700 5,900 12,400 Wood Product Manufacturing 300 300 300 300 400 400 400 400 400 400 300 300 400 Seafood Product Preparation 7,400 8,200 8,200 6,400 6,300 10,100 17,200 15,200 10,900 6,900 4,000 2,300 8,600 Trade, Transportation and Utilities 58,300 58,500 58,900 60,800 64,800 67,000 68,600 68,700 66,500 62,900 61,800 61,600 63,200 Wholesale Trade 5,900 6,000 6,000 6,100 6,400 6,500 6,900 6,800 6,500 6,200 6,000 6,100 6,300 Retail Trade 33,800 33,700 33,900 34,800 36,200 37,600 37,900 37,800 37,000 36,000 36,200 36,200 35,900 Food and Beverage Stores 6,000 6,100 6,100 6,000 6,300 6,600 6,700 6,700 6,500 6,300 6,300 6,300 6,300 General Merchandise Stores 8,900 8,800 8,800 9,000 9,000 9,200 9,300 9,400 9,200 9,300 9,500 9,400 9,100 Transportation, Warehousing and Utilities 18,600 18,800 19,000 19,900 22,200 22,900 23,800 24,100 23,000 20,700 19,600 19,300 21,000 Air Transportation 6,000 5,900 5,800 5,900 6,300 6,600 6,700 6,700 6,500 6,100 6,100 6,000 6,200 Truck Transportation 2,800 2,800 2,900 2,900 3,100 3,300 3,400 3,400 3,200 3,100 3,000 2,900 3,100 Information 6,800 6,900 6,900 6,900 7,000 7,000 6,900 6,900 6,900 6,900 6,900 6,900 6,900 Telecommunications 4,100 4,100 4,100 4,200 4,200 4,200 4,200 4,200 4,300 4,300 4,200 4,200 4,200 Financial Activities 14,200 14,200 14,200 14,400 14,700 15,100 15,200 15,300 15,200 14,900 14,700 14,600 14,700 Professional and Business Services 21,800 22,300 22,300 22,800 24,100 25,500 25,600 25,900 25,100 24,000 23,300 23,300 23,800 Educational 2 and Health Services 35,100 35,400 35,900 35,800 35,900 36,100 35,700 35,600 35,500 35,500 35,700 36,100 35,700 Health Care 25,400 25,500 25,800 25,700 25,800 26,100 26,000 26,000 25,700 25,700 25,800 26,200 25,800 Leisure and Hospitality 25,800 26,100 26,700 28,200 32,400 36,700 38,400 38,100 35,000 29,700 27,800 28,100 31,100 Accommodation 5,700 5,900 6,100 6,400 8,500 10,600 11,400 11,300 9,700 7,600 6,300 6,500 8,000 Food Services and Drinking Places 16,600 16,700 17,000 17,800 19,400 21,100 21,700 21,400 20,400 18,200 17,800 18,000 18,800 Other Services 10,800 11,000 11,100 11,300 11,300 11,500 11,700 11,700 11,600 11,600 11,500 11,300 11,400Government 3 80,300 82,000 82,500 83,300 83,300 80,400 76,300 77,500 81,900 83,100 83,000 83,300 81,400 Federal Government 4 16,600 16,600 16,600 16,700 17,100 17,700 17,700 17,600 17,300 16,700 16,600 16,700 17,000 State Government 23,000 24,200 24,600 24,900 24,500 23,400 23,600 23,200 24,700 24,800 24,800 24,800 24,200 State Government Education 6,800 7,900 8,100 8,100 7,000 5,700 5,600 5,400 7,500 7,900 8,100 8,000 7,200 Local Government 40,700 41,200 41,300 41,700 41,700 39,300 35,000 36,700 39,900 41,600 41,600 41,800 40,200 Local Government Education 23,400 24,000 24,000 23,900 24,200 21,000 16,400 18,300 21,800 23,700 23,900 24,000 22,400 Tribal Government 3,900 3,900 3,900 3,800 3,900 4,100 4,400 4,300 4,100 4,100 4,100 4,100 4,100

21ALASKA ECONOMIC TRENDS APRIL 2006
2 Jan. Feb. March April May June July Aug. Sept. Oct. Nov. Dec.
AnnualAverage
Total Nonfarm 1 283,300 286,700 291,100 295,300 306,300 318,800 327,000 325,900 320,500 305,700 295,900 294,300 304,200Goods Producing 33,700 35,000 35,600 35,600 38,300 44,800 53,200 50,800 46,000 40,600 35,200 32,300 40,100Service Providing 249,600 251,700 255,500 259,700 268,000 274,000 273,800 275,100 274,500 265,100 260,700 262,000 264,100 Natural Resources and Mining 9,400 9,700 9,900 10,200 10,300 10,400 10,500 10,600 10,300 10,100 10,000 10,100 10,100 Logging 200 300 400 500 600 600 600 500 500 500 500 400 500 Mining 9,200 9,400 9,500 9,700 9,700 9,800 9,900 10,100 9,800 9,600 9,500 9,600 9,600 Oil and Gas 7,900 8,100 8,100 8,300 8,300 8,300 8,400 8,500 8,300 8,200 8,100 8,200 8,200 Construction 13,700 13,800 14,100 15,300 17,700 20,100 21,400 21,700 21,000 19,600 17,500 16,200 17,700 Manufacturing 10,600 11,500 11,600 10,100 10,300 14,300 21,300 18,500 14,700 10,900 7,700 6,000 12,300 Wood Product Manufacturing 300 300 300 300 400 400 400 400 400 400 300 300 300 Seafood Product Preparation 7,200 8,100 8,100 6,500 6,500 10,400 17,200 14,400 10,700 7,100 4,100 2,400 8,500 Trade, Transportation and Utilities 57,000 57,000 58,000 59,600 63,600 65,800 67,500 67,400 65,700 62,000 60,700 60,700 62,000 Wholesale Trade 5,900 6,000 6,100 6,100 6,200 6,400 6,600 6,600 6,400 6,200 6,000 6,100 6,200 Retail Trade 32,400 32,200 32,800 33,700 35,400 36,900 37,300 37,200 36,300 35,300 35,400 35,500 35,000 Food and Beverage Stores 5,700 5,700 5,700 5,800 6,000 6,400 6,500 6,500 6,300 6,200 6,200 6,200 6,100 General Merchandise Stores 8,500 8,400 8,900 8,900 9,100 9,500 9,500 9,600 9,400 9,300 9,400 9,400 9,200 Transportation, Warehousing and Utilities 18,700 18,800 19,100 19,800 22,000 22,500 23,600 23,600 23,000 20,500 19,300 19,100 20,800 Air Transportation 6,200 6,100 6,200 6,200 6,600 7,000 7,000 6,900 6,700 6,300 6,100 6,000 6,400 Truck Transportation 2,800 2,800 2,800 2,800 3,100 3,200 3,300 3,300 3,200 3,000 2,900 2,900 3,000 Information 6,800 6,800 6,800 6,800 6,900 6,900 6,900 6,900 6,900 6,900 6,900 7,000 6,900 Telecommunications 4,100 4,000 4,000 4,100 4,100 4,200 4,200 4,200 4,200 4,200 4,200 4,200 4,100 Financial Activities 13,900 14,000 14,100 14,500 14,600 15,000 15,000 15,200 14,900 14,700 14,600 14,700 14,600 Professional and Business Services 21,700 21,800 22,300 22,600 23,200 24,400 24,800 25,000 24,600 23,400 22,800 22,900 23,300 Educational 2 and Health Services 33,800 34,200 34,500 34,800 35,000 34,900 34,600 34,400 34,700 34,900 35,100 35,500 34,700 Health Care 24,000 24,200 24,500 24,700 24,900 25,200 25,000 24,900 25,100 25,200 25,300 25,600 24,900 Leisure and Hospitality 24,900 25,300 25,900 27,100 30,500 34,900 37,100 37,500 34,800 29,300 27,100 27,400 30,100 Accommodation 5,700 5,800 6,000 6,500 8,400 10,500 11,400 11,300 10,000 7,600 6,100 6,300 8,000 Food Services and Drinking Places 15,900 16,100 16,400 16,900 18,200 20,000 21,000 21,400 20,400 18,000 17,600 17,600 18,300 Other Services 10,600 10,800 10,900 11,200 11,500 11,700 11,200 11,400 11,300 11,300 11,200 11,100 11,200Government 3 80,900 81,800 83,000 83,100 82,700 80,400 76,700 77,300 81,600 82,600 82,300 82,700 81,300 Federal Government 4 16,500 16,500 16,700 17,000 17,300 18,000 18,100 17,900 17,500 17,000 16,700 16,900 17,200 State Government 23,900 24,200 24,700 24,700 23,900 23,000 23,500 23,000 24,600 24,400 24,400 24,400 24,100 State Government Education 7,500 7,800 8,200 8,000 6,800 5,600 5,400 5,300 7,300 7,800 7,900 8,000 7,100 Local Government 40,500 41,100 41,600 41,400 41,500 39,400 35,100 36,400 39,500 41,200 41,200 41,400 40,000 Local Government Education 23,200 23,800 24,100 23,900 23,800 20,700 16,100 17,600 21,000 23,100 23,500 23,600 22,000 Tribal Government 3,700 3,700 3,800 3,800 3,900 4,200 4,600 4,600 4,400 4,200 4,100 4,100 4,100
Wage and Salary EmploymentAlaska 2004
Footnotes for Exhibits 1 and 2: 1 Excludes self-employed workers, fi shermen, domestic workers, unpaid family workers and nonprofi t volunteers2 Private education only3 Includes employees of public school systems and the University of Alaska4 Excludes uniformed militaryBenchmark: March 2005
Source for Exhibits 1 and 2: Alaska Department of Labor & Workforce Development, Research and Analysis Section, in cooperation with the U.S. Bureau of Labor Statistics
The Alaska Department of Labor & Workforce Development revises the nonfarm wage and salary employment estimates each January in a procedure called benchmarking. Exhibits 1 and 2 show state-wide revised estimates for 2004 and 2005. Revised regional estimates are available on our Web site: almis.labor.state.ak.us.

22 ALASKA ECONOMIC TRENDS APRIL 2006
otal nonfarm employment rose by 5,200 in February to 298,200. (See Exhibit 1.) In a typical year the state’s job count begins to climb in Febru-
ary and steadily increases until it reaches a peak in July or August. Much of the increase came from the University of Alaska campuses where employment returned to normal levels after the winter break. A seasonal increase in crab and groundfi sh activity produced 900 additional seafood processing jobs, and a variety of other industries recorded smaller monthly gains.
February’s job count was 5,200 higher than in February 2005, an over-the-year growth rate of 1.8 percent. Nearly every industry added jobs over the period, with some of the largest in-creases coming from the oil and gas and mineral mining industries, retail trade, heath care, food services and drinking places, and state and local government.
The few declines were in seafood processing, air transportation, information and federal govern-ment employment. The lower seafood process-ing numbers are due to a signifi cantly reduced crab fi shing fl eet in the fi rst year of the new individual quota system. Presumably, the crab catch will be spread over a longer period, requir-ing fewer processing jobs in February, but more in later months.
Natural resources and mining strong in Alaska, even stronger nationwide
High prices for both oil and precious metals have led to substantial job growth in Alaska’s
natural resources and mining sector over the last year. From January 2005 to January 2006,1 employment in this sector grew by a robust 8.1 percent. Nationwide, the growth was an even more impressive 10.2 percent and four states recorded growth in excess of 15 percent. (See Exhibit 2.)
The four states with the highest growth rates – North Dakota, Utah, Colorado and Wyoming – added a combined total of 7,700 jobs over the period. Nearly all the gains have come from oil and gas support companies. The Rocky Mountain West is home to vast natural gas reserves and high prices and a growing demand have led to substantial increases in exploration and development.
As negotiations continue for bringing Alaska’s own store of natural gas reserves to market, several years of high oil prices have stimulated job creation at both the major oil companies and the growing number of smaller indepen-dents.
Additionally, the Pogo mine near Delta Junction began operations in late 2005, adding several hundred mining jobs to the state’s economy. The Kensington mine north of Juneau is also moving closer to production, although the timing is uncertain due to fi nal environmental reviews.
1 The most recent month for which data were available from other states
T
Employment Scene By Dan RobinsonEconomist
Job count begins seasonal rebound

23ALASKA ECONOMIC TRENDS APRIL 2006
19.418.4
15.615.2
14.313.313.2
12.511.6
10.28.18.0
7.45.5
North DakotaUtah
ColoradoWyomingVermontNevada
New MexicoNew Jersey
ArizonaU.S.
AlaskaTexas
West VirginiaAlabama
Percent change from January 2005 to January 2006
1 Nonfarm Wage and SalaryEmployment
preliminary revised revised Changes from:
Alaska 02/06 01/06 02/05 01/06 02/05
Total Nonfarm Wage and Salary 1 298,200 293,000 293,000 5,200 5,200Goods Producing 37,700 36,200 36,600 1,500 1,100Service-Providing 260,500 256,800 256,400 3,700 4,100Natural Resources and Mining 11,000 10,700 10,300 300 700 Logging 300 200 400 100 -100 Mining 10,800 10,600 9,900 200 900 Oil and Gas Extraction 9,000 8,900 8,500 100 500Construction 15,200 14,900 14,700 300 500Manufacturing 11,500 10,600 11,600 900 -100 Wood Product Manufacturing 300 300 300 0 0 Seafood Processing 7,900 7,000 8,200 900 -300Trade, Transportation, Utilities 59,400 59,500 58,500 -100 900 Wholesale Trade 6,000 6,000 6,000 0 0 Retail Trade 34,500 34,600 33,700 -100 800 Food and Beverage Stores 6,100 6,100 6,100 0 0 General Merchandise Stores 9,200 9,200 8,800 0 400 Transport., Warehousing, Utilities 18,900 18,900 18,800 0 100 Air Transportation 5,800 6,000 5,900 -200 -100 Truck Transportation 2,900 2,900 2,800 0 100Information 6,800 6,800 6,900 0 -100 Telecommunications 4,100 4,100 4,100 0 0Financial Activities 14,400 14,500 14,200 -100 200Professional and Business Svcs. 22,800 22,500 22,300 300 500Educational 2 and Health Svcs. 36,100 35,800 35,400 300 700 Health Care 26,100 25,900 25,500 200 600Leisure and Hospitality 26,900 26,700 26,100 200 800 Accommodation 5,900 6,000 5,900 -100 0 Food Services and Drinking Places 17,300 16,900 16,700 400 600Other Services 11,200 11,100 11,000 100 200Government 3 82,900 79,900 82,000 3,000 900 Federal Government 4 16,400 16,300 16,600 100 -200 State Government 24,900 22,500 24,200 2,400 700 State Government Education 8,000 5,800 7,900 2,200 100 Local Government 41,600 41,100 41,200 500 400 Local Government Education 24,400 23,700 24,000 700 400 Tribal Government 4,000 4,000 3,900 0 100
Notes for Exhibits 1 and 3:1 Excludes self-employed workers, fi shermen, domestic workers, upaid family workers and nonprofi t volunteers2 Private education only3 Includes employees of public school systems and the University of Alaska4 Excludes uniformed military5 Metropolitan Statistical AreaBenchmark: March 2005
Source: Alaska Department of Labor & Workforce Development, Research and Analysis Section
2 Natural Resources and Mining Employment - Selected States
3 Nonfarm Wage and Salary EmploymentBy Region
preliminary revised revised Changes from: Percent Change: 02/06 01/06 02/05 01/06 02/05 01/06 02/05
Anch/Mat-Su (MSA) 5 161,800 159,700 158,200 2,100 3,600 1.3% 2.3% Anchorage 144,400 142,500 141,500 1,900 2,900 1.3% 2.0%Gulf Coast 25,850 25,100 25,750 750 100 3.0% 0.4%Interior 41,900 40,800 41,400 1,100 500 2.7% 1.2% Fairbanks 36,300 35,400 35,900 900 400 2.5% 1.1%Northern 16,150 15,950 15,450 200 700 1.3% 4.5%Southeast 32,550 31,850 32,250 700 300 2.2% 0.9%Southwest 19,950 19,000 20,250 950 -300 5.0% -1.5%
For more current state and regional employment and unemployment data, visit our Web site.
almis.labor.state.ak.us
Source: U.S. Department of Labor, Bureau of Labor Statistics

24 ALASKA ECONOMIC TRENDS APRIL 2006
Making It in the Big City By Susan Erben, Trends EditorLarry Yerich, Employment Security Analyst
“I always wanted to be a welder…”
ichard L. Johnson Jr. – his friends just call him Lee – has lived most of his life in Nelson Lagoon on the Aleutian Chain, population 70. He’s fi shed
most of his life – 30-some years fi shing salmon, mostly sockeye, including 22 seasons in a row as a crewmember on crab and cod boats. He bought his own commercial boat for salmon fi shing, the 32-foot “Cynthia Jane.” Some years he’d fi sh year-round.
Johnson, 41, said fi shing was his life – until he fi gured out there was no future in it for him after salmon prices bottomed out about fi ve years ago and deckhands were making about a quarter of what they used to make.
“About three years ago, I fi gured out I just couldn’t make it. It was an eye-opener. I met my wife in King Cove,” about the same time, Johnson said, and together, they decided to try Anchorage.
“I always wanted to be a welder,” he said. “I grew up helping my uncles build stuff.”
Johnson said he went to the Aleutian Pribilof Islands Association, a nonprofi t corporation and federally recognized tribal organization, to see what they could do about helping him get into welding school, then approached the Gambell Job Center in Anchorage and the Aleutian Pribilof Island Community Development Association.
“I had never done anything like that before – fundraising. It was a challenge. It was tough,” he said. There was a ton of paperwork.
RBut he did it. The job center and the two organi-zations together paid for his tuition at a welding school in Anchorage, the Testing Institute of Alaska Inc. – about $15,000 altogether.
He started his welding classes in April 2005, went to school for a month, took the summer off to fi sh, and then continued his classes from Septem-ber to the fi rst of December.
Johnson earned six welding certifi cations, learned the intricacies of welding and how to read blueprints. He landed a job Jan. 24, working with fi ve other welders at the Automatic Welding Company in Anchorage and making $17 an hour plus overtime, nine hours a day, fi ve days a week. Pretty soon they’ll go to six-day weeks. He said lately they’ve been building conveyors for the Pogo mine and a rock-screening machine for another company.
“I learn something new everyday.”
He said getting the money for welding school absolutely changed his life. “It’s taken a lot of getting used to, living in the city, the food.” He said he misses the peace and quiet of Nelson Lagoon, the beachcombing and the hunting, but he and his wife probably miss their families out on the Aleutian Chain the most.
“But I love every day,” Johnson said, about his new life.
“Every morning, when I go out and walk to my car, I sniff the air. I tell myself, ‘I’m living

25ALASKA ECONOMIC TRENDS APRIL 2006
Phot
o by
Pam
Ree
se
in Anchorage and I’ve got a job.’ A lot of my friends [from Nelson Lagoon] dream of living here and making it, of getting a good job.
“I get a chance to be with my family everyday, instead of being gone for a month at a time when I was fi shing,” Johnson said. He and his wife Fredrica have two little girls, a 1-year-old and a 3-year-old. “It’s a nice, stable life. I’m going to be able to give my kids more than I ever had.”
Kari Colver, a community development special-ist at the Gambell Job Center, was Johnson’s case manager. She said the money for the job center’s share of Johnson’s tuition came from a National Emergency Grant, which is federal money that’s channeled through the Alaska Department of Labor & Workforce Develop-ment for people in the salmon industry when there’s been a downturn in the economy.
Asked if Johnson’s case is typical, Colver said no. “Every client is individual. Every client has differ-ent issues. We have a lot of different programs,” she said, to help people get training, and the National Emergency Grant is just one of them.
Colver said she and her colleagues at the Alaska Job Centers throughout the state do a lot of vocational counseling to make sure the route that a client chooses is one that fi ts him or her best. She said the job centers also do or help arrange all types of training, whether it’s on-the-job, or to get new skills or upgrade current skills. It’s help-ful, she said, when the job centers can “co-fund” a client’s training with another group or agency, because that helps the money go further to help more people.
“There are varying levels of service available at the job centers,” Colver said. “When customers make use of job center services on their own, we consider that ‘core’ or self service. Core services consist of providing basic information primarily intended to assist individuals in conducting job searches or accessing training or other services on their own.”
Phot
o by
Fre
dric
a Jo
hnso
n
Richard Johnson (above left) in the photo that the Testing Institute of Alaska Inc. took for his certifi cation paperwork. A welder at the Automatic Welding Company in Anchorage since January, Johnson (above right) welds in March.

26 ALASKA ECONOMIC TRENDS APRIL 2006
according to a quarterly report released recently by the U.S. Department of Labor, as well as the Alaska Department of Labor & Workforce Development. Although the job centers provided intensive services to 5 percent more people in 2005 than in 2004, 30 percent more people in 2005 got jobs after intensive services than in 2004. That year the job centers gave intensive services to 63,260 people and 31,221 of them found work.
Johnson said that when he was going to school full time, his wife was working, but sometimes the money still got tight. One month the job center even helped him pay their rent.
“That was a godsend,” he said.
He said Colver and the job center helped him with more than just the money for school.
“Kari taught me a lot. I had never owned or ran a computer,” he said, other than the radar, plotter and depth-sounding equipment he used for fi shing.
“She taught me that [computers], how to get a job, where to go, what to say,” he said.
Johnson said Colver, plus Jan Carolyn Hardy at APIA and Laura Gilman at APICDA, really made it all happen.
“They gave me the direction to the future. I owe it all to them,” he said.
“Sure, I put in all the effort [going to welding school]. But thank you to those three ladies. I’ve got a good job and a good future now, thanks to them.”
Colver said where there is greater staff involve-ment than is typical for core services, it’s considered “intensive” services. “The focus is still on providing participants with guidance or information they need to make informed choices about their careers,” she said.
The staff at the 24 Alaska Job Centers throughout the state provided intensive services to 66,725 people in 2005, and of those, 40,485 got jobs,
Richard Rounds, a welding instructor at the Testing In-stitute of Alaska Inc., performs a gas tungsten arc weld at the school in March. Richard Johnson, the subject of the article, earned six welding certifi cations at the Anchorage school and completed his coursework in December 2005. The school usually has about 10 students.
Phot
o by
Ste
ven
Loc
kman

27ALASKA ECONOMIC TRENDS APRIL 2006
Employer Resources
Hiring minors?Are you an employer planning to hire minors for the summer season? The Alaska Department of Labor & Workforce Development’s Wage and Hour Administration, which is within the Labor Standards and Safety Division, is the place to go to get work permits to fi ll out and to learn more about state and federal child labor requirements.
Work permits are required for minors ages 14, 15 and 16; 17-year-olds must have a work permit to work where alcohol is served. Some employers require a work permit for everyone under 18.
Start by going to the State of Alaska Web site: www.state.ak.us. Click on “Departments” in the gold ribbon at the top, then “Labor & Workforce Devel-opment,” and then “Labor Standards and Safety.” You’ll see a section describing the Wage and Hour Administration. Click on “Forms and Publications” on the right, then “Work Permit” on the left.
The work permit lists a summary of the child labor requirements. For a more extensive summary, go to the Labor Standards and Safety Division Web site and click on “Child Labor” on the right. Here you’ll fi nd the “Summary of Alaska Child Labor Law.”
For a section geared toward minors, go to the La-bor Standards and Safety Web site, click on “FAQs” on the right and then “Child Labor – Your Rights.” You’ll fi nd “Know Your Rights – Ages 14 through 17,” an overview of the standards for hours, duties and breaks for workers under 18.
For questions, call or visit the nearest Wage and Hour offi ce. In Anchorage, call (907) 269-4900; in Fairbanks, call (907) 451-2886; and in Juneau, call (907) 465-4842. See the Web site or call for physi-cal offi ce locations.
Trends Authors
Dan Robinson is an Alaska Department of Labor & Workforce Development economist in Ju-neau. He specializes in statewide employment, earnings and the cost of living. To reach him, call (907) 465-6036 or email him at [email protected].
Neal Fried, a Department of Labor economist in Anchorage, special-izes in the Anchorage/Mat-Su region’s employment, earnings and the cost of living. To reach him, call (907) 269-4861 or email him at [email protected].
Neal Gilbertsen is a Department of Labor economist in Juneau who specializes in Southeast’s economy and fi sheries. To contact him, call (907) 465-6037 or email him at [email protected].
Brigitta Windisch-Cole, a Depart-ment of Labor economist in Anchorage, specializes in the employment and earnings of the Interior, Gulf Coast, Northern and Southwest economic regions. To reach her, call (907) 269-4863 or email her at [email protected].
Susan Erben, a Department of Labor publications specialist in Juneau, is editor of Alaska Eco-nomic Trends. To contact her, call (907) 465-6561 or email her at [email protected].
Larry Yerich is a Department of Labor employment security analyst in Juneau. He specializes in public relations and marketing for the Division of Employment Security. To reach him, call (907) 465-4863 or email him at [email protected].