Embed Size (px)
Citation preview
TRENDSALASKA ECONOMIC
TRENDSALASKA ECONOMICJULY
2021Volume 41 Number 7
ISSN 0160-3345
SARA WHITNEY Editor
Chief, Researchand Analysis
Governor Mike Dunleavy Commissioner
Dr. Tamika L. Ledbetter
DEPARTMENT of LABOR and WORKFORCE DEVELOPMENT
ALASKA
DAN ROBINSON
Design by Sara Whitney
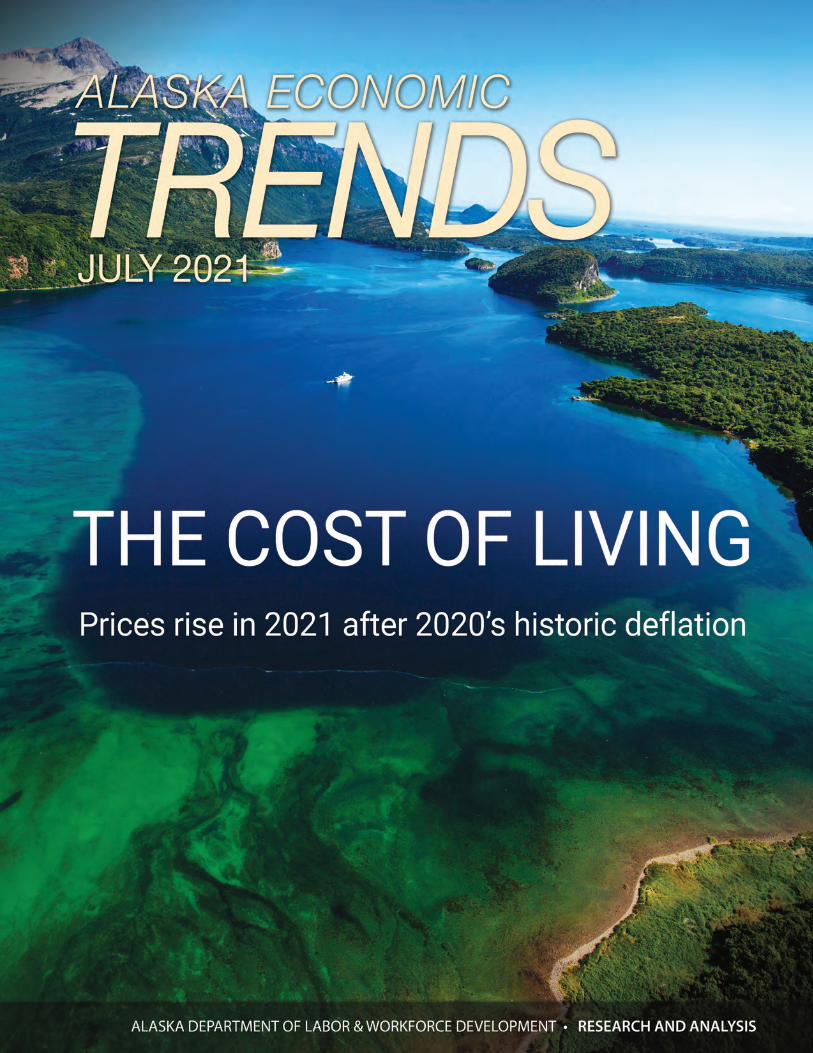
ON THE COVER:
Katmai National Park, photo courtesy of Flickr user
Adam Gulkis. License: creativecommons.org/licenses/by-nc-sa/2.0/
Trends is a nonpartisan, data-driven magazine that covers a range of economic topics in Alaska.
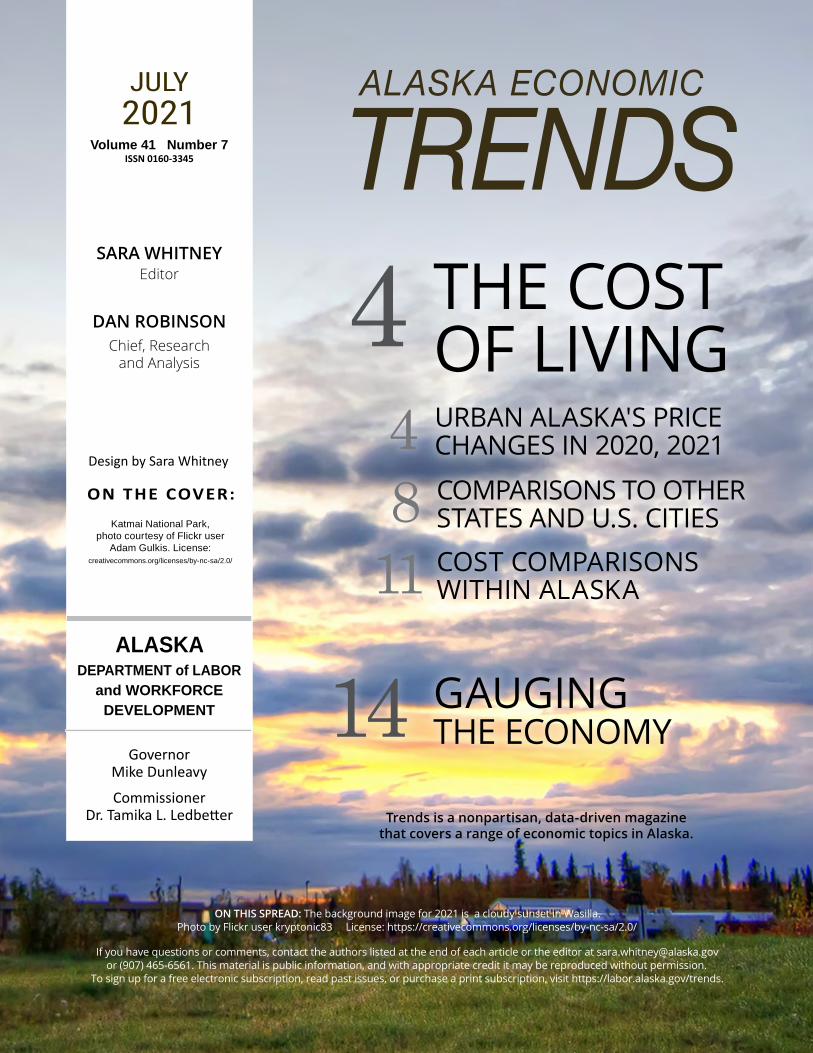
ON THIS SPREAD: The background image for 2021 is a cloudy sunset in Wasilla. Photo by Flickr user kryptonic83 License: https://creativecommons.org/licenses/by-nc-sa/2.0/
If you have questions or comments, contact the authors listed at the end of each article or the editor at [email protected] or (907) 465-6561. This material is public information, and with appropriate credit it may be reproduced without permission.
To sign up for a free electronic subscription, read past issues, or purchase a print subscription, visit https://labor.alaska.gov/trends.
4
14
THE COSTOF LIVING
GAUGING THE ECONOMY
4 URBAN ALASKA'S PRICECHANGES IN 2020, 2021
8 COMPARISONS TO OTHERSTATES AND U.S. CITIES
11 COST COMPARISONS WITHIN ALASKA
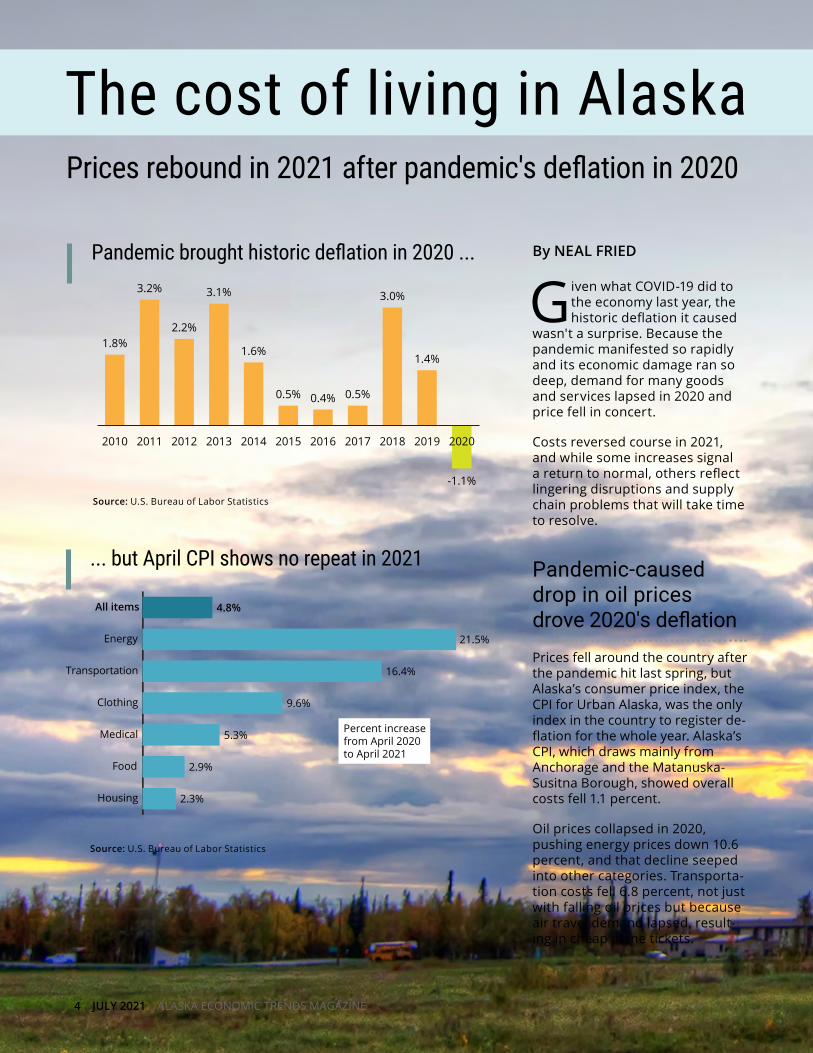
Pandemic brought historic deflation in 2020 ...
Source: U.S. Bureau of Labor Statistics
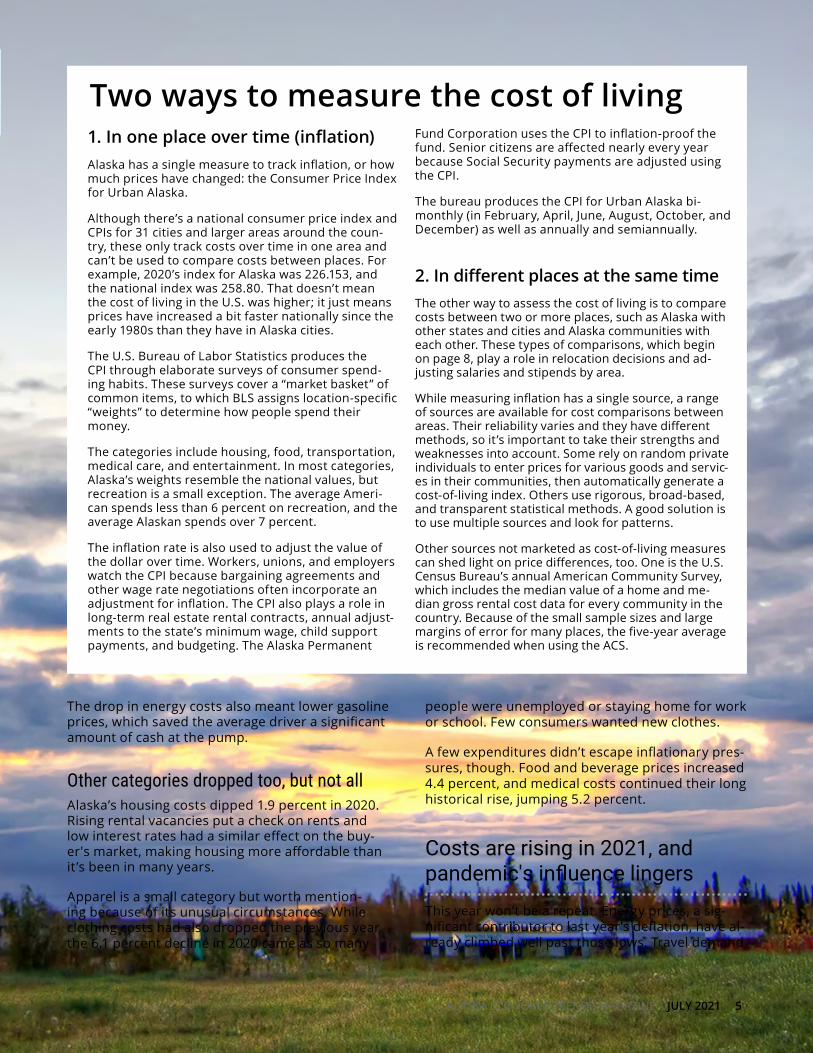
... but April CPI shows no repeat in 2021
Source: U.S. Bureau of Labor Statistics
4.8%All items
21.5%Energy
16.4%Transportation
9.6%Clothing
5.3%Medical
2.9%Food
2.3%Housing
Percent increasefrom April 2020to April 2021
By NEAL FRIED
Given what COVID-19 did to the economy last year, the historic deflation it caused
wasn't a surprise. Because the pandemic manifested so rapidly and its economic damage ran so deep, demand for many goods and services lapsed in 2020 and price fell in concert.
Costs reversed course in 2021, and while some increases signal a return to normal, others reflect lingering disruptions and supply chain problems that will take time to resolve.
Pandemic-caused drop in oil prices drove 2020's deflationPrices fell around the country after the pandemic hit last spring, but Alaska’s consumer price index, the CPI for Urban Alaska, was the only index in the country to register de-flation for the whole year. Alaska’s CPI, which draws mainly from Anchorage and the Matanuska-Susitna Borough, showed overall costs fell 1.1 percent.
Oil prices collapsed in 2020, pushing energy prices down 10.6 percent, and that decline seeped into other categories. Transporta-tion costs fell 6.8 percent, not just with falling oil prices but because air travel demand lapsed, result-ing in cheap plane tickets.
4 JULY 2021 ALASKA ECONOMIC TRENDS MAGAZINE
The cost of living in AlaskaPrices rebound in 2021 after pandemic's deflation in 2020
1.8%
3.2%
2.2%
3.1%
1.6%
0.5% 0.4% 0.5%
3.0%
1.4%
-1.1%
2010 2011 2012 2013 2014 2015 2016 2017 2018 2019 2020
1. In one place over time (inflation)Alaska has a single measure to track inflation, or how much prices have changed: the Consumer Price Index for Urban Alaska.
Although there’s a national consumer price index and CPIs for 31 cities and larger areas around the coun-try, these only track costs over time in one area and can’t be used to compare costs between places. For example, 2020’s index for Alaska was 226.153, and the national index was 258.80. That doesn’t mean the cost of living in the U.S. was higher; it just means prices have increased a bit faster nationally since the early 1980s than they have in Alaska cities.
The U.S. Bureau of Labor Statistics produces the CPI through elaborate surveys of consumer spend-ing habits. These surveys cover a “market basket” of common items, to which BLS assigns location-specific “weights” to determine how people spend their money.
The categories include housing, food, transportation, medical care, and entertainment. In most categories, Alaska’s weights resemble the national values, but recreation is a small exception. The average Ameri-can spends less than 6 percent on recreation, and the average Alaskan spends over 7 percent.
The inflation rate is also used to adjust the value of the dollar over time. Workers, unions, and employers watch the CPI because bargaining agreements and other wage rate negotiations often incorporate an adjustment for inflation. The CPI also plays a role in long-term real estate rental contracts, annual adjust-ments to the state’s minimum wage, child support payments, and budgeting. The Alaska Permanent
Fund Corporation uses the CPI to inflation-proof the fund. Senior citizens are affected nearly every year because Social Security payments are adjusted using the CPI.
The bureau produces the CPI for Urban Alaska bi-monthly (in February, April, June, August, October, and December) as well as annually and semiannually. 2. In different places at the same timeThe other way to assess the cost of living is to compare costs between two or more places, such as Alaska with other states and cities and Alaska communities with each other. These types of comparisons, which begin on page 8, play a role in relocation decisions and ad-justing salaries and stipends by area.
While measuring inflation has a single source, a range of sources are available for cost comparisons between areas. Their reliability varies and they have different methods, so it’s important to take their strengths and weaknesses into account. Some rely on random private individuals to enter prices for various goods and servic-es in their communities, then automatically generate a cost-of-living index. Others use rigorous, broad-based, and transparent statistical methods. A good solution is to use multiple sources and look for patterns.
Other sources not marketed as cost-of-living measures can shed light on price differences, too. One is the U.S. Census Bureau’s annual American Community Survey, which includes the median value of a home and me-dian gross rental cost data for every community in the country. Because of the small sample sizes and large margins of error for many places, the five-year average is recommended when using the ACS.
Two ways to measure the cost of living
The drop in energy costs also meant lower gasoline prices, which saved the average driver a significant amount of cash at the pump.
Other categories dropped too, but not allAlaska’s housing costs dipped 1.9 percent in 2020. Rising rental vacancies put a check on rents and low interest rates had a similar effect on the buy-er's market, making housing more affordable than it ’s been in many years.
Apparel is a small category but worth mention-ing because of its unusual circumstances. While clothing costs had also dropped the previous year, the 6.1 percent decline in 2020 came as so many
people were unemployed or staying home for work or school. Few consumers wanted new clothes.
A few expenditures didn’t escape inflationary pres-sures, though. Food and beverage prices increased 4.4 percent, and medical costs continued their long historical rise, jumping 5.2 percent.
Costs are rising in 2021, and pandemic's influence lingersThis year won’t be a repeat. Energy prices, a sig-nificant contributor to last year’s deflation, have al-ready climbed well past those lows. Travel demand
ALASKA ECONOMIC TRENDS MAGAZINE JULY 2021 5
has grown and will accelerate as 2021 progresses, which will boost transportation prices further. And as the national and local economies rebound, prices will rise with the increasing demand for a wider variety of goods and services.
The two bimonthly consumer price indexes released so far, February and April, pro-vided a window into 2021. February's index showed 1.3 percent inflation from the previ-ous February, and April’s inflation was a whopping 4.8 percent — the biggest annual jump since 1991. (A close second was 2008, at 4.6 percent.)
National economic observers disagree on where inflation will end up for 2021 over-all. Some economists predict inflationary forces will slow as the supply chain problems caused by the pandemic resolve. Others pre-dict a prolonged period of higher inflation.
April's index shows used car prices shot up 23% as demand eclipsed a sparse supply.
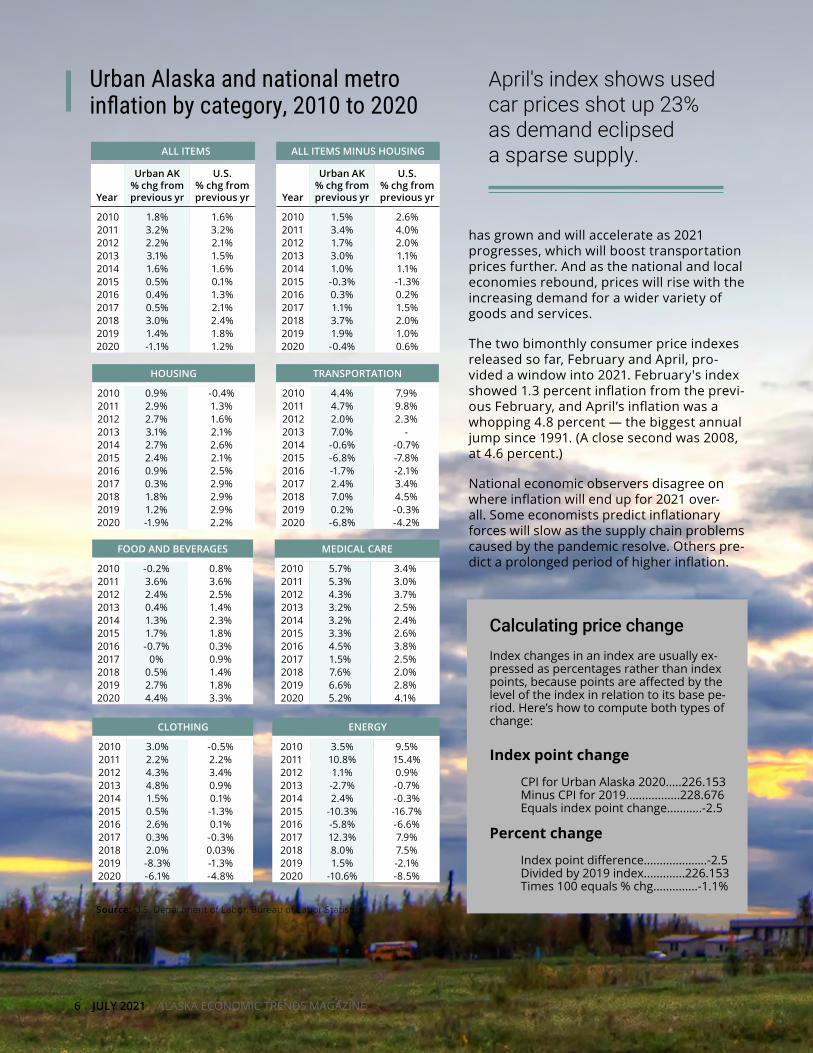
Urban Alaska and national metro inflation by category, 2010 to 2020
Source: U.S. Department of Labor, Bureau of Labor Statistics
ALL ITEMS ALL ITEMS MINUS HOUSING
Year
Urban AK % chg fromprevious yr
U.S. % chg fromprevious yr Year
Urban AK % chg fromprevious yr
U.S. % chg fromprevious yr
2010 1.8% 1.6% 2010 1.5% 2.6%2011 3.2% 3.2% 2011 3.4% 4.0%2012 2.2% 2.1% 2012 1.7% 2.0%2013 3.1% 1.5% 2013 3.0% 1.1%2014 1.6% 1.6% 2014 1.0% 1.1%2015 0.5% 0.1% 2015 -0.3% -1.3%2016 0.4% 1.3% 2016 0.3% 0.2%2017 0.5% 2.1% 2017 1.1% 1.5%2018 3.0% 2.4% 2018 3.7% 2.0%2019 1.4% 1.8% 2019 1.9% 1.0%2020 -1.1% 1.2% 2020 -0.4% 0.6%
HOUSING TRANSPORTATION
2010 0.9% -0.4% 2010 4.4% 7.9%2011 2.9% 1.3% 2011 4.7% 9.8%2012 2.7% 1.6% 2012 2.0% 2.3%2013 3.1% 2.1% 2013 7.0% -2014 2.7% 2.6% 2014 -0.6% -0.7%2015 2.4% 2.1% 2015 -6.8% -7.8%2016 0.9% 2.5% 2016 -1.7% -2.1%2017 0.3% 2.9% 2017 2.4% 3.4%2018 1.8% 2.9% 2018 7.0% 4.5%2019 1.2% 2.9% 2019 0.2% -0.3%2020 -1.9% 2.2% 2020 -6.8% -4.2%
FOOD AND BEVERAGES MEDICAL CARE
2010 -0.2% 0.8% 2010 5.7% 3.4%2011 3.6% 3.6% 2011 5.3% 3.0%2012 2.4% 2.5% 2012 4.3% 3.7%2013 0.4% 1.4% 2013 3.2% 2.5%2014 1.3% 2.3% 2014 3.2% 2.4%2015 1.7% 1.8% 2015 3.3% 2.6%2016 -0.7% 0.3% 2016 4.5% 3.8%2017 0% 0.9% 2017 1.5% 2.5%2018 0.5% 1.4% 2018 7.6% 2.0%2019 2.7% 1.8% 2019 6.6% 2.8%2020 4.4% 3.3% 2020 5.2% 4.1%
CLOTHING ENERGY
2010 3.0% -0.5% 2010 3.5% 9.5%2011 2.2% 2.2% 2011 10.8% 15.4%2012 4.3% 3.4% 2012 1.1% 0.9%2013 4.8% 0.9% 2013 -2.7% -0.7%2014 1.5% 0.1% 2014 2.4% -0.3%2015 0.5% -1.3% 2015 -10.3% -16.7%2016 2.6% 0.1% 2016 -5.8% -6.6%2017 0.3% -0.3% 2017 12.3% 7.9%2018 2.0% 0.03% 2018 8.0% 7.5%2019 -8.3% -1.3% 2019 1.5% -2.1%2020 -6.1% -4.8% 2020 -10.6% -8.5%
6 JULY 2021 ALASKA ECONOMIC TRENDS MAGAZINE
Calculating price changeIndex changes in an index are usually ex-pressed as percentages rather than index points, because points are affected by the level of the index in relation to its base pe-riod. Here’s how to compute both types of change:
Index point change CPI for Urban Alaska 2020.....226.153 Minus CPI for 2019.................228.676 Equals index point change...........-2.5 Percent change Index point difference.............…….-2.5 Divided by 2019 index.............226.153 Times 100 equals % chg..............-1.1%

Car prices, shortages in early 2021Energy prices have been the biggest driver of 2021’s cost increases so far, bumping up already rising transportation costs. The uptick in travel as more people got vaccinated and economies re-opened prompted costlier plane tickets and higher rental car rates.
Cars are the most extreme example of pandemic-linked price increases so far this year, however, and used cars in particular. Vehicle prices jumped 13.3 percent overall from April 2020 to April 2021, and prices for used cars alone skyrocketed 22.7 per-cent.
Supply chain disruptions for new cars, the upside-down car rental market, stimulus checks, and low interest rates continue to drive demand for used cars. Fewer new cars hit the market last year, and especially the more affordable models, which made people less likely to trade in their cars or
COVID-19 complicated an already imprecise measure
end their leases on new cars. This made used cars harder to come by.
Car rental companies, which thinned their fleets last year because they had so little business, found themselves short-handed this year as demand grew for their services. As a result, rental companies are hanging on to the cars they have rather than regu-larly moving inventory into the used car market, as they usually do, exacerbating the shortage.
Other categories' costs are also on the riseHousing costs rose modestly this spring, but it was still a reversal of 2020’s declines. And although clothing has only a minor influence on the overall index, its near-double-digit rise was a surprise. Workplaces and schools opening have, for now, increased demand for new clothes again.
Neal Fried is an economist in Anchorage. Reach him at (907) 269-4861 or [email protected].
All cost-of-living measures have their shortcomings. Even the most comprehensive index or survey can’t account for everything when approximating how most households spend their income.
No two people or households spend money exactly alike, and habits also vary geographically. Expenditures by the average household in Dillingham differ from those in Fairbanks and even more from families in Los Angeles. Spending habits also change constantly with advancing technology and fluctuating tastes and prices.
Last year, on top of all that, we had COVID-19.
People altered their buying habits dramatically last spring. When the pandemic hit, they spent less at restaurants and bars and more at grocery stores. Those who weren’t commuting to work or school anymore drove less. Americans bought more household goods, gardening supplies, and internet bandwidth, but less
professional clothing and virtually no concert and sport-ing event tickets.
Because these changes in habits happened quickly and were assumed temporary, many cost-of-living indexes didn’t adjust for them.
Despite these difficulties and weaknesses, most cost-of-living measures mimic the average consumer as much as possible. This involves tracking a sample of typical goods and services, called a market basket, which includes essentials and the things we know most people purchase. (See the sidebar on page 6 for more.)
Some of these indexes go to great lengths to create their market baskets while others keep them simple, so when evaluating a source, it helps to know what’s in the market basket and which consumers’ buying habits it's trying to imitate. In general, it works best to examine multiple cost-of-living measures and look for patterns.
ALASKA ECONOMIC TRENDS MAGAZINE JULY 2021 7
City Index
U.S. average 100.0
1 New York (Manhattan), NY 240.62 San Francisco, CA 188.03 Honolulu, HI 187.64 New York (Brooklyn), NY 174.65 Washington, DC 154.76 Seattle, WA 151.87 Boston, MA 151.88 Orange County, CA 151.09 Oakland, CA 150.3
10 New York (Queens), NY 148.111 Los Angeles-Long Beach, CA 146.612 Arlington, VA 144.213 San Diego, CA 142.514 Bethesda-Gaithersburg-Frederick, MD 141.515 Alexandria, VA 135.716 Stamford, CT 135.417 Portland, OR 131.618 Juneau, AK 127.019 Fairbanks, AK 126.620 Kodiak, AK 124.821 Anchorage, AK 124.622 Chicago, IL 123.9
Most expensive cities, Q1 2021
Source: The Council for Community and Economic Research
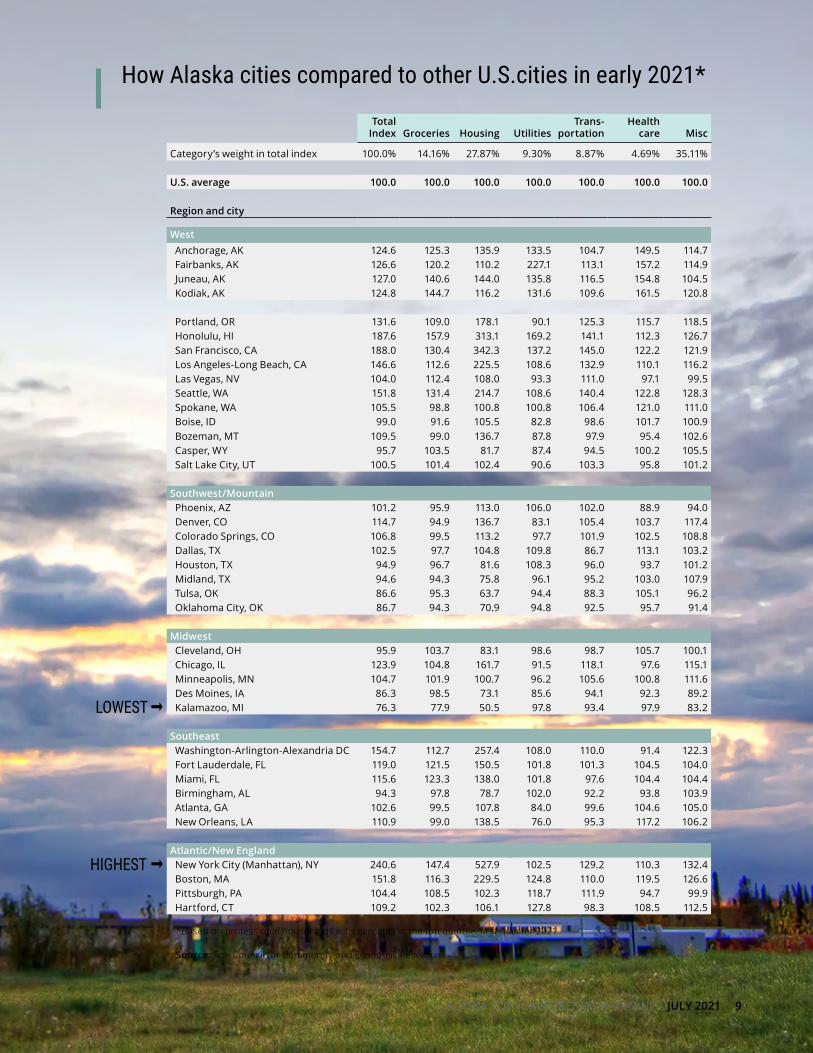
How Alaska's costs stack up nationallyWhen comparing costs between places, one of the most-used sources is the cost-of-living index published quarterly and annually by the Council for Community and Economic Research, or C2ER. It’s based on detailed surveys in more than 250 cities and includes four in Alaska: Anchorage, Fairbanks, Juneau, and Kodiak. Kodiak was absent from the survey for several years but returned in the first quarter of 2021.
The survey covers 57 specific items in categories such as groceries, housing, utilities, transportation, and health care, and assumes a consumption pat-tern based on a professional and executive house-hold in the top income quintile.
Although consumption patterns vary around the country, C2ER doesn’t take this into account. It also doesn't measure taxation, where Alaska has a clear cost advantage.
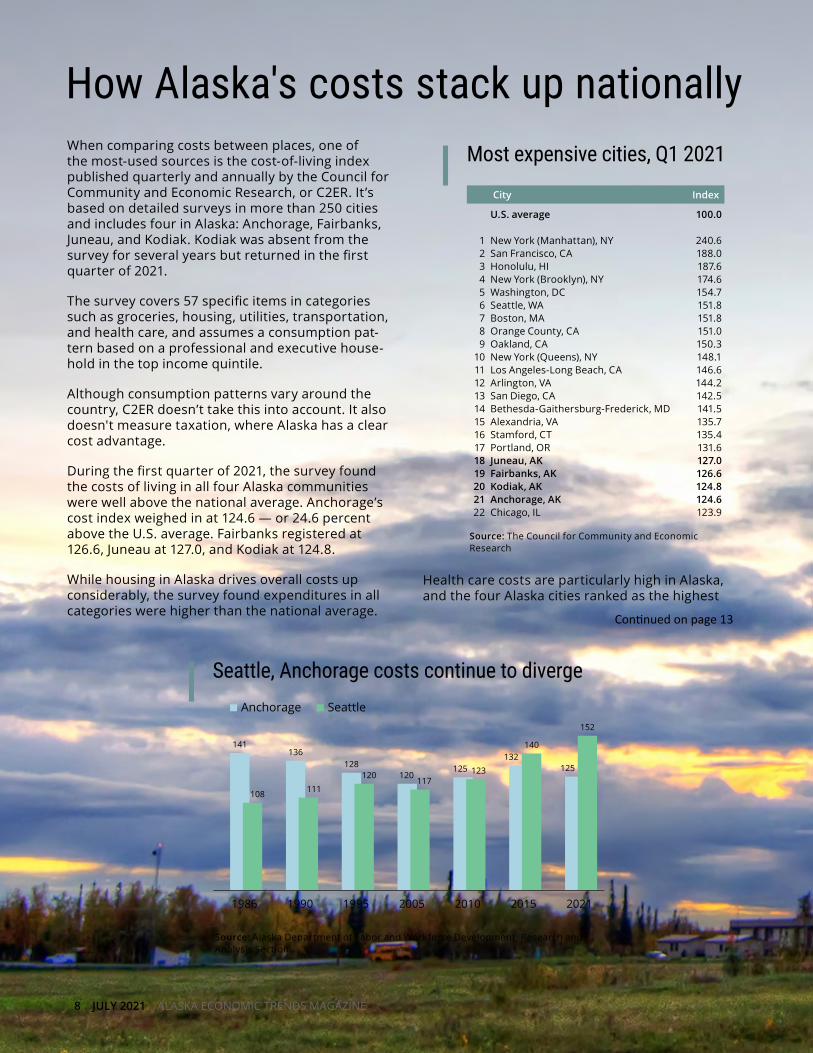
During the first quarter of 2021, the survey found the costs of living in all four Alaska communities were well above the national average. Anchorage’s cost index weighed in at 124.6 — or 24.6 percent above the U.S. average. Fairbanks registered at 126.6, Juneau at 127.0, and Kodiak at 124.8.
While housing in Alaska drives overall costs up considerably, the survey found expenditures in all categories were higher than the national average.
Health care costs are particularly high in Alaska, and the four Alaska cities ranked as the highest
141136
128120
125132
125
108 111120
117123
140
152
1986 1990 1995 2005 2010 2015 2021
Anchorage Seattle
Seattle, Anchorage costs continue to diverge
Source: Alaska Department of Labor and Workforce Development, Research and Analysis Section
Continued on page 13
8 JULY 2021 ALASKA ECONOMIC TRENDS MAGAZINE
How Alaska cities compared to other U.S.cities in early 2021*
*Based on professional households with earnings in the top quintile, first quarter 2021
Source: The Council for Community and Economic Research
Total Index Groceries Housing Utilities
Trans-portation
Health care Misc
Category’s weight in total index 100.0% 14.16% 27.87% 9.30% 8.87% 4.69% 35.11%
U.S. average 100.0 100.0 100.0 100.0 100.0 100.0 100.0 Region and city
West Anchorage, AK 124.6 125.3 135.9 133.5 104.7 149.5 114.7 Fairbanks, AK 126.6 120.2 110.2 227.1 113.1 157.2 114.9 Juneau, AK 127.0 140.6 144.0 135.8 116.5 154.8 104.5 Kodiak, AK 124.8 144.7 116.2 131.6 109.6 161.5 120.8
Portland, OR 131.6 109.0 178.1 90.1 125.3 115.7 118.5 Honolulu, HI 187.6 157.9 313.1 169.2 141.1 112.3 126.7 San Francisco, CA 188.0 130.4 342.3 137.2 145.0 122.2 121.9 Los Angeles-Long Beach, CA 146.6 112.6 225.5 108.6 132.9 110.1 116.2 Las Vegas, NV 104.0 112.4 108.0 93.3 111.0 97.1 99.5 Seattle, WA 151.8 131.4 214.7 108.6 140.4 122.8 128.3 Spokane, WA 105.5 98.8 100.8 100.8 106.4 121.0 111.0 Boise, ID 99.0 91.6 105.5 82.8 98.6 101.7 100.9 Bozeman, MT 109.5 99.0 136.7 87.8 97.9 95.4 102.6 Casper, WY 95.7 103.5 81.7 87.4 94.5 100.2 105.5 Salt Lake City, UT 100.5 101.4 102.4 90.6 103.3 95.8 101.2
Southwest/Mountain Phoenix, AZ 101.2 95.9 113.0 106.0 102.0 88.9 94.0 Denver, CO 114.7 94.9 136.7 83.1 105.4 103.7 117.4 Colorado Springs, CO 106.8 99.5 113.2 97.7 101.9 102.5 108.8 Dallas, TX 102.5 97.7 104.8 109.8 86.7 113.1 103.2 Houston, TX 94.9 96.7 81.6 108.3 96.0 93.7 101.2 Midland, TX 94.6 94.3 75.8 96.1 95.2 103.0 107.9 Tulsa, OK 86.6 95.3 63.7 94.4 88.3 105.1 96.2 Oklahoma City, OK 86.7 94.3 70.9 94.8 92.5 95.7 91.4
Midwest Cleveland, OH 95.9 103.7 83.1 98.6 98.7 105.7 100.1 Chicago, IL 123.9 104.8 161.7 91.5 118.1 97.6 115.1 Minneapolis, MN 104.7 101.9 100.7 96.2 105.6 100.8 111.6 Des Moines, IA 86.3 98.5 73.1 85.6 94.1 92.3 89.2 Kalamazoo, MI 76.3 77.9 50.5 97.8 93.4 97.9 83.2
Southeast Washington-Arlington-Alexandria DC 154.7 112.7 257.4 108.0 110.0 91.4 122.3 Fort Lauderdale, FL 119.0 121.5 150.5 101.8 101.3 104.5 104.0 Miami, FL 115.6 123.3 138.0 101.8 97.6 104.4 104.4 Birmingham, AL 94.3 97.8 78.7 102.0 92.2 93.8 103.9 Atlanta, GA 102.6 99.5 107.8 84.0 99.6 104.6 105.0 New Orleans, LA 110.9 99.0 138.5 76.0 95.3 117.2 106.2
Atlantic/New England New York City (Manhattan), NY 240.6 147.4 527.9 102.5 129.2 110.3 132.4 Boston, MA 151.8 116.3 229.5 124.8 110.0 119.5 126.6 Pittsburgh, PA 104.4 108.5 102.3 118.7 111.9 94.7 99.9 Hartford, CT 109.2 102.3 106.1 127.8 98.3 108.5 112.5
LOWEST
HIGHEST
ALASKA ECONOMIC TRENDS MAGAZINE JULY 2021 9
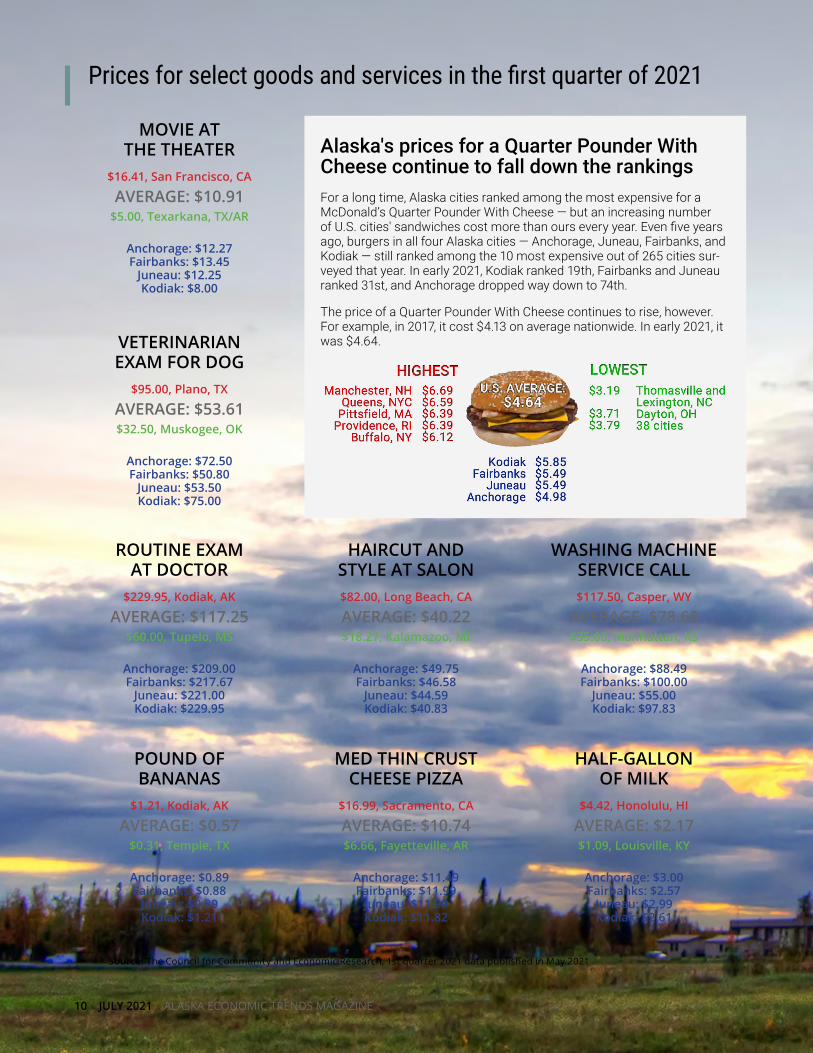
Alaska's prices for a Quarter Pounder With Cheese continue to fall down the rankings For a long time, Alaska cities ranked among the most expensive for a McDonald’s Quarter Pounder With Cheese — but an increasing number of U.S. cities' sandwiches cost more than ours every year. Even five years ago, burgers in all four Alaska cities — Anchorage, Juneau, Fairbanks, and Kodiak — still ranked among the 10 most expensive out of 265 cities sur-veyed that year. In early 2021, Kodiak ranked 19th, Fairbanks and Juneau ranked 31st, and Anchorage dropped way down to 74th.
The price of a Quarter Pounder With Cheese continues to rise, however. For example, in 2017, it cost $4.13 on average nationwide. In early 2021, it was $4.64.
10 JULY 2021 ALASKA ECONOMIC TRENDS MAGAZINE
MOVIE ATTHE THEATER
$16.41, San Francisco, CA AVERAGE: $10.91
$5.00, Texarkana, TX/AR
Anchorage: $12.27Fairbanks: $13.45
Juneau: $12.25Kodiak: $8.00
VETERINARIANEXAM FOR DOG
$95.00, Plano, TX AVERAGE: $53.61$32.50, Muskogee, OK
Anchorage: $72.50Fairbanks: $50.80
Juneau: $53.50Kodiak: $75.00
ROUTINE EXAMAT DOCTOR
$229.95, Kodiak, AK AVERAGE: $117.25
$60.00, Tupelo, MS
Anchorage: $209.00Fairbanks: $217.67
Juneau: $221.00Kodiak: $229.95
HAIRCUT AND STYLE AT SALON $82.00, Long Beach, CA AVERAGE: $40.22$18.27, Kalamazoo, MI
Anchorage: $49.75Fairbanks: $46.58
Juneau: $44.59Kodiak: $40.83
WASHING MACHINE SERVICE CALL $117.50, Casper, WY
AVERAGE: $78.68$35.00, Manhattan, KS
Anchorage: $88.49Fairbanks: $100.00
Juneau: $55.00Kodiak: $97.83
POUND OF BANANAS
$1.21, Kodiak, AK AVERAGE: $0.57
$0.31, Temple, TX
Anchorage: $0.89Fairbanks: $0.88
Juneau: $0.89Kodiak: $1.21
MED THIN CRUST CHEESE PIZZA
$16.99, Sacramento, CA AVERAGE: $10.74$6.66, Fayetteville, AR
Anchorage: $11.49Fairbanks: $11.99
Juneau: $11.99Kodiak: $11.82
HALF-GALLONOF MILK
$4.42, Honolulu, HI AVERAGE: $2.17$1.09, Louisville, KY
Anchorage: $3.00Fairbanks: $2.57
Juneau: $2.99Kodiak: $2.61
Prices for select goods and services in the first quarter of 2021
Source: The Council for Community and Economic Research, 1st quarter 2021 data published in May 2021

Rural fuel costs, Jan 2021
CommunityHome heating fuel No. 1, gal
Gasoline, gal regular
Akiak $4.69 $4.92 Angoon $4.62 $4.42Arctic Village $12.00 $8.00Atka $7.50 $8.35Bethel $4.03 $3.86Chenega Bay $5.04 $5.95Chignik $3.94 $3.83Circle $3.15 $3.20Deering $4.38 $4.38Dillingham $3.52 $4.57Eagle $3.50 $3.75Emmonak $5.16 $5.41Fairbanks $2.74 $2.75Galena $5.18 $6.00Gambell $4.58 $6.70Glennallen $2.09 $2.95Golovin $3.10 $3.60Holy Cross $6.05 $6.27Homer $2.55 $2.57Hooper Bay $5.30 $5.41Huslia $6.25 $6.00Juneau $2.53 $2.88King Cove $3.04 $4.13Kodiak $2.74 $2.69Kokhanok $7.00 $7.00Kotzebue $5.89 $5.89Mountain Village $6.18 $6.11Nenana $2.58 $3.42Noorvik $5.64 $5.20Nuiqsut $2.30 $5.00Nulato $4.00 $5.00Pelican $3.64 $3.83Pilot Station $6.25 $6.05Port Lions $3.35 $3.41Ruby $4.75 $4.75Sand Point $4.65 $3.74Shishmaref $3.11 $3.71Unalaska $2.93 $3.89Wales $4.64 $4.89Wrangell $2.91 $3.32
Note: This is a partial list of the 100 surveyed com-munities. Source: Alaska Department of Commerce, Commu-nity, and Economic Development, Current Community Conditions: Fuel Prices Across Alaska, January 2021 update
Median adjusted rents by area in 2021
Notes: Adjusted rent is rent plus the cost of all utilities, whether they’re includ-ed in rent payments or paid separately by renters. Rents are for all unit types.
Source: Alaska Department of Labor and Workforce Development, Research and Analysis Section and Alaska Housing Finance Corporation
$1,323
$1,270
$1,246
$1,245
$1,241
$1,230
$1,179
$1,172
$1,051
$1,023
$950
Sitka
Kodiak Island
Fairbanks North Star
Juneau
Chugach/Copper River
Ketchikan
Survey total
Anchorage
Matanuska-Susitna
Kenai Peninsula
Wrangell/Petersburg
Comparing costs among Alaska townsWithin Alaska, a big range in fuel costs Because rising fuel prices have a disproportionate effect on the state's rural communities, the Alaska Department of Commerce, Community, and Economic Development con-ducts a semiannual survey of fuel prices in 100 places around the state.
As other surveys have shown, communities with the highest prices were those that depend on flights for their supplies. With few exceptions, the smaller and more remote communities paid significantly more than the state’s larger, more urban areas.
For example, a gallon of gasoline that cost $2.75 in Fairbanks and $2.88 in Juneau in early 2021 cost $8.35 in Atka (in the Aleutian Islands) and $8.00 in Arctic Village.
Housing can reflect overall living costsBecause housing eats up about 40 percent of a household's income, it can be a good proxy for an area’s overall cost of living.
ALASKA ECONOMIC TRENDS MAGAZINE JULY 2021 11
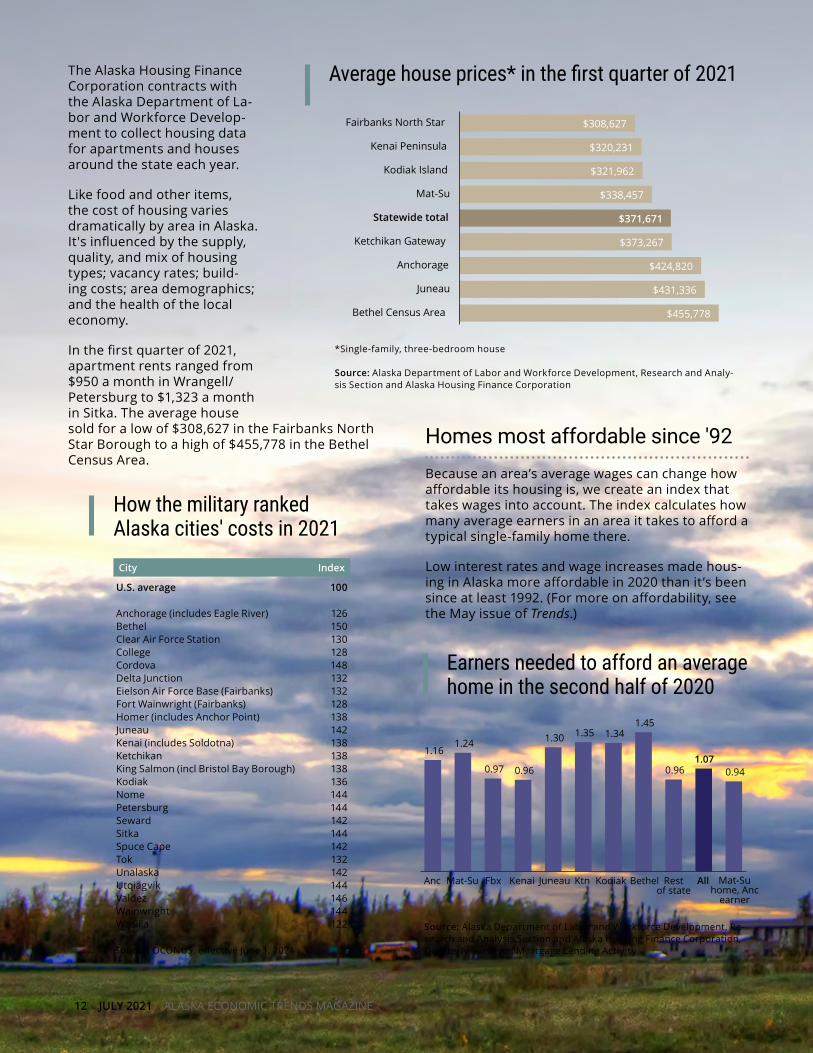
The Alaska Housing Finance Corporation contracts with the Alaska Department of La-bor and Workforce Develop-ment to collect housing data for apartments and houses around the state each year.
Like food and other items, the cost of housing varies dramatically by area in Alaska. It's influenced by the supply, quality, and mix of housing types; vacancy rates; build-ing costs; area demographics; and the health of the local economy.
In the first quarter of 2021, apartment rents ranged from $950 a month in Wrangell/Petersburg to $1,323 a month in Sitka. The average house sold for a low of $308,627 in the Fairbanks North Star Borough to a high of $455,778 in the Bethel Census Area.
Average house prices* in the first quarter of 2021
$455,778
$431,336
$424,820
$373,267
$371,671
$338,457
$321,962
$320,231
$308,627
Bethel Census Area
Juneau
Anchorage
Ketchikan Gateway
Statewide total
Mat-Su
Kodiak Island
Kenai Peninsula
Fairbanks North Star
-
*Single-family, three-bedroom house Source: Alaska Department of Labor and Workforce Development, Research and Analy-sis Section and Alaska Housing Finance Corporation
Homes most affordable since '92Because an area’s average wages can change how affordable its housing is, we create an index that takes wages into account. The index calculates how many average earners in an area it takes to afford a typical single-family home there.
Low interest rates and wage increases made hous-ing in Alaska more affordable in 2020 than it’s been since at least 1992. (For more on affordability, see the May issue of Trends.)
City Index
U.S. average 100
Anchorage (includes Eagle River) 126Bethel 150Clear Air Force Station 130College 128Cordova 148Delta Junction 132Eielson Air Force Base (Fairbanks) 132Fort Wainwright (Fairbanks) 128Homer (includes Anchor Point) 138Juneau 142Kenai (includes Soldotna) 138Ketchikan 138King Salmon (incl Bristol Bay Borough) 138Kodiak 136Nome 144Petersburg 144Seward 142Sitka 144Spuce Cape 142Tok 132Unalaska 142Utqiagvik 144Valdez 146Wainwright 144Wasilla 122
How the military ranked Alaska cities' costs in 2021
Source: OCONUS, effective June 1, 2021
12 JULY 2021 ALASKA ECONOMIC TRENDS MAGAZINE
Earners needed to afford an average home in the second half of 2020
Source: Alaska Department of Labor and Workforce Development, Re-search and Analysis Section and Alaska Housing Finance Corporation, Quarterly Survey of Mortgage Lending Activity
1.16 1.24
0.97 0.96
1.30 1.35 1.34 1.45
0.96 1.07
0.94
Anc Mat-Su Fbx Kenai Juneau Ktn Kodiak Bethel Restof state
All Mat-Suhome, Anc
earner
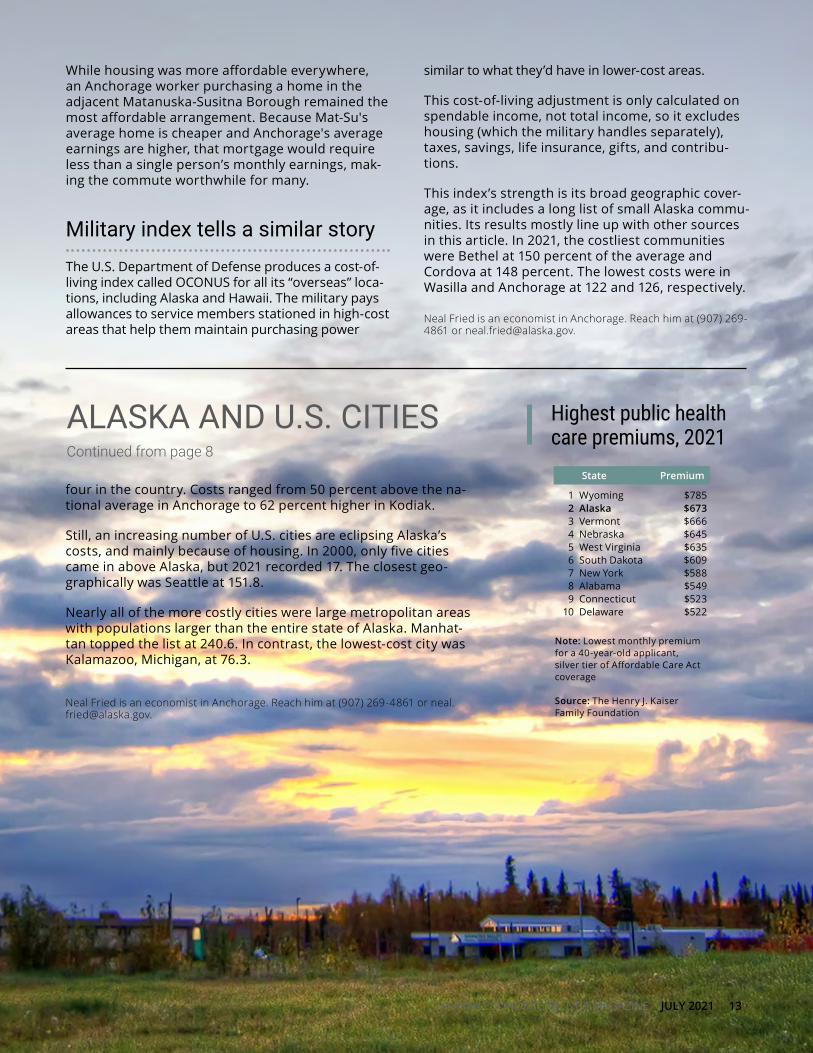
State Premium
1 Wyoming $785 2 Alaska $673 3 Vermont $666 4 Nebraska $645 5 West Virginia $635 6 South Dakota $609 7 New York $588 8 Alabama $549 9 Connecticut $523
10 Delaware $522
Highest public healthcare premiums, 2021
Note: Lowest monthly premium for a 40-year-old applicant, silver tier of Affordable Care Act coverage Source: The Henry J. Kaiser Family Foundation
four in the country. Costs ranged from 50 percent above the na-tional average in Anchorage to 62 percent higher in Kodiak.
Still, an increasing number of U.S. cities are eclipsing Alaska’s costs, and mainly because of housing. In 2000, only five cities came in above Alaska, but 2021 recorded 17. The closest geo-graphically was Seattle at 151.8.
Nearly all of the more costly cities were large metropolitan areas with populations larger than the entire state of Alaska. Manhat-tan topped the list at 240.6. In contrast, the lowest-cost city was Kalamazoo, Michigan, at 76.3.
Neal Fried is an economist in Anchorage. Reach him at (907) 269-4861 or [email protected].
ALASKA AND U.S. CITIESContinued from page 8
While housing was more affordable everywhere, an Anchorage worker purchasing a home in the adjacent Matanuska-Susitna Borough remained the most affordable arrangement. Because Mat-Su's average home is cheaper and Anchorage's average earnings are higher, that mortgage would require less than a single person’s monthly earnings, mak-ing the commute worthwhile for many.
Military index tells a similar storyThe U.S. Department of Defense produces a cost-of-living index called OCONUS for all its “overseas” loca-tions, including Alaska and Hawaii. The military pays allowances to service members stationed in high-cost areas that help them maintain purchasing power
similar to what they’d have in lower-cost areas.
This cost-of-living adjustment is only calculated on spendable income, not total income, so it excludes housing (which the military handles separately), taxes, savings, life insurance, gifts, and contribu-tions.
This index’s strength is its broad geographic cover-age, as it includes a long list of small Alaska commu-nities. Its results mostly line up with other sources in this article. In 2021, the costliest communities were Bethel at 150 percent of the average and Cordova at 148 percent. The lowest costs were in Wasilla and Anchorage at 122 and 126, respectively.
Neal Fried is an economist in Anchorage. Reach him at (907) 269-4861 or [email protected].
ALASKA ECONOMIC TRENDS MAGAZINE JULY 2021 13
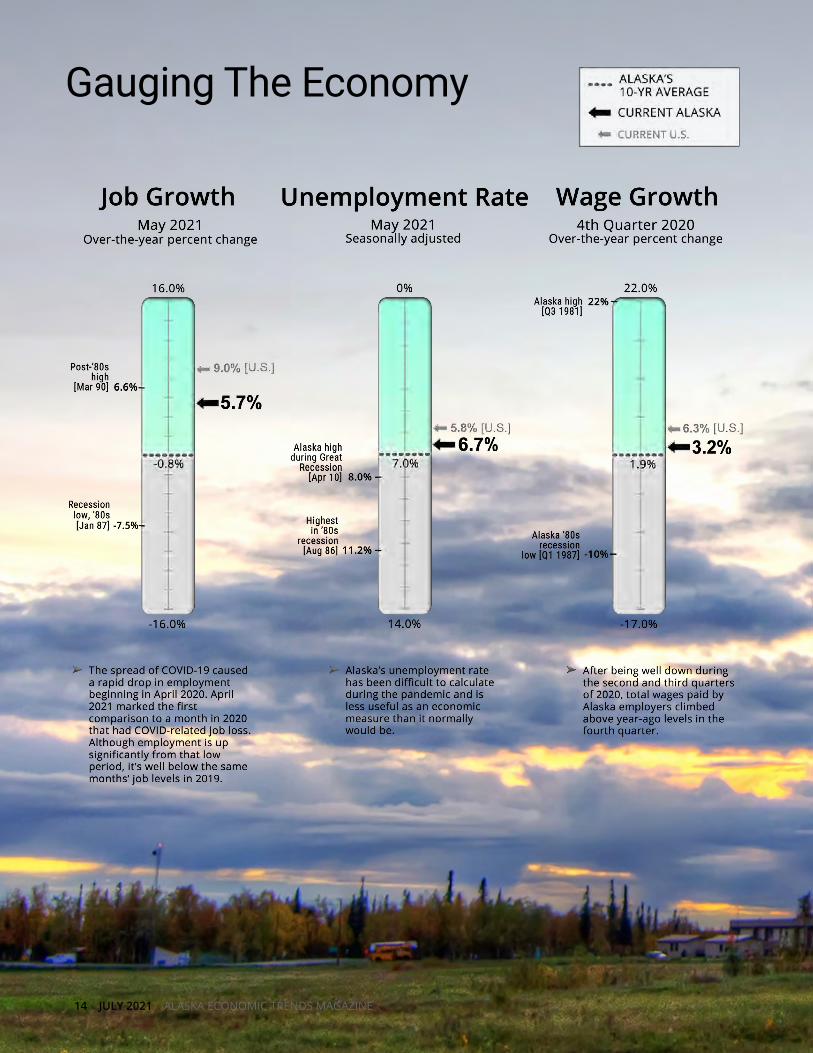
Gauging The Economy
14 JULY 2021 ALASKA ECONOMIC TRENDS MAGAZINE
**Four-week moving average ending with specified week *In current dollars
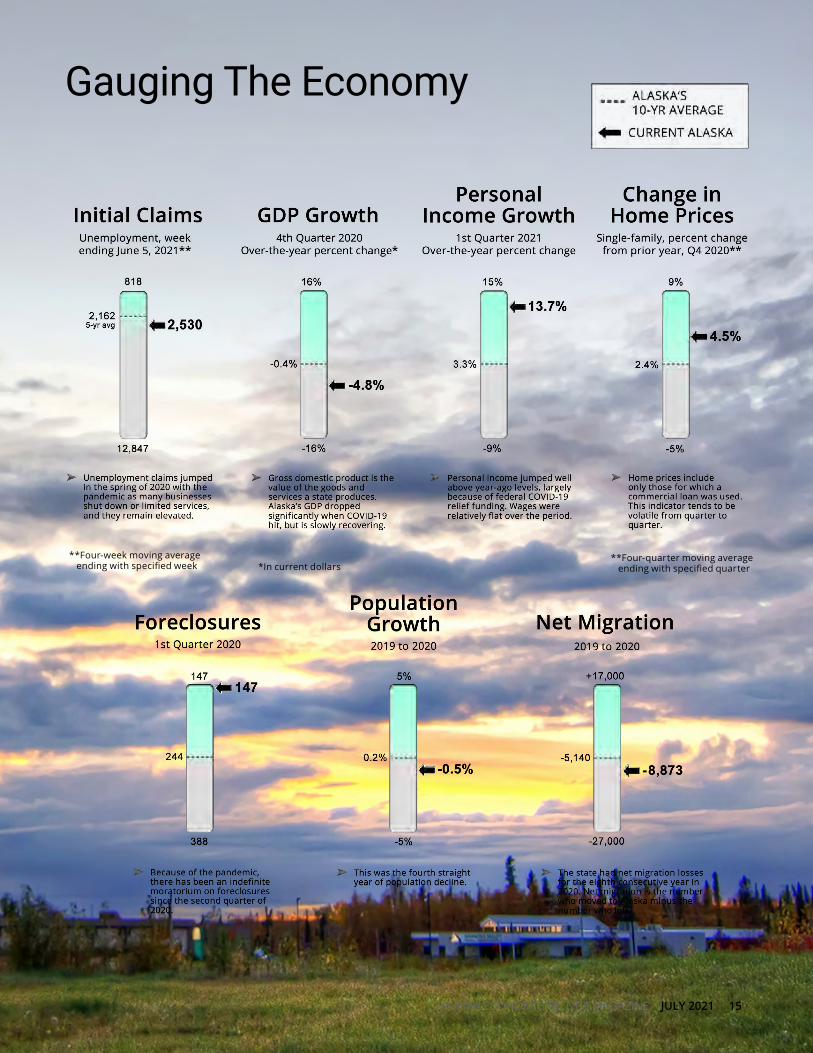
Gauging The Economy
**Four-quarter moving average ending with specified quarter
ALASKA ECONOMIC TRENDS MAGAZINE JULY 2021 15
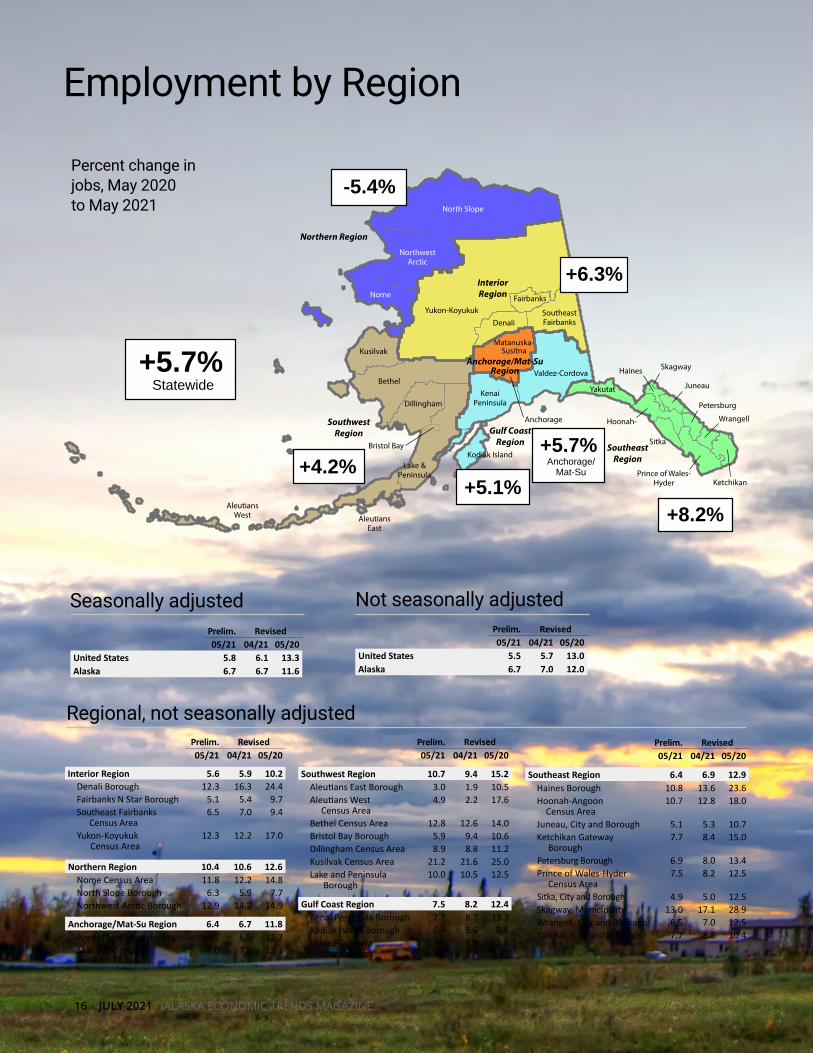
Seasonally adjusted
Prelim. Revised05/21 04/21 05/20
Interior Region 5.6 5.9 10.2 Denali Borough 12.3 16.3 24.4 Fairbanks N Star Borough 5.1 5.4 9.7 Southeast Fairbanks Census Area
6.5 7.0 9.4
Yukon-Koyukuk Census Area
12.3 12.2 17.0
Northern Region 10.4 10.6 12.6 Nome Census Area 11.8 12.2 14.8 North Slope Borough 6.3 5.9 7.7 Northwest Arctic Borough 12.9 14.2 14.9
Anchorage/Mat-Su Region 6.4 6.7 11.8 Anchorage, Municipality 6.1 6.5 11.7 Mat-Su Borough 7.0 7.5 12.3
Prelim. Revised05/21 04/21 05/20
Southeast Region 6.4 6.9 12.9 Haines Borough 10.8 13.6 23.6 Hoonah-Angoon Census Area
10.7 12.8 18.0
Juneau, City and Borough 5.1 5.3 10.7 Ketchikan Gateway Borough
7.7 8.4 15.0
Petersburg Borough 6.9 8.0 13.4 Prince of Wales-Hyder Census Area
7.5 8.2 12.5
Sitka, City and Borough 4.9 5.0 12.5 Skagway, Municipality 13.0 17.1 28.9 Wrangell, City and Borough 6.5 7.0 12.5 Yakutat, City and Borough 7.7 8.8 10.4
Prelim. Revised05/21 04/21 05/20
United States 5.8 6.1 13.3Alaska 6.7 6.7 11.6
Prelim. Revised05/21 04/21 05/20
Southwest Region 10.7 9.4 15.2 Aleutians East Borough 3.0 1.9 10.5 Aleutians West Census Area
4.9 2.2 17.6
Bethel Census Area 12.8 12.6 14.0 Bristol Bay Borough 5.9 9.4 10.6 Dillingham Census Area 8.9 8.8 11.2 Kusilvak Census Area 21.2 21.6 25.0 Lake and Peninsula Borough
10.0 10.5 12.5
Gulf Coast Region 7.5 8.2 12.4 Kenai Peninsula Borough 7.7 8.7 13.3 Kodiak Island Borough 6.4 5.6 8.6 Valdez-Cordova Census Area
7.8 8.9 12.4
Prelim. Revised05/21 04/21 05/20
United States 5.5 5.7 13.0Alaska 6.7 7.0 12.0
Regional, not seasonally adjusted
Not seasonally adjusted
Northern Region
Anchorage/Mat-SuRegion
Bristol Bay
InteriorRegion
Kodiak Island
KenaiPeninsula
Matanuska-Susitna
Anchorage
Valdez-Cordova
SoutheastFairbanksDenali
FairbanksYukon-Koyukuk
North Slope
NorthwestArctic
Nome
Kusilvak
Bethel
Dillingham
AleutiansEast
AleutiansWest
Lake &Peninsula
SouthwestRegion Gulf Coast
Region
Yakutat
Sitka
Hoonah-
Prince of Wales-Hyder
Haines Skagway
Juneau
Ketchikan
Petersburg
Wrangell
SoutheastRegion
-5.4%
+8.2%+5.1%
+4.2%
+6.3%
+5.7%Anchorage/
Mat-Su
+5.7%Statewide
Percent change in jobs, May 2020to May 2021
Employment by Region
16 JULY 2021 ALASKA ECONOMIC TRENDS MAGAZINE
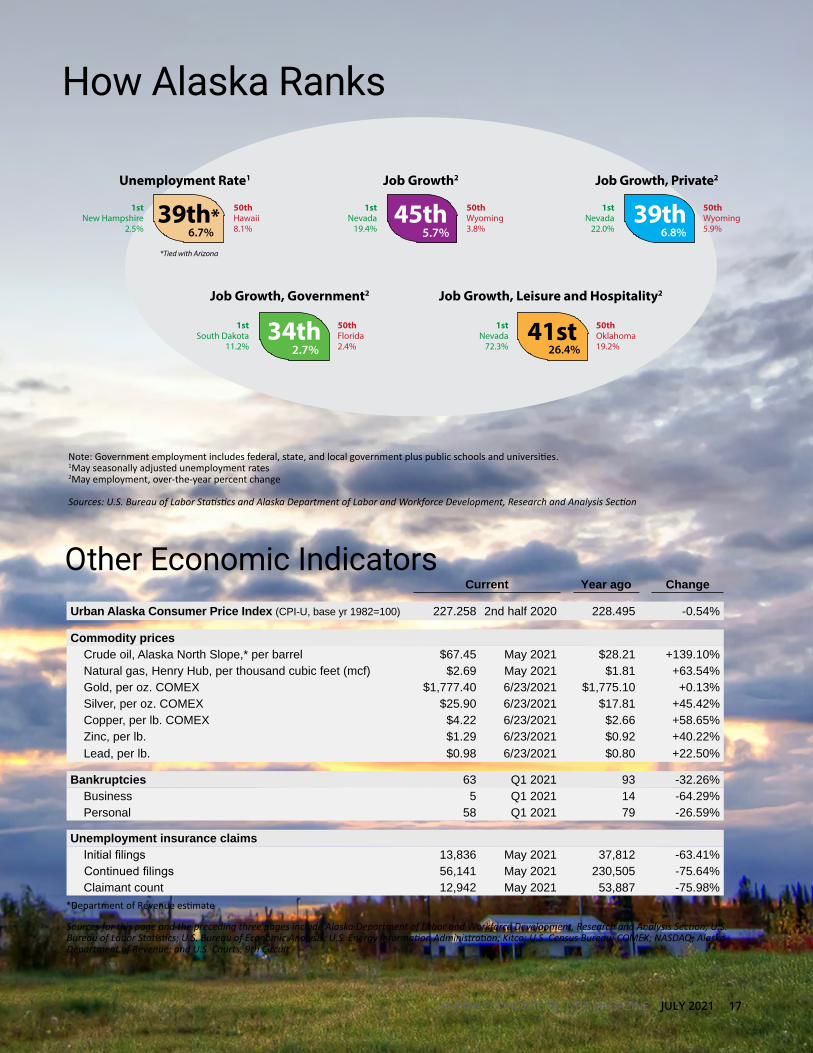
Note: Government employment includes federal, state, and local government plus public schools and universities.1May seasonally adjusted unemployment rates2May employment, over-the-year percent change
Sources: U.S. Bureau of Labor Statistics and Alaska Department of Labor and Workforce Development, Research and Analysis Section
Current Year ago Change
Urban Alaska Consumer Price Index (CPI-U, base yr 1982=100) 227.258 2nd half 2020 228.495 -0.54%
Commodity prices Crude oil, Alaska North Slope,* per barrel $67.45 May 2021 $28.21 +139.10% Natural gas, Henry Hub, per thousand cubic feet (mcf) $2.69 May 2021 $1.81 +63.54% Gold, per oz. COMEX $1,777.40 6/23/2021 $1,775.10 +0.13% Silver, per oz. COMEX $25.90 6/23/2021 $17.81 +45.42% Copper, per lb. COMEX $4.22 6/23/2021 $2.66 +58.65% Zinc, per lb. $1.29 6/23/2021 $0.92 +40.22% Lead, per lb. $0.98 6/23/2021 $0.80 +22.50%
Bankruptcies 63 Q1 2021 93 -32.26% Business 5 Q1 2021 14 -64.29% Personal 58 Q1 2021 79 -26.59%
Unemployment insurance claims Initial filings 13,836 May 2021 37,812 -63.41% Continued filings 56,141 May 2021 230,505 -75.64% Claimant count 12,942 May 2021 53,887 -75.98%
Other Economic Indicators
*Department of Revenue estimate
Sources for this page and the preceding three pages include Alaska Department of Labor and Workforce Development, Research and Analysis Section; U.S. Bureau of Labor Statistics; U.S. Bureau of Economic Analysis; U.S. Energy Information Administration; Kitco; U.S. Census Bureau; COMEX; NASDAQ; Alaska Department of Revenue; and U.S. Courts, 9th Circuit
How Alaska Ranks
39th*1stNew Hampshire
2.5%
Unemployment Rate1
6.7%
2.7%
45thJob Growth2
5.7%
1stNevada
19.4%
Job Growth, Government2
39th1stNevada
22.0%
Job Growth, Private2
6.8%
1stSouth Dakota
11.2%41st
Job Growth, Leisure and Hospitality2
26.4%
50thOklahoma19.2%
50thFlorida2.4%
34th
50thWyoming3.8%
50thWyoming5.9%
50thHawaii8.1%
1stNevada
72.3%
*Tied with Arizona
ALASKA ECONOMIC TRENDS MAGAZINE JULY 2021 17

SAFETY MINUTE
Injuries, illnesses, and fatalities take a toll on employ-ees and their families. They also cost organizations billions of dollars in often preventable expenses. By investing in safety up front, employers can reap a variety of cost savings, both directly and indirectly. Studies show that for every $1 invested, an employer can expect up to $6 in returns.
Direct expenses are the most obvious and include workers’ compensation payouts, OSHA penalties, civil liability, litigation costs, insurance premium increases, medical expenses, and emergency re-sponse fees.
The indirect costs of injuries, illnesses, and fatalities are often more expensive, however, and employers sometimes overlook them when deciding whether investing in safety is worth it. Indirect costs include re-duced productivity, low morale, additional administra-tive work, loss of skilled workers, worker replacement, and workplace disruptions after a workplace incident.
Workplace safety and health programs have prov-en to reduce injuries, illnesses, and fatalities by
Employers' early investment in safety pays off sixfoldinvolving employees in the identification, elimination, and prevention of workplace hazards. Employers that invest their time, money, and effort into these pro-grams decrease their numbers of workplace incidents and receive other benefits that more than cover the cost of setting up and maintaining their programs.
Establishing clear policies, an environment that encourages employee involvement in safety and health risk reduction, and strong leadership support are proven to decrease costs over time. Investing in safety is not just the right thing to do; it’s good for employers and good for workers.
For more on the free services we offer small employ-ers, contact the department's Consultation and Train-ing section at (800) 656-4972 or (907) 269-4955.
This Safety Minute was written by Michael Flint, safety consul-tant for the Alaska Occupational Safety and Health Consultation and Training Section of the Department of Labor and Workforce Development. For more information on keeping your employees safe, please visit labor.alaska.gov/lss/oshhome.htm and follow us on Facebook at facebook.com/alaskalabor.
EMPLOYER RESOURCES
Alaska’s Work Opportunity Tax Credit program of-fers substantial federal tax credits — between $1,200 and $9,600 per eligible hire — to employers who hire certain at-risk job seekers. Examples include unem-ployed and disabled veterans, people receiving public assistance and their family members, those who have been incarcerated, some residents of Rural Renewal Counties and designated Empowerment Zones, and the long-term unemployed.
Alaska WOTC is now part of the AlaskaJobs online system. Whether your business is new to the program or has applied before, AlaskaJobs is your path to these tax credits and the most timely and efficient way to manage requests and communication.
Employers must establish a WOTC account to submit new requests or connect with their existing WOTC port-folio in AlaskaJobs. For instructions, see https://jobs.
Use AlaskaJobs for the Work Opportunity Tax Creditalaska.gov/wotc.htm. For AlaskaJobs assistance, con-tact your local Alaska Job Center at https://jobs.alaska.gov/offices/index.html or call toll-free: (877) 724-2539.
Once you have opened your AlaskaJobs account, you can enlist a third-party agent such as your tax preparer or payroll processor to submit tax credit requests and manage your portfolio. For information and IRS Form 2848, required for third-party representation, visit https://www.irs.gov/forms-pubs/about-form-2848.
To activate your new AlaskaJobs WOTC account or ask questions, please email [email protected]. Assisting employers is our No. 1 priority, and we will respond to your email immediately. Employer Resources is written by the Employment and Training Services Division of the Alaska Department of Labor and Work-force Development.