Embed Size (px)
Citation preview
6 April 1984
WORKING PAPER
The Piers-Harris Children's Self Concept Scale An evaluation of its use on an Australian population
Paul R. Amato
The Piers-Harris Children's Self Concept Scale An evaluation of its use on an Australian population
Paul R. Amato Institute of Family Studies Melbourne
Institute of Family Studies Working Paper No. 6 April1984
::J IJl ..... ;::1: c: ..... CD o ..... " Q)
3 -< CIl ..... c: Cl. Cii· IJl
~ o ::0 2S z G)
~ "'U m ::0
z o 0)
l> "C ~.
::J en .-+ ;:.: C .-+ CD o -'T1 Cl
3 <: en .-+ C c.. CD en
~ o :c 2S z G>
~ ""0 m :c
z o O'l
» "0 :::!.
© Institute of Family Studies - Commonwealth of Australia 1984
Institute of Family Studies 766 Elizabeth Street Melbourne 3000 Australia Telephone (03) 342 9100
April 1984
National Library of Australia Cataloguing-in-Publication data
Amato, Paul R. The Piers-Harris Children's Self Concept Scale. Bibliography. ISBN 0642871922. 1. Self-perception in children - Testing. 2. Self-respect in children - Testing. 3. Psychological tests for children. I. Australia. Institute of Family Studies. 11. Title. (Series: Working paper (Australia. Institute of Family Studies); no. 6).
155.2'8
ISSN 0725-2420
Every effort has been made to comply with copyright legislation. The Institute apoligises if any infringement has occurred and would be pleased to discuss appropriate arrangements with publishers where necessary.
Typeset by B.ookset, Melbourne Printed by Globe Press Designed by Lauren Statham

Introduction
The Piers-Harris Children's Self Concept Scale (Piers and Harris, 1969, 1977) is one of the most widely used measures of children's self-esteem. However, most of the research conducted with the Children's Self Concept Scale (CSCS) has been carried out in the United States. Hence, information on its reliability, validity, and factor structure comes almost entirely from American studies, with little data available to guide its use in other countries. Although the scale has been used previously in Australian-based research (e.g., Cooper, Holman and Braithwaite, 1983), no detailed analysis has yet been made of its applicability to an Australian population.
Since the CSCS was to be used as a major dependent variable in the Institute of Family Studies' research on Children in Families (Study 5), a detailed analysis of its characteristics was undertaken as a preliminary step. This paper presents data relating to the scale's reliability, validity, and internal structure, and makes recommendations regarding its future use.
The Children in Families Study is a major project designed and coordinated by Gay Ochiltree, IFS Fellow, as Principal Investigator in charge of the Institute's 'Families and Education' area. The study aims at identifying ways in which varying family resources are used actively by children in the development of competence. Competence is seen as central to the process of child development, involving the interrelated notions of 'equipment for competence' and 'the competent self' (see Smith, 1968; Edgar, 1980). Several measures of competence were developed for the study, with the CSCS being used as one indicator of the 'competent self'.
The Study Sample
Data were obtained from a total of 402 male and female Victorian school students in 1982 and 1983. The first sample consisted of 195 Year 3 and Year 4 students randomly selected from 56 Victorian primary schools, with proportional representation of all school systems - State, Catholic, and non-Catholic private school systems. The second sample consisted of 207 Year 10 and Year 11 students randomly selected from
57 Victorian secondary schools with proportioanl representation of all school systems - State High, State Technical, Catholic, and non-Catholic private school systems. One class was selected from each school, and students were selected using a random-start, constant interval method within each class. (For more details on sampling procedures, see Amato, 1983.)
The Children's Self Concept Scale was administered privately to each student by a field worker. Although the reading ability of about Year 3 level is sufficient to complete the CSCS, it was administered orally to all Year 3 and Year 4 students. Secondary students completed the scale themselves.
Scale Characteristics
The CSCS consists of 80 statements about the self to which the child responds using a 'yes' or 'no' format. To calculate the total scale score, the responses (coded o and 1) are equally weighted and summed. Three items (numbers 5, 29, and 55) were slightly reworded to make them less confusing to Australian children -'I am smart' was changed to 'I am clever', 'I have pretty eyes' was changed to 'I have nice eyes', and 'I have lots of pep' was changed to 'I have lots of energy'.
In the present study, the scores of primary students ranged from 19 to 77, with a mean of 58.7 and a standard deviation of 12.0. As noted by Piers and Harris (1969), the distribution of scores was negatively skewed (skewness = -.81, kurtosis = .27), with the median score being 60.5. For the secondary students, the scores ranged from 10 to 78, with a mean of 56.6 and a standard deviation of 11.1. Again, the distribution of scores was negatively skewed (skewness = - .94, kurtosis = 1.58), with the median score being 58.5. These means are somewhat lower than the means reported by Piers and Harris (1969) for the sample of 1183 public school children oUsed to norm the CSCS. However, the Australian means are well within the range of means reported for other American samples (see Piers and Harris, 1969, for a review).
Comparisons were made between males and females of each grade level. However, no significant differences in mean scores or in standard deviations were observed between groups (all p;:,..05).
::J Cl) .-+ ;:;: c .-+ CD o -" DJ
3 -< en .-+ C c.. CD Cl)
~ o ::0 2S z Cl
~ -u m ::0
z o 0)
» "0 ::::!.
1
::J (Jl .... ;:i: c .... (1)
o ...... "T1 Cl)
3 -< en .... c a. (1) (Jl
~ :D 2:'5 z G)
~ ""0 m :D
z o en » "0
:::::!.
..... (0 00 .j:>o
2
Scale Reliability
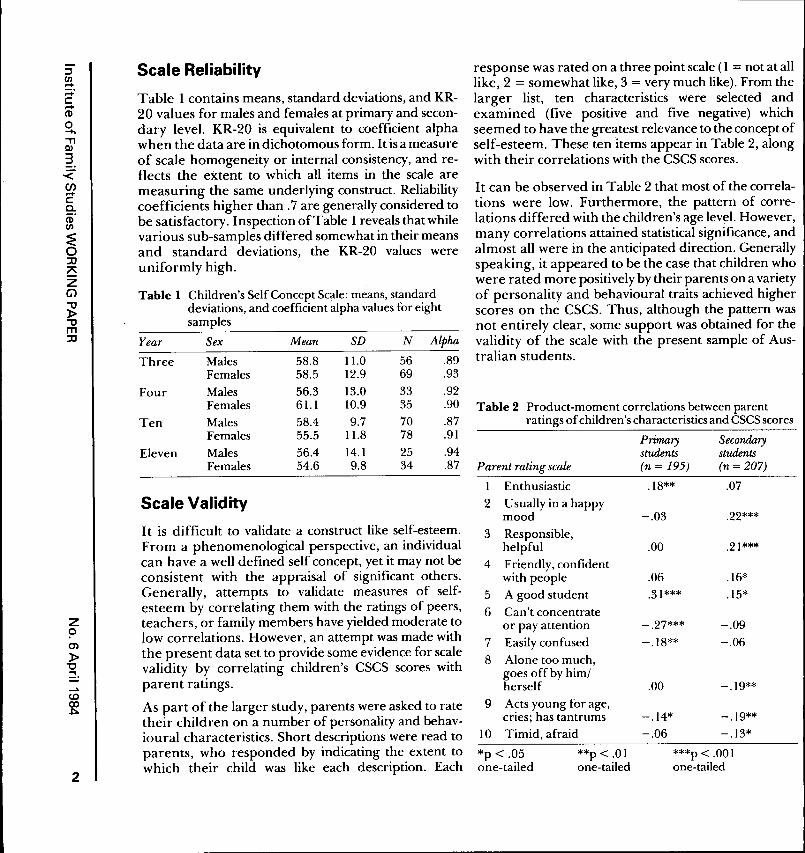
Table 1 contains means, standard deviations, and KR-20 values for males and females at primary and secondary level. KR-20 is equivalent to coefficient alpha when the data are in dichotomous form. It is a measure of scale homogeneity or internal consistency, and reflects the extent to which all items in the scale are measuring the same underlying construct. Reliability coefficients higher than. 7 are generally considered to be satisfactory. Inspection of Table 1 reveals that while various sub-samples differed somewhat in their means and standard deviations, the KR-20 values were uniformly high.
Table 1 Children's Self Concept Scale: means, standard deviations, and coefficient alpha values for eight samples
Year Sex Mean SD N Alpha
Three Males 58.8 1l.0 56 .89 Females 58.5 12.9 69 .93
Four Males 56.3 13.0 33 .92 Females 61.1 10.9 35 .90
Ten Males 58.4 9.7 70 .87 Females 55.5 1l.8 78 .91
Eleven Males 56.4 14.1 25 .94 Females 54.6 9.8 34 .87
Scale Validity
It is difficult to validate a construct like self-esteem. From a phenomenological perspective, an individual can have a well defined self concept, yet it may not be consistent with the appraisal of significant others. Generally, attempts to validate measures of selfesteem by correlating them with the ratings of peers, teachers, or family members have yielded moderate to low correlations. However, an attempt was made with the present data set to provide some evidence for scale validity by correlating children's CSCS scores with parent ratings.
As part of the larger study, parents were asked to rate their children on a number of personality and behavioural characteristics. Short descriptions were read to parents, who responded by indicating the extent to which their child was like each description. Each
response was rated on a three point scale (1 = not at all like, 2 = somewhat like, 3 = very much like). From the larger list, ten characteristics were selected and examined (five positive and five negative) which seemed to have the greatest relevance to the concept of self-esteem. These ten items appear in Table 2, along with their correlations with the CSCS scores.
It can be observed in Table 2 that most of the correlations were low. Furthermore, the pattern of correlations differed with the children's age level. However, many correlations attained statistical significance, and almost all were in the anticipated direction. Generally speaking, it appeared to be the case that children who were rated more positively by their parents on a variety of personality and behavioural traits achieved higher scores on the CSCS. Thus, although the pattern was not entirely clear, some support was obtained for the validity of the scale with the present sample of Australian students.
Table 2 Product-moment correlations between parent ratings of children's characteristics and CSCS scores
Primary Secondary students students
Parent rating scale (n = 195) (n = 207)
I Enthusiastic
2 Usually in a happy mood
3 Responsible, helpful
4 Friendly, confident with people
5 A good student
6 Can't concentrate or pay attention
7 Easily confused
8 Alone too much, goes off by him/ herself
9 Acts young for age, cries; has tantrums
lO Timid, afraid
*p < .05 **p < .01 one-tailed one-tailed
.18** .07
-.03
.00
.06
.31 ***
-.27***
-.18**
.00
-.14*
-.06
.22***
.21***
.16*
.15*
-.09
-.06
-.19**
-.19** -.13*
***p < .001 one-tailed
Factor Structure
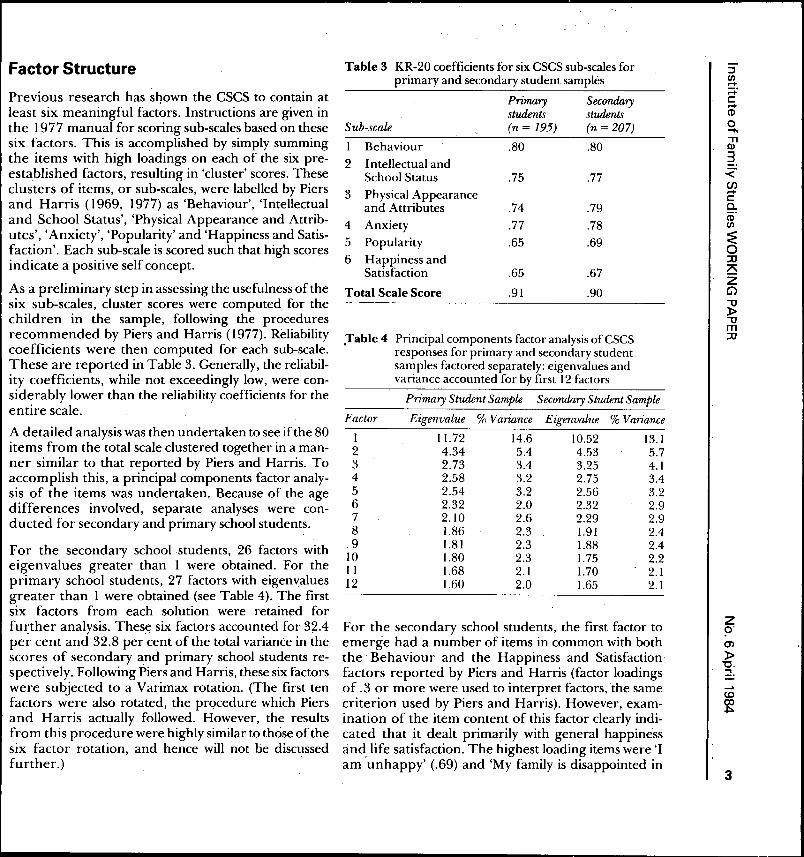
Previous research has shown the CSCS to contain at least six meaningful factors. Instructions are given in the 1977 manual for scoring sub-scales based on these six factors. This is accomplished by simply summing the items with high loadings on each of the six preestablished factors, resulting in 'cluster' scores. These clusters of items, or sub-scales, were labelled by Piers and Harris (1969, 1977) as 'Behaviour', 'Intellectual and School Status', 'Physical Appearance and Attributes', 'Anxiety', 'Popularity' and 'Happiness and Satisfaction'. Each sub-scale is scored such that high scores indicate a positive self concept.
As a preliminary step in assessing the usefulness of the six sub-scales, cluster scores were computed for the children in the sample, following the procedures recommended by Piers and Harris (1977). Reliability coefficients were then computed for each sub-scale. These are reported in Table 3. Generally, the reliability coefficients, while not exceedingly low, were considerably lower than the reliability coefficients for the entire scale.
A detailed analysis was then undertaken to see if the 80 items from the total scale clustered together in a manner similar to that reported by Piers and Harris. To accomplish this, a principal components factor analysis of the items was undertaken. Because of the age differences involved, separate analyses were conducted for secondary and primary school students.
For the secondary school students, 26 factors with eigenvalues greater than 1 were obtained. For the primary school students, 27 factors with eigen~alues greater than 1 were obtained (see Table 4). The first six factors from each solution were retained for fUI:ther analysis. Thes~ six factors accounted for 32.4 per cent and 32.8 per cent of the total variance in the scores of secondary and primary school students respectively. Following Piers and Harris, these six factors were subjected to a Varimax rotation. (The first ten factors were also rotated, the procedure which Piers and Harris actually followed. However, the results from this procedure were highly similar to those of the six factor rotation, and hence will not be discussed further.) .
Table 3 KR-20 coefficients for six CSCS sub-scales for primary and secondary student samples
Primary Secondary students students
Sub-scale (n = 195) (n = 207)
I Behaviour .80 .80 2 Intellectual and
School Status .75 .77 3 Physical Appearance
and Attributes .74 .79 4 Anxiety .77 .78 5 Popularity .65 .69 6 Happiness and
Satisfaction .65 .67
Total Scale Score .91 .90
,Table 4 Principal components factor analysis of CSCS responses for primary and secondary student samples facto red separately: eigenvalues and variance accounted for by first 12 factors
Primary Student Sample Secondary Student Sample
Factor Eigenvalue % Variance Eigenvalue % Variance
I 11.72 14.6 10.52 13.1 2 4.34 5.4 4.53 5.7 3 2.73 3.4 3.25 4.1 4 2.58 3.2 2.75 3.4 5 2.54 3.2 2.56 3.2 6 2.32 2.0 2.32 2.9 7 2.10 2.6 2.29 2.9 8 1.86 2.3 1.91 2.4 9 1.81 2.3 1.88 2.4
10 1.80 2.3 1.75 2.2 II 1.68 2.1 1.70 2.1 12 1.60 2.0 1.65 2.1
For the secondary school students, the first factor to emerge had a number of items in common with both the' Behaviour and the Happiness and Satisfaction factors reported by Piers and Harris (factor loadings of .3 or more were used to interpret factors, the same criterion used by Piers and Harris). However, examination of the item content of this factor clearly indicated that it dealt primarily with general happiness and life satisfaction. The highest loading items were 'I am 'unhappy' (.69) and 'My family is disappointed in
::I VJ .-+ ~.
c:: .-+ CD.
o -"T1 Cl
3 -< en .-+ c:: Cl. CD VJ
~ :::c 2S Z G')
~ -0 m :::c
z 0'
0')
~ "0. :::!.
3
:l (J) ..... ;:;: c:: ..... CD o -"T1 III
3 -< en ..... c:: Cl. CD (J)
:E o :c 2S z G>
~ ""tJ m :c
z o en l> "0 :::!.
4
me' (.63). The second factor to emerge from the secondary student analysis was highly similar to the Behaviour factor of Piers and Harris, and featured high loading items such as 'I often get into trouble' (.70) and 'I do many bad things' (.69). The third factor to emerge was highly similar to the factor labelled by Piers and Harris as Intellectual and School Status, and featured high loading items such as 'I am an important member of my class' (.56) and 'I am clever' (.55).
The fourth factor to emerge from the secondary student analysis overlapped to a certain extent with the Anxiety factor of Piers and Harris, but appeared to have more in common with the Popularity factor. The major; loading items on this factor were 'I am unpopular' (.65) and 'It is hard for me to make friends' (.56). The fifth factor to emerge was strongly related to the Physical Appearance and Attributes factor reported by Piers and Harris, and included items such as 'I am good looking' (.67) and 'I have a pleasant face' (.62). Finally, the sixth factor appeared to correspond to the· Anxiety factor reported by Piers and Harris, and included items such as 'I am often afraid' (.60)·and 'I cry easily' (.55). In summary, each of the factors to emerge from the analysis of secondary students' responses corresponded reasonably well with one of the factors reported by Piers and Harris.
However, the factor structure of the primary students' responses did not appear to correspond as closely with the Piers-Harris factors .. The first factor to emerge from the analysis based on this sample was somewhat similar to the Behaviour factor, and featured high loading items such as 'I get into a lot of fights' (.63) and 'I am well behaved at school' (- .61). The second factor to emerge from this analysis shared items with both the Popularity and the Anxiety factors reported by Piers and Harris. However, the highest loading items, 'I am nervous' (.55) and '1 feel left out' (.53), suggested that the factor reflected anxiety based on social isolation. The third factor to emerge shared a number of items with the Intellectual and School Status factor, such as 'I am smart' (.59) and 'I am good at school work' (.59). However, this factor also involved items such as 'I have lots of energy' (.50) and 'I am strong' (.43), suggesting that this factor was somewhat broader than school abilities and could be considered a 'general abilities' factor.
The fourth factor to emerge from the analysis of primary school students' responses appeared to be similar to the Physical Appearance and Attributes factor of Piers and Harris, and the content of high loading items reflected a concern with appearance, that is, 'I am good looking' (.71) and 'I have a pleasant face' (.69). The fifth factor shared items with a number of PiersHarris factors, and its highest loading items suggested elements of both popularity, 'I have many friends' (- .60), and happiness, 'I am a happy person' (- .66). This pattern of item loadings suggested that 'loneliness' might be an appropriate label for this factor. FinaiJy, the sixth factor 'shared items with both the Intellectual and School Status factor and the Physical Appearance and Attributes factor. However, its highest loading items, such as 'My classmates think I have good ideas' (.57) and 'I am an important member of my class' (.50) suggested that 'school social status' might be the best labetfor this factor.
To summarise the preceeding material, there appeared to be substantial overlap between most of the six factors reported by Piers and Harris (1977) and the first six factors -to emerge from the analysis of Australian secondary students' responses .. However, the correspondence between the six Piers-Harris factors and the first six factors to emerge from the analysis of Australian primary student reponses was considerably weaker. The only factors which appeared to correspond closely in meaning to the factors reported by Piers and Harris were. Factor 1 (Behaviour) and Factor 4 (Physical Appearance and Attributes). The other four primary student factors appeared to have meanings which were in some ways similar to the labels suggested by Piers and Harris, but involved the breaking up and recombining of elements from two or more Piers-Harris factors (for example, Factor 5 which contained elements of both Popularity and Happiness and Satisfaction).
The failure of the present analysis to replicate the six Piers-Harris factors is consistent with some previous American-based research. For example, Michael, Smith and Michael (1975) were only able to replicate three of the Piers-Harris factors. Furthermore, Platten and Williams (1979) found the factorial structure of the CSCS to vary considerably in two separate admistrations of the scale to the same sample of ele-
mentary school children. Both teams of researcher~ suggested caution in interpreting sub-scale scores.
Number of Factors
In addition to the failure to replicate the Piers-Harris factor structure with the sample of primary school students, there appeared to be other good reasons for exercising caution in relation to the use of the six sub-scales. A number of analyses undertaken indicated that the CSCS may contain considerably fewer than six factors.
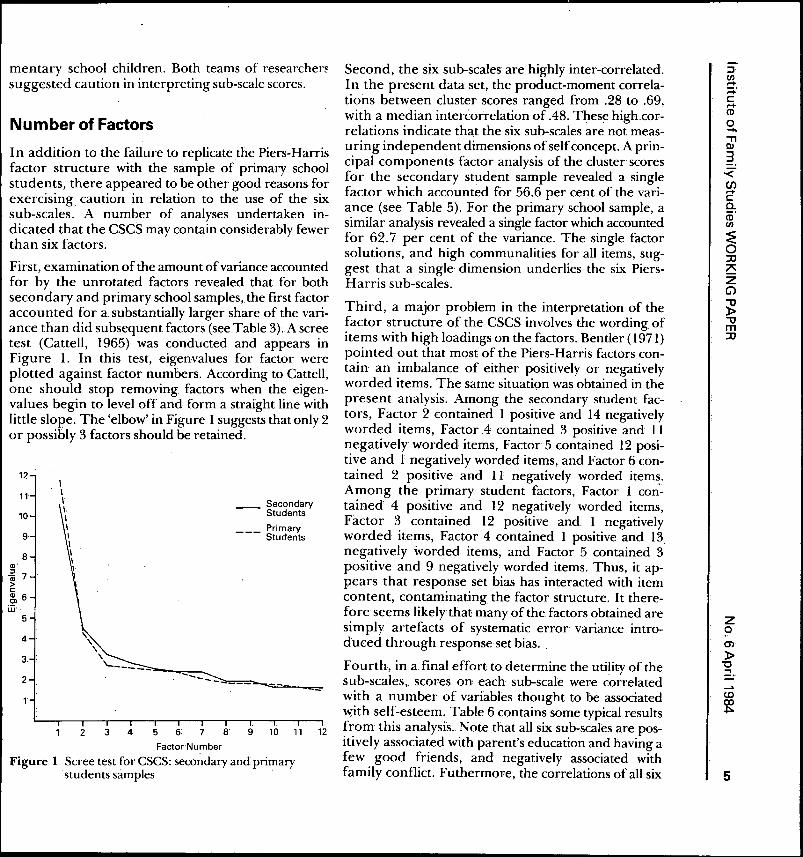
First, examination of the amount of variance accounted for by the unrotated factors revealed that for both secondary and primary school samples, the first factor accounted for a substantially larger share of the variance than did subsequent factors (see Table 3). A scree test (Cattell, 1965) was conducted and appears in Figure 1. In this test, eigenvalues for factor were plotted against factor numbers. According to Cattell, one shoul? stop removing factors when the eigen~alues begm to level off and form a straight line with httle sl~pe. The 'elbow' in Figure 1 suggests that only 2 or possIbly 3 factors should be retained.
12 \
11 \ \
10 \. \ \
9 I \
8 I I
Cl' \ ~ 7 > c ~6
W· 5
4-
3
2
1
" ,
2
, ,
__ Secondary Students
___ Primary Students
'----- --.~-~----------.~=---=---3 4 5 6 7 8 10 11 12
Factor Number
Figure 1 Scree test for CSCS: seco~dary and primary students samples .
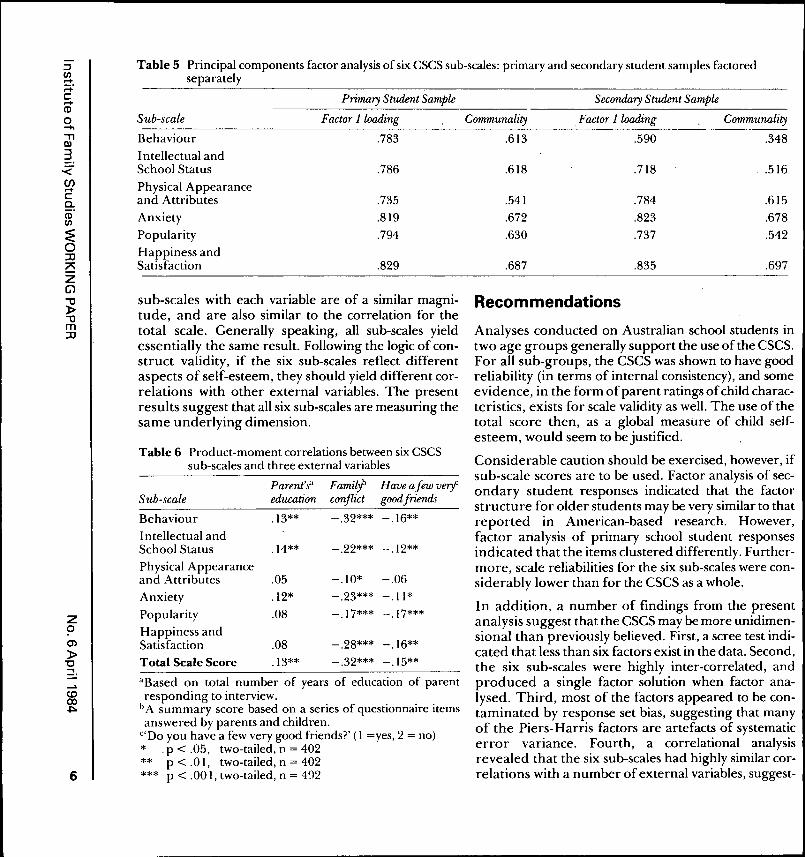
Second, the six sub-scales are highly inter-correlated. In the present data set, the product-moment correlations between cluster scores ranged from .28 to .69, with a median intercorrelation of .48. These high correlations indicate that the six sub-scales are not measu.ring independent dimensions of self concept. A prinCIpal components factor analysis of the cluster scores for the s~condary student sample revealed a single factor which accounted for 56.6 per cent of the varia.nc~ (see Ta?le 5). For the primary school sample, a SimIlar analysIs revealed a single factor which accounted for 6.2.7 per cent of the variance. The single factor solutIOns, and high communalities for all items, suggest that a single dimension underlies the six PiersHarris sub-scales.
Third, a major problem in the interpretation of the ~actor structure of the CSCS involves the wording of Ite~ns with high loadings on the factors. Bender (1971) pomted out that most of the Piers-Harris factors contain an ~mbalance of either positively or negatively worded Items. The same situation was obtained in the present analysis. Among the secondary student factors, Fac~or 2 contained 1 positive and 14 negatively word:d Items, Factor 4 contained 3 positive and 11 ~egatIvely word~d items, Fac~or 5 contained 12 positive and 1 negatively worded Items, and Factor 6 contained 2 positive and 11 negatively worded items. Among the primary student factors, Factor 1 contained 4 positiv.e and 12 negati\'ely worded items, Factor ~ contamed 12 positive and 1 negatively word:d Ite~ns, Factor 4 contained 1 positive and 13 negatively worded items, and Factor 5 contained 3 positive and 9 negatively worded items. Thus, it appears that response set bias has interacted with item content, contaminating the factor structure. It therefore seems likely that many of the factors obtained are simply artefacts of systematic error variance introduced through response set bias ..
Fourth, in a final effort to determine the utility of the sub-scales" scores on each sub-scale were correlated w~th a number of variables thought to be associated With sel~-esteem: Table 6 contains some typical results ~~om thiS ar;talysls .. Note that all six sub-scales are posItively assoCla~ed With parent's education and having a few. good ~nends, and negatively associated with famdy conflICt. Futhermore, the correlations of all six
:l CIl .-+ ;:;: c:: .-+ CD o -" Q)
3 -< en .-+ c:: a. CD CIl
~ ::0 ~ Z G>
~ " m ::0
z o en » "0 ::::!.
5
::J C/I .-+ ;:i: c: .-+ Cl)
o -"T1 III
3 -< en ..... c: c. Cl) C/I
~ o :0 2S z Cl
~ ""0 m :0
z o en » "tJ ~.
..... co 00 ~
6
Table 5 Principal components factor analysis of six CSCS sub-scales: primary and secondary student samples factored separately
Primary Student Sample
Sub-scale Factor 1 loading
Behaviour .783
Intellectual and School Status .786
Physical Appearance and Attributes .735 Anxiety .819
Popularity .794
Happiness and Satisfaction .829
sub-scales with each variable are of a similar magnitude, and are also similar to the correlation for the total scale. Generally speaking, all sub-scales yield essentially the same result. Following the logic of construct validity, if the six sub-scales reflect different aspects of self-esteem, they should yield different correlations with other external variables. The present results suggest that all six sub-scales are measuring the same underlying dimension.
Table 6 Product-moment correlations between six CSCS sub-scales and three external variables
Parent'S" Familyh Have a few very Sub-scale education conflict good friends
Behaviour .13** -.32*** -.16**
Intellectual and School Status .14** -.22*** -.12**
Physical Appearance and Attributes .05 -.10* -.06
Anxiety .12* -.23*** -.11*
Popularity .08 -.17*** -.17***
Happiness and Satisfaction .08 -.28*** -.16**
Total Scale Score .13** -.32*** -.15**
aBased on total number of years of education of parent responding to interview.
b A summary score based on a series of questionnaire items answered by parents and children.
C'Do you have a few very good friends?' (1 =yes, 2 = no) * . p < .05, two-tailed, n = 402 ** P < .01, two-tailed, n = 402 *** P < .001, two-tailed, n = 4')2
Secondary Student Sample
Communality Factor 1 loading Communality
.613 .590 .348
.618 .718 .516
.541 .784 .615
.672 .823 .678
.630 .737 .542
.687 .835 .697
Recommendations
Analyses conducted on Australian school students in two age groups generally support the use of the CSCS. For all sub-groups, the CSCS was shown to have good reliability (in terms of internal consistency), and some evidence, in the form of parent ratings of child characteristics, exists for scale validity as well. The use of the total score then, as a global measure of child selfesteem, would seem to be justified.
Considerable caution should be exercised, however, if sub-scale scores are to be used. Factor analysis of secondary student responses indicated that the factor structure for older students may be very similar to that reported in American-based research. However, factor analysis of primary school student responses indicated that the items clustered differently. Furthermore, scale reliabilities for the six sub-scales were considerably lower than for the CSCS as a whole.
In addition, a number of findings from the present analysis suggest that the CSCS may be more unidimensional than previously believed. First, a scree test indicated that less than six factors exist in the data. Second, the six sub-scales were highly inter-correlated, and produced a single factor solution when factor analysed. Third, most of the factors appeared to be contaminated by response set bias, suggesting that many of the Piers-Harris factors are artefacts of systematic error variance. Fourth, a correlational analysis revealed that the six sub-scales had highly similar correlations with a number of external variables, suggest-
ing that all six are measures of the same underlying construct.
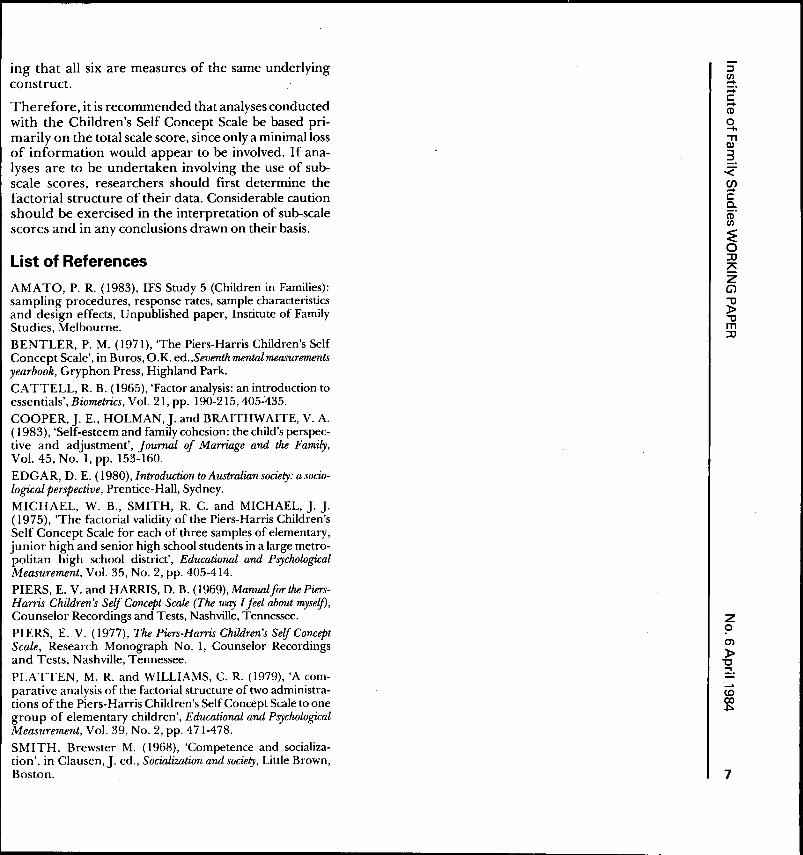
Therefore, it is recommended that analyses conducted with the Children's Self Concept Scale be based primarily on the total scale score, since only a minimal loss of information would appear to be involved. If analyses are to be undertaken involving the use of subscale scores, researchers should first determine the factorial structure of their data. Considerable caution should be exercised in the interpretation of sub-scale scores and in any conclusions drawn on their basis.
List of References
AMATO, P. R. (1983), IFS Study 5 (Children in Families): sampling procedures, response rates, sample characteristics and design effects, Unpublished paper, Institute of Family Studies, Melbourne. BENTLER, P. M. (1971), 'The Piers-Harris Children's Self Concept Scale', in Buros, O.K. ed.,Seventhmentalmeasurements yearbook, Gryphon Press, Highland Park.
CATTELL, R. B. (1965), 'Factor analysis: an introduction to essentials', Biometrics, Vol. 21, pp. 190-215, 405~435.
COOPER,]. E., HOLMAN,]. and BRAITHWAITE, V. A. ( 1983), 'Self-esteem and family cohesion: the child's perspective and adjustment', Journal of Marriage and the Family, Vol. 45, No. 1, pp. 153-160.
EDGAR, D. E. (1980), Introduction to Australwn society: a sociological perspective, Prentice-Hall, Sydney.
MICHAEL, W. B., SMITH, R. C. and MICHAEL, ]. ]. ( 1975), 'The factorial validity of the Piers-Harris Children's Self Concept Scale for each of three samples of elementary, junior high and senior high school students in a large metropolitan high school district', Educational and Psychological Measurement, Vol. 35, No. 2, pp. 405-414.
PIERS, E. V. and HARRIS, D. B. (l969),ManualforthePiersHams Children's Self Concept Scale (The way I feel about myself), Counselor Recordings and Tests, Nashville, Tennessee.
PIERS, E. V. (1977), The Piers-Hams Children's Self Concept Scale, Research Monograph No. 1, Counselor Recordings and Tests, Nashville, Tennessee.
PLA TTEN, M. R. and WILLIAMS, C. R. (1979), 'A comparative analysis of the factorial structure of two administrations of the Piers-Harris Children's Self Concept Scale to one group of elementary children', Educational and Psychological Measurement, Vol. 39, No. 2, pp. 471-478.
SMITH, Brewster M. (1968), 'Competence and socialization', in Clausen,]. ed., Socwlization and society, Little Brown, Boston.
::J CJ) .... ;:;: c: .... CD o -.,
er 3 -< Cl) .... c: a. (D' en ~ o ::0 2S z G)
~ ""C m ::0
z o 0)
l> "C ~.
7
Functions of the Institute The functions of the Institute as defined by the Family Law Act 1975, are: • to promote, by the conduct, encouragement and co-ordination of research and other appropriate means, the identification of, and development of understanding of, the factors affecting marital and family stability in Australia, with the object of promoting the protection of the family as the natural and fundamental group unit in society; and • to advise and assist the Attorney-General in relation to the making of grants, out of moneys available under appropriations made by the Parliament, for purposes related to the functions of the Institute and the supervising of the employment of grants so made.
The Institute's activities centre around meeting the following needs: • research on social and economic factors affecting the well-being of families of different types in Australian society; • development of an objective understanding of what is happening to the family in Australia, including identification of the strengths, as well as problems, of Australian families; • dissemination of information about families and family structures to all those whose work directly affects the lives of families; • monitoring and reporting on the impact of government policies and administrative practices on families of various types in Australia; and • evaluation of the effects of marriage counselling, pre-marital education and other services, including those areas of the law aimed at assisting families.
Thus the objects of the Institute are essentially practical ones, concerned primarily with learning about real situations through research on Australian families.
Funding of research The Institute is able to carry out and support research through its research operations budget. These funds are used to conduct research, to co-ordinate the Institute's work with others and to encourage and support worthwhile outside research. In
the case of its own research, the Institute will determine the allocation of funding according to its priorities and will design the research outline, supervise the research and arrange publication of reports. Support of outside research is effected through the Support Grants Scheme. The Institute invites applications and selects those most deserving support. The Institute does not closely supervise the research in this case but requires that a report for publication is submitted.
Family Information Centre In association with the research functions of the Institute, the Family Information Centre was set up to provide the means of publishing and disseminating information about past, current and projected research on the family in Australia. The Family Information Centre's collection is available for use by research scholars, teachers and other professionals who require such information in their dealings with people.
The Family Information Centre collection contains books, reports, government documents, pamphlets, journals, and newspaper clippings. Special subject files have been developed on selected topics and a network file is maintained of relevant organisations and persons working in various professional fields concerned with the interactive processes of personal relationships.
Publications A Newsletter is issued from time to time with information on the progress of research, reports on Institute activities, book reviews and notes on conferences and meetings of interest to professionals in the field. Discussion Papers, Working Papers, Family Information Bulletins and Selected Reading Lists are produced and major Reports on research projects are published. A list of publications is available on request from the Editor.
Institute of Family Studies 766 Elizabeth Street Melbourne 3000 Victoria
Telephone (03) 342 9100