Embed Size (px)
Citation preview

April 10 & 12, 2012 Conference Call
Summary Approach & Ideas to Creating Reports
Presented by: Katherine S. Rowell, MS, MHA
Workshop Recap

Case Studies Focused on:
Identifying Outcomes for QI Project
and
Connecting Your Data to Best Practices and Risk-Adjustment Models


Also a “High Fly-By” of
Data VisualizationTables, Graphs & Dashboards

Post-Workshop Survey Results
What questions do you have that may not have been fully addressed
at the workshop?

How to get monthly updates without spending hours downloading different reports.
I am still confused as to which report shows what and what report to run.
I would like more time learning how to turn data into graphs.
The technical “how to” make a graph.

Please describe your biggest challenge with the online reports.

The time it takes to manipulate/summarize the information to present meaningful information to stakeholders.
The canned reports on their own typically aren’t enough.
Knowing where to go to get the right report.
System is slow.
There are so many, I feel I am at the tip of the iceberg.

How well do you understand the different options for generating online reports?
How comfortable are you deciphering the online reports & explaining them to others?

OTHER SCARY STUFF?

NOT on Today’s Agenda

Report system performance.
Data visualization.

Today’s Agenda

Understanding your report users.
How to talk to your analyst:Ad-hoc report request tips & techniques.
Understanding the online report user interfaces.

It is just data entered and stored.
Just like online merchandisers,YOU KNOW THE DATA!


UNDERSTANDING YOUR REPORT USERS.
Handout pages 1 & 2:
Scope, Role, Time, Customization, Detail Level, Point of View

IDENTIFY THE THEME.
Handout pages 3:
…based on the essence of the problem or task the users are
responsible for.
IDENTIFYING THE RIGHT INFORMATION.
Handout page 3:
…which will allow users to make informed decisions and drive them
to action.

ASK BETTER QUESTIONS
Handout page 3:
There are two questions NOT one.
Question 1 – What would you like to know?
Must be followed by:
Question 2 – What would you do if you knew
this information?
DISCRIMINATE
Handout page 3:
Relevant, important and useful information versus “nice to know.”

Questions
Comments
Experiences to Share

Ad-hoc Report Request


AD-HOC SUMMARY CHECKLIST:
What is the question you are hoping to answer, the decision you need to inform? Write a summary statement that answers this question.
Describe the report users.
All cases? Only 30-day follow-up? Inpatient v. Outpatient? Date range(s)?
Subspecialty or Procedure Specific?
Patient Factors.
Outcomes of Interest?

Report Users
Who? What?
Example: We are going to be sharing this information with our
surgeons for the purpose of understanding the referral/transfer patterns of hospitals sending patient to
our facility for emergency surgery.

Time? Comparison?
The core of data analysis is “compared with what?”
Example:We would like the report to show the data compared at two points in time—all cases that meet criteria, which
had a date of surgery in calendar year 2010 compared to all cases with the same criteria and dates of surgery in
calendar year 2011.

Example: Include inpatients cases only, and include all post operative
occurrences regardless of when they were noted, i.e. prior v. post discharge.

Subspecialty or Procedure Specific?
Example:We wish to compare vascular procedures that are performed by
general surgeons to those performed by vascular surgeons to determine if there is any difference in outcomes.
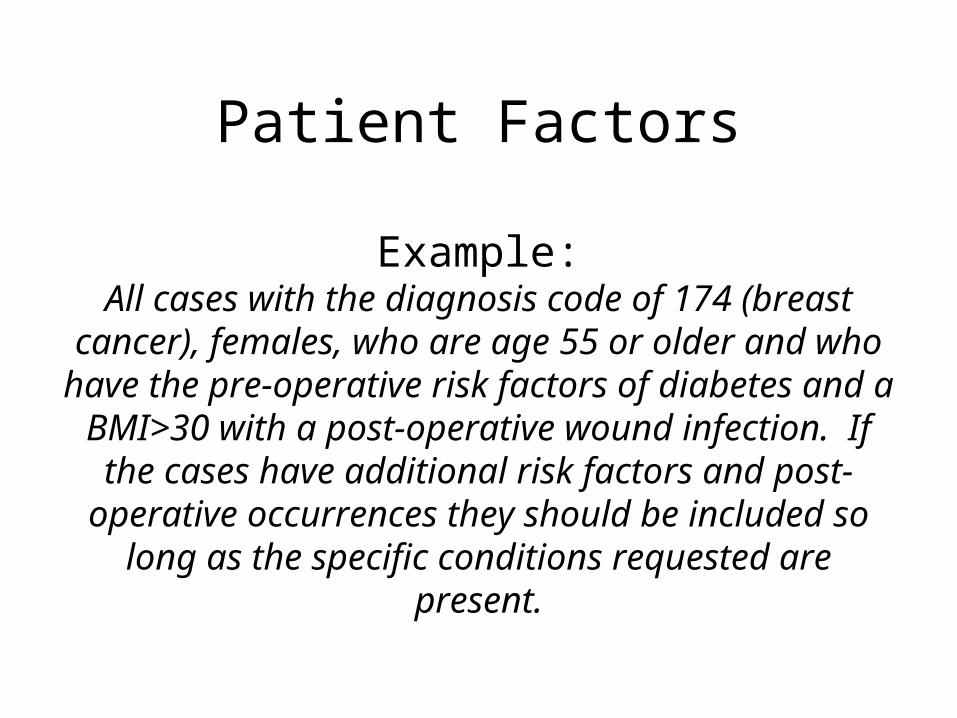
Patient Factors
Example:All cases with the diagnosis code of 174 (breast cancer), females, who are age 55 or older and who have the pre-operative risk factors of diabetes and a BMI>30 with a
post-operative wound infection. If the cases have additional risk factors and post-operative occurrences
they should be included so long as the specific conditions requested are present.

TIP: Use your data collection sheet or manual to help you to think about the variables of interest and your inclusion/exclusion criteria. Think of it as your checklist or guide.
TIP: Anything else that you think will help the analyst to understand what you are hoping to
learn from an ad-hoc report. MORE CLARIFYING INFORMATION IS BETTER!
TIP: Pass your request by Angela or someone with more experience to see if they understand
your request or if they have ideas about other clarifying information you can include.

Online Reports


Jot down specific questions as you are requesting/running reports and ask your peers for advice and pointers.
Share examples of your ad-hoc report requests and reports (as you can).


Next Call.