Embed Size (px)
Citation preview
April 1, 2010 1
Back to Basics, 2010POPULATION HEALTH (3A): Health Care Organization and
Vital Stats
N Birkett, MDEpidemiology & Community Medicine
Based on slides prepared by Dr. R. Spasoff

April 1, 2010 2
THE PLAN(2)
• First class– mainly lectures
• Other classes– About 2 hours of lectures– Review MCQs for 60 minutes
• A 10 minute break about half-way through• You can interrupt for questions, etc. if
things aren’t clear.
April 1, 2010 3
THE PLAN (5)
• Session 3 (April 1)– Organization of Health Care Delivery in
Canada– Elements of Health Economics– Vital Statistics– Overview of Communicable Disease control,
epidemics, etc.

April 1, 2010 4
COMMUNICATIONS!!!
C2LEO
April 1, 2010 5
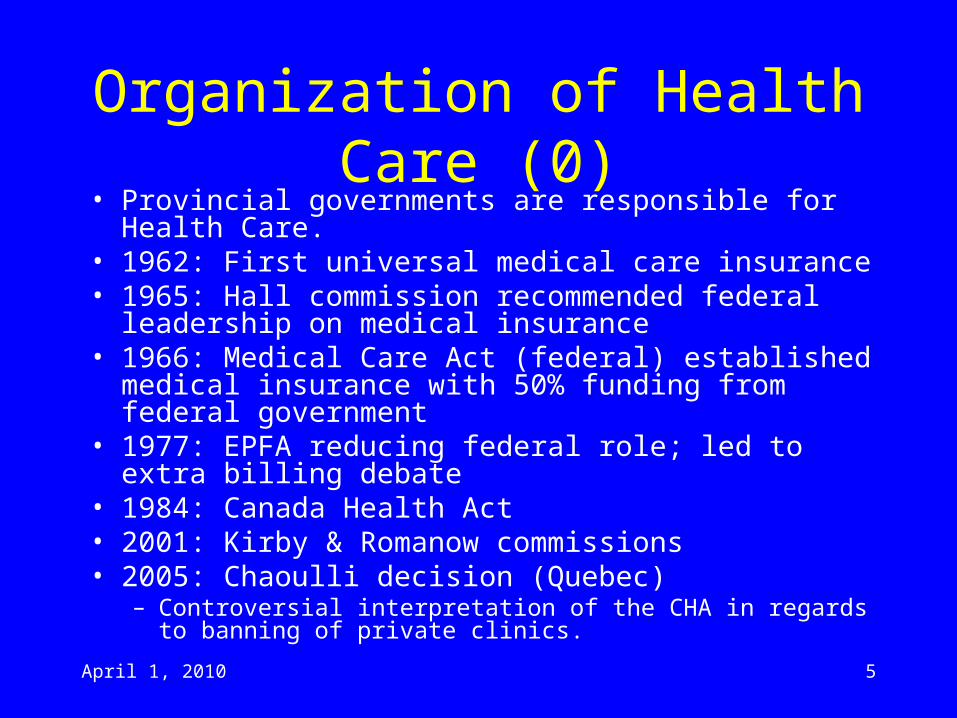
Organization of Health Care (0)• Provincial governments are responsible for Health Care.• 1962: First universal medical care insurance• 1965: Hall commission recommended federal leadership
on medical insurance• 1966: Medical Care Act (federal) established medical
insurance with 50% funding from federal government• 1977: EPFA reducing federal role; led to extra billing
debate• 1984: Canada Health Act• 2001: Kirby & Romanow commissions• 2005: Chaoulli decision (Quebec)
– Controversial interpretation of the CHA in regards to banning of private clinics.
April 1, 2010 6
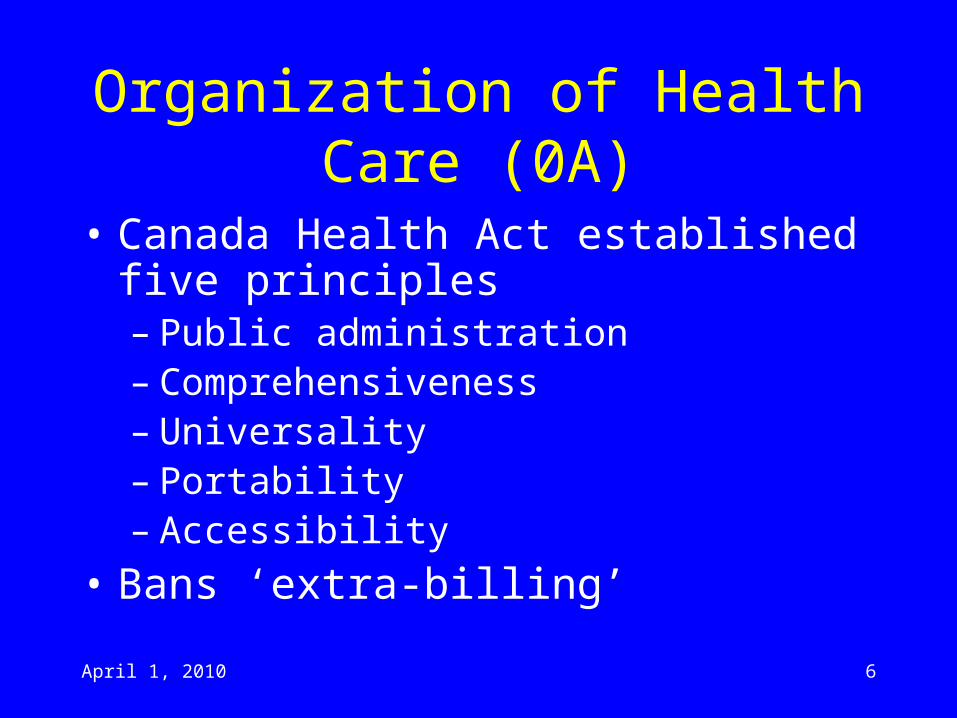
Organization of Health Care (0A)
• Canada Health Act established five principles– Public administration– Comprehensiveness– Universality– Portability– Accessibility
• Bans ‘extra-billing’
April 1, 2010 7
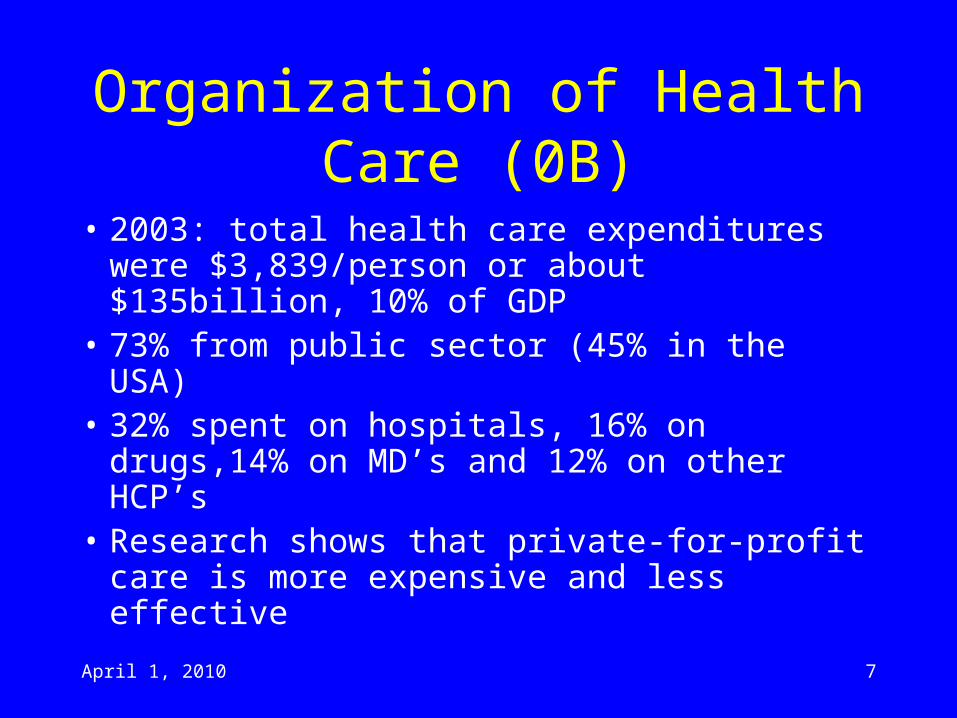
Organization of Health Care (0B)
• 2003: total health care expenditures were $3,839/person or about $135billion, 10% of GDP
• 73% from public sector (45% in the USA)• 32% spent on hospitals, 16% on drugs,14%
on MD’s and 12% on other HCP’s• Research shows that private-for-profit care
is more expensive and less effective
April 1, 2010 8
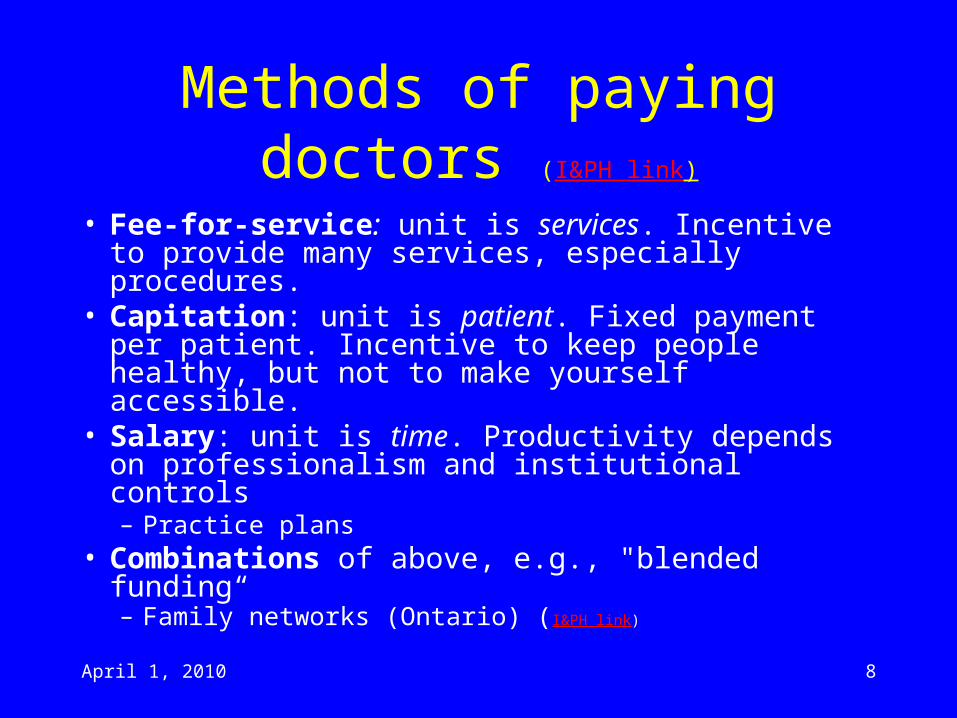
Methods of paying doctors (I&PH link)
• Fee-for-service: unit is services. Incentive to provide many services, especially procedures.
• Capitation: unit is patient. Fixed payment per patient. Incentive to keep people healthy, but not to make yourself accessible.
• Salary: unit is time. Productivity depends on professionalism and institutional controls– Practice plans
• Combinations of above, e.g., "blended funding“– Family networks (Ontario) (I&PH link)
April 1, 2010 9
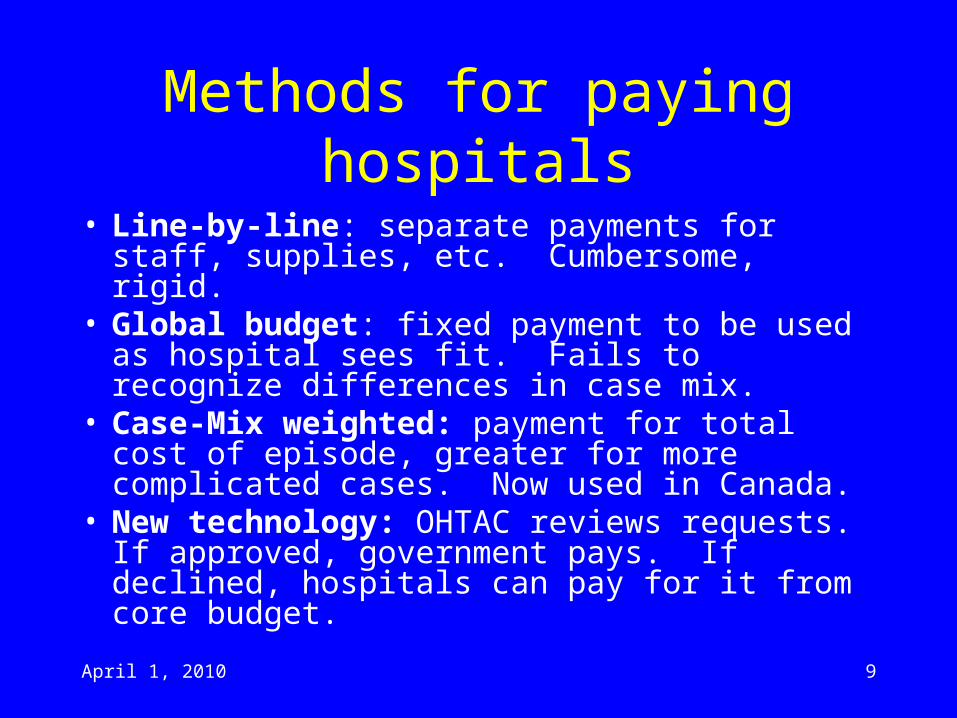
Methods for paying hospitals
• Line-by-line: separate payments for staff, supplies, etc. Cumbersome, rigid.
• Global budget: fixed payment to be used as hospital sees fit. Fails to recognize differences in case mix.
• Case-Mix weighted: payment for total cost of episode, greater for more complicated cases. Now used in Canada.
• New technology: OHTAC reviews requests. If approved, government pays. If declined, hospitals can pay for it from core budget.
April 1, 2010 10
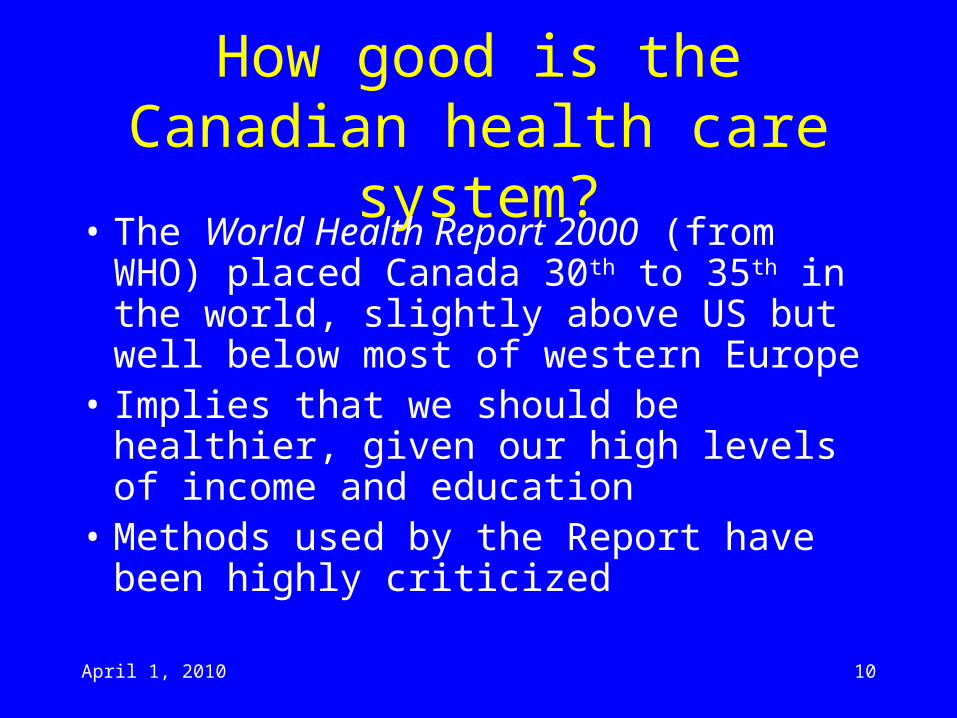
How good is the Canadian health care system?
• The World Health Report 2000 (from WHO) placed Canada 30th to 35th in the world, slightly above US but well below most of western Europe
• Implies that we should be healthier, given our high levels of income and education
• Methods used by the Report have been highly criticized
April 1, 2010 11
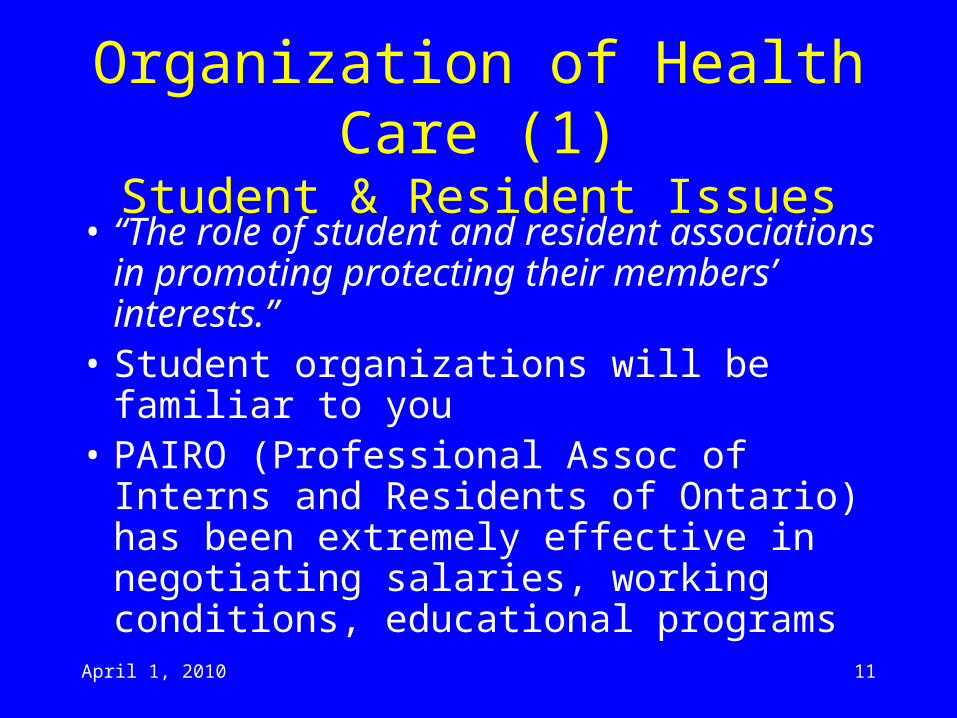
Organization of Health Care (1)Student & Resident Issues
• “The role of student and resident associations in promoting protecting their members’ interests.”
• Student organizations will be familiar to you
• PAIRO (Professional Assoc of Interns and Residents of Ontario) has been extremely effective in negotiating salaries, working conditions, educational programs
April 1, 2010 12
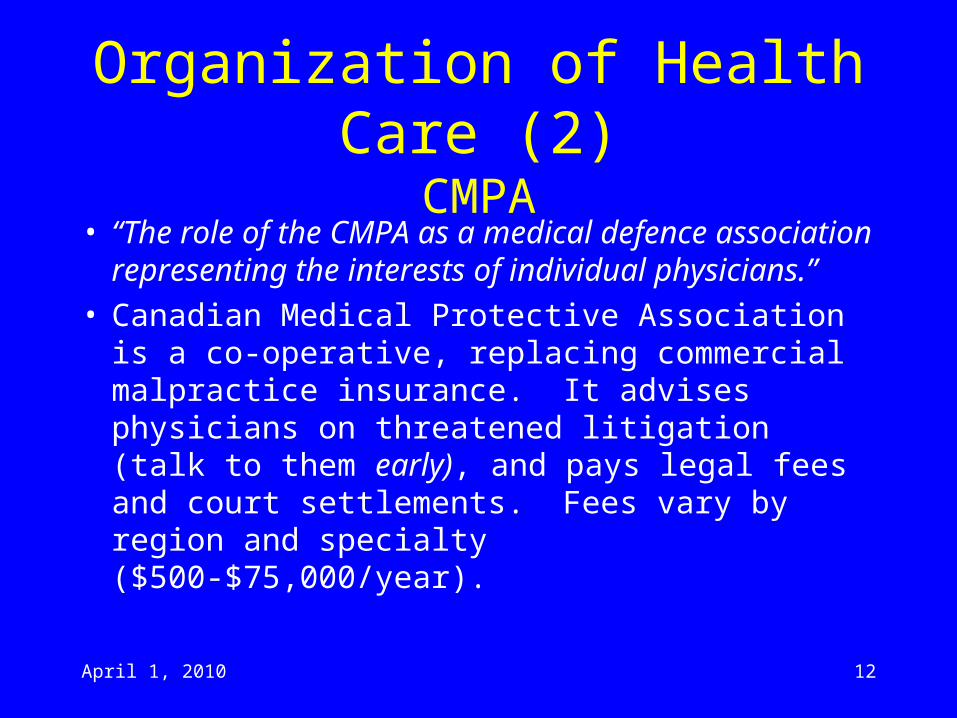
Organization of Health Care (2)CMPA
• “The role of the CMPA as a medical defence association representing the interests of individual physicians.”
• Canadian Medical Protective Association is a co-operative, replacing commercial malpractice insurance. It advises physicians on threatened litigation (talk to them early), and pays legal fees and court settlements. Fees vary by region and specialty ($500-$75,000/year).
April 1, 2010 13
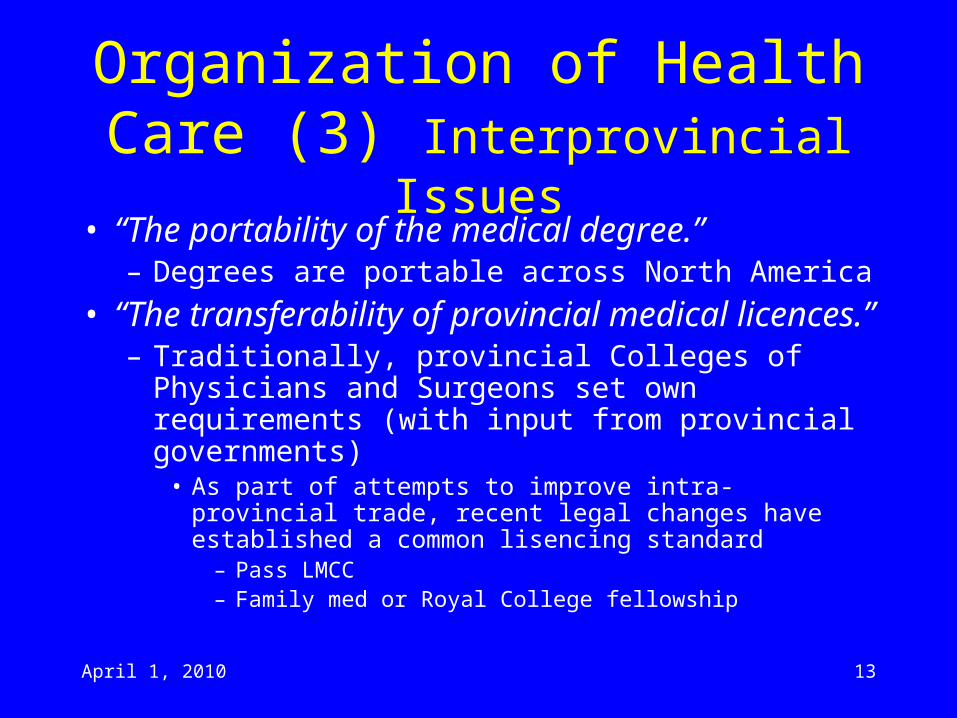
Organization of Health Care (3) Interprovincial Issues
• “The portability of the medical degree.”– Degrees are portable across North America
• “The transferability of provincial medical licences.”– Traditionally, provincial Colleges of Physicians and
Surgeons set own requirements (with input from provincial governments)
• As part of attempts to improve intra-provincial trade, recent legal changes have established a common lisencing standard
– Pass LMCC– Family med or Royal College fellowship
April 1, 2010 14
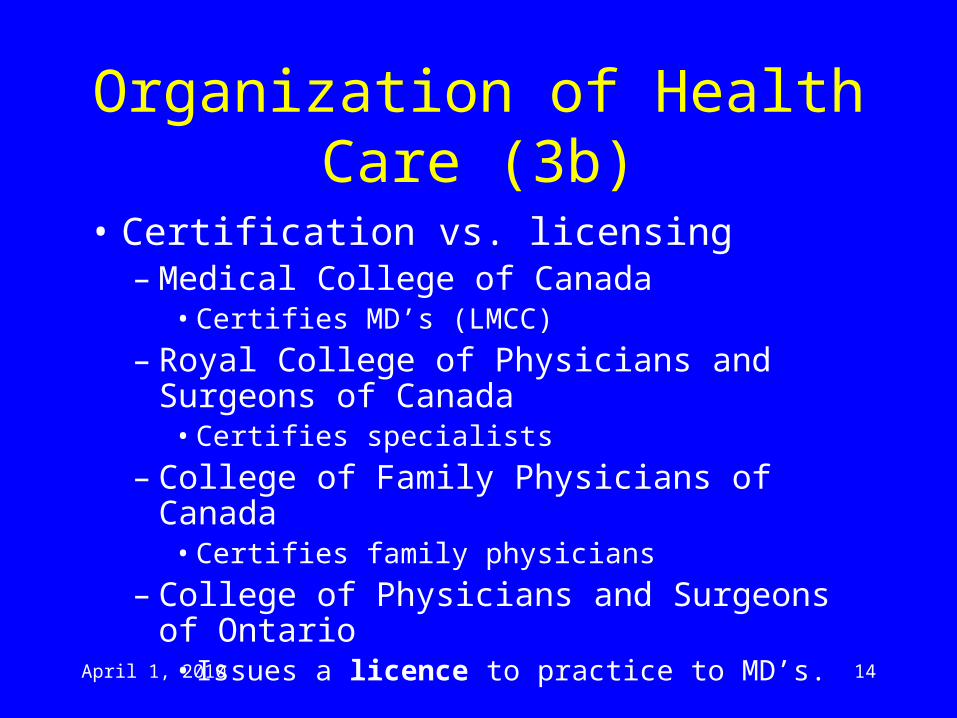
Organization of Health Care (3b)
• Certification vs. licensing– Medical College of Canada
• Certifies MD’s (LMCC)
– Royal College of Physicians and Surgeons of Canada
• Certifies specialists
– College of Family Physicians of Canada• Certifies family physicians
– College of Physicians and Surgeons of Ontario• Issues a licence to practice to MD’s.
April 1, 2010 15
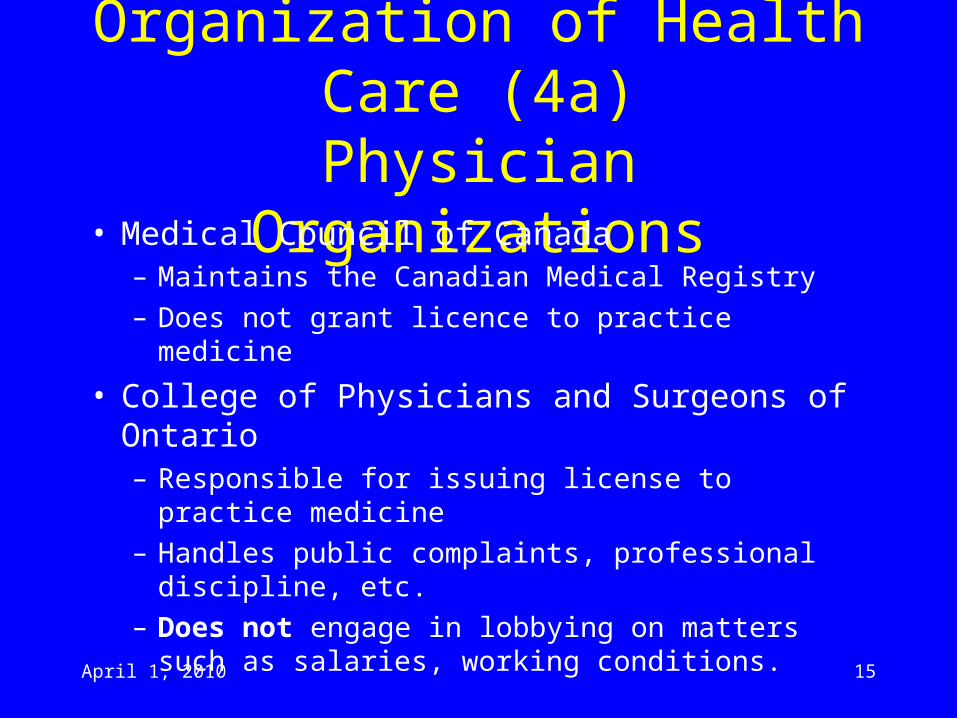
Organization of Health Care (4a)Physician Organizations
• Medical Council of Canada– Maintains the Canadian Medical Registry
– Does not grant licence to practice medicine
• College of Physicians and Surgeons of Ontario– Responsible for issuing license to practice medicine
– Handles public complaints, professional discipline, etc.
– Does not engage in lobbying on matters such as salaries, working conditions.
April 1, 2010 16
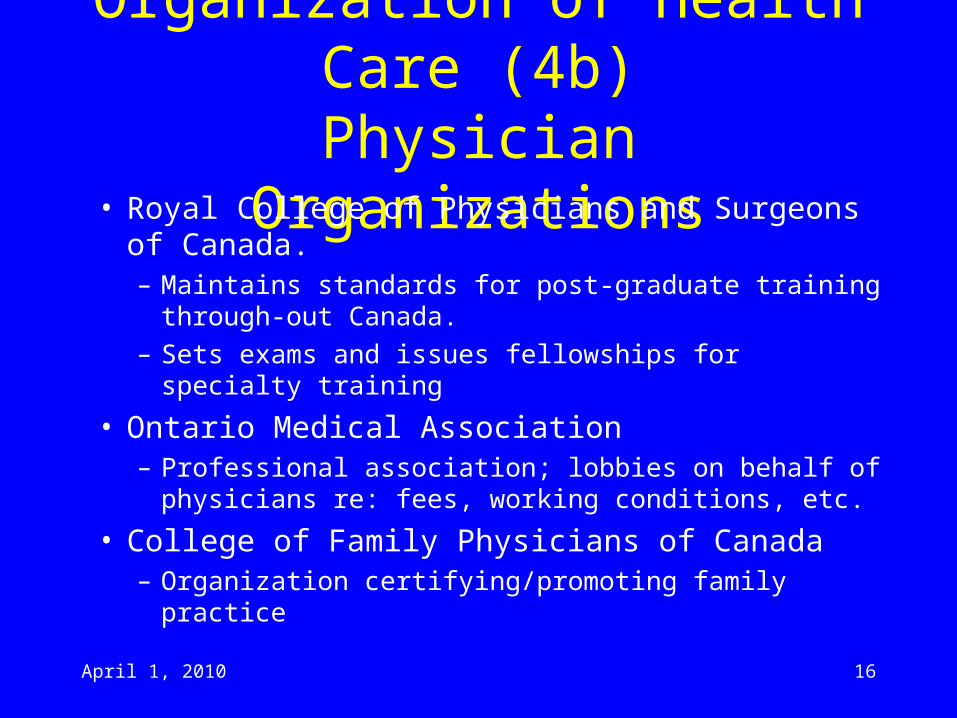
Organization of Health Care (4b)Physician Organizations
• Royal College of Physicians and Surgeons of Canada.– Maintains standards for post-graduate training through-
out Canada.
– Sets exams and issues fellowships for specialty training
• Ontario Medical Association– Professional association; lobbies on behalf of
physicians re: fees, working conditions, etc.
• College of Family Physicians of Canada– Organization certifying/promoting family practice
April 1, 2010 17
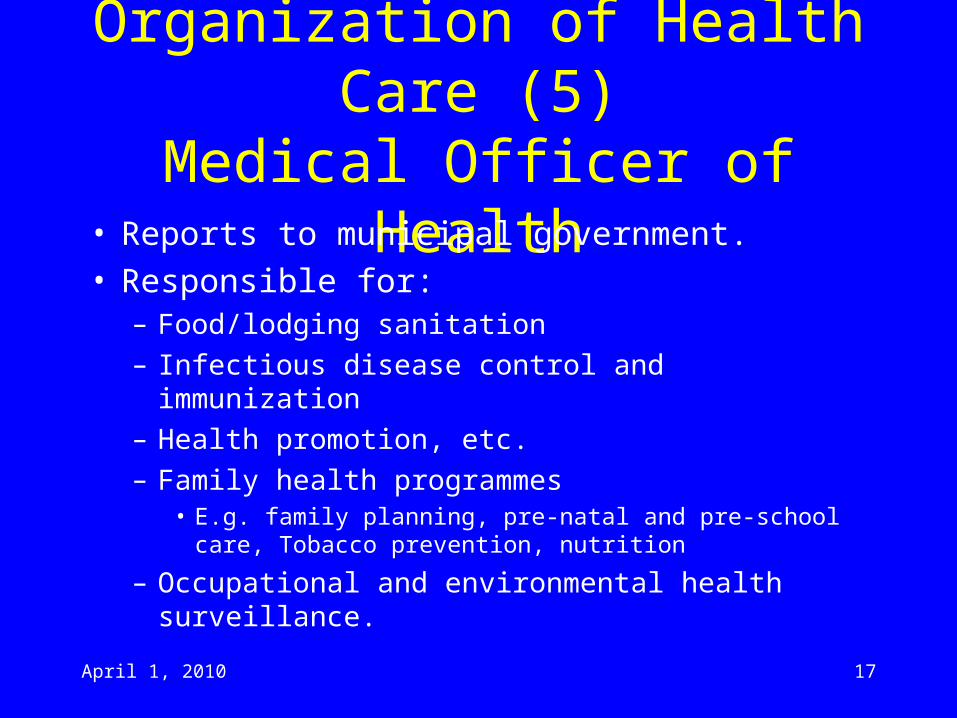
Organization of Health Care (5)Medical Officer of Health
• Reports to municipal government.• Responsible for:
– Food/lodging sanitation
– Infectious disease control and immunization
– Health promotion, etc.
– Family health programmes• E.g. family planning, pre-natal and pre-school care, Tobacco
prevention, nutrition
– Occupational and environmental health surveillance.
April 1, 2010 18
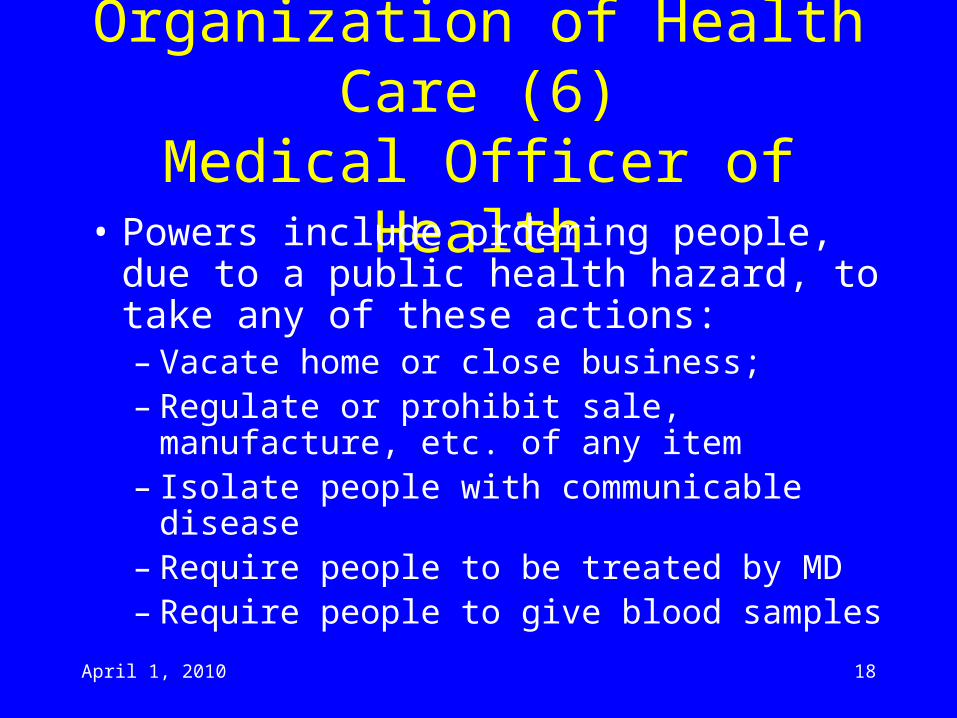
Organization of Health Care (6)Medical Officer of Health
• Powers include ordering people, due to a public health hazard, to take any of these actions:– Vacate home or close business;– Regulate or prohibit sale, manufacture, etc. of
any item– Isolate people with communicable disease– Require people to be treated by MD– Require people to give blood samples
April 1, 2010 19
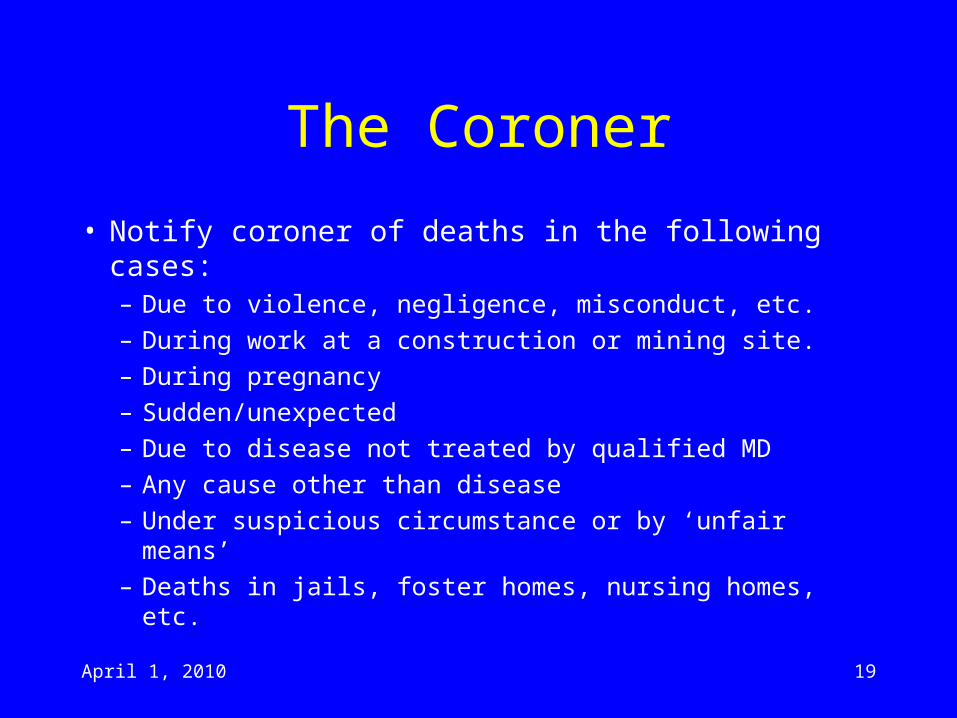
The Coroner
• Notify coroner of deaths in the following cases:– Due to violence, negligence, misconduct, etc.
– During work at a construction or mining site.
– During pregnancy
– Sudden/unexpected
– Due to disease not treated by qualified MD
– Any cause other than disease
– Under suspicious circumstance or by ‘unfair means’
– Deaths in jails, foster homes, nursing homes, etc.
April 1, 2010 20
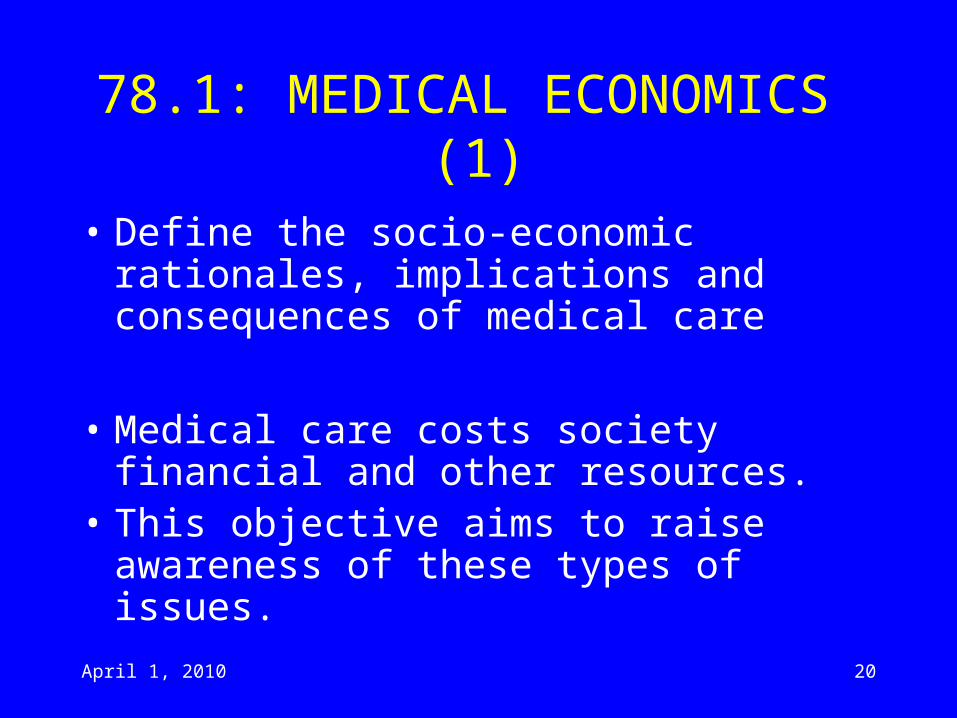
78.1: MEDICAL ECONOMICS (1)
• Define the socio-economic rationales, implications and consequences of medical care
• Medical care costs society financial and other resources.
• This objective aims to raise awareness of these types of issues.
April 1, 2010 21
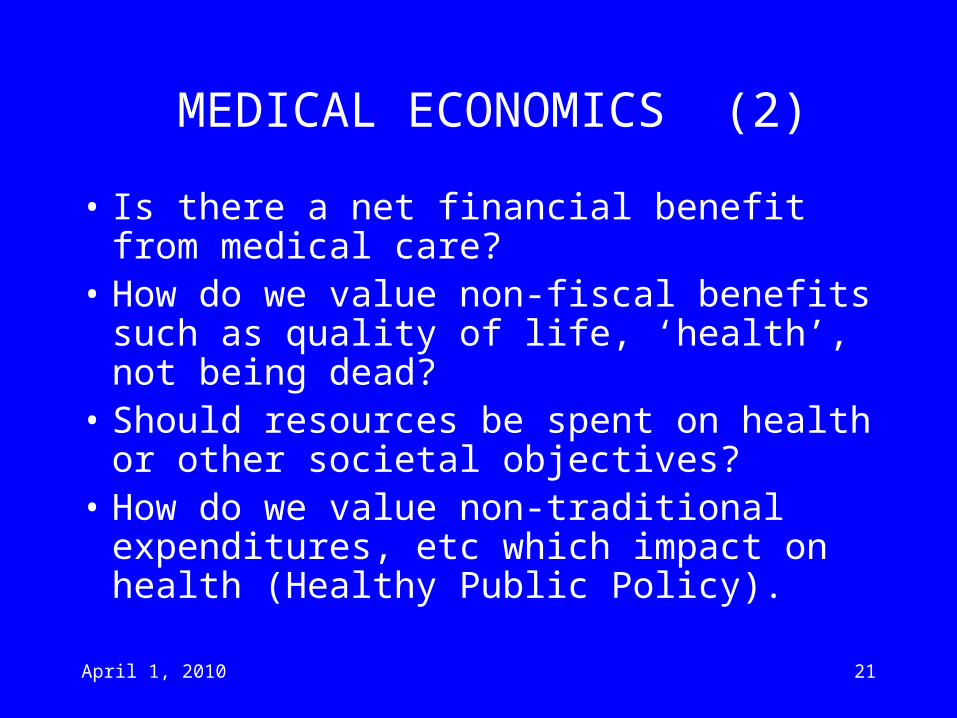
MEDICAL ECONOMICS (2)
• Is there a net financial benefit from medical care?
• How do we value non-fiscal benefits such as quality of life, ‘health’, not being dead?
• Should resources be spent on health or other societal objectives?
• How do we value non-traditional expenditures, etc which impact on health (Healthy Public Policy).
April 1, 2010 22
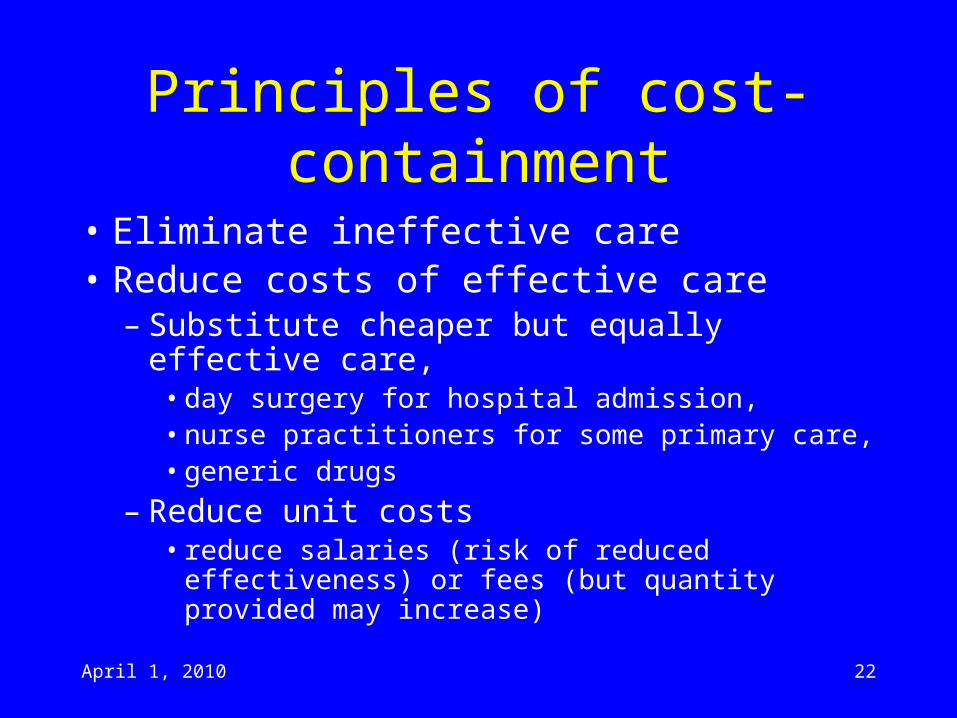
Principles of cost-containment
• Eliminate ineffective care• Reduce costs of effective care
– Substitute cheaper but equally effective care,• day surgery for hospital admission, • nurse practitioners for some primary care, • generic drugs
– Reduce unit costs• reduce salaries (risk of reduced effectiveness) or
fees (but quantity provided may increase)
April 1, 2010 23
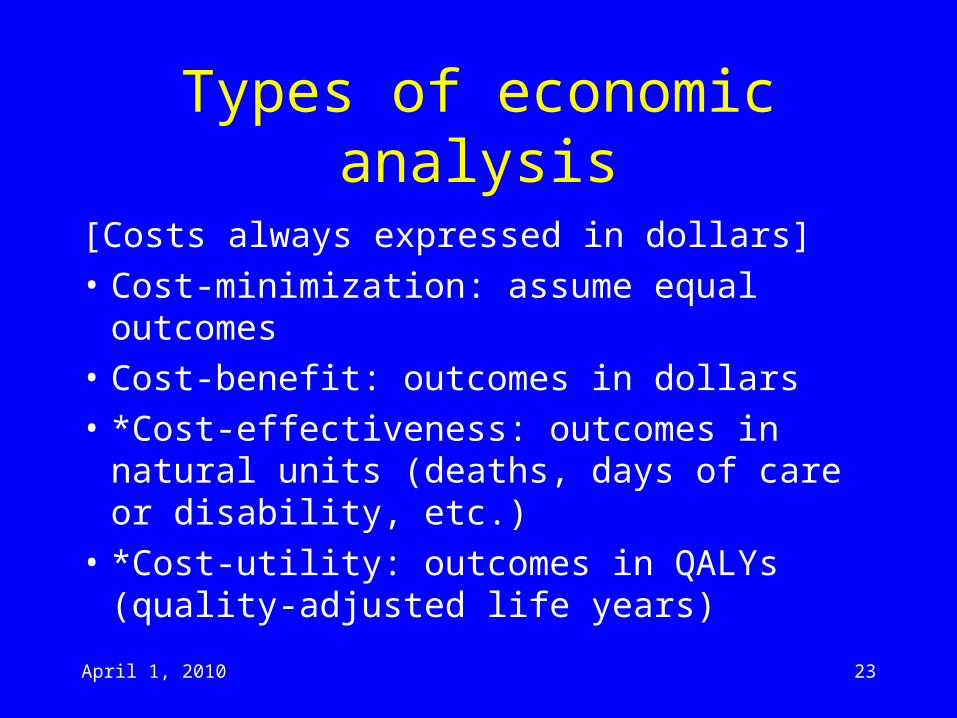
Types of economic analysis
[Costs always expressed in dollars]
• Cost-minimization: assume equal outcomes
• Cost-benefit: outcomes in dollars
• *Cost-effectiveness: outcomes in natural units (deaths, days of care or disability, etc.)
• *Cost-utility: outcomes in QALYs (quality-adjusted life years)
April 1, 2010 24
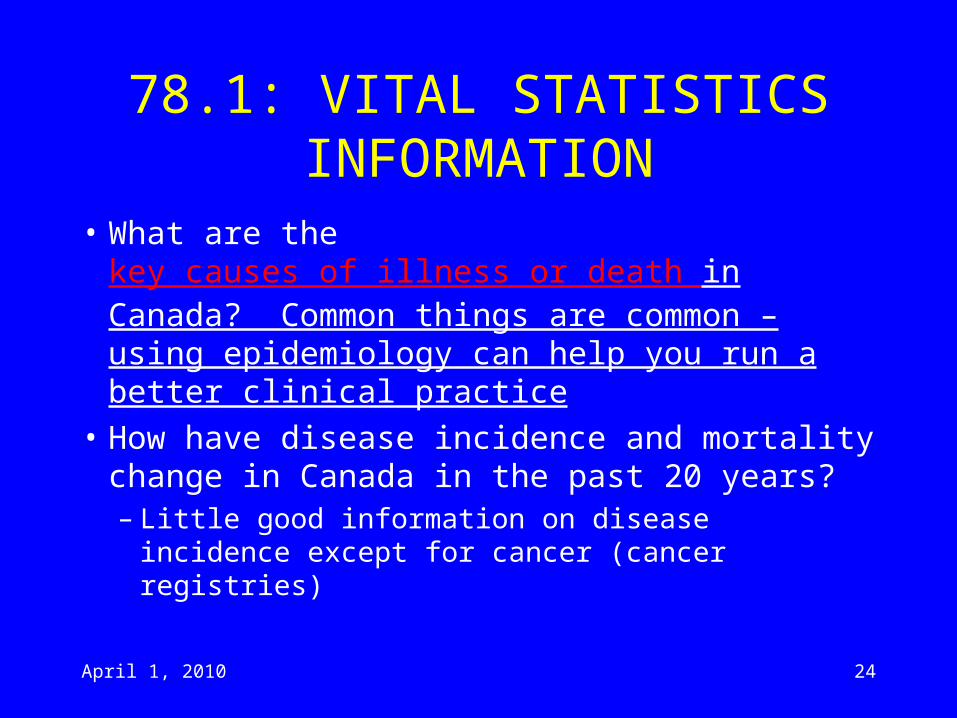
78.1: VITAL STATISTICS INFORMATION
• What are the key causes of illness or death in Canada? Common things are common – using epidemiology can help you run a better clinical practice
• How have disease incidence and mortality change in Canada in the past 20 years?– Little good information on disease incidence
except for cancer (cancer registries)
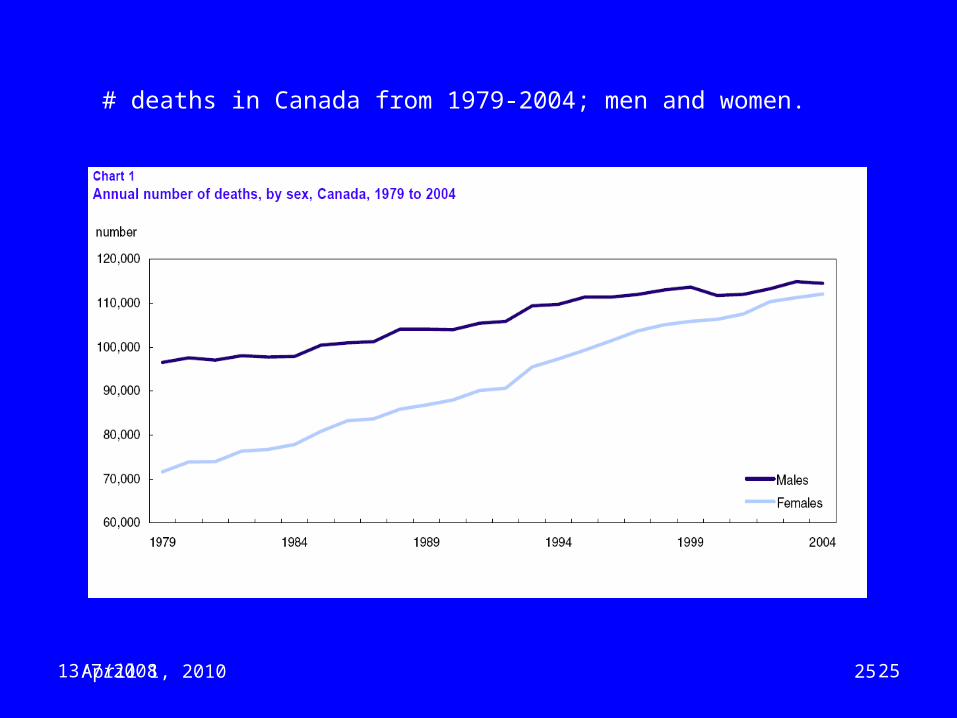
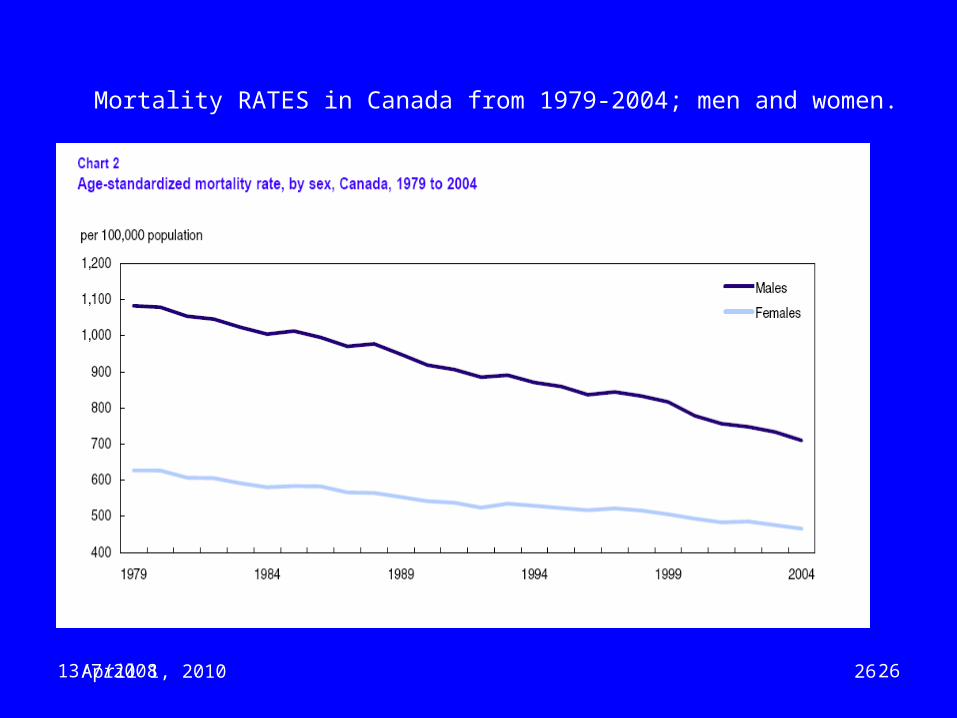
April 1, 2010 2513/7/2008 25
# deaths in Canada from 1979-2004; men and women.
April 1, 2010 2613/7/2008 26
Mortality RATES in Canada from 1979-2004; men and women.
April 1, 2010 27
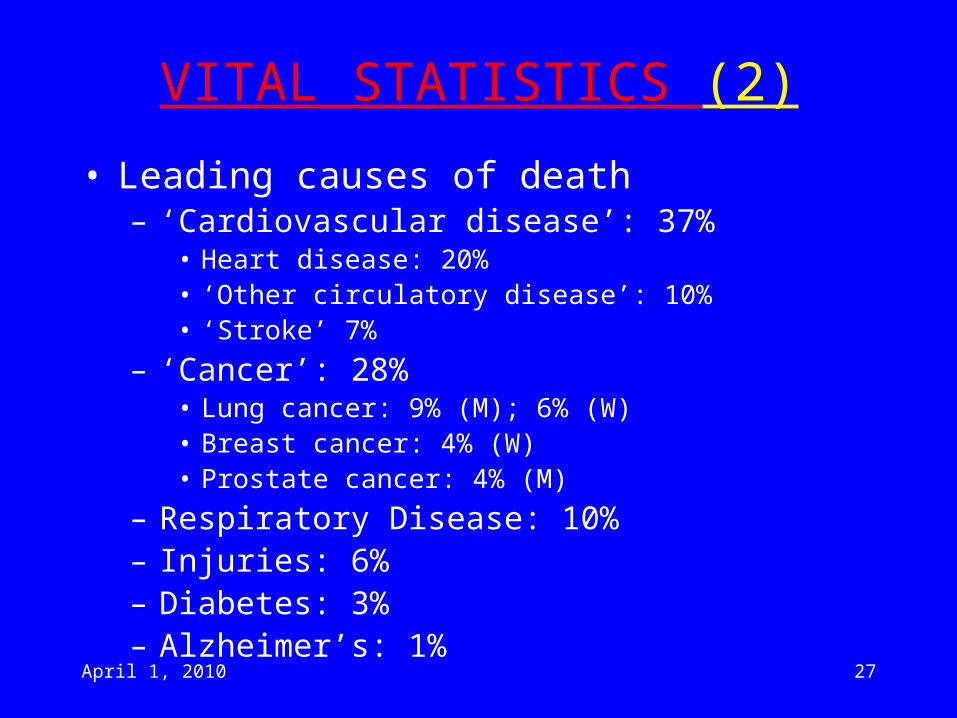
VITAL STATISTICS (2)
• Leading causes of death– ‘Cardiovascular disease’: 37%
• Heart disease: 20%• ‘Other circulatory disease’: 10%• ‘Stroke’ 7%
– ‘Cancer’: 28%• Lung cancer: 9% (M); 6% (W)• Breast cancer: 4% (W)• Prostate cancer: 4% (M)
– Respiratory Disease: 10%– Injuries: 6%– Diabetes: 3%– Alzheimer’s: 1%
April 1, 2010 28
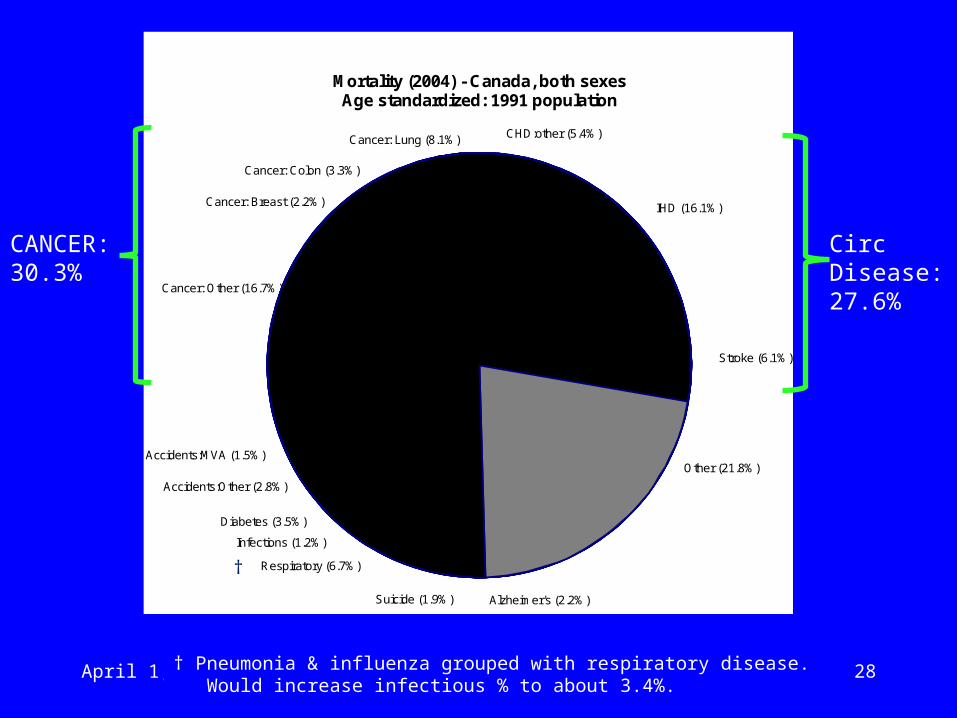
Mortality (2004) - Canada, both sexesAge standardized: 1991 population
Stroke (6.1%)
IHD (16.1%)
CHD:other (5.4%)Cancer: Lung (8.1%)
Cancer: Colon (3.3%)
Cancer: Breast (2.2%)
Cancer: Other (16.7%)
Accidents:MVA (1.5%)
Accidents:Other (2.8%)
Diabetes (3.5%)
Infections (1.2%)
Respiratory (6.7%)
Other (21.8%)
Alzheimer's (2.2%)Suicide (1.9%)
CANCER: 30.3%
Circ Disease:27.6%
†††
† Pneumonia & influenza grouped with respiratory disease. Would increase infectious % to about 3.4%.
April 1, 2010 29
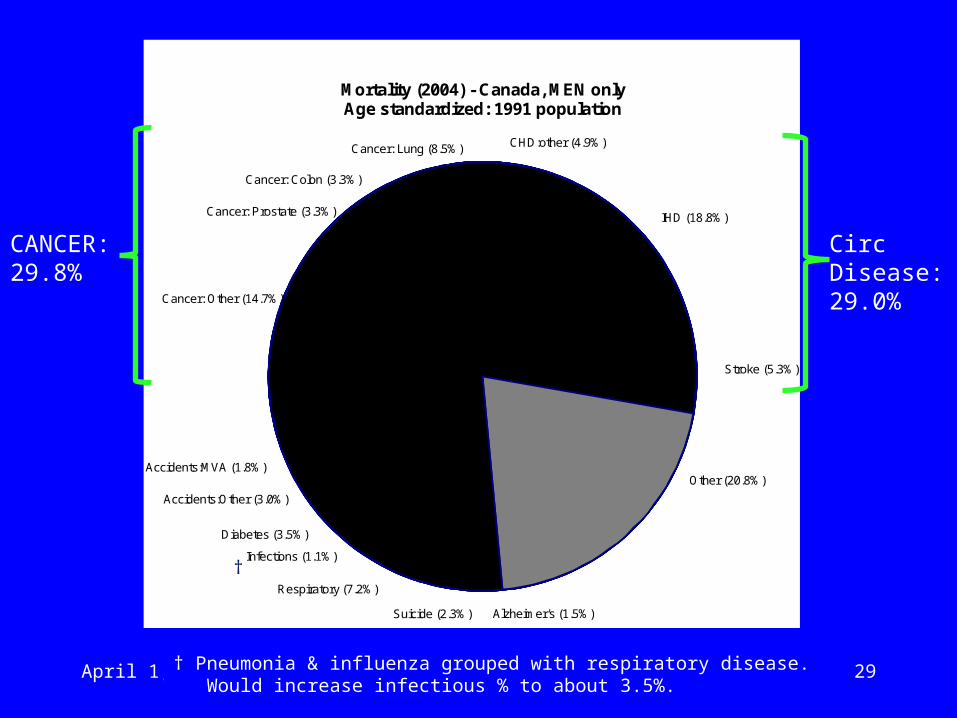
Mortality (2004) - Canada, MEN onlyAge standardized: 1991 population
Stroke (5.3%)
IHD (18.8%)
CHD:other (4.9%)Cancer: Lung (8.5%)
Cancer: Colon (3.3%)
Cancer: Prostate (3.3%)
Cancer: Other (14.7%)
Accidents:MVA (1.8%)
Accidents:Other (3.0%)
Diabetes (3.5%)
Infections (1.1%)
Respiratory (7.2%)
Other (20.8%)
Alzheimer's (1.5%)Suicide (2.3%)
CANCER: 29.8%
Circ Disease:29.0%
††
† Pneumonia & influenza grouped with respiratory disease. Would increase infectious % to about 3.5%.
April 1, 2010 30
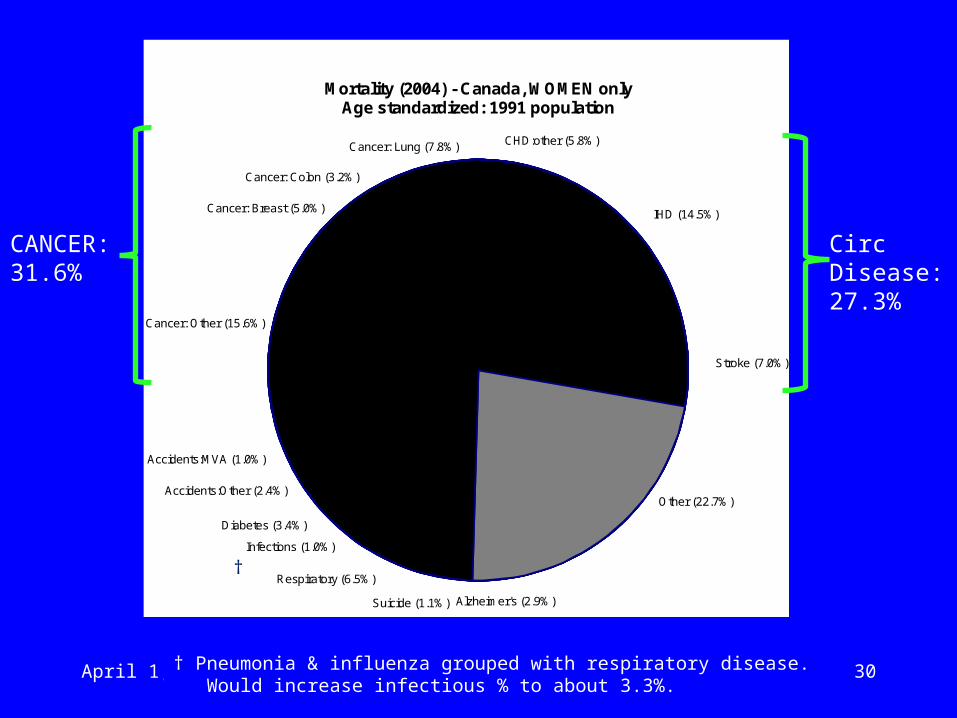
Mortality (2004) - Canada, WOMEN onlyAge standardized: 1991 population
Stroke (7.0%)
IHD (14.5%)
CHD:other (5.8%)Cancer: Lung (7.8%)
Cancer: Colon (3.2%)
Cancer: Breast (5.0%)
Cancer: Other (15.6%)
Accidents:MVA (1.0%)
Accidents:Other (2.4%)
Diabetes (3.4%)
Infections (1.0%)
Respiratory (6.5%)
Other (22.7%)
Alzheimer's (2.9%)Suicide (1.1%)
CANCER: 31.6%
Circ Disease:27.3%
††
† Pneumonia & influenza grouped with respiratory disease. Would increase infectious % to about 3.3%.
April 1, 2010 31
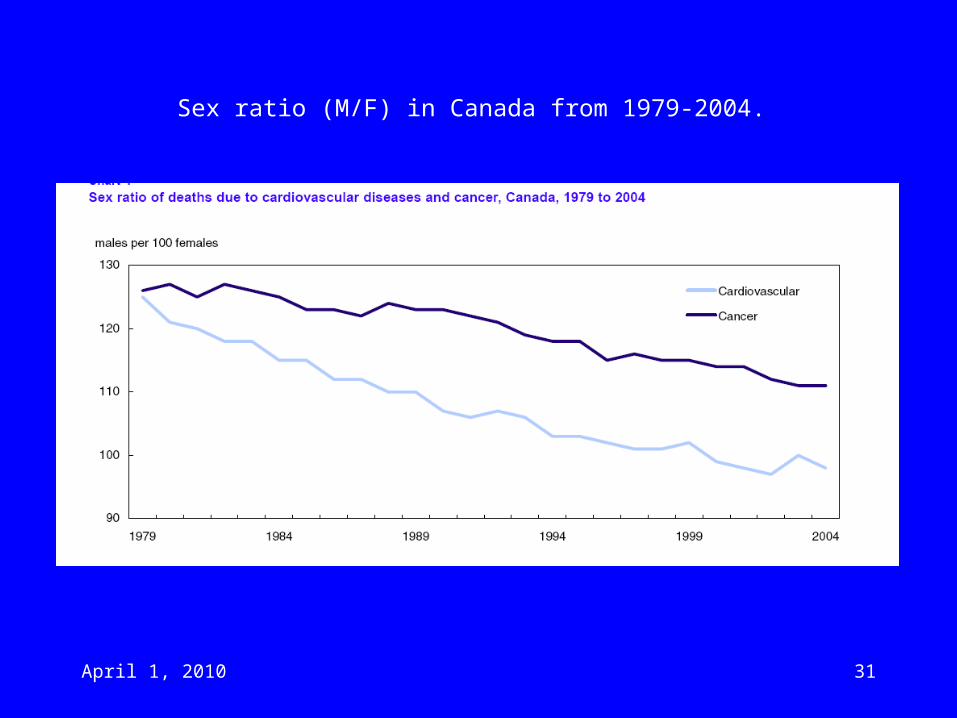
Sex ratio (M/F) in Canada from 1979-2004.
April 1, 2010 32
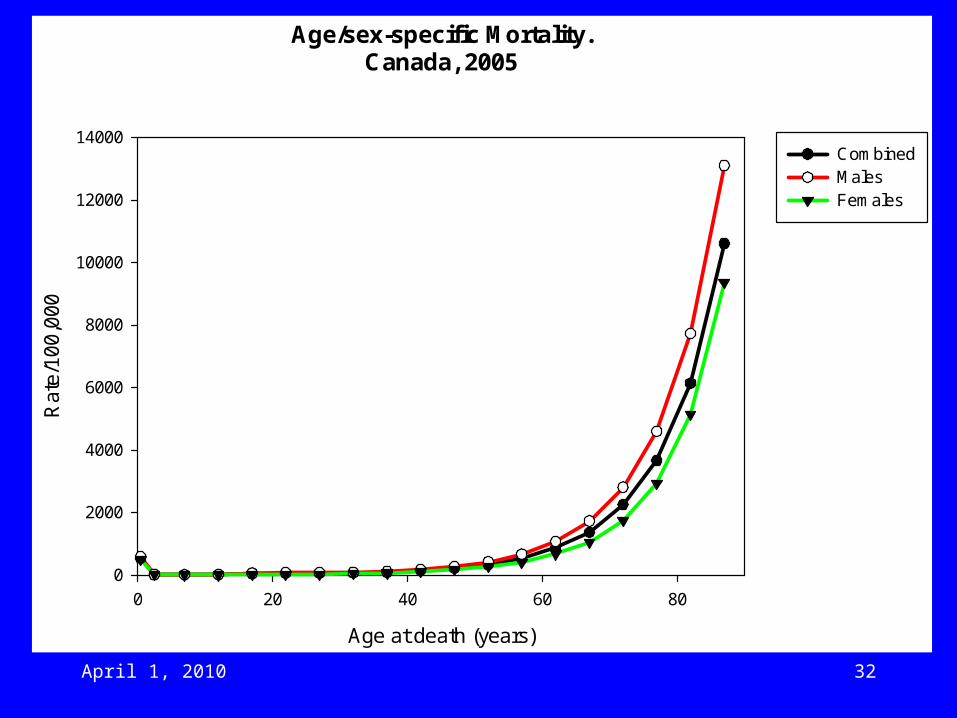
Age/sex-specific Mortality.Canada, 2005
Age at death (years)
0 20 40 60 80
Rat
e/10
0,00
0
0
2000
4000
6000
8000
10000
12000
14000CombinedMalesFemales
April 1, 2010 33 33
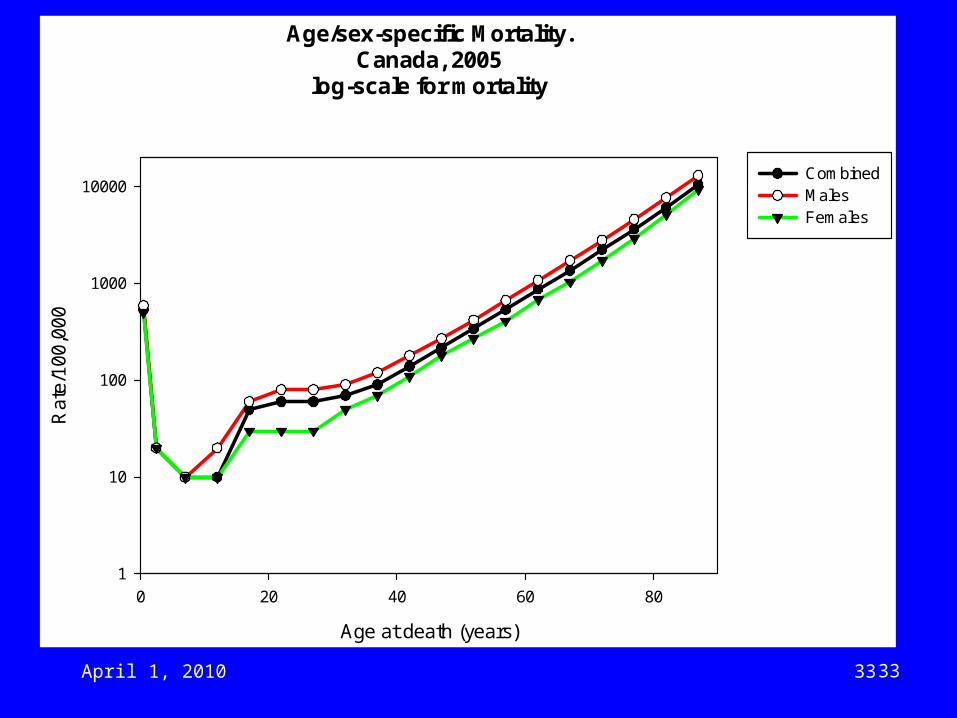
Age/sex-specific Mortality.Canada, 2005
log-scale for mortality
Age at death (years)
0 20 40 60 80
Rat
e/10
0,00
0
1
10
100
1000
10000CombinedMalesFemales
April 1, 2010 34
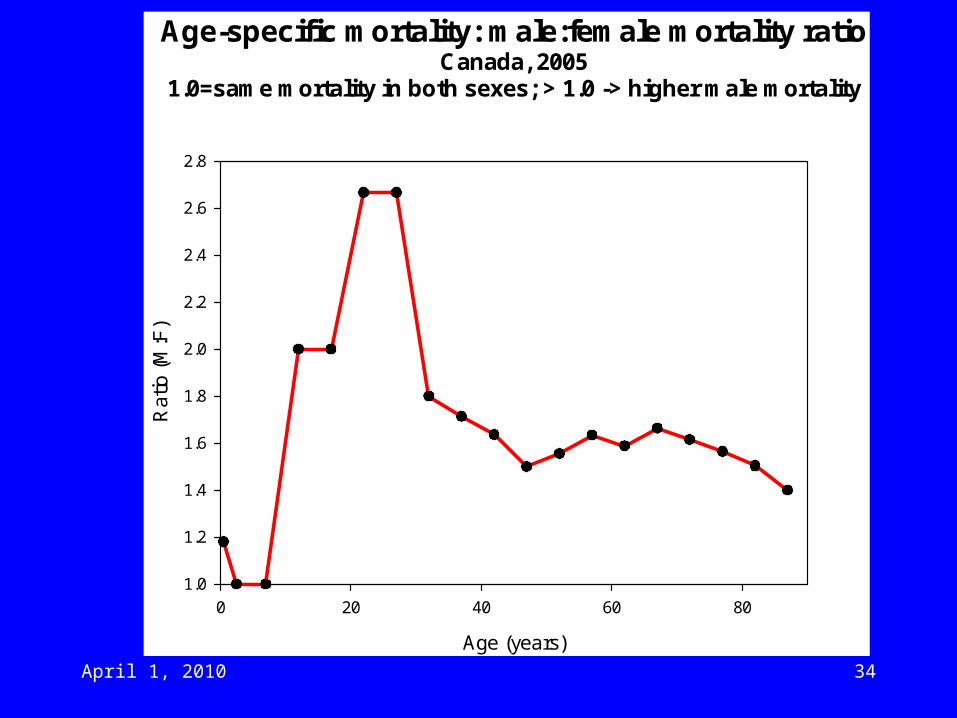
Age-specific mortality: male:female mortality ratioCanada, 2005
1.0=same mortality in both sexes; > 1.0 -> higher male mortality
Age (years)
0 20 40 60 80
Rat
io (
M:F
)
1.0
1.2
1.4
1.6
1.8
2.0
2.2
2.4
2.6
2.8
April 1, 2010 35
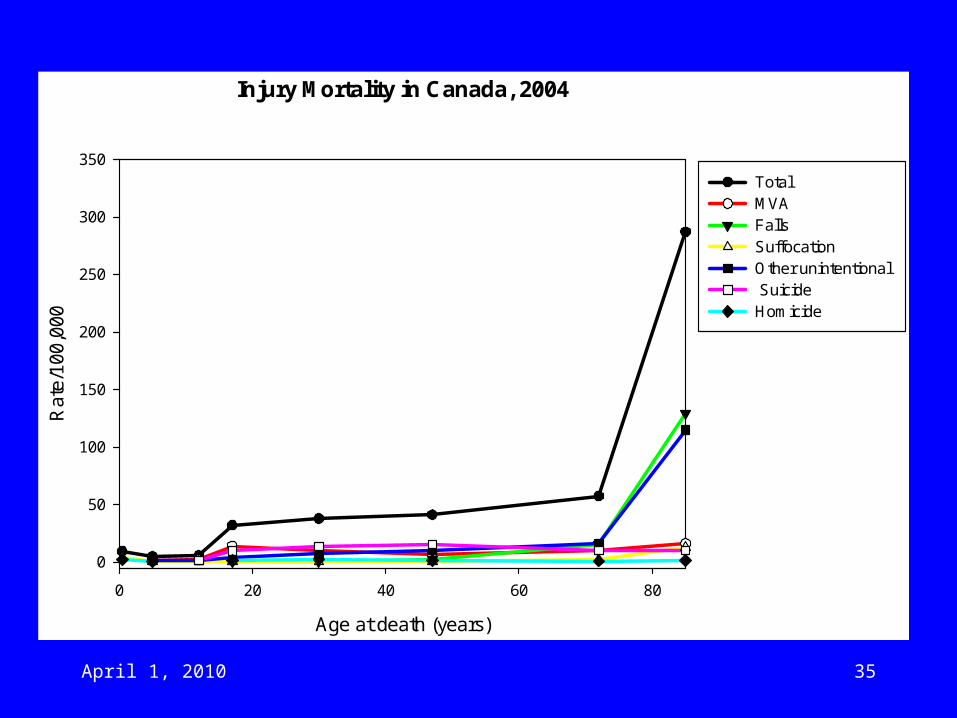
Injury Mortality in Canada, 2004
Age at death (years)
0 20 40 60 80
Rat
e/10
0,00
0
0
50
100
150
200
250
300
350
Total MVA FallsSuffocation Other unintentional Suicide Homicide
April 1, 2010 36
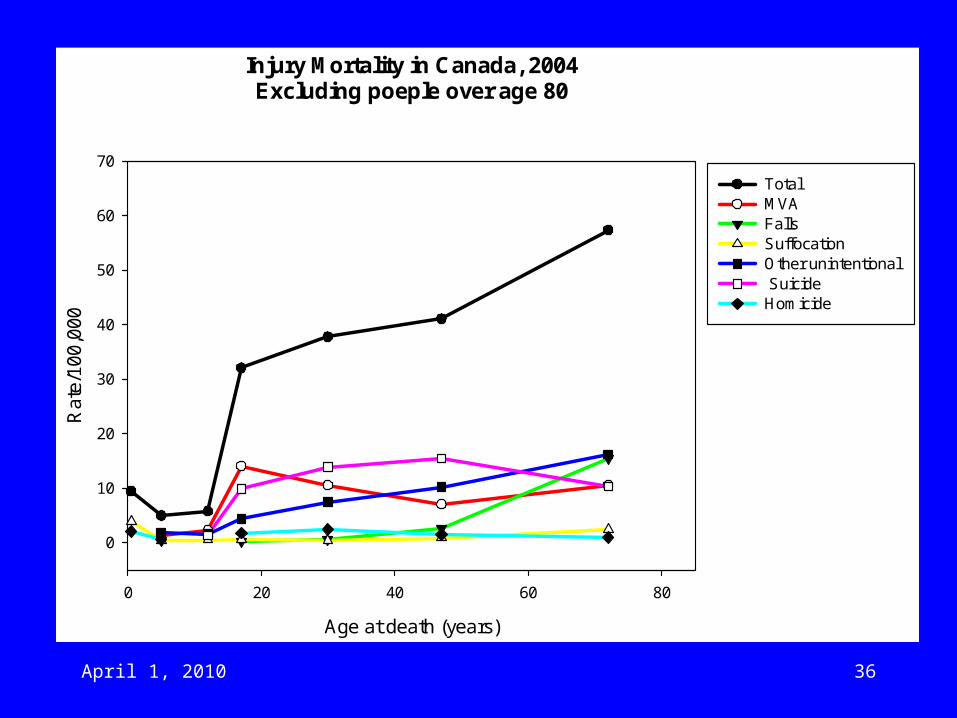
Injury Mortality in Canada, 2004Excluding poeple over age 80
Age at death (years)
0 20 40 60 80
Rat
e/10
0,00
0
0
10
20
30
40
50
60
70
Total MVA FallsSuffocation Other unintentional Suicide Homicide
April 1, 2010 37
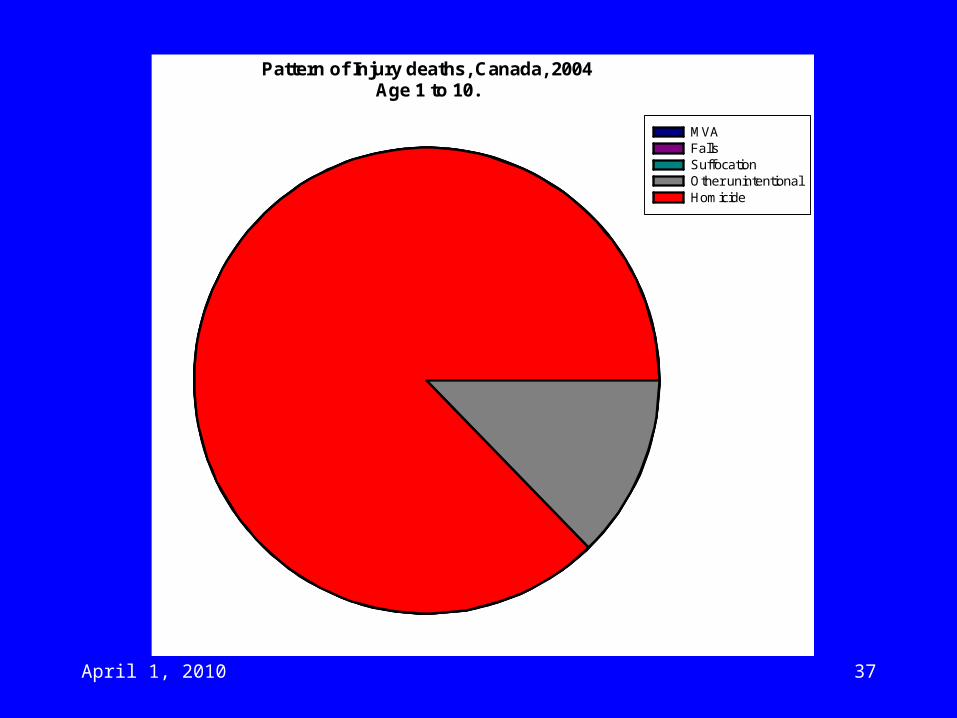
Pattern of Injury deaths, Canada, 2004Age 1 to 10.
MVA FallsSuffocationOther unintentionalHomicide
April 1, 2010 38
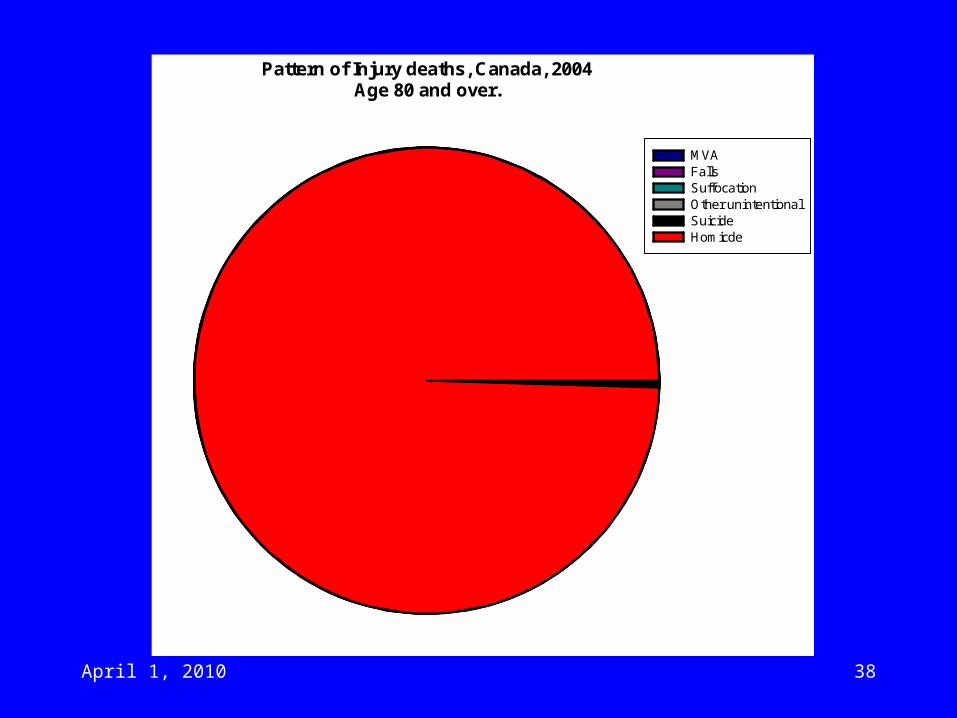
Pattern of Injury deaths, Canada, 2004Age 80 and over.
MVAFallsSuffocationOther unintentionalSuicideHomicde
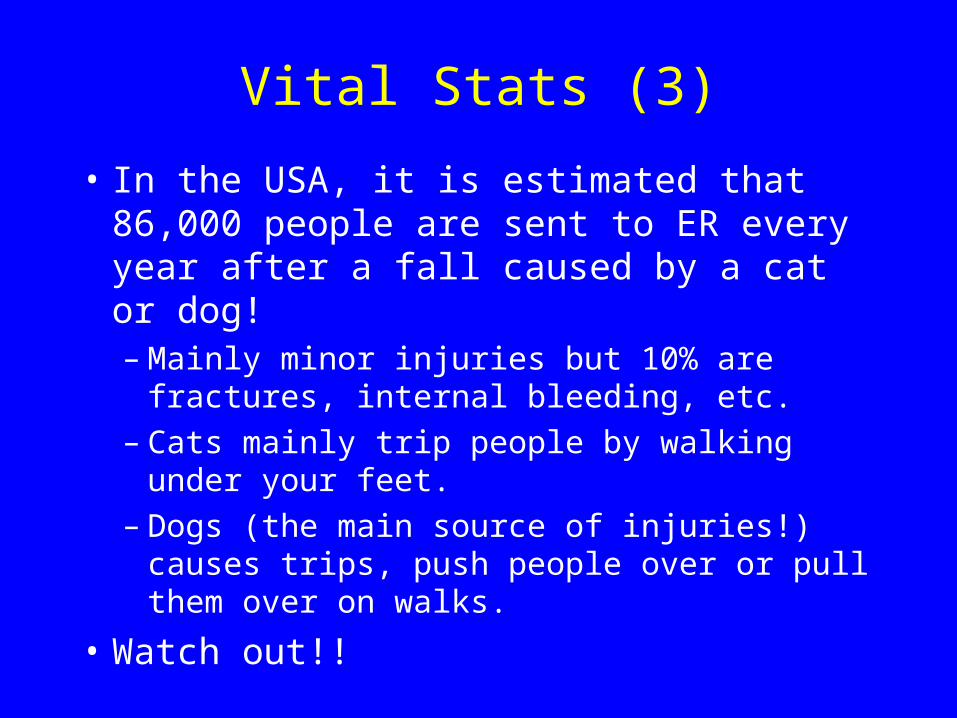
Vital Stats (3)
• In the USA, it is estimated that 86,000 people are sent to ER every year after a fall caused by a cat or dog!– Mainly minor injuries but 10% are fractures,
internal bleeding, etc.– Cats mainly trip people by walking under your
feet.– Dogs (the main source of injuries!) causes trips,
push people over or pull them over on walks.
• Watch out!!
April 1, 2010 40
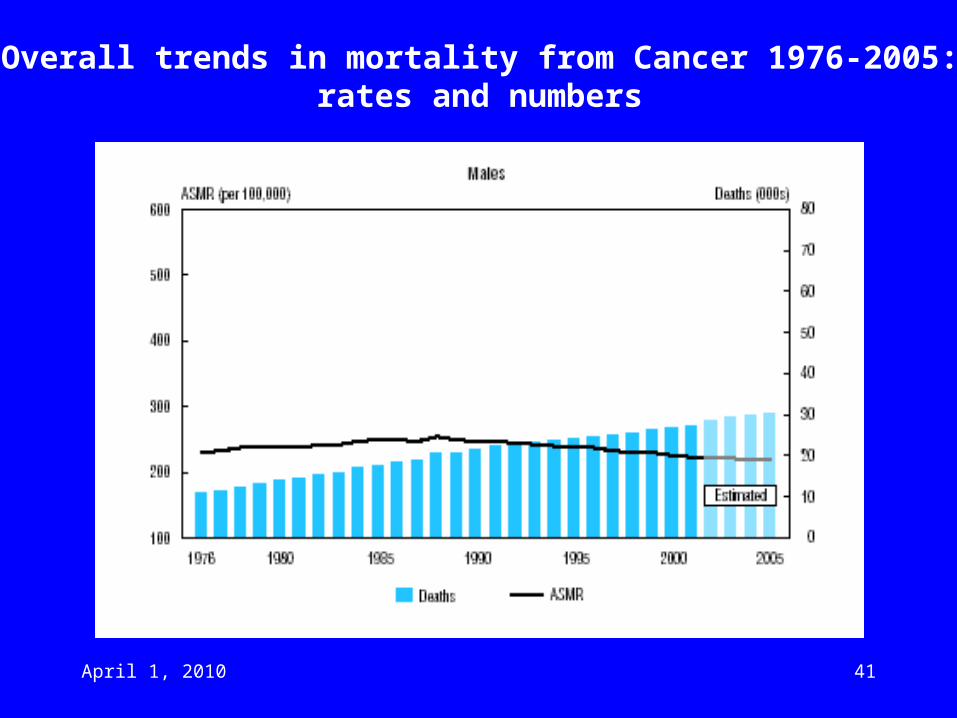
April 1, 2010 41
Overall trends in mortality from Cancer 1976-2005:rates and numbers
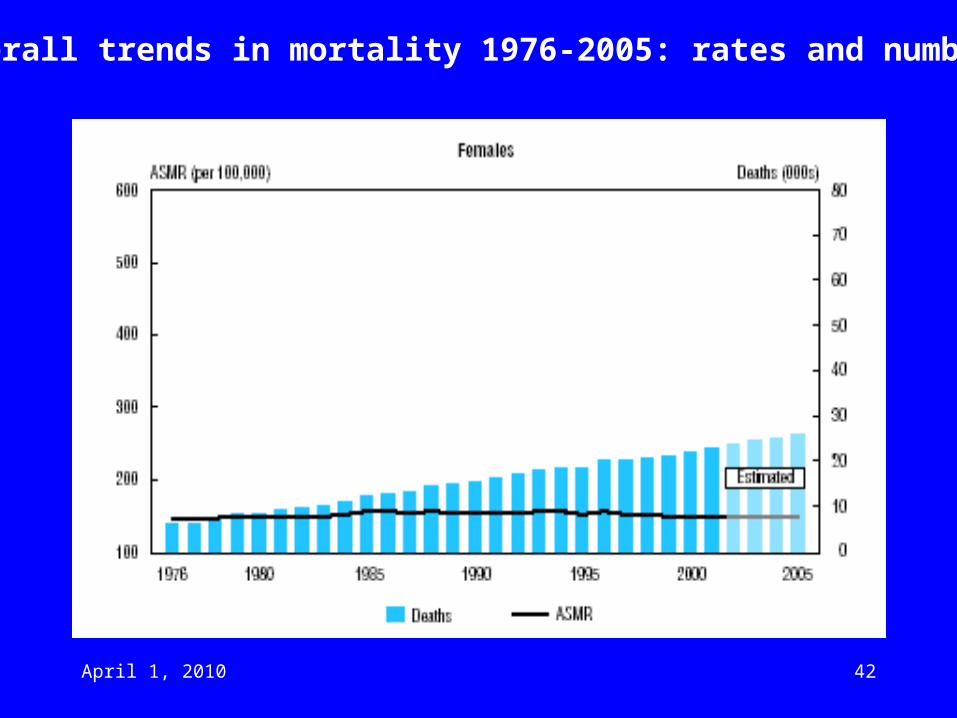
April 1, 2010 42
Overall trends in mortality 1976-2005: rates and numbers
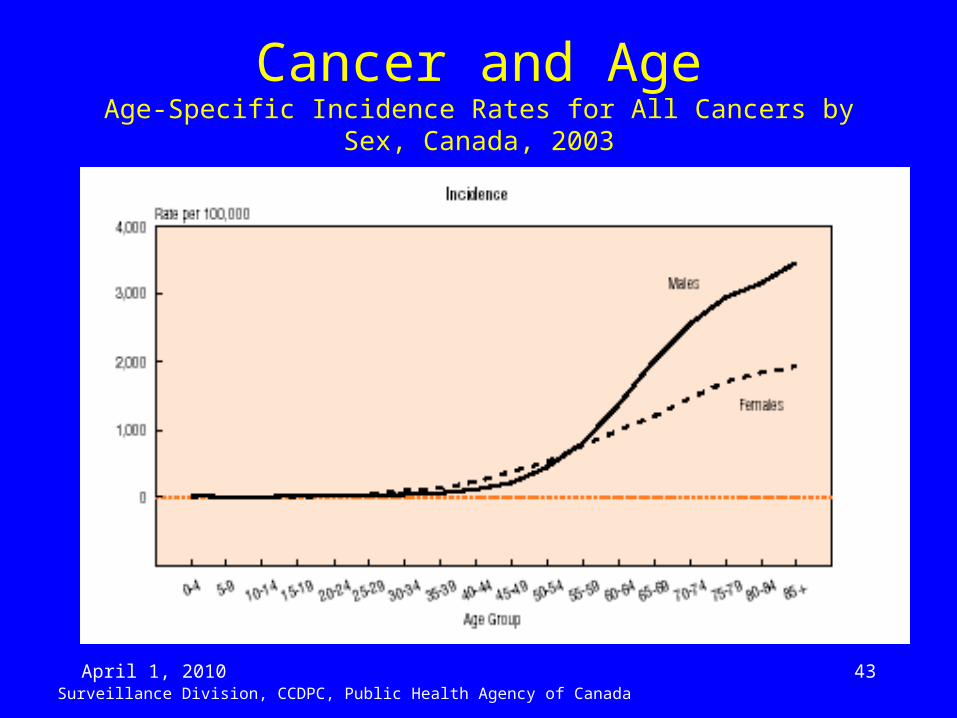
April 1, 2010 43
Cancer and AgeAge-Specific Incidence Rates for All Cancers by Sex, Canada, 2003
Surveillance Division, CCDPC, Public Health Agency of Canada
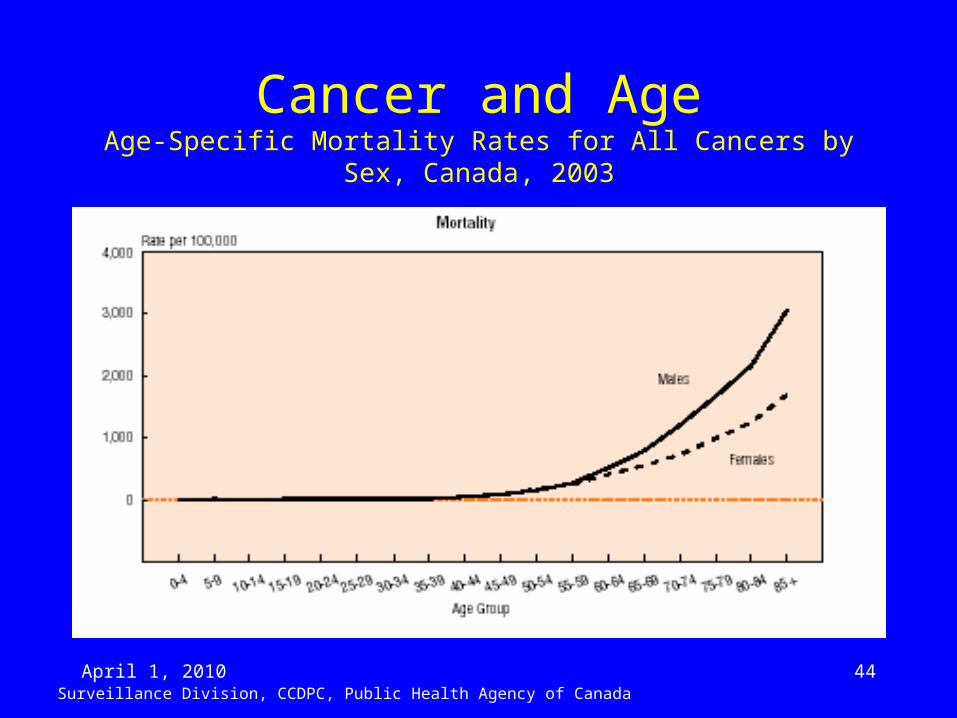
April 1, 2010 44
Cancer and AgeAge-Specific Mortality Rates for All Cancers by Sex, Canada, 2003
Surveillance Division, CCDPC, Public Health Agency of Canada
April 1, 2010 45
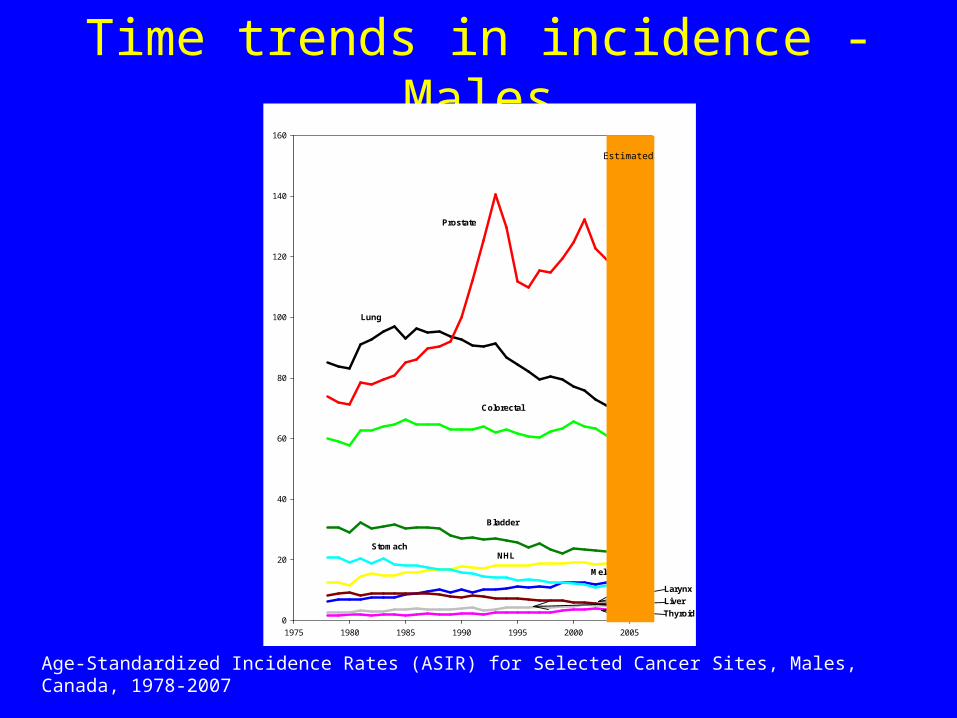
Time trends in incidence - Males
Age-Standardized Incidence Rates (ASIR) for Selected Cancer Sites, Males, Canada, 1978-2007
Surveillance and Risk Assessment Division, CCDPC, Public Health Agency of Canada
1975 1980 1985 1990 1995 2000 2005
0
20
40
60
80
100
120
140
160
Prostate
Lung
Colorectal
Bladder
NHLStomach
Melanoma
Larynx
Liver
Thyroid
Estimated
April 1, 2010 46
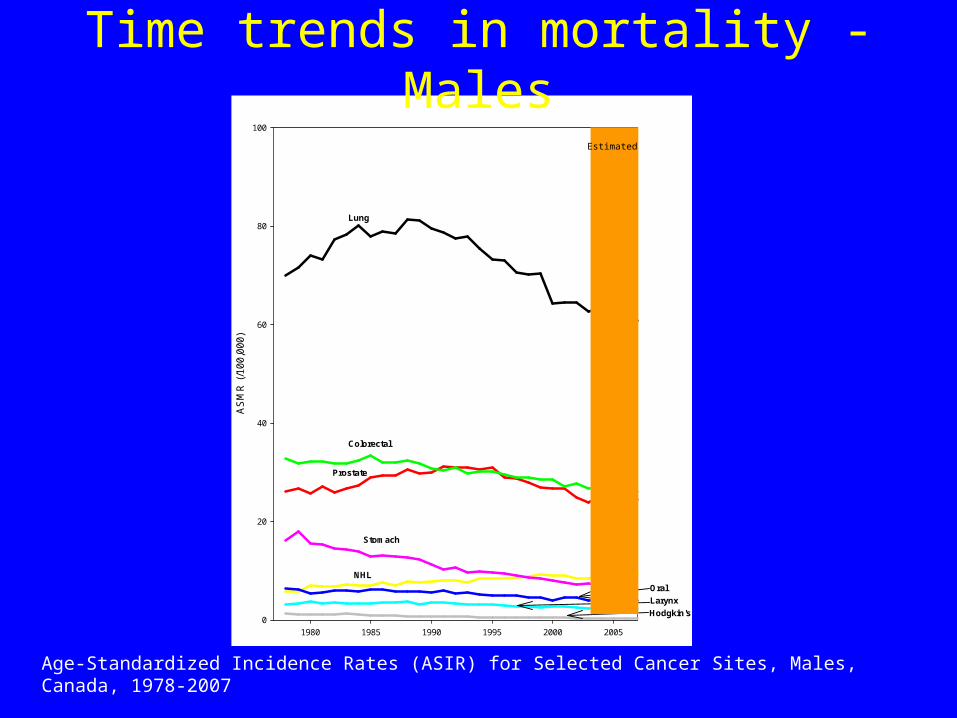
1980 1985 1990 1995 2000 2005
AS
MR
(/1
00
,00
0)
0
20
40
60
80
100
Prostate
Lung
Colorectal
NHL
Stomach
Oral
Larynx
Hodgkin's
Time trends in mortality - Males
Age-Standardized Incidence Rates (ASIR) for Selected Cancer Sites, Males, Canada, 1978-2007
Surveillance and Risk Assessment Division, CCDPC, Public Health Agency of Canada
Estimated
April 1, 2010 47
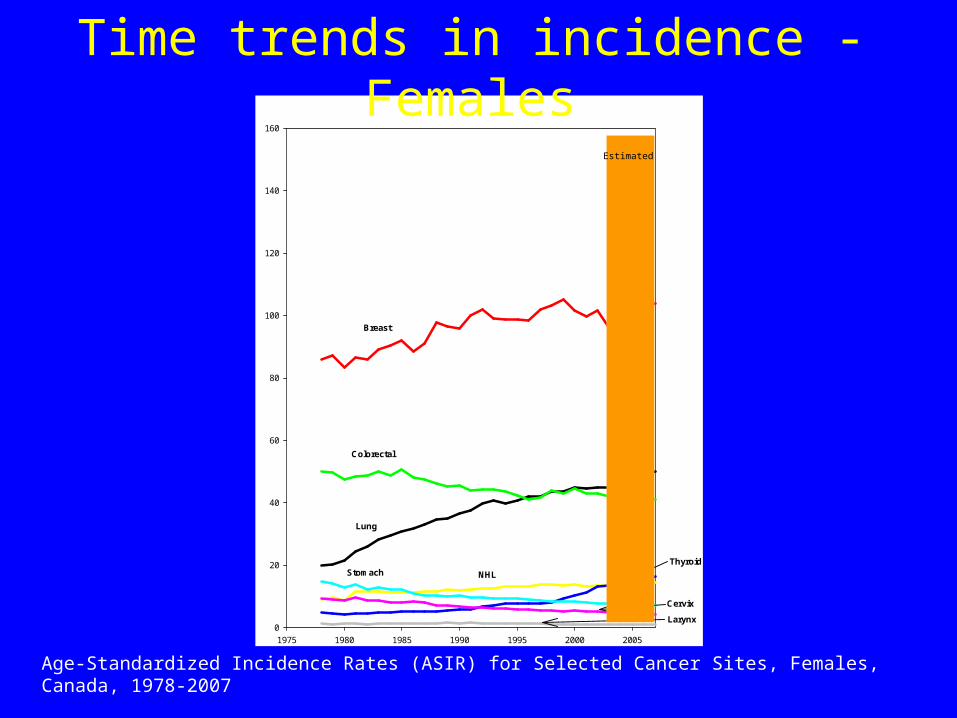
1975 1980 1985 1990 1995 2000 2005
0
20
40
60
80
100
120
140
160
Breast
Lung
Colorectal
NHLStomach
Cervix
Larynx
Thyroid
Time trends in incidence - Females
Age-Standardized Incidence Rates (ASIR) for Selected Cancer Sites, Females, Canada, 1978-2007
Surveillance and Risk Assessment Division, CCDPC, Public Health Agency of Canada
Estimated
April 1, 2010 48
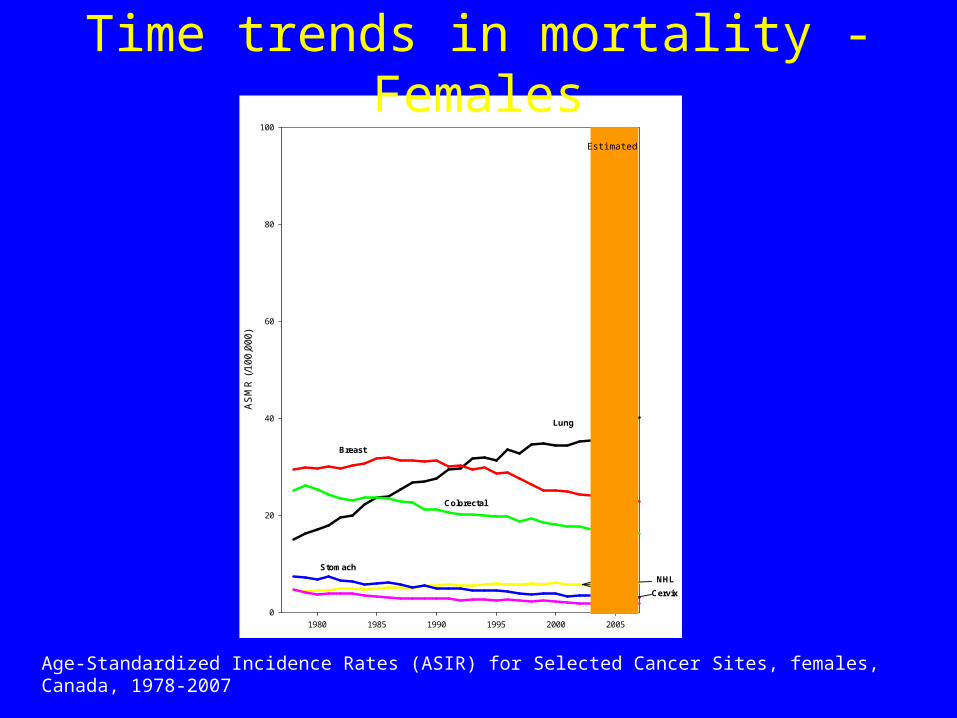
1980 1985 1990 1995 2000 2005
AS
MR
(/1
00,
000)
0
20
40
60
80
100
Breast
Lung
Colorectal
NHL
Stomach
Cervix
Time trends in mortality - Females
Age-Standardized Incidence Rates (ASIR) for Selected Cancer Sites, females, Canada, 1978-2007
Surveillance and Risk Assessment Division, CCDPC, Public Health Agency of Canada
Estimated
April 1, 2010 49
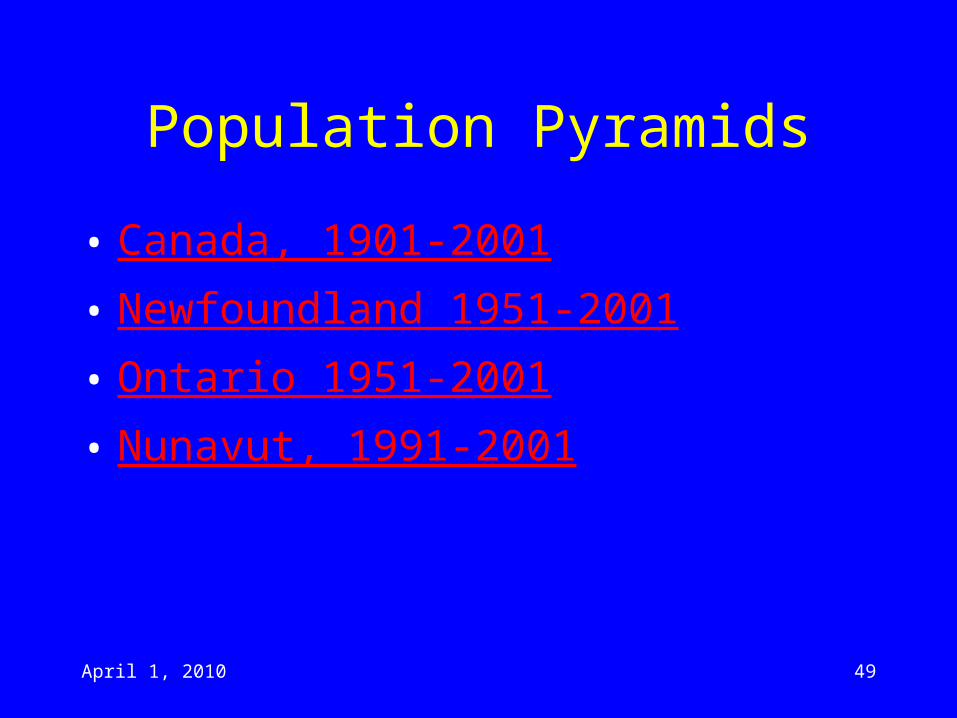
Population Pyramids
• Canada, 1901-2001
• Newfoundland 1951-2001
• Ontario 1951-2001
• Nunavut, 1991-2001