Embed Size (px)
Citation preview

03/2015 1
Back to Basics, 2015POPULATION HEALTH : Vital & Health Statistics
Dr. Nicholas BirkettSchool of Epidemiology, Public Health and
Preventive Medicine

2
LMCC Links
• Links to three objectives:
03/2015
78.2 Assessing and Measuring Health Status at the Population Level
78.1 Concepts of Health and its Determinants
78.7 Health of Special Populations

03/2015 3
Important Questions
• What are the main causes of illness or death in Canada?–Common things are common
• using epidemiology can help you run a better clinical practice
• Hippocrates

03/2015 4
Important Questions
• How have disease incidence and mortality changed in Canada in the past 20 years?–Little good information on disease
incidence except for reportable diseases and cancer (cancer registries)

03/2015 5
TOPICS
• Demography, population dynamics• Mortality• Morbidity• Summary measures of population health• Aboriginal health• Many slides present information on key
diseases and causes of death

03/2015 6
Population Dynamics, 2007
Canada Nfld Nunavut
% aged >65 14%
Total fertility 1.7
Birth rate/1,000 11.3
Death rate/1,000 7.3
Rate of Natural Increase/1,000
4.0
Canada Nfld Nunavut
% aged >65 14% 15%
Total fertility 1.7 1.5
Birth rate/1,000 11.3 8.9
Death rate/1,000 7.3 8.9
Rate of Natural Increase/1,000
4.0 0
Canada Nfld Nunavut
% aged >65 14% 15% 3%
Total fertility 1.7 1.5 3.0
Birth rate/1,000 11.3 8.9 25.8
Death rate/1,000 7.3 8.9 4.3
Rate of Natural Increase/1,000
4.0 0 21.5

03/2015 7
Some definitions
• Dependency ratio– a measure of the degree to which a population
‘dependent’– Usually based on the number under age 15 and
over age 65– Compares to the number between age 15 and 65.
• Total Fertility rate– Average number children expected to be born to
a women IF:• Current fertility patterns hold throughout her lifetime.

World Health Report, 2012 (data mostly from 2009)
Population(x 1,000)
Growth(%)
Dependency ratio %
% aged > 60
Total Fertility
rate
LE at birth (both
sexes)
P dying< 5 yrs
(per 1000)
Afghan- istan
Canada 34,017 1.0 56 20 1.7 81 6
China
France
Japan
USA
Population(x 1,000)
Growth(%)
Dependency ratio %
% aged > 60
Total Fertility
rate
LE at birth (both
sexes)
P dying< 5 yrs
(per 1000)
Afghan- istan
Canada 34,017 1.0 56 20 1.7 81 6
China
France
Japan
USA 310,384 0.9 61 18 2.1 79 8
Population(x 1,000)
Growth(%)
Dependency ratio %
% aged > 60
Total Fertility
rate
LE at birth (both
sexes)
P dying< 5 yrs
(per 1000)
Afghan- istan
31,412 3.2 100 4 6.3 48 149
Canada 34,017 1.0 56 20 1.7 81 6
China
France
Japan
USA 310,384 0.9 61 18 2.1 79 8
Population(x 1,000)
Growth(%)
Dependency ratio %
% aged > 60
Total Fertility
rate
LE at birth (both
sexes)
P dying< 5 yrs
(per 1000)
Afghan- istan
31,412 3.2 100 4 6.3 48 149
Canada 34,017 1.0 56 20 1.7 81 6
China
France
Japan 126,536 0.1 75 30 1.4 83 3
USA 310,384 0.9 61 18 2.1 79 8
Population(x 1,000)
Growth(%)
Dependency ratio %
% aged > 60
Total Fertility
rate
LE at birth (both
sexes)
P dying< 5 yrs
(per 1000)
Afghan- istan
31,412 3.2 100 4 6.3 48 149
Canada 34,017 1.0 56 20 1.7 81 6
China 1,348,932 0.6 45 12 1.6 74 18
France 62,787 0.6 70 23 2.0 81 4
Japan 126,536 0.1 75 30 1.4 83 3
USA 310,384 0.9 61 18 2.1 79 8

903/2015

1003/2015
Population Pyramids
• Canada, 1901-2001• Ontario 1901-2001• Newfoundland 1949-2001• Yukon 1901-2001

General (All-Causes) Mortality
03/2015 11

1203/2015
# deaths in Canada from 1979-2004; men and women.
Population got:• Bigger• Older

1303/2015
Mortality RATES in Canada from 1979-2004; men and women.

03/2015 14
Infant Mortality, 1935-2005

03/2015 15
Age/sex-specific Mortality.Canada, 2005
Age at death (years)
0 20 40 60 80
Rat
e/10
0,00
0
0
2000
4000
6000
8000
10000
12000
14000CombinedMalesFemales
03/2015 16 16
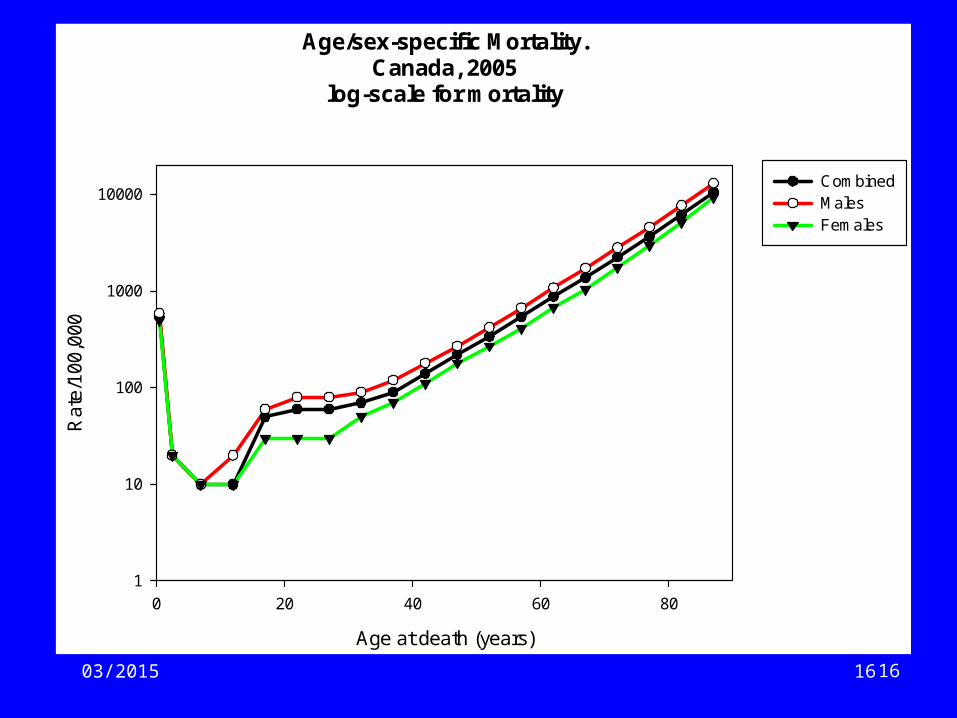
Age/sex-specific Mortality.Canada, 2005
log-scale for mortality
Age at death (years)
0 20 40 60 80
Rat
e/10
0,00
0
1
10
100
1000
10000CombinedMalesFemales

17
Age-specific mortality: male:female mortality ratioCanada, 2005
1.0=same mortality in both sexes; > 1.0 -> higher male mortality
Age (years)
0 20 40 60 80
Rat
io (
M:F
)
1.0
1.2
1.4
1.6
1.8
2.0
2.2
2.4
2.6
2.8

03/2015 18
Rectangularization of the mortality curve

Cause-Specific Mortality
03/2015 19
03/2015 20
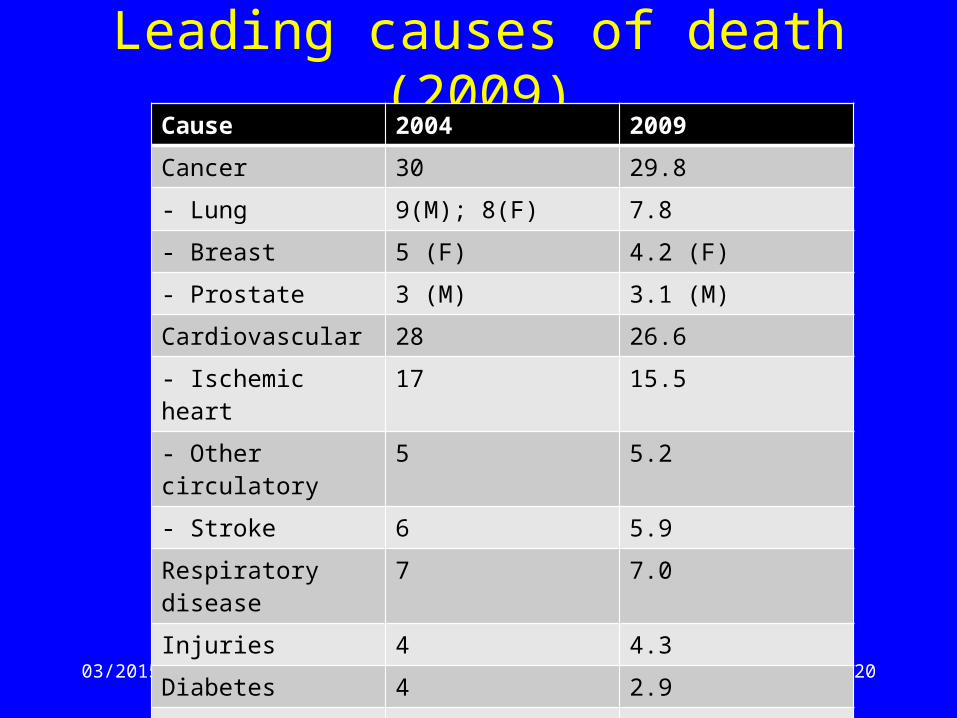
Leading causes of death (2009)Cause 2004 2009
Cancer 30 29.8
- Lung 9(M); 8(F) 7.8
- Breast 5 (F) 4.2 (F)
- Prostate 3 (M) 3.1 (M)
Cardiovascular 28 26.6
- Ischemic heart 17 15.5
- Other circulatory 5 5.2
- Stroke 6 5.9
Respiratory disease 7 7.0
Injuries 4 4.3
Diabetes 4 2.9
Alzheimer’s disease 2 2.6
Suicide 1.6 1.6

2103/2015
CANCER: 30.3%
Circ Disease:27.6%
†
† Pneumonia & influenza grouped with respiratory disease. Would increase infectious % to about 3.4%.

03/2015 22
CANCER: 29.8%
Circ Disease:29.0%
††
† Pneumonia & influenza grouped with respiratory disease. Would increase infectious % to about 3.5%.
{EXTERNALCAUSES:4.8%+

03/2015 23
CANCER: 31.6%
Circ Disease:27.3%
††
† Pneumonia & influenza grouped with respiratory disease. Would increase infectious % to about 3.3%.
{EXTERNALCAUSES:3.4%+

2403/2015
Cancer Cluster
Cardio-vascular Cluster
‘Other’ Cluster

2503/2015
‘Other’ Cluster

2603/2015
Suicide
Crime

2703/2015

03/2015 28
Cancer and AgeAge-Specific Mortality Rates for All Cancers by Sex, Canada, 2003
Surveillance Division, CCDPC, Public Health Agency of Canada

03/2015 29
Cancer and AgeAge-Specific Incidence Rates for All Cancers by Sex, Canada, 2003
Surveillance Division, CCDPC, Public Health Agency of Canada

03/2015 30
Time trends in MalesIncidence Mortality
1975 1980 1985 1990 1995 2000 2005
0
20
40
60
80
100
120
140
160
Prostate
Lung
Colorectal
Bladder
NHLStomach
Melanoma
Larynx
Liver
Thyroid
1980 1985 1990 1995 2000 2005
AS
MR
(/1
00
,00
0)
0
20
40
60
80
100
Prostate
Lung
Colorectal
NHL
Stomach
Oral
Larynx
Hodgkin's
03/2015 31
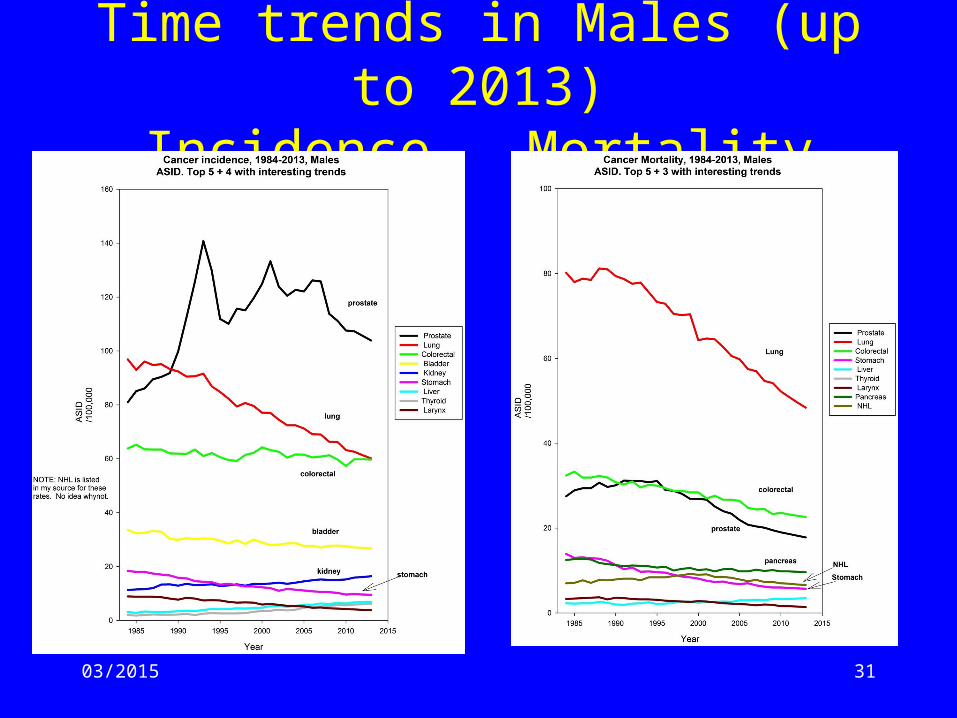
Time trends in Males (up to 2013)Incidence Mortality

03/2015 32
Time trends in FemalesIncidence Mortality
1975 1980 1985 1990 1995 2000 2005
0
20
40
60
80
100
120
140
160
Breast
Lung
Colorectal
NHLStomach
Cervix
Larynx
Thyroid
1980 1985 1990 1995 2000 2005
AS
MR
(/1
00,0
00)
0
20
40
60
80
100
Breast
Lung
Colorectal
NHL
Stomach
Cervix

03/2015 33
Time trends in Females (up to 2013)Incidence Mortality

03/2015 34
Injury Mortality in Canada, 2004
Age at death (years)
0 20 40 60 80
Rat
e/10
0,00
0
0
50
100
150
200
250
300
350
Total MVA FallsSuffocation Other unintentional Suicide Homicide

03/2015 35
Injury Mortality in Canada, 2004Excluding poeple over age 80
Age at death (years)
0 20 40 60 80
Rat
e/10
0,00
0
0
10
20
30
40
50
60
70
Total MVA FallsSuffocation Other unintentional Suicide Homicide

Income Inequalities in Health
03/2015 36

Income Inequalities• SES (socio-economic status)
– Lower worse health• Life expectancy 6.6 years lower in the poorest group.
– Complex causal pathway• Nutrition• Race• Habits• Environmental/occupational• Access to/use of health/preventive services• Political isolation• Others
3703/2015

3803/2015

391 2 3 4 5 1 2 3 4 5
Income adequacy quintiles
Men
Women
Remaining Life Expectancy at age 25. Based on 10-year follow-up to 1991 census
03/2015

Remaining life expectancy at age 25, 1991-2001
Men Women
Total, all quintiles 53.7 59.3
Quintile 1 (lowest) 50.6 57.1
Quintile 2 53.0 59.2
Quintile 3 54.0 59.7
Quintile 4 55.0 60.6
Quintile 5 (highest) 56.0 60.4
Difference Q5-Q1 5.3 3.3
03/2015 40
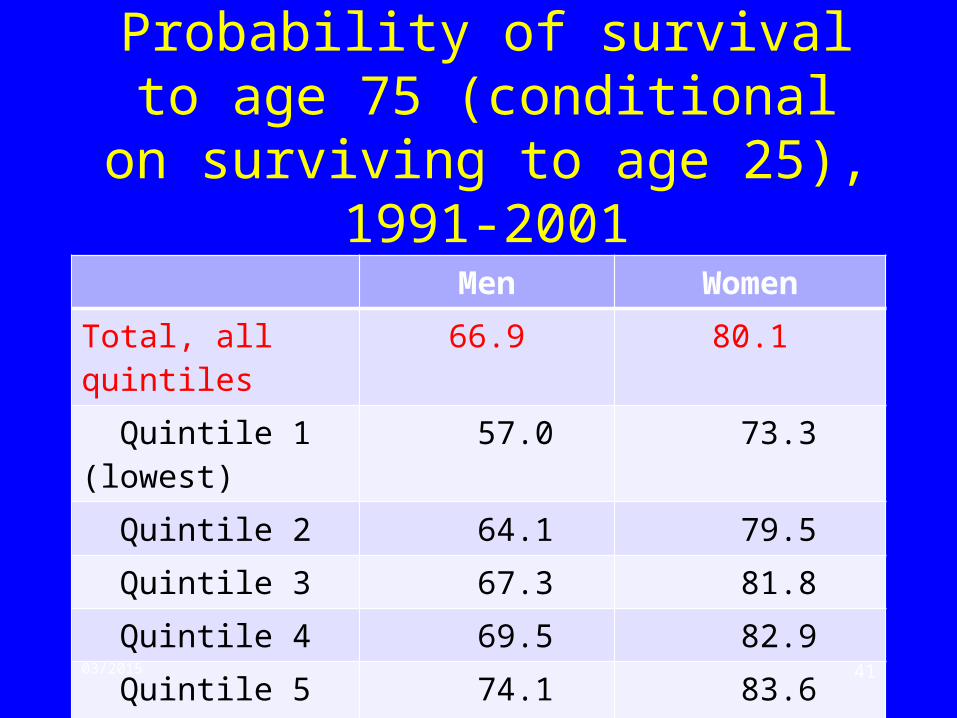
Probability of survival to age 75 (conditional on surviving to age 25),
1991-2001
Men Women
Total, all quintiles 66.9 80.1
Quintile 1 (lowest) 57.0 73.3
Quintile 2 64.1 79.5
Quintile 3 67.3 81.8
Quintile 4 69.5 82.9
Quintile 5 (highest) 74.1 83.6
Difference Q5-Q1 17.2 10.3
03/2015 41

Summary Measures of Population Health
Combine mortality and a measure of morbidity
03/2015 42

03/2015 43
Impact of Chronic Diseases
Category Mortality Morbidity
Cancer 85% 15%
Cardiovascular 79% 21%
Diabetes 37% 63%
Respiratory 33% 67%
Neuropsychiatric 8% 92%
Musculoskeletal 7% 93%
Sense organs 0% 100%

03/2015 44
Summary Measures ofPopulation Health
IndicatorType
Life (Survival) Health-Adjusted Life (Survival)
Gap Years of Life Lost(YLL)
Disability-Adj Life Years (DALY)
Expectancy Life Expectancy(LE)
Health-Adj LifeExpectancy
(HALE)

03/2015 45
2001 Life Expectancy andHealth-Adjusted Life Expectancy
GenderIndicator
Males Females Difference
LE 76.9 82.0 5.1
HALE 68.3 70.8 2.5
Difference 8.6 12.8
• HALE always < LE• Females live longer (but gap is narrowing)• Females suffer more morbidity

03/2015 46
Disability-Adjusted Life-Years Lost
0
5000
10000
15000
20000
25000
30000
35000
40000
I Communicable
MaternalPerinatalNutritional
II Chronic
III Injuries
MorbidityMortality

03/2015 47
Which Chronic Diseases?
0
2000
4000
6000
8000
10000
12000
14000
Ca CVSDMRespN-PM-SSense
MorbidityMortality
Cancer CHD Diabetes Respiratory Neuro-Psych Musculoskeletal Sensory
Cancer CHD DiabetesRespiratoryNeuro-psychMusculoskeltalSensory

03/2015 48
Deaths vs Prevalence, Canada

4903/2015

Aboriginal Health
03/2015 50

Population Pyramids
03/2015 51

Age-specific Fertility Rates
03/2015 52
0
20
40
60
80
100
120
140
160
180
200
15-19 20-24 25-29 30-34 35-39 40-44
First Nations (2001-2002 average)
General Canadian Population (2000)
Age group of mother (years)
Fe
rtili
ty r
ate
pe
r 1
,00
0 fe
ma
les

Percentage of Live Births by Age Group of Mother
03/2015 53
0
5
10
15
20
25
30
35
15-19 20-24 25-29 30-34 35-39 40-44
Age group of mother (years)
Per
cen
tag
e o
f liv
e b
irth
s
First Nations (2001-2002 average)
General Canadian Population (2000)

Crude Mortality Rate
03/2015 54

Age-adjusted Mortality Rate
03/2015 55

Age-specific Mortality Ratio
03/2015 56

Life Expectancy at Birth in Years, by Sex
03/2015 57
70.466.9
60.9
76.574.371.8
75.574.068.0
82.180.879.0
0
10
20
30
40
50
60
70
80
90
1980 1990 2001
Age
(ye
ars)
Registered Indian males Canadian males Registered Indian females Canadian females

Leading Causes of Death (age-standardized)
03/2015 58
0
20
40
60
80
100
120
140
Extern
al Cau
ses o
f Inju
ry
Circul
ator
y dis
ease
s
Neopla
sms
Digesti
ve d
iseas
es
Respi
rato
ry d
iseas
es
Endoc
rine
dise
ases
Infe
ctiou
s an
d pa
rasit
ic
Men
tal a
nd b
ehav
ioura
l diso
rder
s
Genito
urina
ry d
iseas
es
Nervo
us sy
stem
Ag
e-s
tan
da
rdiz
ed
ra
te p
er
10
0,0
00
po
pu
lati
on
First Nations 2001-2002 (average)
General Canadian Population2001-2002 (average)

Potential Years of Life Lost (PYLL)
03/2015 59
8000 6000 4000 2000 0 2000 4000
External causes of injury
Ciculatory diseases
Neoplasms
Digestive diseases
Congenital malformations
Perinatal conditions
Symptoms and ill-defined
Respiratory diseases
Endocrine diseases
Infectious and parasitic
PYLL per 100,000 population
First Nations Canada

6003/2015